Article

A Comprehensive Study of Steel Powders (316L, H13, P20 and 18Ni300) for Their Selective Laser Melting Additive Manufacturing

1
Department of Materials Science and Engineering and Shenzhen Key Laboratory for Additive Manufacturing of High-performance Materials, Southern University of Science and Technology, Shenzhen 518055, China
2
Department of Civil and Environmental Engineering, University of Macau, Macau 999078, China
3
Shanghai Institute of Applied Physics, Chinese Academy of Sciences, Shanghai 201204, China
*
Authors to whom correspondence should be addressed.
Metals 2019, 9(1), 86; https://doi.org/10.3390/met9010086
Submission received: 2 December 2018 / Revised: 10 January 2019 / Accepted: 11 January 2019 / Published: 15 January 2019

Abstract

:
The determination of microstructural details for powder materials is vital for facilitating their selective laser melting (SLM) process. Four widely used steels (316L, H13, P20 and 18Ni300) have been investigated to detail their powders’ microstructures as well as laser absorptivity to understand their SLM processing from raw material perspective. Phase components of these four steel powders were characterized by X-ray diffraction (XRD), synchrotron radiation X-ray diffraction (SR-XRD) and scanning electron microscopy (SEM). X-ray photoelectron spectroscopy (XPS) and transmission electron microscopy (TEM) were utilized to reveal the surface structure of these four steel powders. It is found that phase components of H13, P20 and 18Ni300 are mainly composed of martensite and a small amount of austenite due to the high cooling rate during gas atomization processing, while 316L is characterized by austenite. XPS results show that the four steel powders all possess a layered surface structure, consisting of a thin iron oxide layer at the outmost surface and metal matrix at the inner surface. It is found that the presence of such oxide layer can improve the absorptivity of steel powders and is beneficial for their SLM process.

Graphical Abstract

1. Introduction

Additive manufacturing (AM) attracts increasing attention for its unique processing capabilities. It possesses the advantages of free forming, facilitating structural optimization, allowing customization and realizing intricate structures that can hardly be made by conventional forging or casting processes [1,2]. Among the various AM techniques, selective laser melting (SLM) uses a high energy laser as the heat source to selectively melt pre-deposited powder bed, and is regarded as one of the most advanced & promising AM techniques [3,4]. Its process is characterized by a number of key parameters, including metal powder as raw material, laser beam size and output power, scanning speed, and layer thickness [5].
Metals powders are the raw materials for their SLM process. When a laser light is shined on the surface of the powder bed, a portion of it will be reflected from the surface and the rest will be absorbed by the powder material. The fraction of the incident power that is reflected from the surface is determined by the reflectivity of the material [6]. It is known that the reflectivity of a given material depends on the wavelength of the incident beam and the temperature of the material, as well as the phase constitution and powder surface condition including surface microstructure, chemical composition and oxidation condition [7,8]. Therefore, it is essential to understand the microstructure of powders before the SLM process.
In the present study, the four most widely used steel powders have been selected to study their microstructures (including surface structures) and laser absorptivity for their SLM. These four steels are 316L, H13, P20 and 18Ni300 steels, and they are expected to be applied in fields such as: mold manufacturing [9,10,11]; medical implants [12,13] and engineering structures [14]. For example, 316L is one of the mostly investigated biomedical metals because of its good biocompatibility, high corrosion resistance and moderate mechanical properties [12,15]. It is also expected to be applied in nuclear reactors [16], spacecrafts [17], etc. H13 and P20 is typical hot-work tool steel and plastic die steel, respectively. The H13 steel is mainly used for the production of moulds for die casting processes of aluminum and copper alloys, while the P20 steel is used for the injection molding of plastic products [9,18]. The steel 18Ni300 has tremendous potential for applications in aircraft and aerospace industries and also as tool steel due to its superior mechanical properties, good weldability and machinability [11,19].
Previous relevant studies on metal powders absorptivity are rather limited and few typical studies are summarized here. Tolochko et al. [20] found that the powder particle size distribution did not appear to affect the absorptivity of Ni-based alloy powder. Bertoli et al. [21] experimentally studied and compared the absorptivity of gas-atomized and water-atomized 316L stainless steel powder with different morphologies and chemical compositions of oxygen and nitrogen, as well as the influence of temperature on the absorptivity. It was found that the laser absorptivity of both powders was kept constant with temperature up to 450 °C and water-atomized powder exhibited a slightly higher value of absorptivity by approximately 7.7% than that of gas-atomized powder [21]. However, research studies on the effect of the structure of the metallic powders on the absorptivity were scarce. Rubenchik et al. [22] compared the measured absorptivity of Al powder with the calculated value from the research work by Boley et al. [23] and suggested that the difference between these two values was attributed to the effect of oxide layer at the outside surface without any detailed explanation. Zhou et al. [24] studied the surface structure of gas-atomized high Nb-containing TiAl powder and its effect on the laser energy absorption for selective laser melting. Trapp et al. [25] investigated the effective absorptivity of bare and metal powder-coated discs of 316L, Al1100 and tungsten by calorimetry method. Unfortunately, the microstructures of the aforementioned four steel powders are largely overlooked in the literature. Therefore, for a better understanding and control of the SLM process, it is essential to study and compare the structures of these four steel powders and their effects on the laser-powder interaction.
In the present study, phase components of the four steel powders were characterized by the X-ray diffraction (XRD), synchrotron radiation X-ray diffraction (SR-XRD) and scanning electron microscopy (SEM). The X-ray photoelectron spectroscopy (XPS) depth profile and transmission electron microscopy (TEM) were utilized to study the surface structure of these four steel powders. The absorptivity of powders was analyzed using UV/Vis/NIR spectrometer, and the effect of the microstructures of these four steel powders on the SLM process is also discussed.

2. Materials and Methods

2.1. Materials and SLM Process

The experimental materials used in this investigation were commercially-purchased, argon atomized 316L, H13, P20 and 18Ni300 powders. 316L and H13 powders were purchased from SLM Solutions and Falcon Aerotech Ltd, respectively. P20 and 18Ni300 powders were purchased from Sandvik Osprey Ltd. The chemical composition of these four steel powders was measured using inductively coupled plasma-atomic emission spectrometry (ICP-AES, JY2000-2, Horiba Jobin Yvon, Paris, France) and carbon & sulphur analyzer (LECO-CS744, LECO Corporation, St Joseph, MI, USA). The results of their chemical compositions are listed in Table 1. Their particle sizes were analyzed using the laser particle size analyzer (Mastersizer 3000, Malvern Instruments Ltd., Malvern, UK). The results of their size distributions are shown in Figure 1. In addition, the apparent density and tapped density of the four steels powders were measured using powder tester (BT-1000, Bettersize Instruments Ltd., Dandong, China). The results are presented in Table 2, which indicate excellent flowability of the powders.
10 mm × 10 mm × 10 mm cubes were fabricated for the four steels using an SLM 125 HL machine (SLM Solutions Group AG, Lübeck, Germany). It utilizes an ytterbium fiber laser with a wavelength of 1070 nm and the maximum laser output power of 400 W in a continuous wavelength mode. The laser spot diameter is 64 μm. The corresponding volumetric energy density (VED) is defined by:
V E D = P ν × h × d
where P is laser power (W), v is scanning speed (mm/s), d is layer thickness (μm), and h is hatching distance (μm).

2.2. Characterization of Microstructure

The phase constitution of the four steel powders was investigated using a lab XRD (Rigaku SmartLab, Rigaku Corporation, Tokyo, Japan) equipped with a high flux copper source (9 kW power). SR-XRD experiments were also performed at the beamline BL14B1 of the Shanghai Synchrotron Radiation Facility (SSRF) to confirm the phase constitution. The corresponding wavelength, λ, was set to 1.2398 Å and the detailed information about the beamline BL14B1 can be found in Ref. [26].
The microstructure of the powder was characterized using SEM (Zeiss Merlin, Zeiss Group, Oberkochen, Germany, acceleration voltage 5 kV), equipped with energy dispersive X-ray spectroscopy (EDX). Prior to SEM and EDX analyses, the powder was mounted into resin and then polished and subsequently etched with aqua regia. XPS was used to perform the surface structure analysis by using the PHI X-tool instrument (Φ ULVAC-PHI, INC., Kanagawa, Japan). The analyzed powder was mounted onto a soft aluminum plate by light pressing and irradiated with monochromatized Al Kα X-rays. The analyzed area was about 1.4 × 0.1 mm2, which provided an adequate volume of sample for detailed analysis. The determination of the surface oxide layer thickness and composition depth profiles were done by means of successive ion etching, using Ar ions with etching rate of 3 nm/min as calibrated by a silicon sample with 100 nm thick oxide. In addition, TEM (Tecnai F30, Thermo Fisher Scientific, Waltham, MA, USA, operated at 200 kV) was further utilized to identify the composition and crystal structure of the phase presented on the surface of 316L powder. A sample for TEM investigation was cut from the 316L powder surface with the focused ion beam workstation (FIB, Helios Nanolab 600i, Thermo Fisher Scientific, Waltham, MA, USA).
To evaluate the effect of microstructures on the laser absorptivity of these four steel powders, an UV/Vis/NIR spectrometer (Lambda 950, Perkin Elmer, Waltham, MA, USA) was used. And the as-printed microstructures of the four steels were characterized by the optical microscopy (OM) and by micro-focus computed tomography (micro-CT) using the Diondo D2 machine (Diondo GmbH, Germany) with W radiation at 210 kV and 30 μA.

3. Results

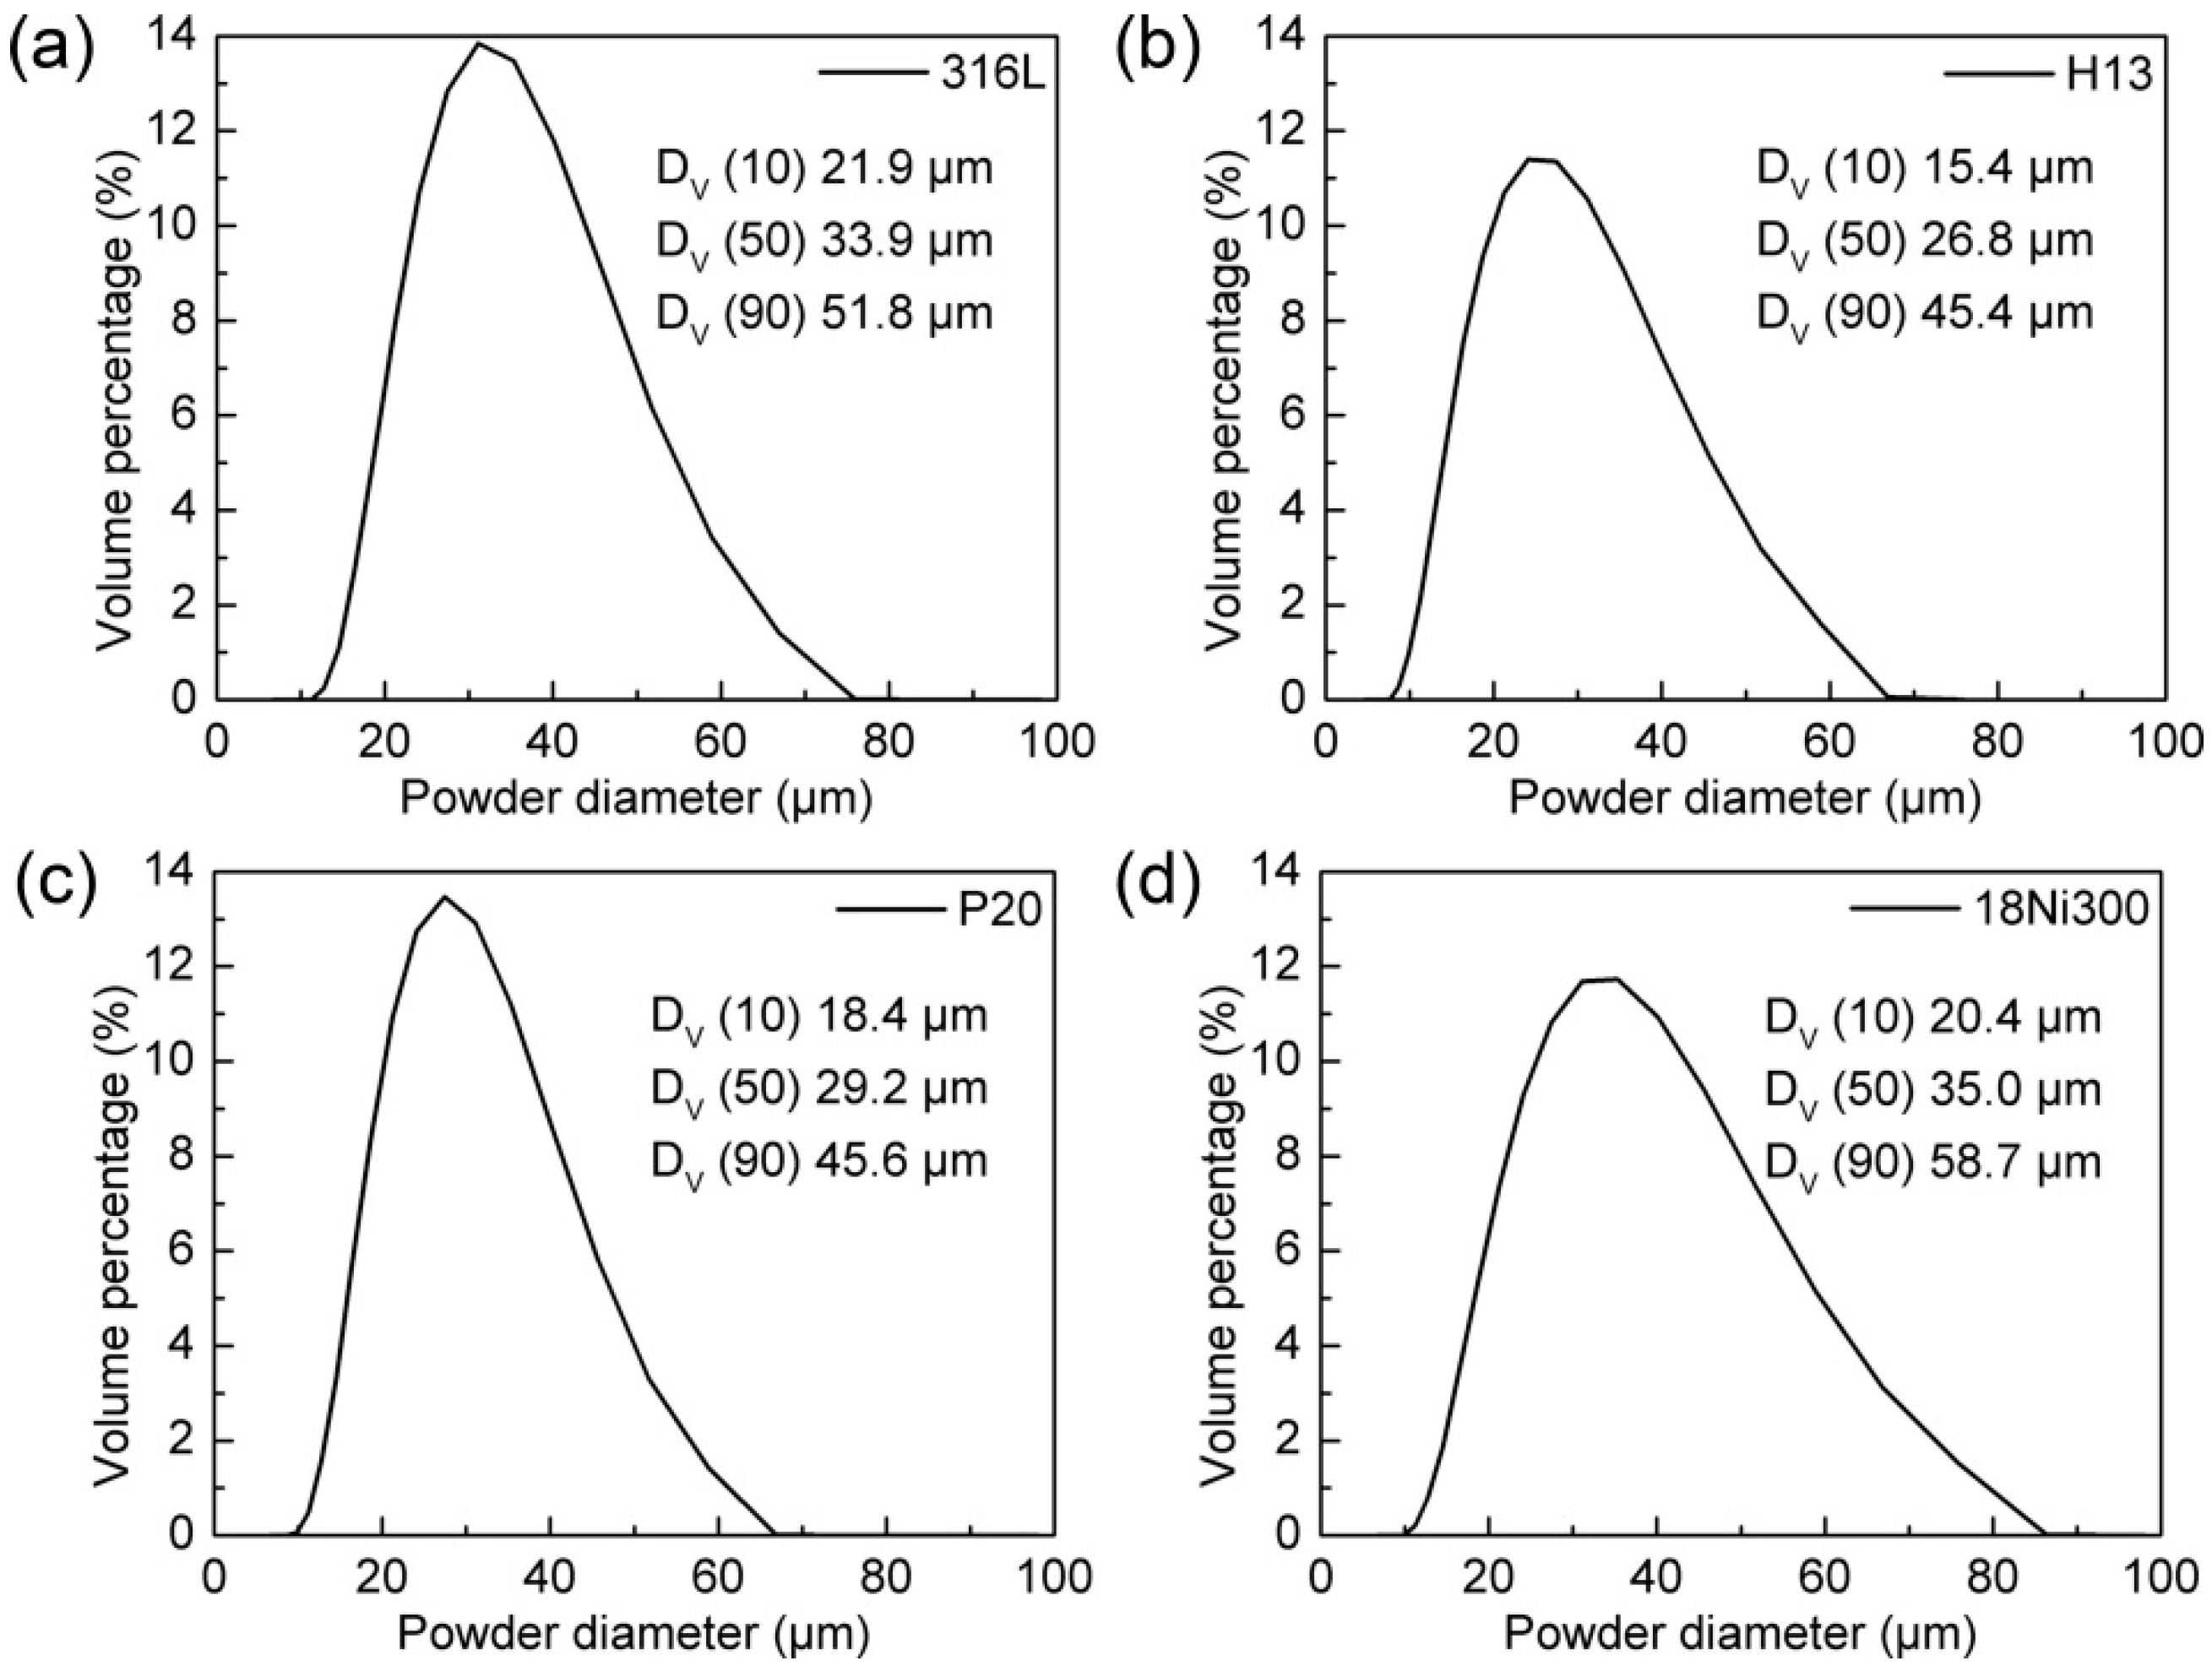
3.1. Phase Analysis of Powders

The XRD patterns of the 316L, H13, P20 and 18Ni300 powders are shown in Figure 2a. The diffraction peaks of the 316L powder correspond to a face-centred cubic structure, indicating that the material consists of the austenitic phase. In contrast, the H13, P20 and 18Ni300 powders show prominent reflections from (110), (200), and (211) and (220) planes of the martensite phase. This may be attributed to the high cooling rate during the gas atomization procedure for the powder production. In addition, it is worth noting that, in these three powders, the refection peak from (111) plane is observable in the XRD patterns, indicating that a small amount of austenite phase is also present in the microstructure.
SR-XRD experiments were performed to further identify the phase constitution for the four powders. SR-XRD patterns between the values of 2θ = 5–47.5° were collected continuously over 15 minutes for each powder. The SR-XRD patterns results are shown in Figure 2b. For the 316L powder, the pattern reveals that only austenite phase is detectable. For the other three powders, they have similar SR-XRD results, suggesting the martensite as the main phase, together with a small amount of austenite. This is consistent with the lab XRD results. No oxide phases are detectable by SR-XRD, which is likely due to the reason that the powder surface oxide is too thin to give strong enough XRD signals.

3.2. Cross-Sectional Microstructures of the Steel Powders

SEM and EDX analyses were performed on the four steel powders to investigate the microstructure as well as the presence of any surface oxide. Figure 3 presents the SEM-SE results of the cross section of four steel powders as well as EDX line scanning results. For the 316L powder, it reveals a typical equiaxed morphology with grain size of 2~3 μm (shown in Figure 3a). It is noted that there is an increase in the oxygen concentration at the edge of the powder, as shown in Figure 3b, suggesting that the oxide layer exists in the outmost surface of the powder. Figure 3c,e,g reveals the cross-sectional images of H13, P20 and 18Ni300, respectively. The following features are notable: (a) these three steel powders show similar equiaxed grain structure composing of acicular martensite and (b) there also exists a significant oxygen concentration at the edge of these three steel powders.

3.3. Surface Structures of the Steel Powders

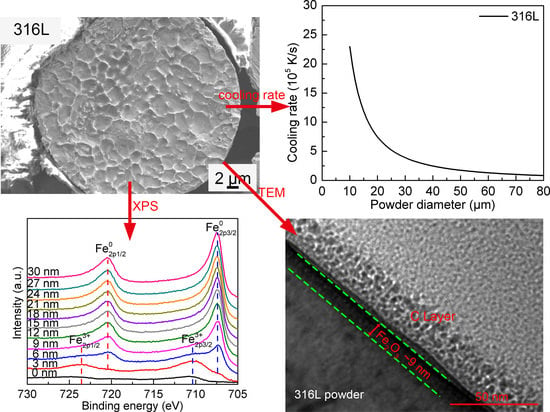
3.3.1. The 316L Steel Powder

Figure 4a shows the XPS survey spectrum obtained from the surface of 316L powder particles in the as-received state. The expected peaks of metal elements such as Fe, Cr, Mn, Ni and Mo along with O and C elements are observable. The Si peak is not detectable, possibly due to its low concentration in the 316L powder. The detected C 1s mainly originates from contaminants on the surface, because the intensity of the C signal decreases drastically after etching, as shown in Figure 4b which presents the elemental concentration vs. etch depth.
It is known that the binding energy of the emitted photoelectrons and the resultant peak position of the recorded XPS signal depend on the chemical state of an element. High-resolution XPS fine scans were conducted to identify the chemical states of the elements; C1s (284.8 eV) peak was used to calibrate the results obtained. Figure 5 shows the XPS high-resolution spectra for Fe, Cr, Mn, Ni and Mo in the as-received state versus those sputtered up to 30 nm. It can be identified that Fe3+ state (2p3/2 and 2p1/2 peak positions at 710.7 and 724.3 eV, respectively) is present without any signal of Fe2+ at the outmost surface of the as-received powder, which is consistent with results from Ref. [27]. At the etch depth of 3 nm, the peak of iron oxide seems to shift to the binding energy of metallic iron. After etching to 6 nm, the significant right shift of the Fe peak reveals the appearance of metallic iron. It is notable that there is only metallic iron after etching to 9 nm, indicating the full removal of iron oxide and the thickness of the iron oxide layer is no more than 9 nm.
The chemical state of Cr changes in a similar way to Fe. It is oxidized at the outmost surface, as shown in Figure 5b (Cr3+ cation, 2p3/2 and 2p1/2 peak positions at 576.2 and 585.9 eV, respectively). The fine scan reveals that Cr is still in the oxide state after etching to 3 nm and partly in the metallic state at etching depths of 6 nm and 9 nm. After 12 nm depth, Cr changes from its oxide state into metallic state Cr0.
The peaks of Mn with binding energy of 641.5 eV and 653.2 eV indicate that Mn is completely oxidized on the powder surface. It is difficult to distinguish among the different oxides namely MnO, Mn2O3 and MnO2 due to the small energy difference between them [28]. The presence of satellite peak at about 647 eV (see the inserted image in Figure 5c), however, enables us to propose the presence of MnO oxide. In addition, a further comparison in the standard free energy of formation of these manganese oxides also suggests the preference of MnO over Mn2O3 and MnO2 since the former has much larger negative free energy of formation [29].
XPS results show that there seems no Ni at the outmost of the as-received powder as shown in Figure 5d. After etching to 3 nm, the signal of Ni is verified in metallic state by the satellite peak (859.2 eV) of metallic Ni0 as shown in the inserted image in Figure 5d. Mo exists in the form of metallic state throughout the 316L powder but does not appear at the outmost surface. It suggests that Mo element does not react with oxygen during gas atomization. This may be attributed to its low affinity to oxygen and/or to its low diffusion rate.
After the detailed XPS analysis, TEM was applied to the 316L powder to further identify the surface structure. Figure 6a shows the TEM bright-field (TEM-BF) image of the surface structure. There exists a layer structure of ~9 nm thickness at the outmost surface of the powder. Figure 6b presents the corresponding selected area electron diffraction (SAED) pattern for the areas marked by the green lines in Figure 6a, based on which the Fe2O3 phase is identified. The result is in consistence with the aforementioned XPS results.

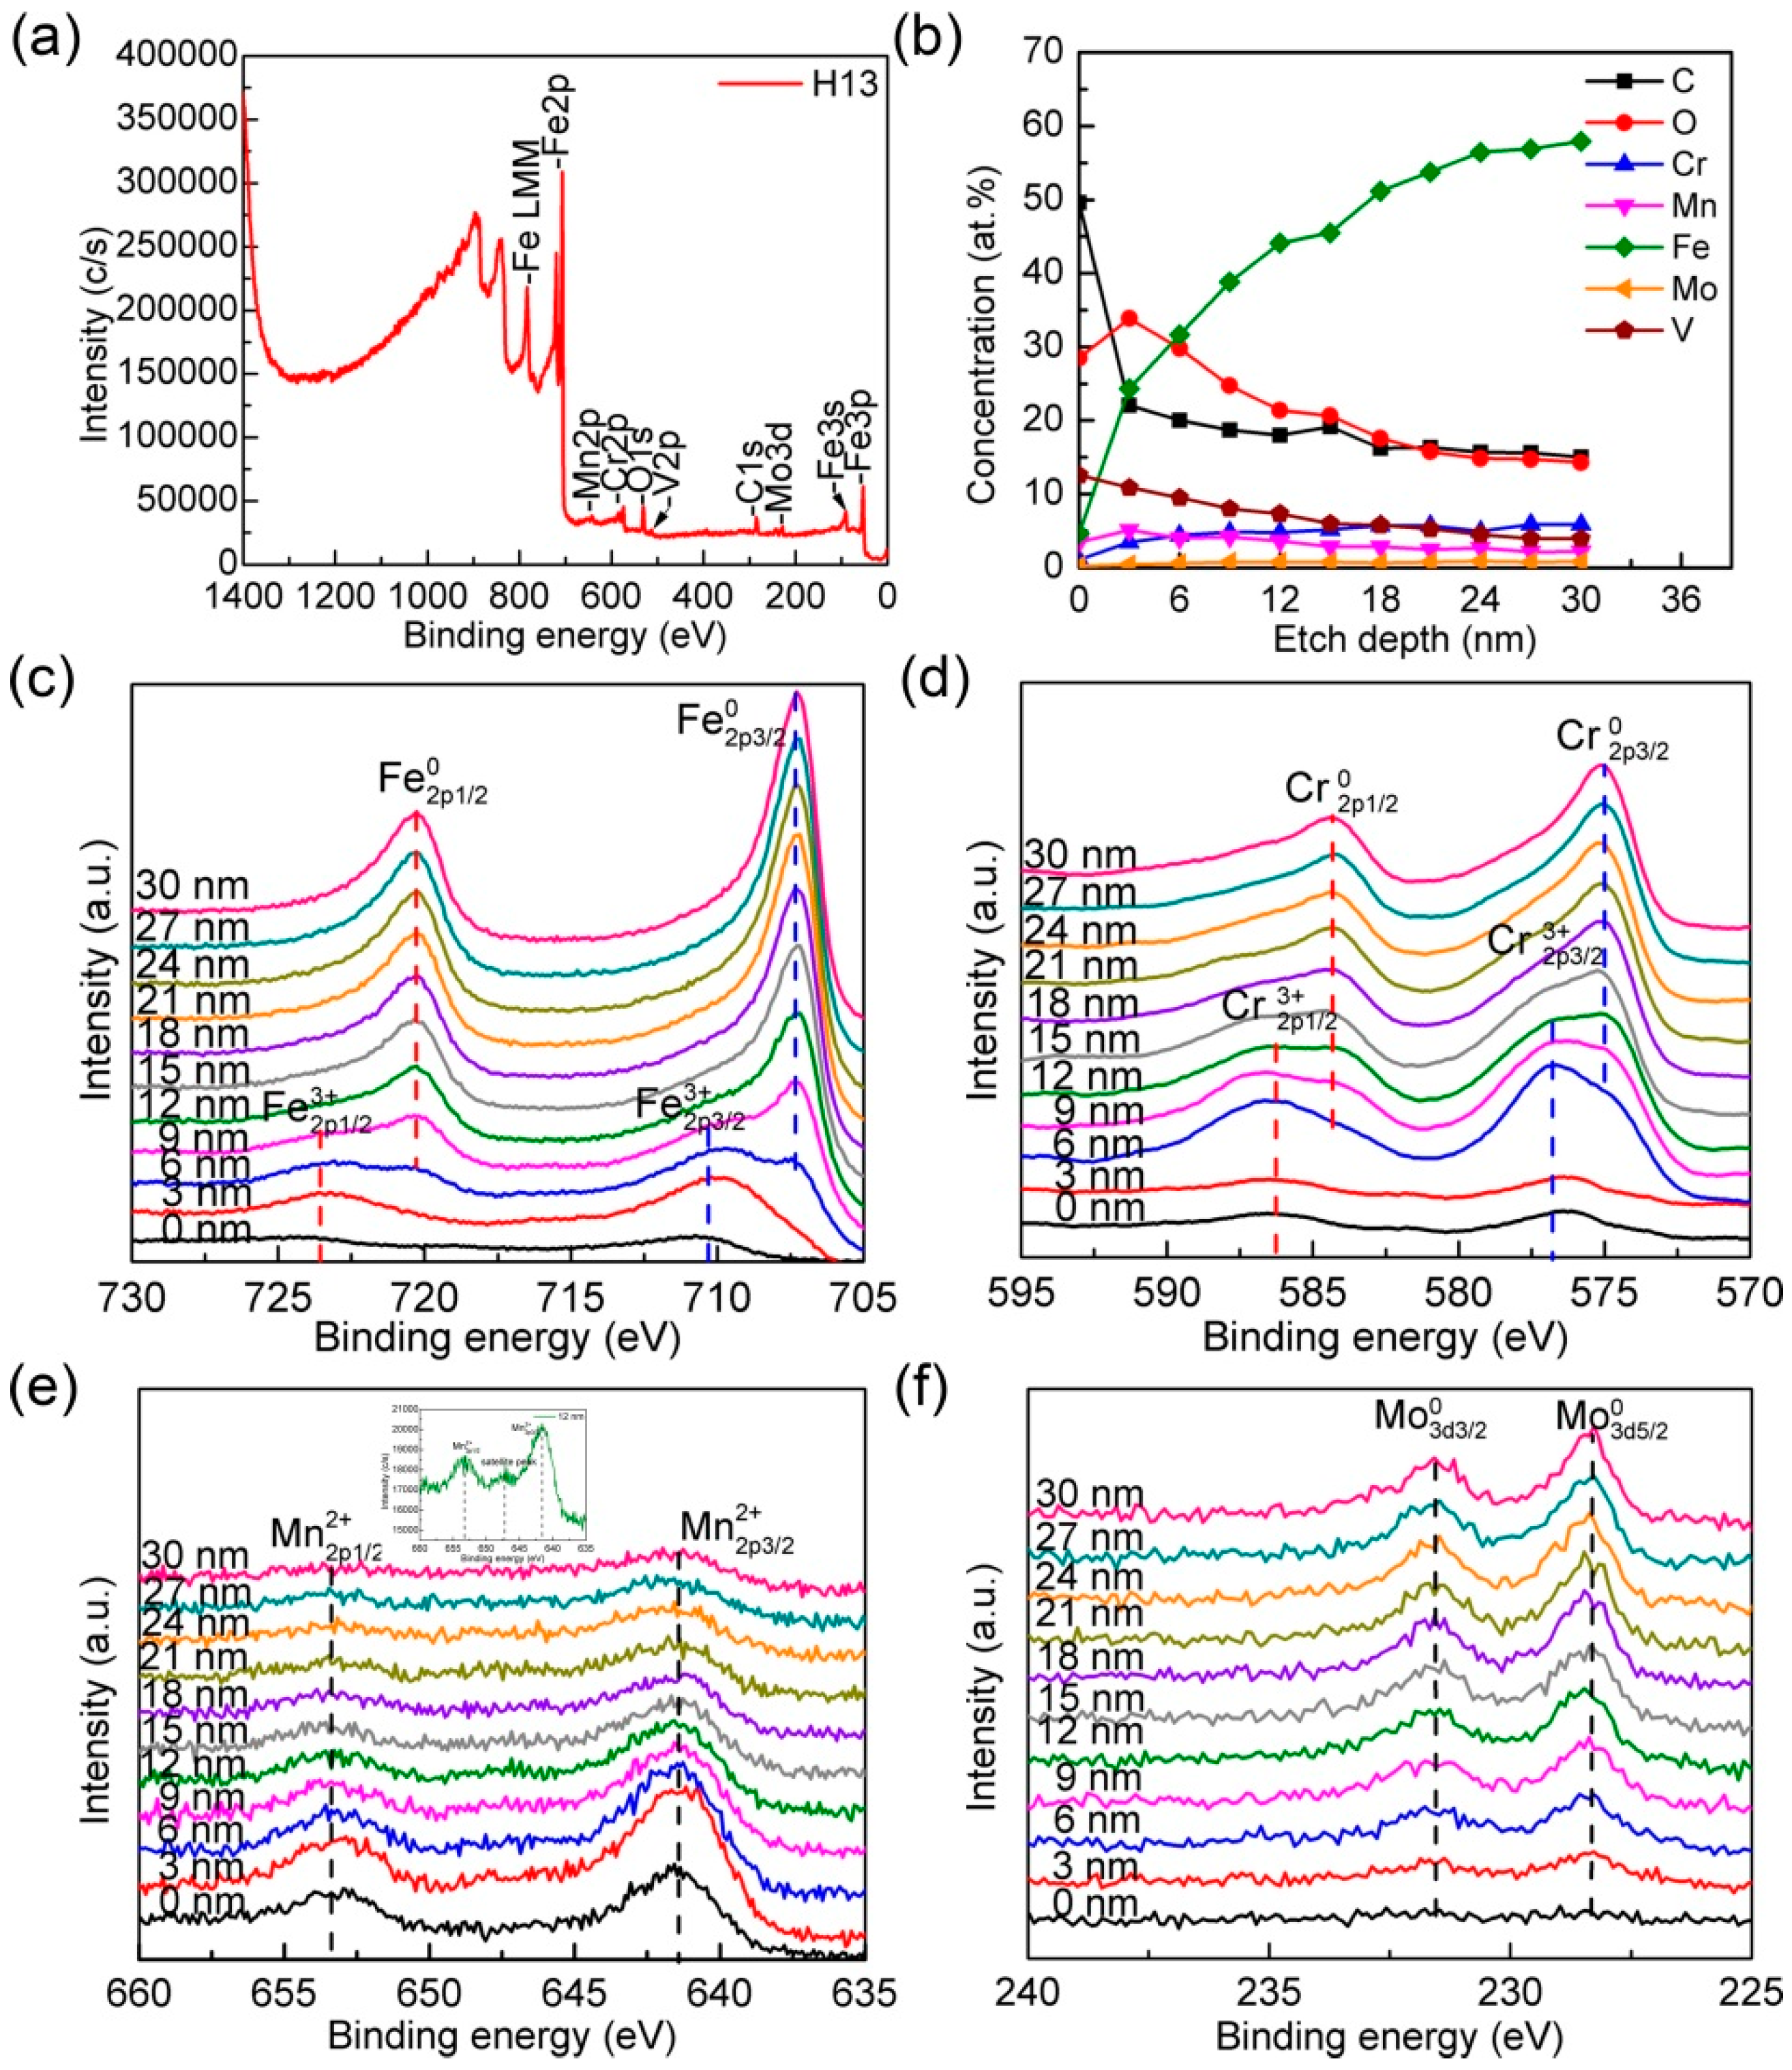
3.3.2. The H13 Steel Powder

Similar to the analysis of the 316L steel powder, Figure A1a in the Appendix illustrates the XPS survey spectrum recorded from the H13 powder. Fe, Cr, Mn, Mo and V and nonmetallic elements including O and C were detected from the surface. Figure A1c–f present the corresponding high-resolution fine scans. The following can be concluded for the H13 steel powder while the detailed analysis will be omitted:
  • Fe is present in the form of oxide at the surface of H13 and as the mixture of oxide and metal after etching up to 9 nm.
  • Cr is present in oxide as Cr3+ from the outmost surface to the etching depth of 3 nm. From the depth of 6 nm to 15 nm, oxide Cr coexists with metallic Cr. Above the etch depth of 18 nm, only metallic chromium Cr0 is detectable.
  • In the case of Mn, only manganese oxide is detected in the surface of H13, which is likely due to the high affinity of manganese to oxygen.
  • For Mo, only metallic peaks are identified in the surface of the H13 powder.

3.3.3. The P20 Steel Powder

Figure A2a presents the XPS survey spectrum from the surface of P20 powder. Detailed high-resolution spectra of these metallic elements are shown in Figure A2c–f. The following can be concluded for the P20 steel powder:
  • The peaks of the Fe can be fitted into Fe3+ below the ion etching to the level of 3 nm and into metallic Fe after ion etching to the depth of 12 nm.
  • For Cr, it can be deconvoluted into the Cr3+ from the outmost surface to etch depth of 6 nm, and into mixture of Cr3+ and Cr0 for 9 nm to 12 nm, and into metallic Cr0 only above etch depth of 15 nm.
  • The chemical state of Mn in P20 remains as oxide.
  • Mo in the P20 steel powder exists in the form of metallic state.

3.3.4. The 18Ni300 Steel Powder

Figure A3a shows the XPS survey spectrum of the 18Ni300 powder and indicates the presence of Fe, Ni, Co, Ti, Mo, etc. Figure A3c–f provide the detailed high-resolution spectra of the main metallic elements. The following can be concluded for the 18Ni300 steel powder:
  • From the peaks of Fe, it can be found that the outmost surface is covered by oxide. Metallic Fe starts to appear at the etch depth of 3 nm, while metallic Fe0 is the majority at 6 nm etch depth. The peaks can only be fitted into metallic Fe0 when the etch depth is greater than 9 nm, representing fully removal of iron oxide.
  • According to the characteristic of satellite peaks (at 858 eV), Ni is identified in the form of metallic state in the surface of the 18Ni300 powder.
From the above XPS analysis, the surface structures of the four steel powders are revealed and some of the key facts are summarized as follows:
The peaks of all oxide signals decrease with the increasing etch depth. The presence of chromium oxide and manganese oxide in 316L, H13, P20 and 18Ni300 powder even after the fully removal of iron oxide proved that the iron oxide is present in a layer more close to the surface, while Mn and Cr oxides may exist as an oxide particles till a deeper layer of the powder surface [29].
The thickness of the continuous surface iron oxide layer can be estimated from the variation with the etch depth of the intensity of the iron metallic peak normalized to its intensity in the bulk. For reference, the peak intensity of the metallic Fe at 30 nm was chosen as the bulk intensity. The intensity of the metallic Fe at every etch depth was obtained by extracting the metallic intensity peak from the intensity of superimposed peaks of Fe taken from high-resolution fine scans shown in Figure 5a, Figure A1c, Figure A2c and Figure A3c, respectively. From the spherical nature of all powders, the thickness of the continuous iron oxide layer can be approximated at the etch depth where the normalized metal intensity ration is 65% [27,28,29,30]. Figure 7 presents the variation of relative intensities of metallic Fe with the etch depth. It can be seen that the thickness of the Fe2O3 oxide layer obtained in these four steel powders is close to each other, about 9 nm.

3.4. Absorption Spectroscopy Results and SLM Processing Trials

The reflectivity of 316L, H13, P20 and 18Ni300 powders was determined by the UV/Vis/NIR Spectrometer experiment, and the results are shown in Figure 8. It can be seen that the reflectivity of the four steel powders is all about 0.4 at the wavelength of 1070 nm, which is the wavelength of the SLM machine used in this study.
The SLM process of the four steels was conducted and the optimized SLM processing parameters are summarized in Table 3. The optical microscopy (OM) images of the cross sections of these four steels are shown in Figure 9a–d, presenting low porosity. The relative densities of the as-printed samples were determined by Archimedes’s method and the results are shown in Table 3. The energy densities for SLM processing of H13, P20 and 18Ni300 are close to each other and they are higher than that of the 316L austenite steel. This can be due to the fact that the 316L steel has the lowest melting point and the highest tapped and apparent densities among these four steels [31]. In addition, to further estimate the size and spatial distributions of pores in the as-printed specimen, the 18Ni300 sample was observed using the X-ray micro-CT. The result is shown in Figure 9e. It can be calculated that the as-printed sample possesses very low porosity and most of the pores are in the range of 10~30 μm for 18Ni300 sample.

4. Discussion

4.1. Relationship between Cooling Rate and Martensite Formation in the Steel Powders

Assuming that the heat transfer between a spherical liquid droplet and gas medium during gas-atomization is controlled by convective heat transfer, the cooling rate of a spherical droplet can be estimated by the following formula [32,33]:
d T d t = 6 h ρ d C l D ( T d T e )
where Td is the temperature of the droplets (Td = 1672 K for 316L) [34], Te is the temperature of environment (298 K), t is the time (s), Cl is the specific heat of droplets (considered to be 742 J/kg/K for 316L) [35], ρd is the droplet density (6240 kg/m3 for 316L) [36], D is the droplet diameter and h is the coefficient of heat transfer that has been determined by droplet diameter and argon atmosphere [33,36].
Figure 10 plots the calculated cooling rate for the 316L powder as a function of the droplet diameter when Ar is used as the atomization medium. It can be seen that the cooling rate during gas atomization is in the order of ~105–106 K/s, consistent with previous research by Si et al. [37]. It can be further proposed that the cooling rate for all the four steel powders is in the same order, since there is a little difference for these above parameters that are used to calculate the cooling rate for the four steel powders. Under such high cooling rate, nonequilibrium phases like the martensite phase can form. Meanwhile, the martensite starting temperature (Ms) and martensite final temperature (Mf) of the H13, P20 and 18Ni300 steels are higher than room temperature, while the Ms of 316L is about −269.15 °C [38,39,40]. These explain the reason why the martensite phase in the H13, P20 and 18Ni300 steels has been observed as the main component while the main phase for the 316L steel is the austenite.

4.2. Discussion on the Surface Structure of the Steel Powders

The chemical composition and the thickness of surface oxide on the 316L, H13, P20 and 18Ni300 powders have been investigated by XPS and TEM. For all powders, the surface shows a heterogeneous structure consisting of a thin Fe oxide surface layer with particulate compounds formed by elements which have high affinity to oxygen (such as Cr and Mn). Regarding the specific composition of these oxides, some studies suggest that the oxide is a multi-element compound such as Mn2SiO4 or MnSiO3 instead of simple MnO or SiO2 oxide [41]. However, the facts observed by this study are: (a) the iron oxide signal is completely removed after etching to 9 nm from the outmost surface, while manganese is still present in oxide state at all depths and (b) chromium oxide is almost disappeared at an intermediate depth. These findings suggest that the presence of simple oxides as MnO and Cr2O3, in consistence with results from [27].
On the other hand, regarding the oxide phases existing on the surface layer of the four steel powders, the main reason lies in the fact the composing elements like Cr has great affinity to oxygen and meanwhile it is almost unavoidable to have a certain level of oxygen during the e.g. gas atomization procedure or other powder handling procedures such as powder sieving and/or storage. It has been suggested that the partial pressure of O2 in the gas atomization chamber can be up to 100 ppm even protected by the high purity inert atmosphere [42]. According to the Ellingham–Richardson diagram [43], at the temperature of 1250 °C the equilibrium partial pressure of oxygen for manganese, chromium and iron must be less than 10−25, 10−22 and 10−14 atm, respectively, in order to prevent the oxidation reaction. These suggest that some degrees of oxidation cannot be avoided during gas atomization. Meanwhile, the oxygen in the atomizer chamber will facilitate the formation of particulate oxide particles containing the elements with higher affinity to oxygen, while from the thermodynamics perspective the stability of oxides increases in the line of Fe2O3 → Cr2O3 → MnO [29,43].
Meanwhile, XPS results suggest that MnO exists to a layer thickness of up to 30 nm, while Cr2O3 is smaller than 30 nm. This is likely caused by the different diffusion rates of these two elements, as the growth rate of oxide at high temperatures is controlled by the diffusion rate of metal elements such as Mn or Cr [44]. The diffusivity of Cr and Mn at 1473 K in 316L is 2.71×10⁻¹³ m2/s and 5.4×10⁻¹³ m2/s, respectively [45,46]. Therefore, it can be argued that the growth rate of Cr2O3 is slower than the MnO oxide because of the lower diffusivity of Cr, which explains that the existence depth of MnO is larger than the Cr-containing oxide.

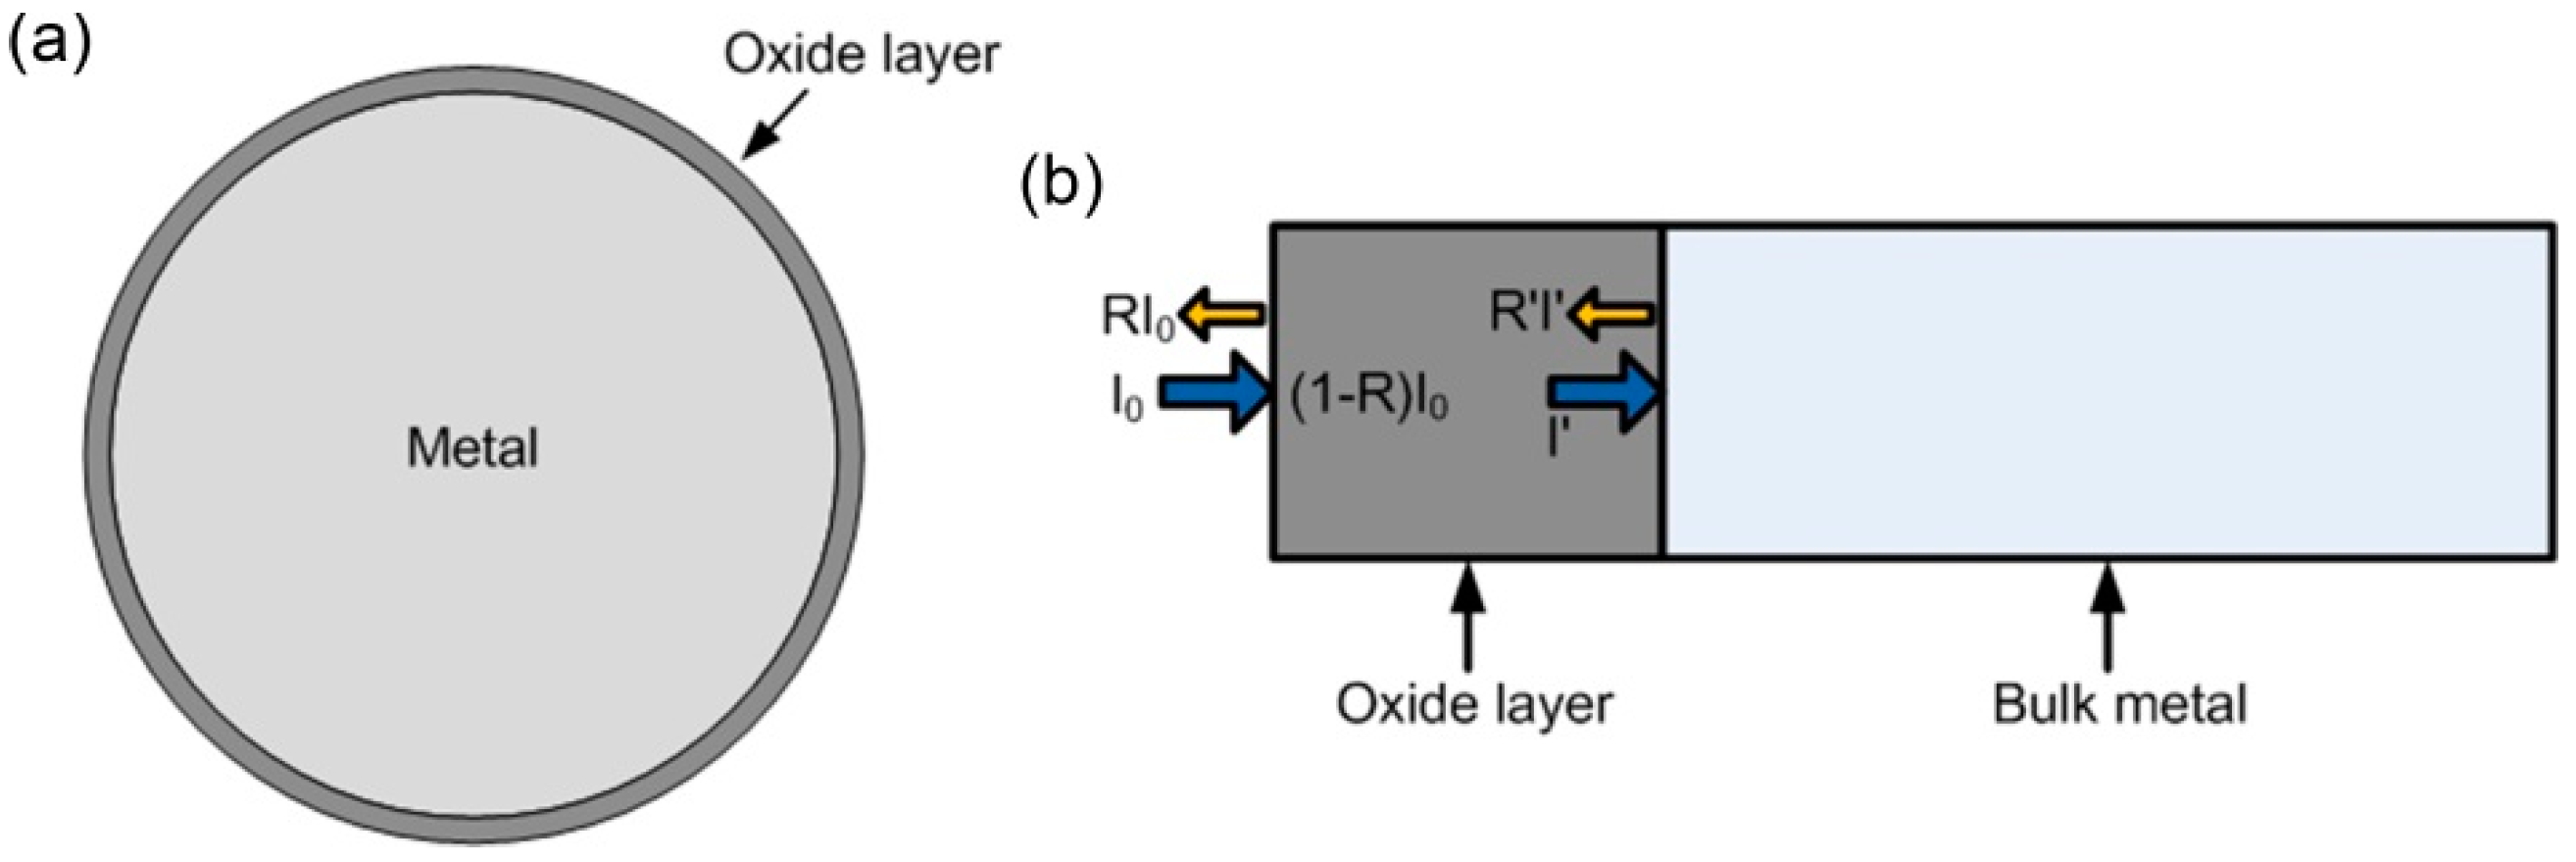
4.3. Effect of the Surface Oxide Layers on Laser Absorption

The effects of the surface oxide layer on the laser-material interaction can be discussed as follows:

4.3.1. The Existence of Oxides Does Not Impede the Radiation of the Laser Beam on the Metal Matrix

According to XPS, TEM and SEM results, it is concluded that the surface structure of the four steel powders is composed of oxide layer at the outer surface and metal matrix at the inner surface. A simplified model presenting the surface structure of the powder is proposed [47], as shown in Figure 11a. It should be pointed out that because of their low concentrations, the oxide particulates such as Cr2O3 and MnO are not presented in the model. When the laser irradiates on the powder bed, a part of it will be reflected, another part of it will be absorbed by the surface oxide film, and the rest of it will be absorbed or reflected by the metal matrix (see Figure 11b for an illustration). The absorbed laser penetrates through the powder and the intensity I decays exponentially with the depth z according to the Beer–Lambert law:
I ( z ) = I exp ( 4 π k d λ )
where I is the intensity just inside the surface after considering the reflection loss and is equal to (1 − R) × I0 as shown in Figure 11b. k is the extinction coefficient at a given laser wavelength λ.
It can be calculated that the intensity of the laser almost does not decay across the oxide layer because of the small extinction coefficient of Fe2O3. The calculated penetration depth across the metal matrix is on the order of 30 nm, which is in consistence with the results from [6]. Therefore, a conclusion can be obtained from the above discussion as follows: The existence of the oxide layer at the outermost surface of powder does not significantly block the penetration of the laser into the steel powder matrix.

4.3.2. The Existence of the Surface Oxide Layers Enhances the Laser Absorptivity of the Four Steel Powders

To calculate the effect of the surface structure on the laser absorption of metallic powders, the reflectivity of the pure alloys was firstly determined by UV/Vis/NIR Spectrometer experiment. For the four alloys, the results of the reflectivity at the wavelength of 1070 nm are presented in the Table 4.
The absorptivity of materials covered by the oxide layer can be calculated by using the theory of multilayers reflection. The calculation formula of the reflectivity, r, between two media is [24]:
r = ( n 2 n 1 ) 2 + ( k 2 k 1 ) 2 ( n 2 + n 1 ) 2 + ( k 2 + k 1 ) 2
where n and k are the refractive index and extinction coefficient, respectively; the subscript 1 and 2 represent two different media.
Considering the oxide layer effect, the total reflectivity of powder is [24]:
R = r 1 + r 2 ( 1 r 1 ) 2 exp ( 2 α i d i ) 1 r 1 r 2 exp ( 2 α i d i )
where r1 is the laser reflectivity between Fe2O3 and air; r2 is the laser reflectivity between Fe2O3 and Fe bulk; αi = 4πki and di are the absorption coefficient and thickness of oxide layer, respectively; and i represents the oxide layer species, namely Fe2O3 in this study; ki is the extinction coefficient for a given laser wavelength λ. When λ is 1070 nm, n = 2.753 and k = 0.011 for the Fe2O3 oxide; and n = 2.9613 and k = 4.0133 for Fe [48].
Meanwhile, the total laser absorptivity, A, of the single powder is:
A = 1 R
the laser absorptivity of the powder without considering the oxide layer can be calculated based on Equation (6) and the measured reflectivity for the pure alloys, while the laser absorptivity of the powder considering the effect of oxide layer at the 1070 nm wavelength can be calculated using Equations (4)–(6). The results are summarized in Table 4 and it can be found that the results are consistent with that obtained from the UV/Vis/NIR Spectrometer experimental tests. In addition, it can be concluded that the presence of the oxide layer at the outer surface enhances the absorptivity of powders. This inspires us that the materials with low laser absorptivity, such as Cu alloys and Al alloys can be developed with a certain thickness of surface oxide layer by micro-alloying or heat treatment so as to be processed by SLM technology feasibly. However, it should be noted that, too much oxide materials should be detrimental for at least three reasons: (a) they may form inclusions in the as-printed microstructure; (b) once decomposed into atomic oxygen and got diffused into alloy matrix, they may reduce ductility (e.g., in the case of oxygen-sensitive Ti–6Al–4V); and/or (c) they may help to exceed the allowed limit on oxygen and therefore be against the corresponding international standard/specification [49,50]. Last but not least, it should be noted that in the simplified model, the porosities/vacancies between powders have not been considered and the porosities may slightly increase the laser absorptivity of powder bed [51].

5. Conclusions

In the present study, a variety of analytical techniques, including XPS, TEM and SR-XRD, have been utilized for the characterization and understanding of the microstructure and surface structure of four important steel powders (316L, H13, P20 and 18Ni300). The following conclusions can be drawn:
(1)
The phase of H13, P20 and 18Ni300 mainly consists of martensite and a small amount of austenite due to the high cooling rate (in the range of 105–106 K/s) during gas atomization processing, while 316L is composed of austenite phase.
(2)
Surfaces of these four steel powders are covered by heterogeneous oxides, composed of a thin continuous Fe2O3 layer with a thickness of about 9 nm and particulate particles of thermodynamically stable oxides (MnO, Cr2O3).
(3)
The measured absorptivity of these four steel powders is basically consistent with that calculated through the simplified model with considering the effect of oxide layer at the outer surface of powders.
(4)
The presence of the oxide layer on the powder surface does not impede the radiation of laser beam on the metal matrix. It can enhance the laser absorptivity of these four steel powders.

Author Contributions

J.Y., Y.Z., and R.G. carried out the experiments and analyzed the raw data under the guidance of W.-M.Q. and M.Y. and X.Z. contributed to discussion of the results obtained; and W.-M.Q. and M.Y. proposed the study and finalized the manuscript.

Funding

This research was supported by Shenzhen Science and Technology Innovation Commission [grant number ZDSYS201703031748354], and Science and Technology Planning Project of Guangdong Province of China [grant number 2017B090911003], as well as a grant from the Fundo para o Desenvolvimento das Ciências e da Tecnologia (FDCT) of the Macao S.A.R. (Project No. 129/2014/A3).

Acknowledgments

The authors acknowledge the support from the Pico Center at SUSTech and the Presidential fund at SUSTech and Development and Reform Commission of Shenzhen Municipality.

Conflicts of Interest

The authors declare no conflict of interest.

Appendix A

Figure A1. (a) XPS survey spectrum and (b) depth profile analyses of element concentrations, and detailed XPS spectra of (c) Fe, (d) Cr, (e) Mn and (f) Mo on the surface of H13 powders in the as-received state and after ion etching up to 30 nm.
Metals 09 00086 g0a1
Figure A2. (a) XPS survey spectrum and (b) depth profile analyses of element concentrations, and detailed XPS spectra of (c) Fe, (d) Cr, (e) Mn and (f) Mo on the surface of P20 powders in the as-received state and after ion etching up to 30 nm.
Metals 09 00086 g0a2
Figure A3. (a) XPS survey spectrum and (b) depth profile analyses of element concentrations, and detailed XPS spectra of (c) Fe, (d) Ni, (e) Mo and (f) Co on the surface of 18Ni300 powders in the as-received state and after ion etching up to 30 nm.
Metals 09 00086 g0a3

References

  1. Murr, L.E.; Gaytan, S.M.; Ramirez, D.A.; Martinez, E.; Hernandez, J.; Amato, K.N.; Shindo, P.W.; Medina, F.R.; Wicker, R.B. Metal Fabrication by Additive Manufacturing Using Laser and Electron Beam Melting Technologies. J. Mater. Sci. Technol. 2012, 28, 1–14. [Google Scholar] [CrossRef]
  2. Onal, E.; Frith, J.E.; Jurg, M.; Wu, X.H.; Molotnikov, A. Mechanical properties and in vitro behavior of additively manufactured and functionally graded Ti6Al4V porous scaffolds. Metals 2018, 8, 200. [Google Scholar] [CrossRef]
  3. Hebert, R.J. Viewpoint: Metallurgical aspects of powder bed metal additive manufacturing. J. Mater. Sci. 2016, 51, 1165–1175. [Google Scholar] [CrossRef]
  4. Luo, J.P.; Jia, X.; Gu, R.N.; Zhou, P.; Huang, Y.J.; Sun, J.F.; Yan, M. 316L stainless steel manufactured by selective laser melting and its biocompatibility with or without hydroxyapatite coating. Metals 2018, 8, 548. [Google Scholar] [CrossRef]
  5. Lu, Y.J.; Ren, L.; Wu, S.Q.; Yang, C.G.; Lin, W.L.; Xiao, S.L.; Yang, Y.; Yang, K.; Lin, J.X. CoCrWCu alloy with antibacterial activity fabricated by selective laser melting: Densification, mechanical properties and microstructural analysis. Powder Technol. 2018, 325, 289–300. [Google Scholar] [CrossRef]
  6. Brown, M.S.; Arnold, C.B. Fundamentals of laser-material interaction and application to multiscale surface modification. In Laser Precision Microfabrication; Sugioka, K., Meunier, M., Piqué, A., Eds.; Springer: Berlin/Heidelberg, Germany, 2010; pp. 91–120. [Google Scholar]
  7. Heller, J.; Bartha, J.W.; Poon, C.C.; Tam, A.C. Temperature dependence of the reflectivity of silicon with surface oxide at wavelengths of 633 and 1047 nm. Appl. Phys. Lett. 1999, 75, 43–45. [Google Scholar] [CrossRef]
  8. Rubenchik, A.M.; Wu, S.S.Q.; Kanz, V.K.; LeBlanc, M.M.; Lowdermilk, W.H.; Rotter, M.D.; Stanley, J.R. Temperature-dependent 780-nm laser absorption by engineering grade aluminum, titanium, and steel alloy surfaces. Opt. Eng. 2014, 53, 122506:1–122506:8. [Google Scholar] [CrossRef]
  9. Mazur, M.; Brincat, P.; Leary, M.; Brandt, M. Numerical and experimental evaluation of a conformally cooled H13 steel injection mould manufactured with selective laser melting. Int. J. Adv. Manuf. Technol. 2017, 93, 881–900. [Google Scholar] [CrossRef]
  10. Yan, J.J.; Zheng, D.L.; Li, H.X.; Jia, X.; Sun, J.F.; Li, Y.L.; Qian, M.; Yan, M. Selective laser melting of H13: Microstructure and residual stress. J. Mater. Sci. 2017, 52, 12476–12485. [Google Scholar] [CrossRef]
  11. Casalino, G.; Campanelli, S.L.; Contuzzi, N.; Ludovico, A.D. Experimental investigation and statistical optimisation of the selective laser melting process of a maraging steel. Opt. Laser Technol. 2015, 65, 151–158. [Google Scholar] [CrossRef]
  12. Bartolomeu, F.; Buciumeanu, M.; Pinto, E.; Alves, N.; Carvalho, O.; Silva, F.S.; Miranda, G. 316L stainless steel mechanical and tribological behavior—A comparison between selective laser melting, hot pressing and conventional casting. Addit. Manuf. 2017, 16, 81–89. [Google Scholar] [CrossRef]
  13. Kong, D.C.; Ni, X.Q.; Dong, C.F.; Lei, X.W.; Zhang, L.; Man, C.; Yao, J.Z.; Cheng, X.Q.; Li, X.G. Bio-functional and anti-corrosive 3D printing 316L stainless steel fabricated by selective laser melting. Mater. Des. 2018, 152, 88–101. [Google Scholar] [CrossRef]
  14. Buchanan, C.; Matilainen, V.P.; Salminen, A.; Gardner, L. Structural performance of additive manufactured metallic material and cross-sections. J. Constr. Steel Res. 2017, 136, 35–48. [Google Scholar] [CrossRef] [Green Version]
  15. Capek, J.; Machova, M.; Fousova, M.; Kubásek, J.; Vojtěch, D.; Fojt, J.; Jablonská, E.; Lipov, J.; Ruml, T. Highly porous, low elastic modulus 316L stainless steel scaffold prepared by selective laser melting. Mater. Sci. Eng. C 2016, 69, 631–639. [Google Scholar] [CrossRef] [PubMed]
  16. Zhong, Y.; Rännar, L.E.; Wikman, S.; Koptyug, A.; Liu, L.F.; Cui, D.Q.; Shen, Z.J. Additive manufacturing of ITER first wall panel parts by two approaches: Selective laser melting and electron beam melting. Fusion Eng. Des. 2017, 116, 24–33. [Google Scholar] [CrossRef]
  17. Romei, F.; Grubišić, A.N.; Gibbon, D. Manufacturing of a high-temperature resistojet heat exchanger by selective laser melting. Acta Astronaut. 2017, 138, 356–368. [Google Scholar] [CrossRef] [Green Version]
  18. Jhavar, S.; Jain, N.K.; Paul, C.P. Development of micro-plasma transferred arc (μ-PTA) wire deposition process for additive layer manufacturing applications. J. Mater. Process. Technol. 2014, 214, 1102–1110. [Google Scholar] [CrossRef]
  19. Kempen, K.; Yasa, E.; Thijs, L.; Kruth, J.P.; Van Humbeeck, J. Microstructure and mechanical properties of Selective Laser Melted 18Ni-300 steel. Phys. Procedia 2011, 12, 255–263. [Google Scholar] [CrossRef] [Green Version]
  20. Tolochko, N.K.; Khlopkov, Y.V.; Mozzharov, S.E.; Titov, V.I.; Ignatiev, M.B. Absorptance of powder materials suitable for laser sintering. Rapid Prototyp. J. 2000, 6, 155–161. [Google Scholar] [CrossRef]
  21. Bertoli, U.S.; Guss, G.; Wu, S.; Matthews, M.J.; Schoenung, J.M. In-situ characterization of laser-powder interaction and cooling rates through high-speed imaging of powder bed fusion additive manufacturing. Mater. Des. 2017, 135, 385–396. [Google Scholar] [CrossRef]
  22. Rubenchik, A.; Wu, S.; Mitchell, S.; Golosker, I.; LeBlanc, M.; Peterson, N. Direct measurements of temperature-dependent laser absorptivity of metal powders. Appl. Opt. 2015, 54, 7230–7233. [Google Scholar] [CrossRef] [PubMed]
  23. Boley, C.D.; Khairallah, S.A.; Rubenchik, A.M. Calculation of laser absorption by metal powders in additive manufacturing. Appl. Opt. 2015, 54, 2477–2482. [Google Scholar] [CrossRef] [PubMed]
  24. Zhou, Y.H.; Lin, S.F.; Hou, Y.H.; Wang, D.W.; Zhou, P.; Han, P.L.; Li, Y.L.; Yan, M. Layered surface structure of gas-atomized high Nb-containing TiAl powder and its impact on laser energy absorption for selective laser melting. Appl. Surf. Sci. 2018, 441, 210–217. [Google Scholar] [CrossRef]
  25. Trapp, J.; Rubenchik, A.M.; Guss, G.; Matthews, M.J. In situ absorptivity measurements of metallic powders during laser powder-bed fusion additive manufacturing. Appl. Mater. Today 2017, 9, 341–349. [Google Scholar] [CrossRef]
  26. Yang, T.Y.; Wen, W.; Yin, G.Z.; Li, X.L.; Gao, M.; Gu, Y.L.; Li, L.; Liu, Y.; Lin, H.; Zhang, X.M.; et al. Introduction of the X-ray diffraction beamline of SSRF. Nucl. Sci. Technol. 2015, 26, 1–5. [Google Scholar] [CrossRef]
  27. Gil, E.; Cortés, J.; Iturriza, I.; Ordás, N. XPS and SEM analysis of the surface of gas atomized powder precursor of ODS ferritic steels obtained through the STARS route. Appl. Surf. Sci. 2018, 427, 182–191. [Google Scholar] [CrossRef]
  28. Chasoglou, D.; Hryha, E.; Norell, M.; Nyborg, L. Characterization of surface oxides on water-atomized steel powder by XPS/AES depth profiling and nano-scale lateral surface analysis. Appl. Surf. Sci. 2013, 268, 496–506. [Google Scholar] [CrossRef]
  29. Hryha, E.; Gierl, C.; Nyborg, L.; Danninger, H.; Dudrova, E. Surface composition of the steel powders pre-alloyed with manganese. Appl. Surf. Sci. 2010, 256, 3946–3961. [Google Scholar] [CrossRef]
  30. Nyborg, L.; Nylund, A.; Olefjord, I. Thickness determination of oxide layers on spherically-shaped metallicpowders by ESCA. Surf. Interface Anal. 1988, 12, 110–114. [Google Scholar] [CrossRef]
  31. Irrinki, H.; Jangam, J.S.D.; Pasebani, S.; Badwe, S.; Stitzel, S.; Kate, K.; Gulsoy, O.; Atre, S.V. Effects of particle characteristics on the microstructure and mechanical properties of 17-4 PH stainless steel fabricated by laser-powder bed fusion. Powder Technol. 2018, 331, 192–203. [Google Scholar] [CrossRef]
  32. Yang, M.; Dai, Y.; Song, C.; Zhai, Q.J. Microstructure evolution of grey cast iron powder by high pressure gas atomization. J. Mater. Process. Technol. 2010, 210, 351–355. [Google Scholar] [CrossRef]
  33. Lee, E.S.; Ahn, S. Solification progress and heat transfer analysis of gas-atomized alloy droplets spray forming. Acta Metall. Mater. 1994, 42, 3231–3243. [Google Scholar] [CrossRef]
  34. Hussein, A.; Hao, L.; Yan, C.; Everson, R. Finite element simulation of the temperature and stress fields in single layers built without-support in selective laser melting. Mater. Des. 2013, 52, 638–647. [Google Scholar] [CrossRef]
  35. Foroozmehr, A.; Badrossamay, M.; Foroozmehr, E.; Golabi, S. Finite Element Simulation of Selective Laser Melting process considering Optical Penetration Depth of laser in powder bed. Mater. Des. 2016, 89, 255–263. [Google Scholar] [CrossRef]
  36. Wang, D.J. Thermal stability and sintering behavior of TiCuZrNiSn metallic glass. PhD Thesis, Harbin Institute of Technology, Harbin, China, 2010. [Google Scholar]
  37. Si, C.R.; Tang, X.L.; Zhang, X.J.; Wang, J.B.; Wu, W.C. Characteristics of 7055Al alloy powders manufactured by gas-solid two-phase atomization: A comparison with gas atomization process. Mater. Des. 2017, 118, 66–74. [Google Scholar] [CrossRef]
  38. Sun, Z.J.; Tan, X.P.; Tor, S.B.; Yeong, W.Y. Selective laser melting of stainless steel 316L with low porosity and high build rates. Mater. Des. 2016, 104, 197–204. [Google Scholar] [CrossRef]
  39. Krell, J.; Röttger, A.; Geenen, K.; Theisen, W. General investigations on processing tool steel X40CrMoV5-1 with selective laser melting. J. Mater. Process. Technol. 2018, 255, 679–688. [Google Scholar] [CrossRef]
  40. Dos Reis, A.G.; Reis, D.A.P.; Abdalla, A.J.; Otubo, J. High-temperature creep resistance and effects on the austenite reversion and precipitation of 18 Ni (300) maraging steel. Mater. Charact. 2015, 107, 350–357. [Google Scholar] [CrossRef]
  41. Oro, R.; Campos, M.; Hryha, E.; Torralba, J.M.; Nyborg, L. Surface phenomena during the early stages of sintering in steels modified with Fe–Mn–Si–C master alloys. Mater. Charact. 2013, 86, 80–91. [Google Scholar] [CrossRef]
  42. Simonelli, M.; Tuck, C.; Aboulkhair, N.T.; Maskery, I.; Ashcroft, I.; Wildman, R.D.; Hague, R. A Study on the Laser Spatter and the Oxidation Reactions During Selective Laser Melting of 316L Stainless Steel, Al-Si10-Mg, and Ti-6Al-4V. Metall. Mater. Trans. A 2015, 46A, 3842–3851. [Google Scholar] [CrossRef]
  43. Gaskell, D.R. Introduction to the Thermodynamics of Materials, 4th ed.; Taylor & Francis: New York, NY, USA, 2003. [Google Scholar]
  44. Smith, A.F. The tracer diffusion of transition metals in duplex oxide grown on a T316 stainless steel. Corros. Sci. 1981, 21, 517–529. [Google Scholar] [CrossRef]
  45. Smith, A.F. The Diffusion of Chromium in Type 316 Stainless Steel. Met. Sci. 2013, 9, 375–378. [Google Scholar] [CrossRef]
  46. Smitll, A.F.; Hales, R. Diffusion of Manganese in Type 316 Austenitic Stainless Steel. Met. Sci. 2013, 9, 181–184. [Google Scholar] [CrossRef]
  47. King, W.E.; Anderson, A.T.; Ferencz, R.M.; Hodge, N.E.; Kamath, C.; Khairallah, S.A.; Rubenchik, A.M. Laser powder bed fusion additive manufacturing of metals; physics, computational, and materials challenges. Appl. Phys. Rev. 2015, 2, 041304:1–041304:26. [Google Scholar] [CrossRef]
  48. Polyanskiy, M.N. Refractive Index Database. Available online: https://refractiveindex.info (accessed on 20 November 2018).
  49. Das, S. Physical aspects of process control in selective laser sintering of metals. Adv. Eng. Mater. 2003, 5, 701–711. [Google Scholar] [CrossRef]
  50. Yan, M.; Dargusch, M.S.; Ebel, T.; Qian, M. A transmission electron microscopy and three-dimensional atom probe study of the oxygen-induced fine microstructural features in as-sintered Ti–6Al–4V and their impacts on ductility. Acta Mater. 2014, 68, 196–206. [Google Scholar] [CrossRef]
  51. Zhou, Y.H.; Zhang, Z.H.; Wang, Y.P.; Liu, G.; Zhou, S.Y.; Li, Y.L.; Shen, J.; Yan, M. Selective laser melting of typical metallic materials: An effective process prediction model developed by energy absorption and consumption analysis. Addit. Manuf. 2019, 25, 204–217. [Google Scholar] [CrossRef]
Figure 1. Size distributions of (a) 316L, (b) H13, (c) P20 and (d) 18Ni300 powder particles.
Metals 09 00086 g001
Figure 2. (a) X-ray diffraction (XRD) and (b) synchrotron radiation X-ray diffraction (SR-XRD) results of four steel powders in the as-received state.
Metals 09 00086 g002
Figure 3. SEM-SE images of the cross sections of (a) 316L, (c) H13, (e) P20 and (g) 18Ni300 powders and energy dispersive X-ray spectroscopy (EDX) line scanning of the area marked by red dashed line shown in the left images.
Metals 09 00086 g003
Figure 4. (a) X-ray photoelectron spectroscopy (XPS) survey spectrum and (b) depth profile analyses of element concentrations for 316L powders.
Metals 09 00086 g004
Figure 5. Detailed XPS spectra of (a) Fe, (b) Cr, (c) Mn, (d) Ni and (e) Mo on the surface of 316L powders in the as-received state and after ion etching up to 30 nm.
Metals 09 00086 g005
Figure 6. Transmission electron microscopy (TEM) analysis of the oxide layer in 316L powder: (a) TEM-BF image of surface structure and (b) selected area electron diffraction (SAED) result of Fe2O3.
Metals 09 00086 g006
Figure 7. Estimation for the thickness of the iron oxide layer by the normalized intensity of metallic Fe peak for (a) 316L, (b) H13, (c) P20 and (d) 18Ni300 powders.
Metals 09 00086 g007
Figure 8. Variation of the reflectivity of powders with wavelength.
Metals 09 00086 g008
Figure 9. Optical microscope images of (a) 316L, (b) H13, (c) P20 and (d) 18Ni300 parts produced by selective laser melting (SLM) and CT image for (e) 18Ni300.
Metals 09 00086 g009
Figure 10. Calculated cooling rate of 316L droplets as a function of droplet diameter.
Metals 09 00086 g010
Figure 11. (a) Schematic diagram of the surface structure of steel powders and (b) Model of laser absorption at the surface of steel powders.
Metals 09 00086 g011
Table 1. Chemical composition (wt. %) of the four steel powders.
ElementCrNiMnMoSiCoVCFe
Material
316L16.510.51.82.250.5N/AN/A0.03Bal.
H134.88N/A0.451.221.1N/A1.030.36Bal.
P201.95N/A0.830.330.45N/AN/A0.40Bal.
18Ni3000.318.20.045.00.19.0N/A0.01Bal.
Table 2. The apparent density and tapped density of the four steels powders.
ElementApparent Density
(g/cm3)
Tapped Density
(g/cm3)
Hausner Ratio
(Tapped/Apparent)
Material
316L4.275.121.20
H133.954.941.25
P204.215.031.19
18Ni3004.195.031.20
Table 3. Selective laser melting processing parameters for the four steel powders.
Power (W)Scanning Speed (mm/s)Layer Thickness (μm)Hatching Space (μm)Energy Density (J/mm3)Relative Density
316L2008003012069.4499.7%
H131757203010081.099.6%
P202008003010579.499.5%
18Ni3002008003010579.499.6%
Table 4. The absorptivity of powders without and with considering the effect of oxide layer.
MaterialMeasured AbsorptivityCalculated AbsorptivityDifference
Pure 316L0.36--
316L powder + oxide0.550.573.64%
Pure H130.38--
H13 powder + oxide0.600.575%
Pure P200.37--
P20 powder + oxide0.560.571.79%
Pure 18Ni3000.37--
18Ni300 powder + oxide0.590.573.39%

