Article

Characterization of Local Residual Stress at Blade Surfaces by the V(z) Curve Technique

1
Key Laboratory of Pressure Systems and Safety, MOE, School of Mechanical and Power Engineering, East China University of Science and Technology, Shanghai 200237, China
2
College of Aerospace Engineering, Chongqing University, Chongqing 400044, China
*
Author to whom correspondence should be addressed.
Metals 2018, 8(8), 651; https://doi.org/10.3390/met8080651
Submission received: 15 June 2018 / Revised: 16 August 2018 / Accepted: 16 August 2018 / Published: 19 August 2018
(This article belongs to the Special Issue Modern Aerospace Materials)

Abstract

:
The characterization of residual stress in complicated components is a tough issue. The method of Rayleigh surface wave-based V(z) curve is adopted in this work to evaluate the distribution of residual stresses in aeroengine blades. First, the velocity of Rayleigh surface wave in aeroengine blade was measured by the V(z) curve technique, which can be used to calculate the local residual stress because the change of velocity is thought to be correlated with the contribution from residual stress. Two kinds of plastic-deformed Ti-6Al-4V samples were fabricated by ball-gun shooting to artificially induce distribution of residual stress and then measured by the proposed method. The results indicate that the distribution of the residual stress in both of the samples displays a predictable symmetry. The error of the measured stress is much less than 10% of the yielding stress in Ti-6Al-4V (i.e., about 800 MPa). Finally, the measured residual stresses were verified by X-ray diffraction method, whose results correlate reasonably well with each other. The proposed V(z) curve method and its experimental set-up appear to be a potential in characterizing residual stress at a point-like region, such as in complicated components.

1. Introduction

Complicated components are widely used in the fields of aeroengine blade, turbine rotor, pressure bended-pipe and spherical head, etc., which usually suffer from local plastic deformations when subjected to an external mechanical load or temperature change. The plastic deformation-induced residual stress, or internal stress, is one of the main reasons for micro-crack initiation and growth in components. Thus, monitoring of the residual stress could be used to evaluate the safety of the in-service components. For instance, the aeroengine blades generally undergo high centrifugal loads or foreign object impacts at a high risk, which lead to local micro elastoplasticity and then cause residual stress concentration. It is reported that the fatigue or plastic-deformed status can be assessed by inspecting the residual stress of blade surface, and the safety assessment of the aeroengine blade can be solved [1]. In addition, the knowledge of residual stresses allows us to estimate more accurately the safety factor and remaining life for components in fabrication condition or in the service [2]. Thus, the characterization of residual stress, as an important indicator of early-damage prediction and assessment, has received wide attention.
Several methods of residual stress measurement are available for securing the reliability of in-service components, which include destructive, semi-destructive and non-destructive methods [3]. Destructive/semi-destructive techniques, such as slitting and hole-drilling, are based on measuring elastic deformation generated from relieving residual stress by removing a sample from a component or drilling small holes into the component surface [4]. Although some destructive methods are widely used in engineering practice, their application is limited because of the additional damage introduced in the process. Currently, non-destructive techniques like X-ray diffraction (XRD) and ultrasonic testing methods are often considered for periodic routine inspection. These techniques calculate residual stress by measuring parameters affected by it, requiring less measuring time and costs [4,5,6,7,8]. Since fatigue and stress-corrosion-cracking failures are surface-sensitive phenomena, it is often accepted that evaluation of surface residual stress is adequate to assess these deformations. XRD is now considered a reliable method to measure surface or subsurface residual stresses and is often used to verify other measurement methods [4,8]. Note that neutron diffraction technique was recently considered to measure the residual stress in self-piercing riveting joints [9,10], where the incident beam was a monochromatic beam of thermal neutrons with a wavelength of 1.67 Å and a 2D position sensitive 3He detector recorded the diffraction peak. Residual stress can be calculated based on the strain, the reference lattice, and the measured one.
One of the most promising methods for non-destructive residual stress measurements is the application of ultrasound, which is based on the effect of acoustoelasticity that is a relationship between the velocity of ultrasonic wave and the internal/applied stress and is described by Hughes and Kelly [11]. The ultrasonic technique for measuring residual stresses was given in 1967 by Crecraft [12]. He described the acoustic birefringence phenomenon, which is analogous to optical birefringence observed in photo-elastic strain analysis. The velocity of shear waves polarized in one principal direction depends on the stress level applied in that direction. Recently, the longitudinal critically refracted (LCR) wave, known for its easy excitation and high sensitivity to residual stress, was used to evaluate surface residual stress in steel plates, bars and welds [13,14]. Bray and Junghans employed the evaluation of residual stress in steel plates after post-weld heat treatment by LCR ultrasonic method [13]. The LCR travel-time measurements can not only distinguish between residual stress states in the plate, but also offer information on their distribution and magnitude. Javadi et al. recently carried out a lot of work on LCR ultrasonic measurements and simulations of residual stresses [3,7,15,16]. They reported that LCR waves are able to penetrate at different depths and measure the through-thickness stresses of stainless steel plates by four different testing frequencies of the transducers [15]. They also compared the ultrasonic measurement results with those obtained from the finite element simulation of weldings. The LCR wave was also applied to evaluate residual stresses in carbon steel weld joint fabricated using the manual metal arc welding process with marginally different heat inputs [2].
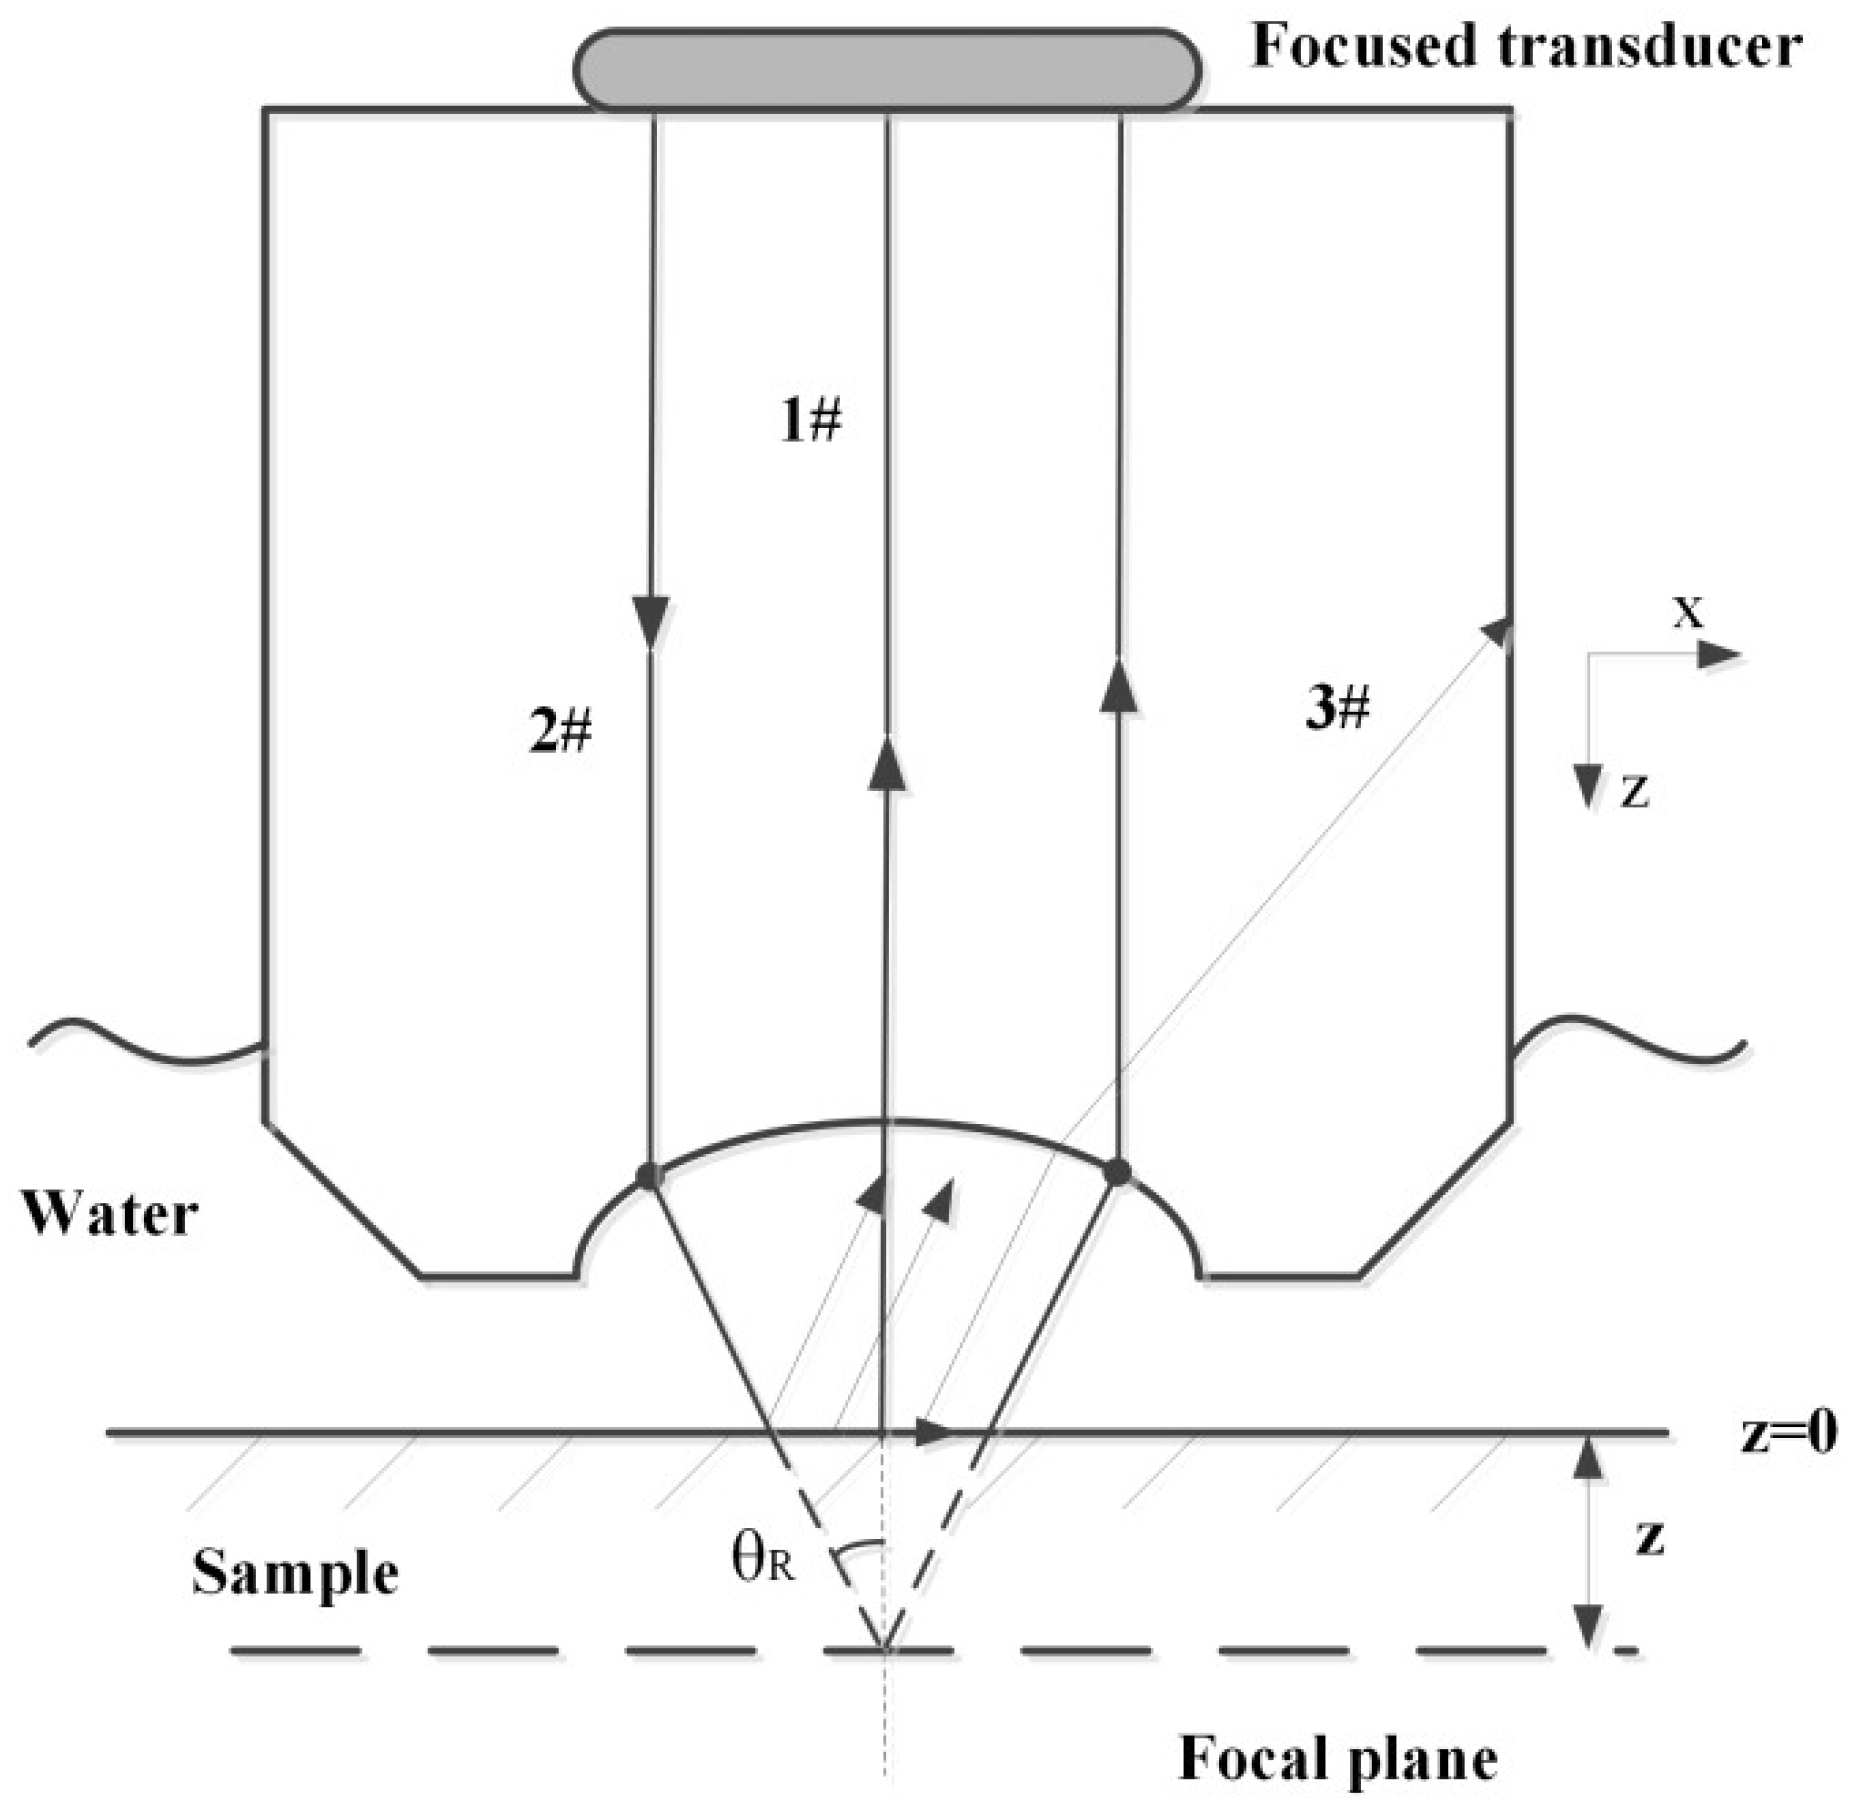
LCR waves are usually used to assess the residual stresses distributed in components with planar or cylindrical shapes due to their sensitivity to stresses and capability of indicating stress gradients. However, there are a few applications of LCR waves for residual stress evaluations in complicated components or curved surfaces, such as aeroengine blade, turbine rotor, pressure bended-pipe, etc. Generally, in order to improve the measurement resolution of stress, the LCR method should sacrifice the space resolution for a bulk measurement over whole volume with a couple of millimeters between two receivers, if a set-up of one transmitter and two receivers is considered [3,4]. To find a general solution to evaluate residual stresses in complicated components with a space resolution of 1–2 mm, just like X-ray diffraction method, here a
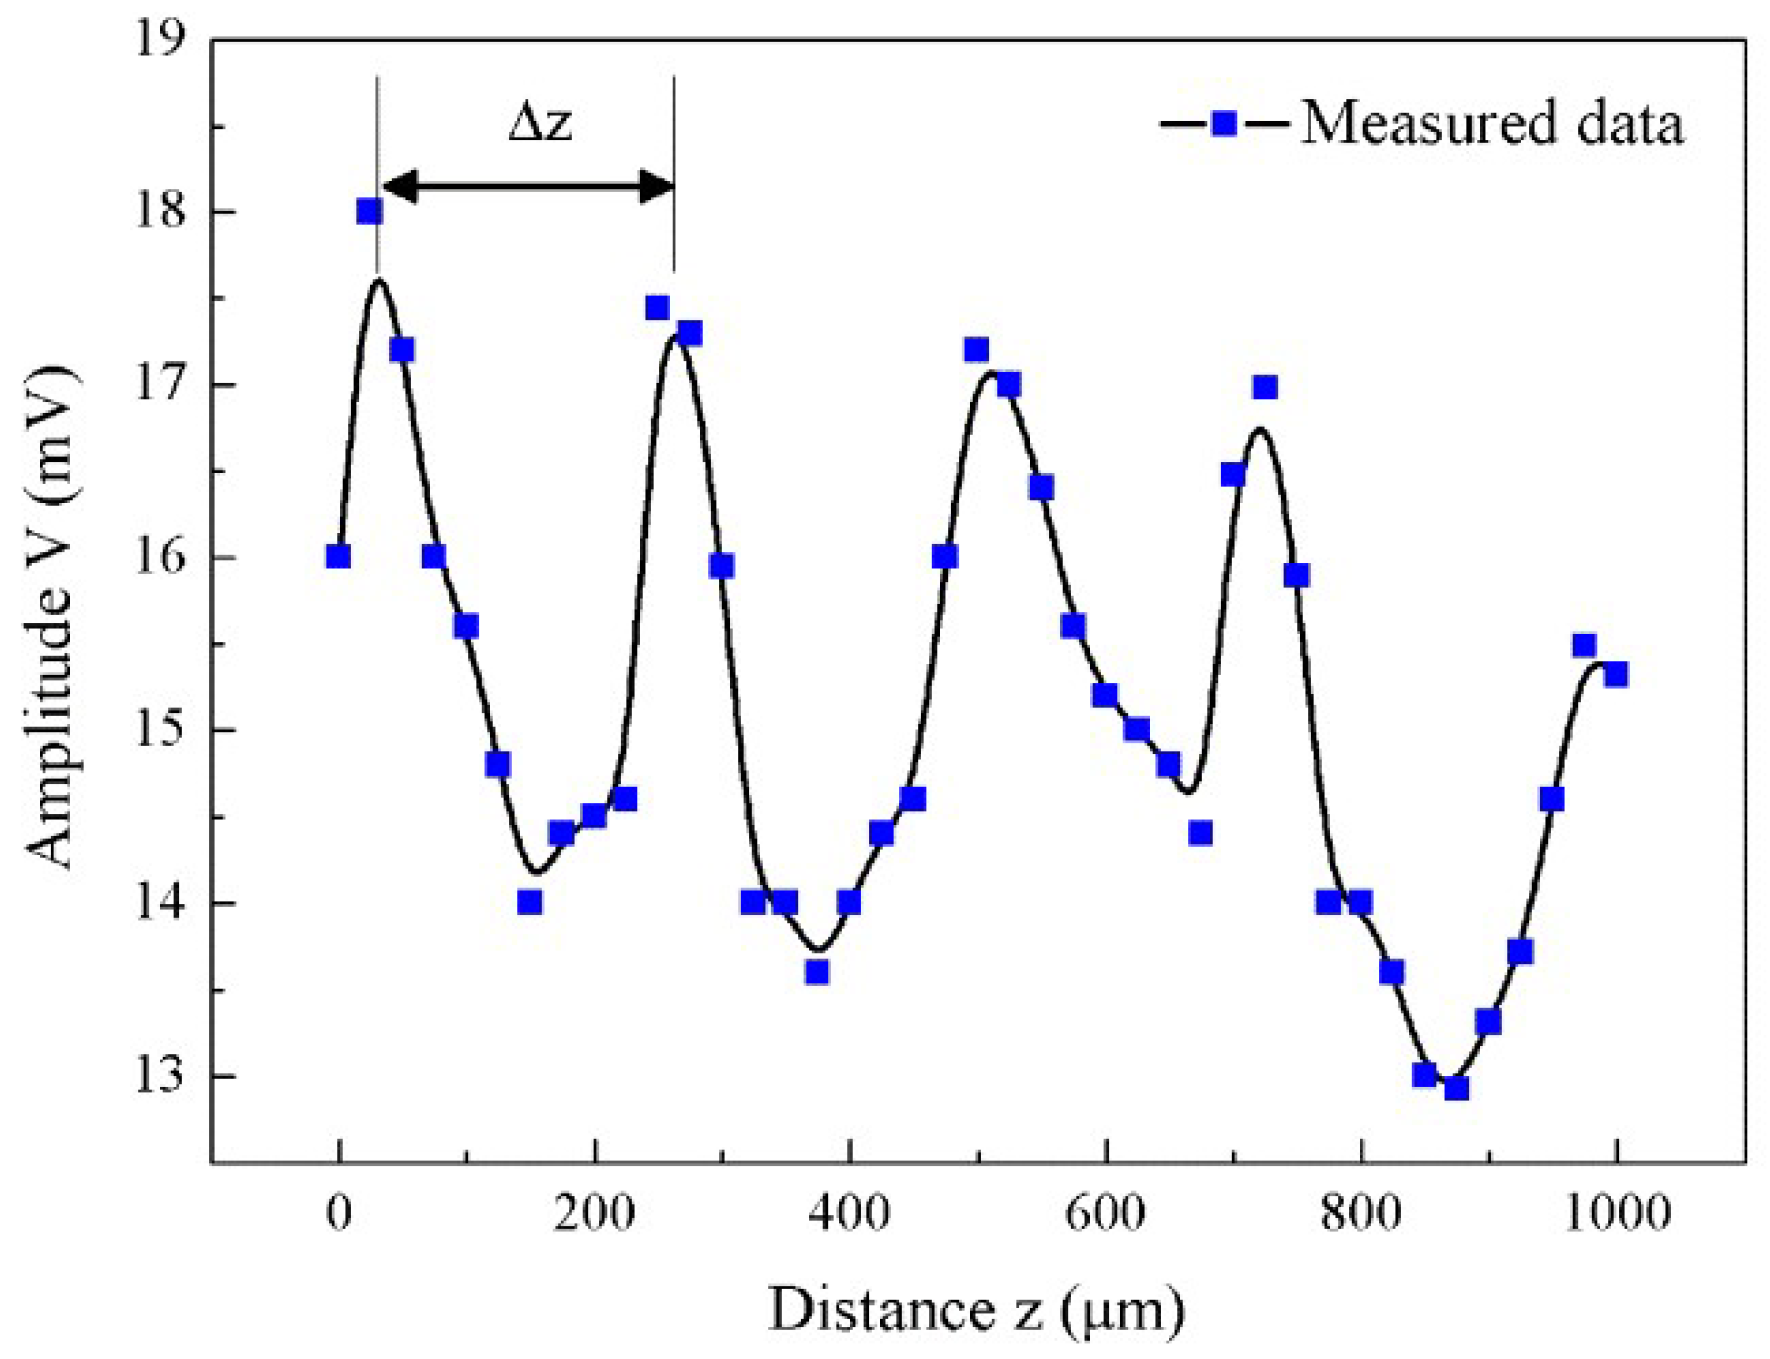
 V(z) curve method based on Rayleigh surface wave is proposed; it measures residual stresses at a point-like region in complicated components. Due to the using of leaky Rayleigh wave, a liquid-immersed experimental set-up with a focused ultrasonic transducer is generally considered in experiments. When the focused transducer is defocused towards the specimen to be tested, the receiving signal/voltage of the leaky Rayleigh wave displays a periodical change because of the interference effect of waves. The plot of the periodical changes is the so-called V(z) curve [17], representing a relationship between the output voltage of ultrasonic signal and the transducer lifting location, which can be used with leaky Rayleigh wave to measure the residual stresses on curved surface. The periodicity of V(z) curve was verified by Weglin in 1979; the relationship between oscillation interval of V(z) curve and leaky Rayleigh wave velocity was observed as well [18]. In recent years, some research were conducted to characterize stresses at surface or sub-surface of materials by the V(z) curve method of scanning acoustic microscopy at a high frequency, even up to 400 MHz [19,20,21,22]. However, the characterization of residual stresses on the surface of complicated components by V(z) curve technique at a normal ultrasonic frequency such as less than 20 MHz has not been fully addressed before, which could be a practical way for measuring the residual stress at a point-like region with a space resolution of 1–2 mm in engineering metallic components.
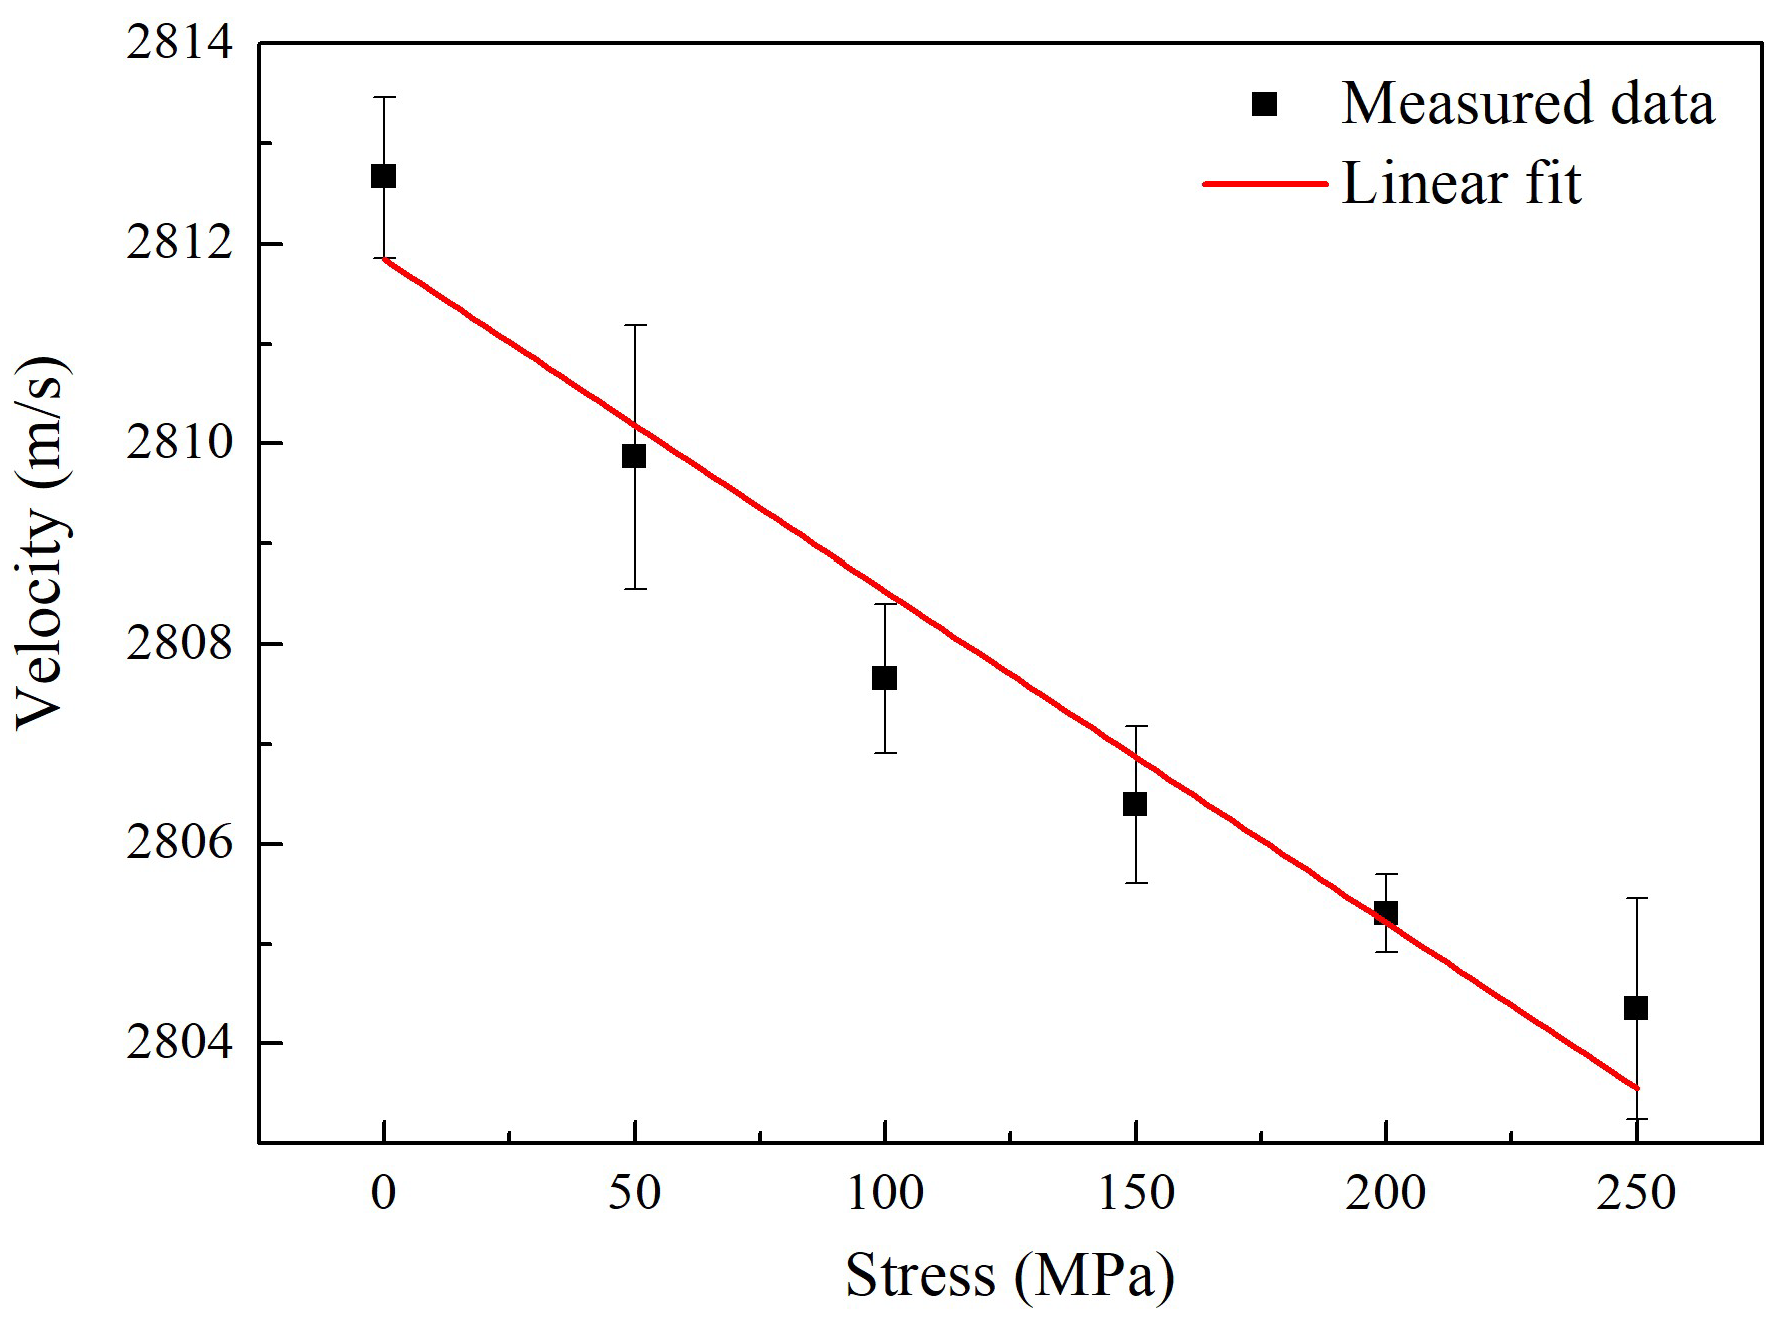
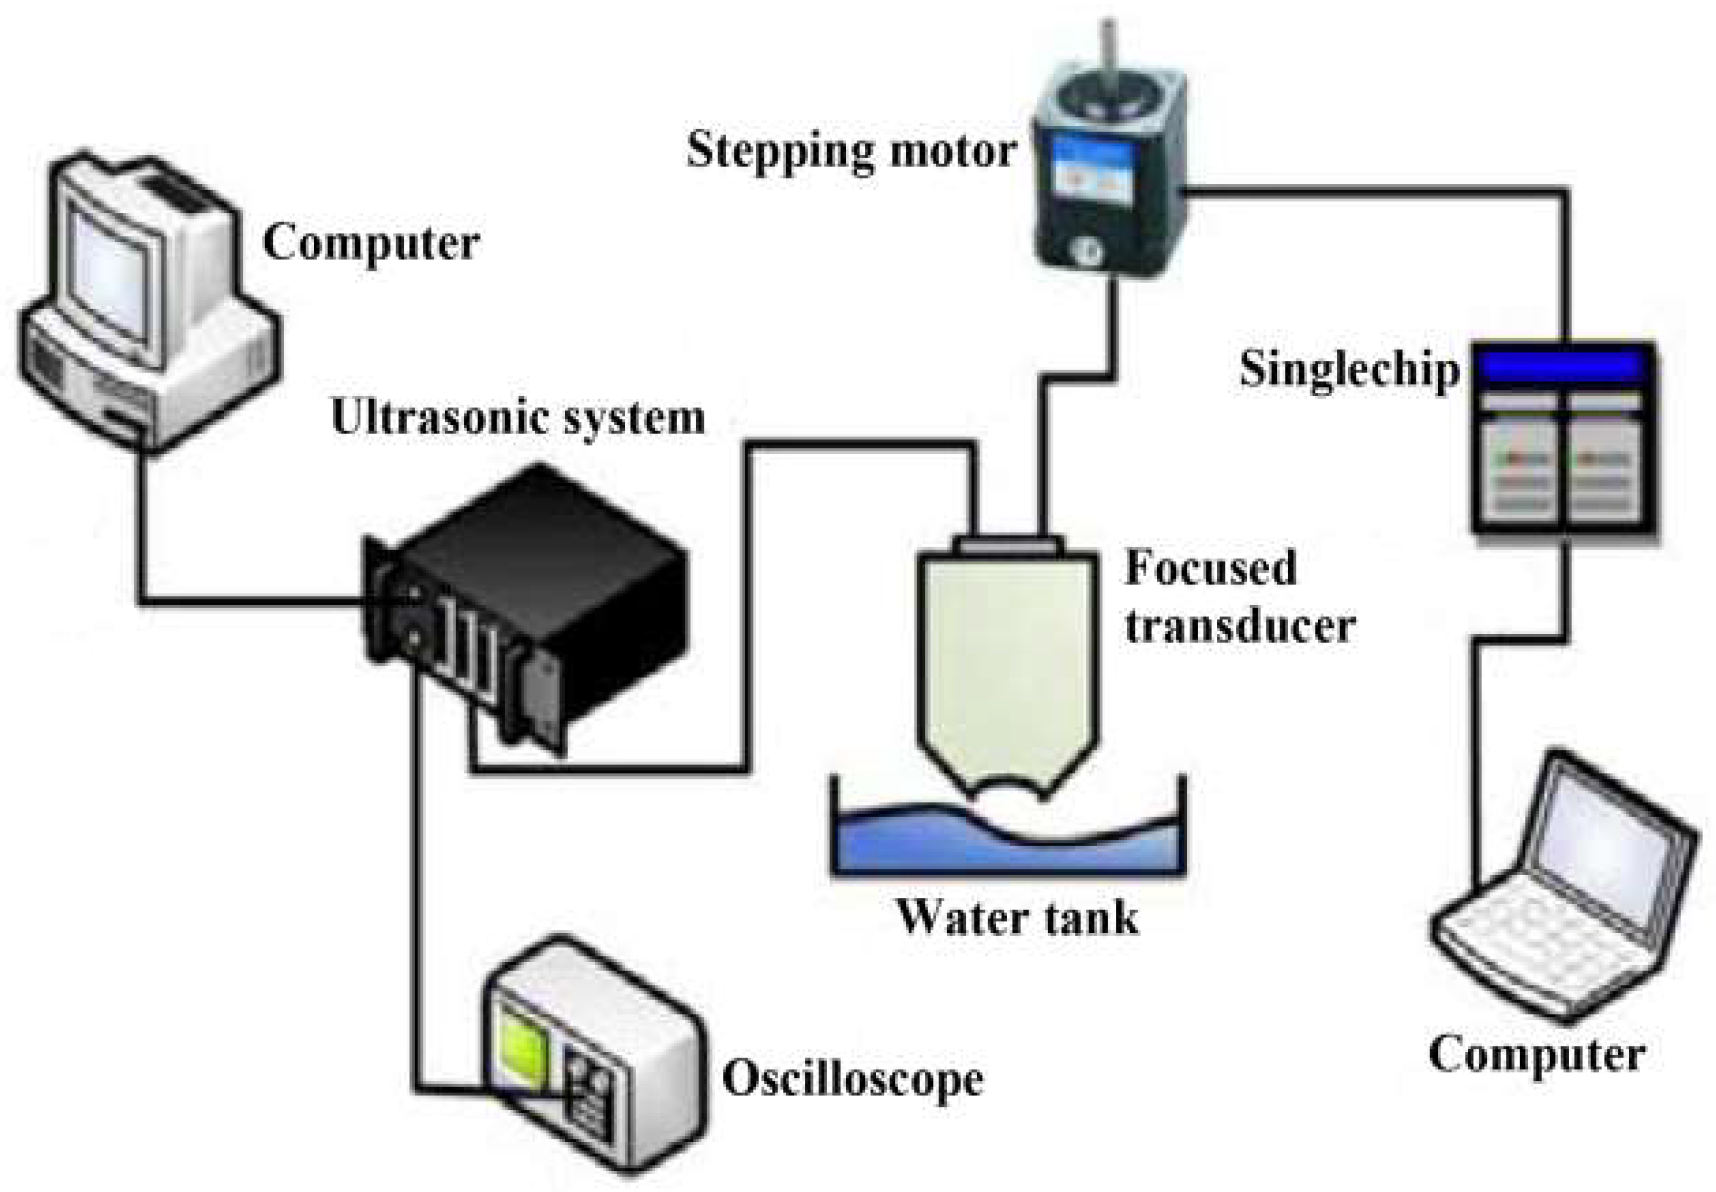
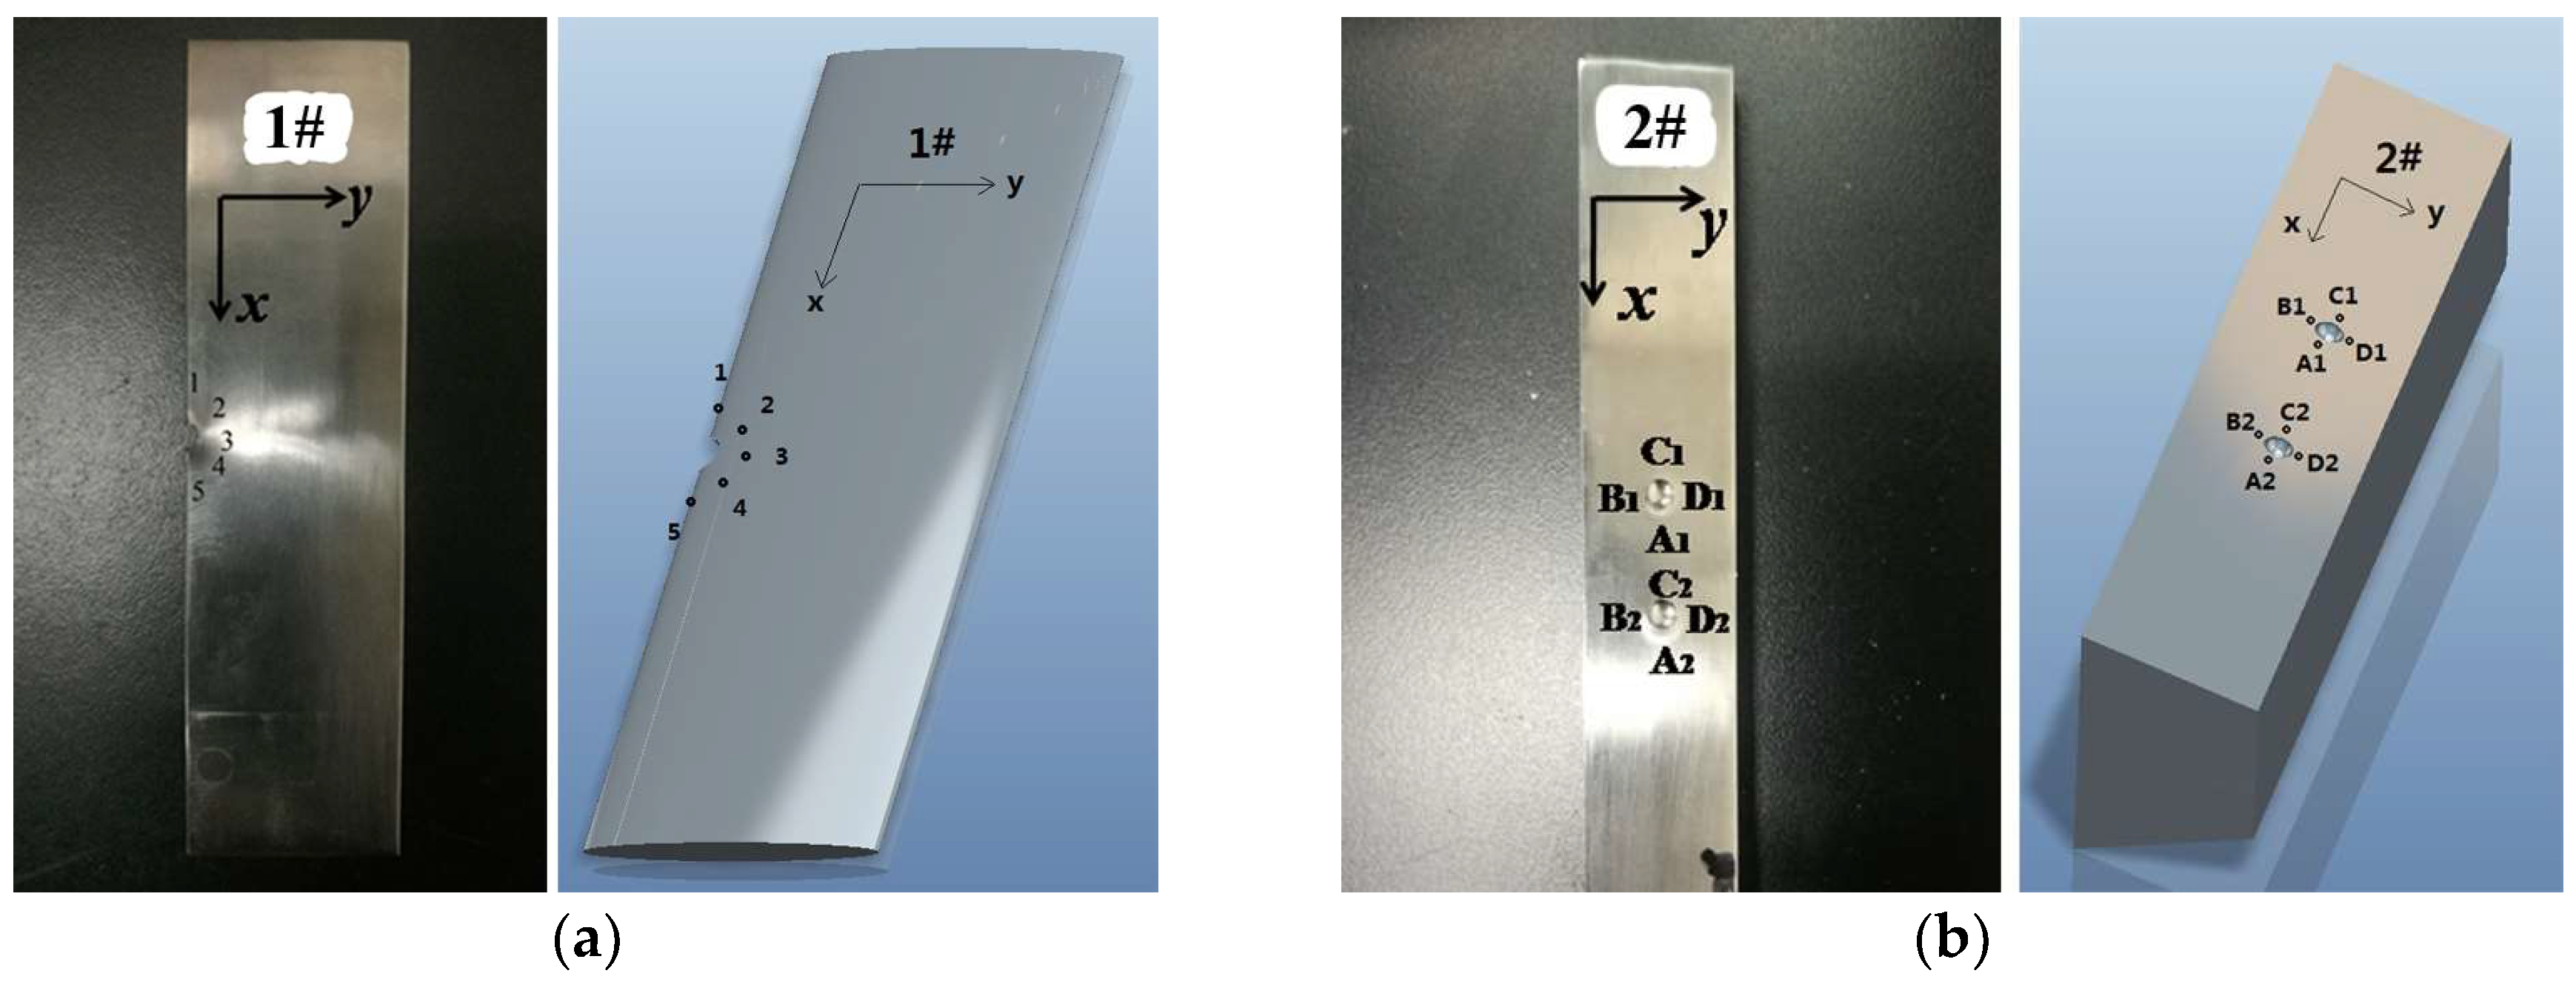
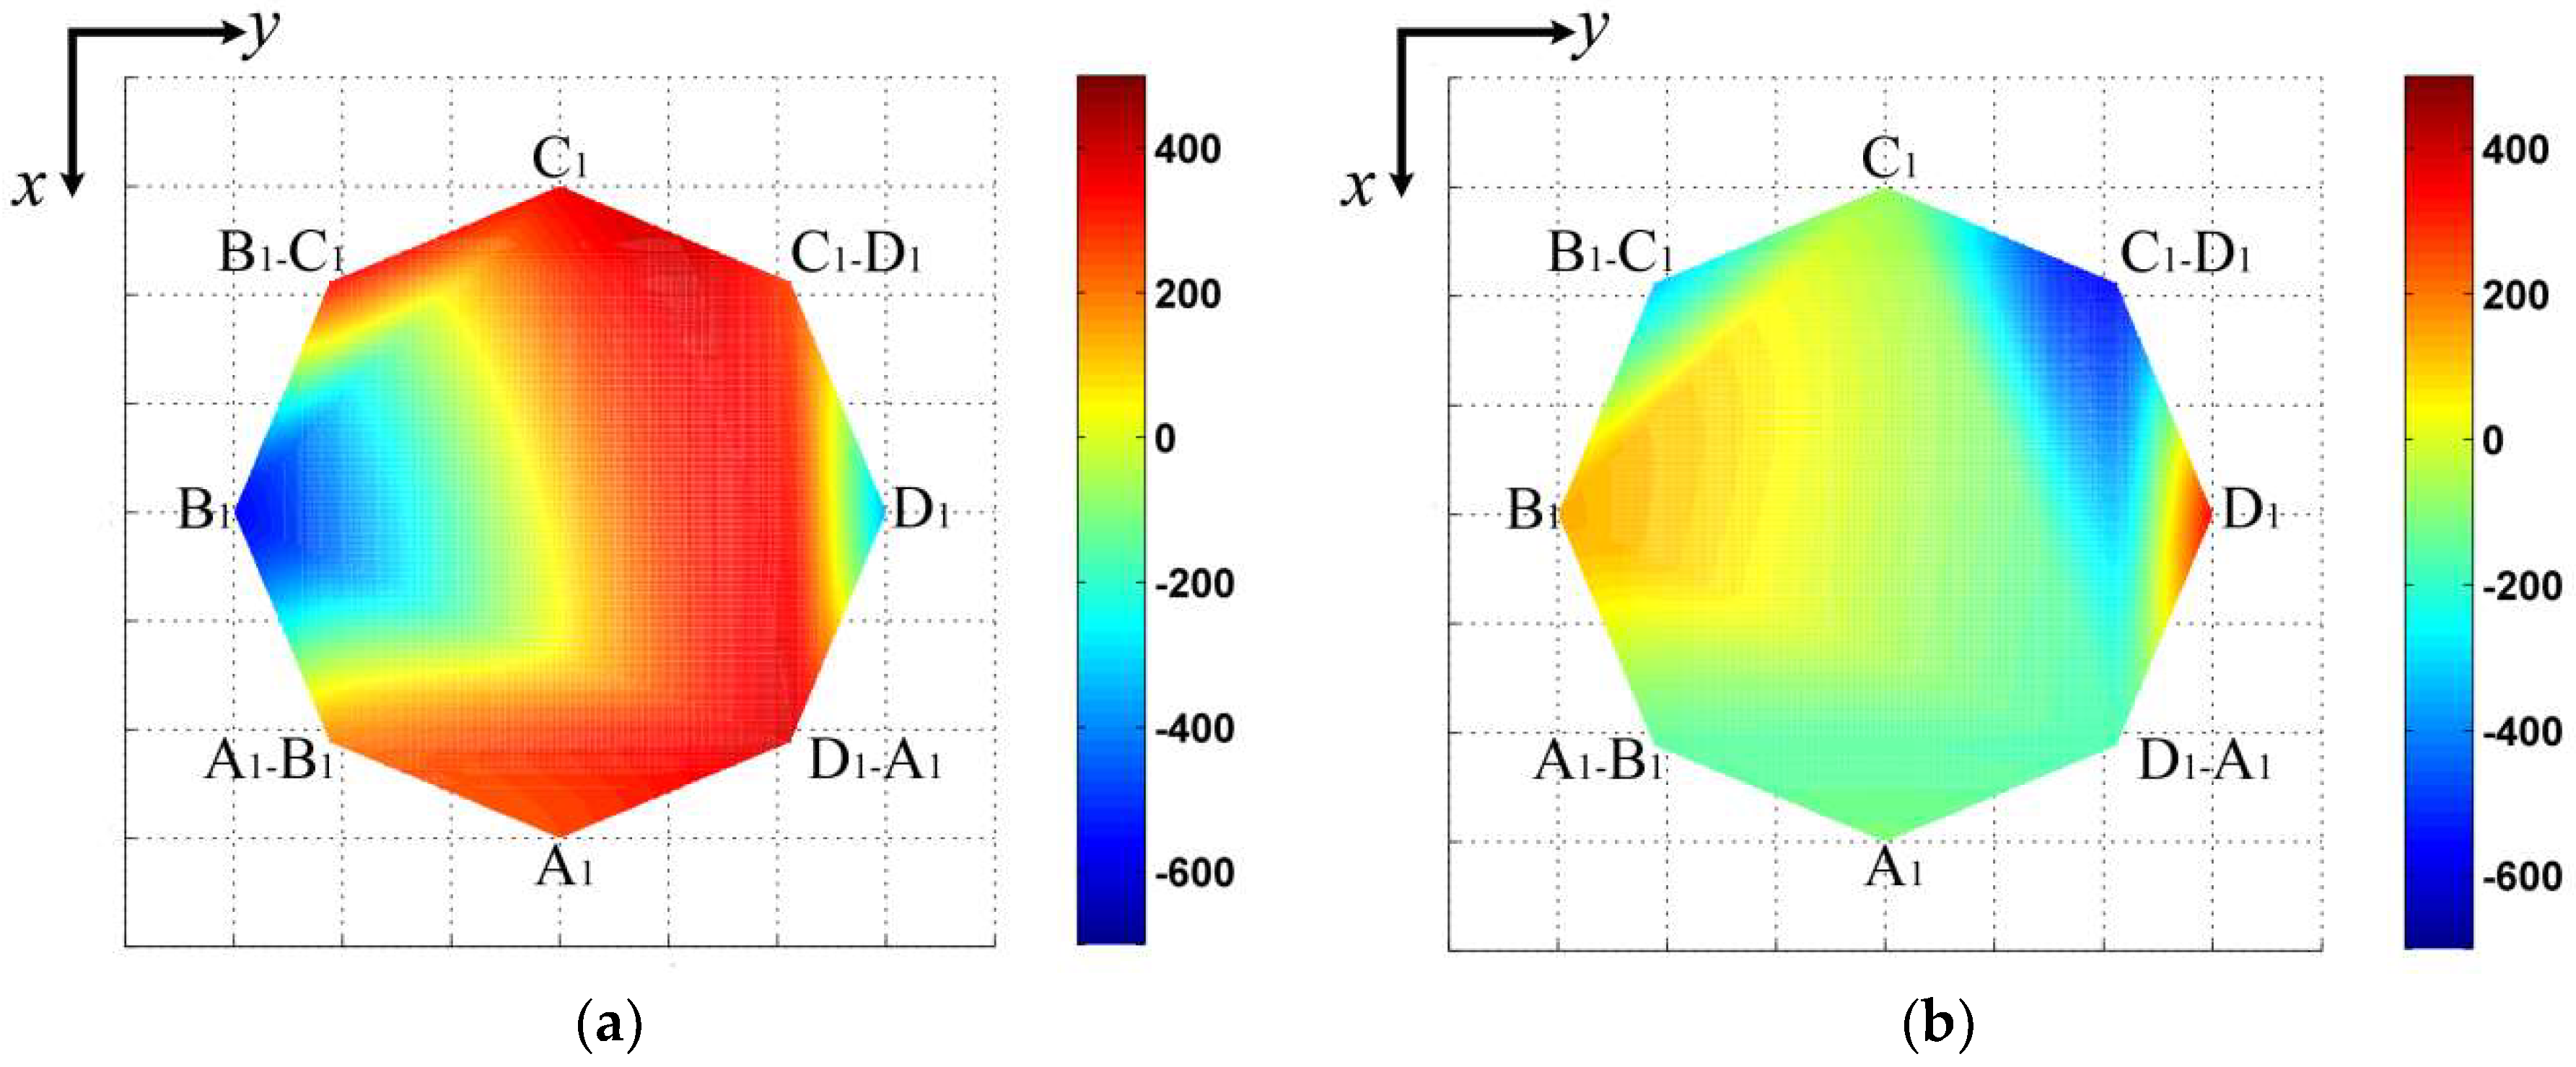
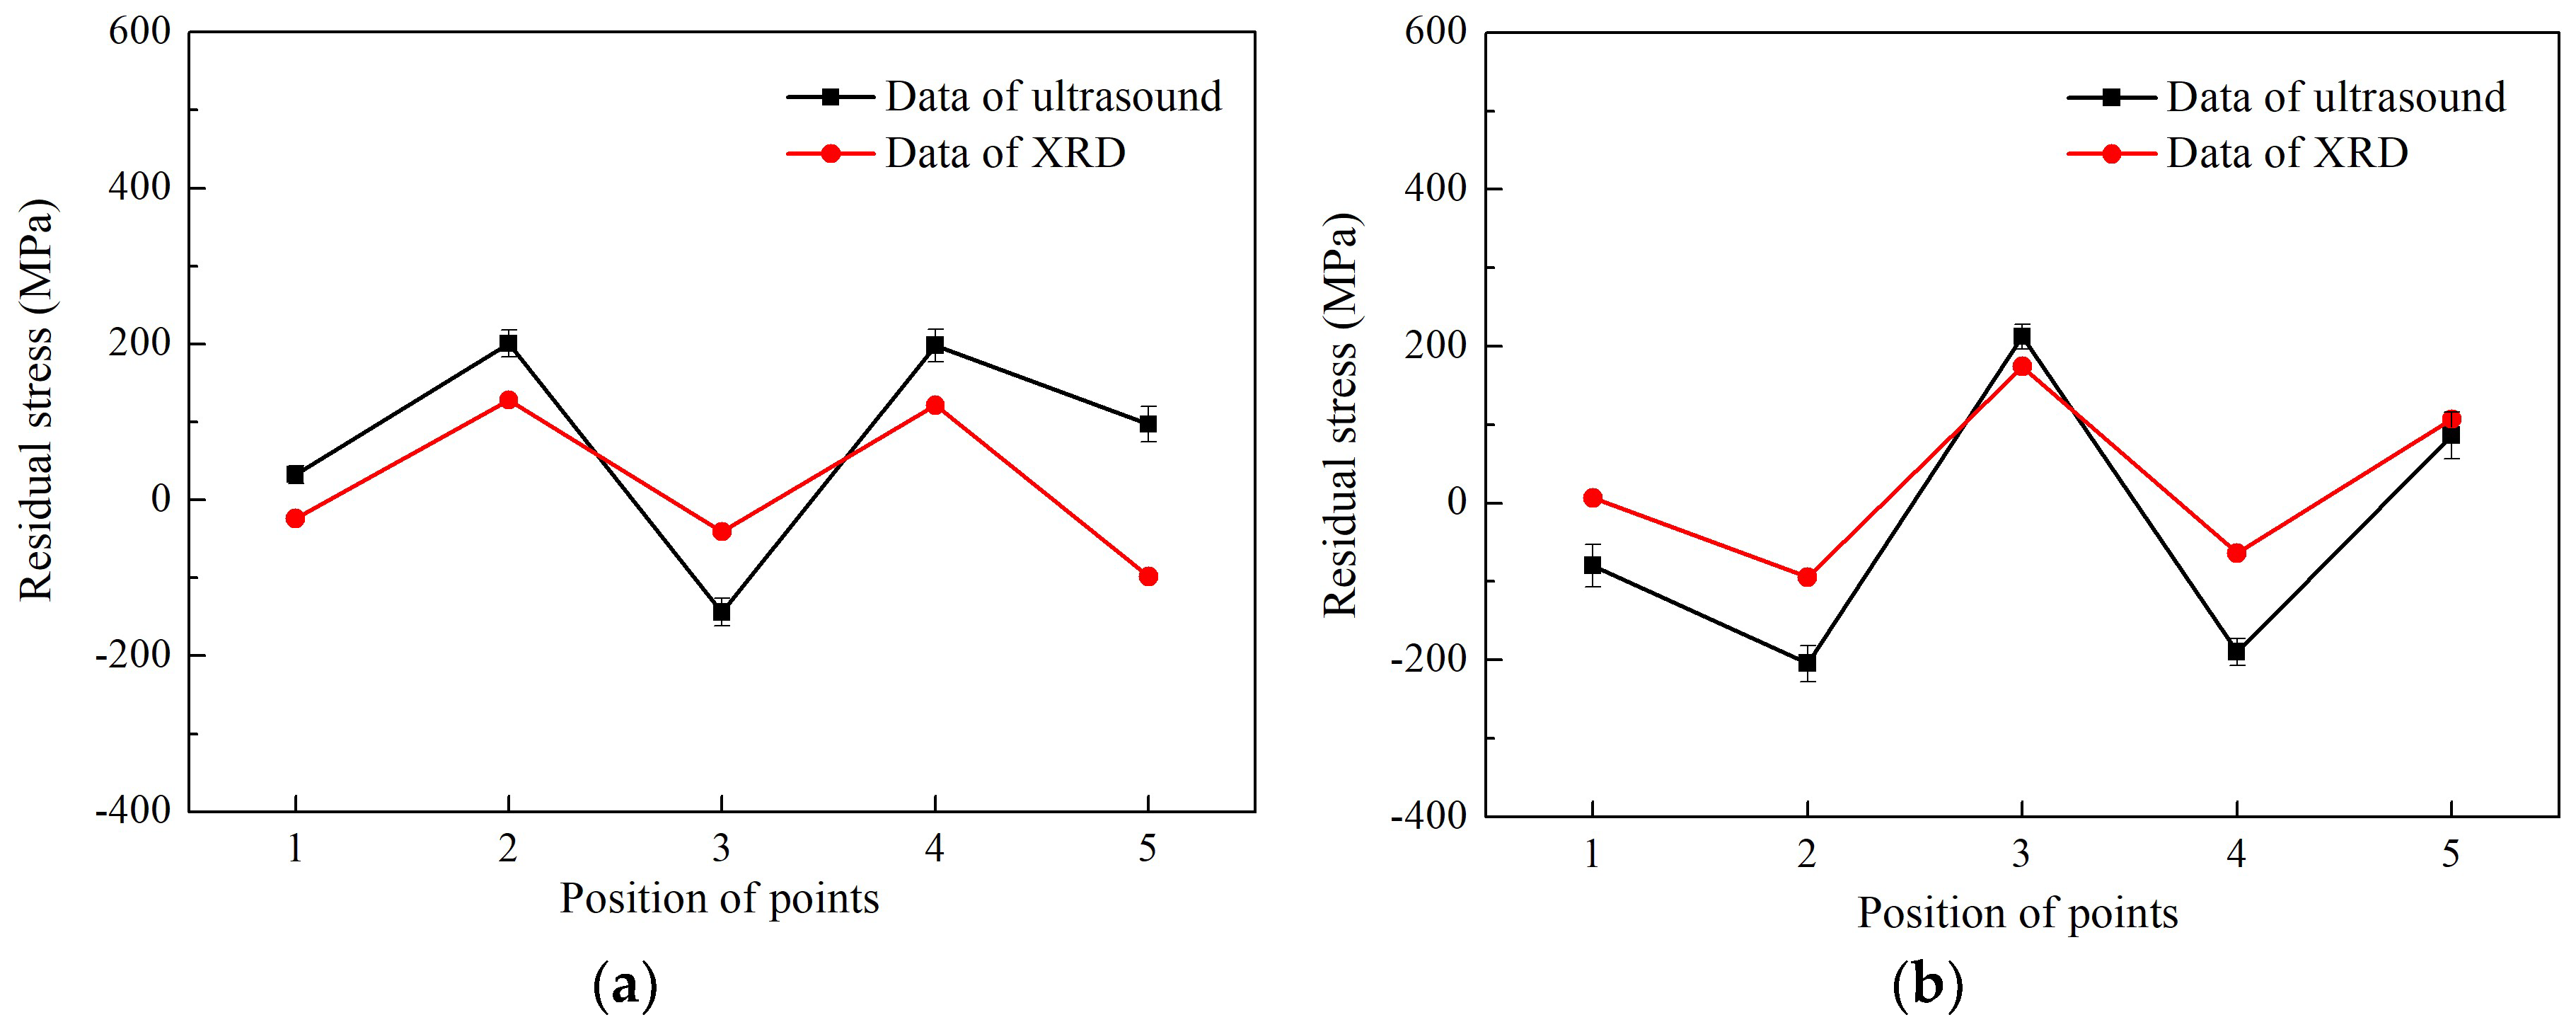
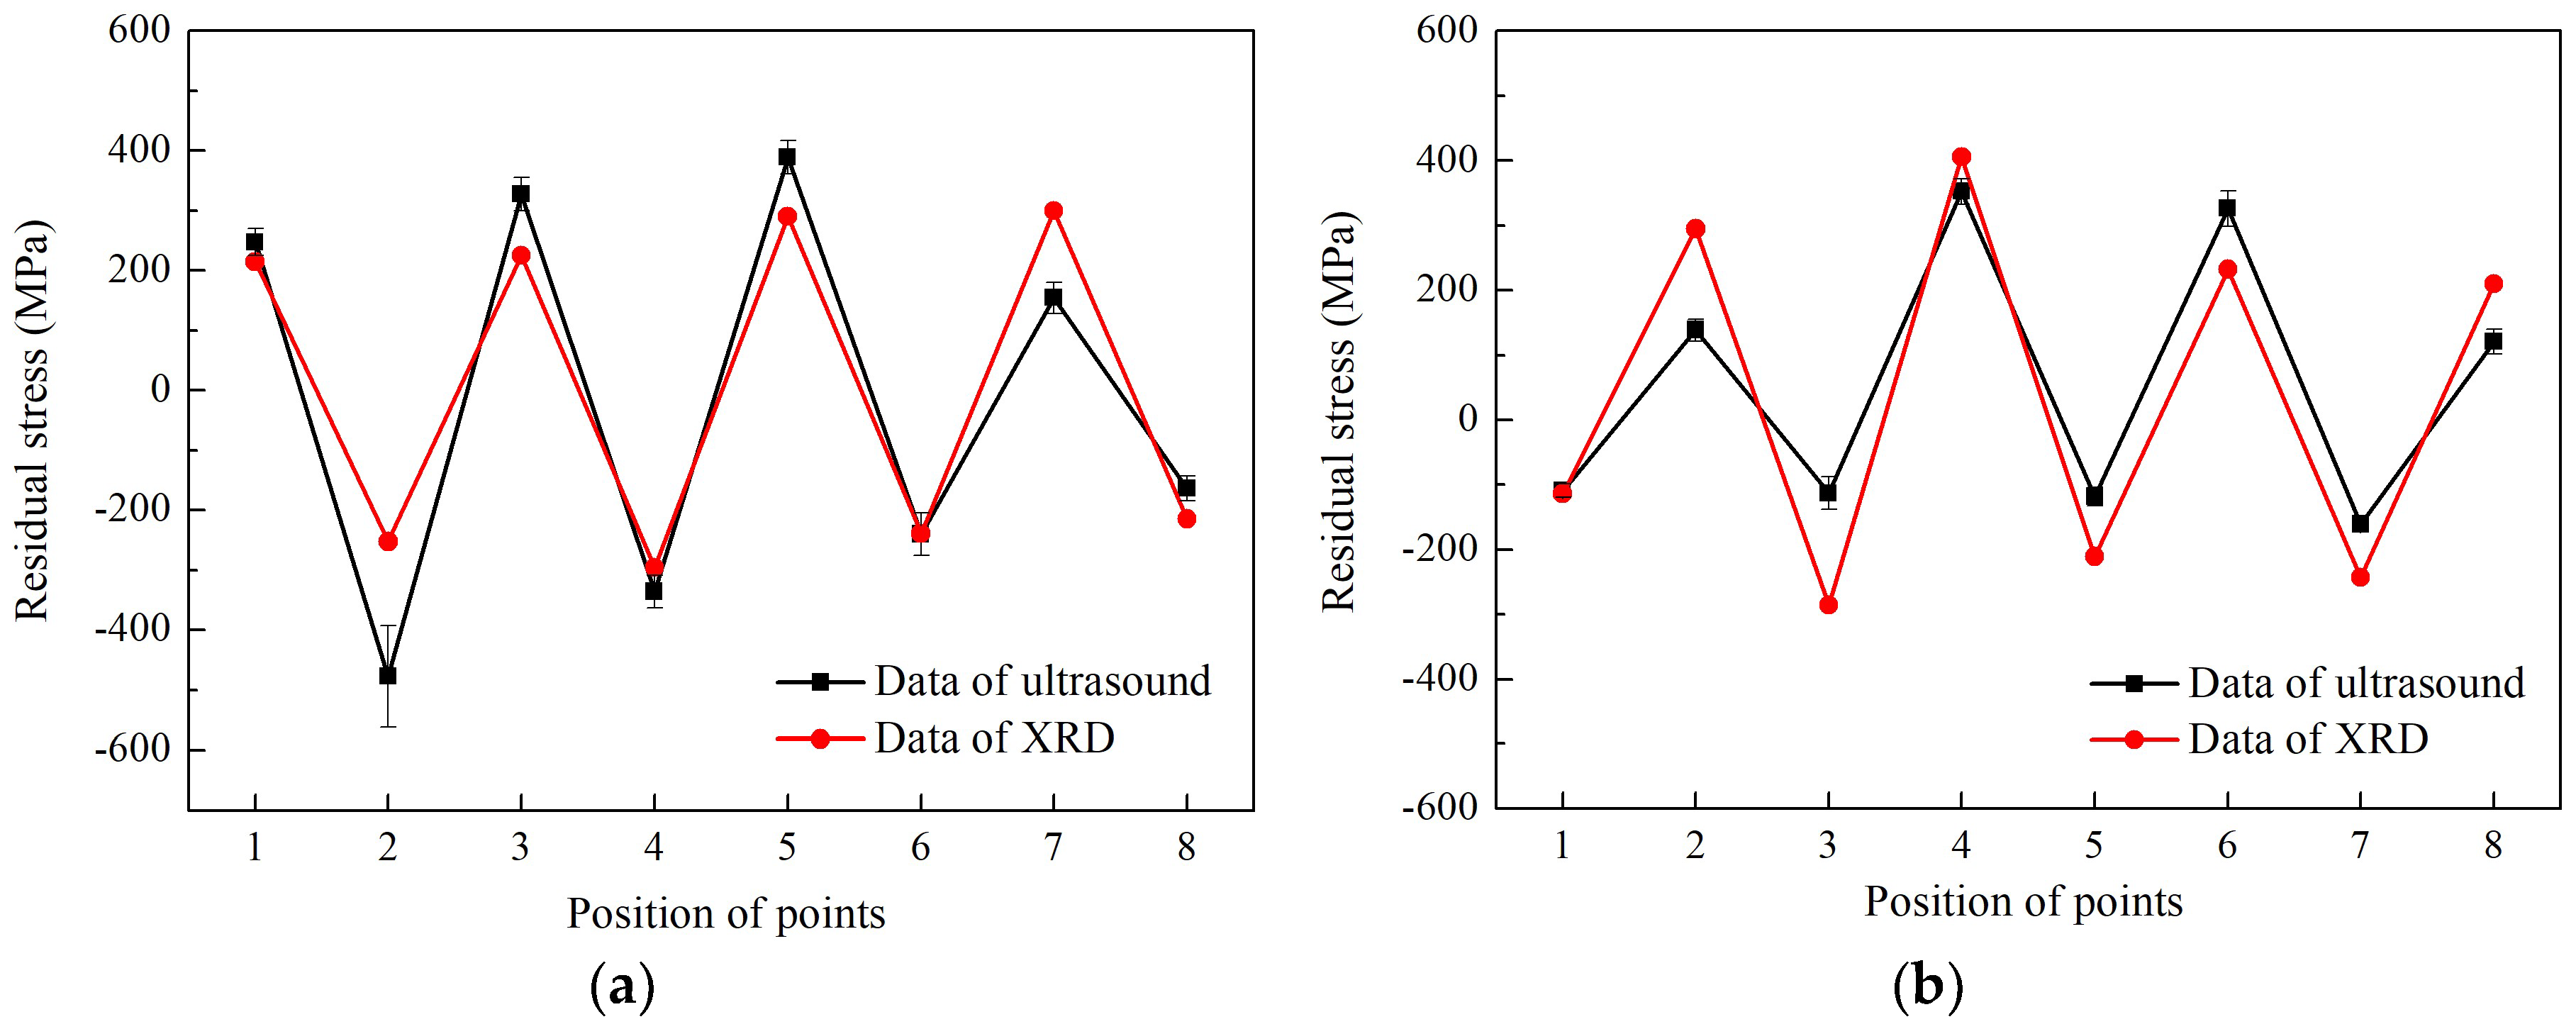
The Rayleigh surface wave-based V(z) curve method is adopted in this work to evaluate the distribution of residual stresses in aeroengine blades, in which the residual stresses were artificially made by shot of steel balls. The experimental measurements are divided into two parts, one is a determination of the acoustoelastic coefficients of titanium alloy Ti-6Al-4V, and the other is measurement of the V(z) curve for the velocity calculation of Rayleigh surface wave. The data acquisition based on the motor driving system is designed to measure the amplitudes of the output ultrasonic signal. The distribution of residual stresses in pre-fabricated aeroengine blades was measured by the proposed set-up and verified by the XRD method.

2. Theoretical Remarks

2.1. Acoustoelasticity of Rayleigh Surface Wave

For an isotropic material, the relationship between the velocity of Rayleigh surface wave and the biaxial stresses (σ1 and σ2) can be expressed as [23]:
V R V 0 V 0 = K 1 σ 1 + K 2 σ 2
where VR is the measured velocity of Rayleigh surface wave in a state of being applied stresses, V0 is the velocity of Rayleigh surface wave in a stress-free state, and K1 and K2 are the acoustoelastic coefficients.
For easy analysis, it is assumed that there is no coupling between the biaxial stresses, which means that the measured velocity of Rayleigh surface wave is only affected by the applied uniaxial stress. Thus, when considering the case of σ1 = σ, σ2 = 0, Equation (1) can be simplified as:
V R V 0 V 0 = K σ
where K is an acoustoelastic coefficient that can be measured by uniaxial tensile testing carried out on the samples extracted from the tested material. σ is uniaxial stress to be determined. Equation (2) shows that surface/subsurface residual stress can be calculated by measuring the velocity of Rayleigh surface wave.

2.2. V(z) Curve Method

V(z) curve is a variation curve describing the relationship between the output voltage of ultrasonic signal and the transducer lifting location z, which was established by Atalar et al. in their analysis of data obtained from an acoustic microscopy [17]. Figure 1 shows a schematic diagram of Rayleigh surface wave propagation between the focused transducer and the sample via water couplant. For instance, using the ray tracing technique, there are two main beams in Figure 1 that can be received. Beam No. 1 is focused linearly along the axial direction of the transducer and normally reflected by the sample surface. Beam No. 2 propagates into the liquid-solid interface (z = 0) at an incident angle of the critical Rayleigh surface wave, and can develop a leaky Rayleigh surface wave that propagates along the interface and radiates energy into the liquid at Rayleigh angle [18]. The V(z) curve is formed as a result of the interference at the transducer between the normally reflected wave of Beam No. 1 and the reflected leaky surface wave generated by the propagation of Beam No. 2. The amplitude of the interference wave varies periodically with the distance z between the focal plane of the transducer and the sample surface. The relationship between the oscillation interval Δz and the velocity of leaky Rayleigh surface wave can then be determined by analyzing the signal phase of Beams No. 1 and No. 2.
When the sample is placed at the focal plane, the output voltage reaches its maximum value. However, when the focused transducer is translated perpendicularly along the sample, the output voltage shows an oscillation feature due to the interference effect between the received beam waves. The amplitude varies periodically with the distance z between the focal plane of the transducer and the sample surface. The relationship between the minimum vibration period Δz in the V(z) curve and the velocity of leaky Rayleigh wave VR can be expressed as [18]:
V R = V w ( 1 ( 1 V w 2 f Δ z ) 2 ) 1 2
where, VW is the velocity of longitudinal wave in water, f denotes the signal frequency.
It can be seen from Equations (2) and (3) that if Δz in V(z) curve is measured, VR can be calculated, which can feed Equation (2) to determine the residual stress in the surface/subsurface of sample.

3. Acoustoelastic Coefficient Measurement

To evaluate the acoustoelastic coefficient K of Rayleigh surface wave, tensile test samples of titanium Ti-6Al-4V were extracted from the raw materials of aeroengine blades for calibrating the relationship between velocity and stress, with gauge length, width and thickness of 120 mm, 20 mm, and 4 mm, respectively. The acoustoelastic coefficient of Rayleigh surface wave in Ti-6Al-4V can be determined with a wedge method using a tensile loading machine (8803 Floor Model Fatigue Testing System, Instron, Boston, MA, USA). Polymethyl methacrylate (PMMA) wedges with an angle of 65° were fixed on the tensile specimen, and two longitudinal transducers (V543, V543S, Olympus Panametrics NDT, Waltham, MA, USA) with frequency of 5 MHz bonded to the wedge were used to excite and receive the surface wave. Uniaxial stress was applied on the tensile specimen by the tensile loading machine, in which the loading stress increases from 0 to 250 MPa in a step of 50 MPa. The measurement was repeated five times at each one loading stress.
The relationship between the velocity of Rayleigh surface wave and the applied stress is shown in Figure 2, which displays a good linear feature and is in accordance with Equation (2). In order to make a more accurate calibration, the specimen calibrated was tested five times to determine the velocity-stress curves and the acoustoelastic constant. The calibration method adopted here is the same as that described by Li et al. [23]. Here, the average slope of the fitting line representing the relative acoustoelastic constant is −0.11 (m∙s−1∙MPa−1). Then, Equation (2) can be expressed as:
V R = 0.11 σ + 2811.7
where V0 is 2811.7 (m/s), K can be calculated as −3.19 × 10⁻⁵ (MPa−1). It should be pointed out that the acoustoelasitc coefficient K is usually kept similar for the same kind of material, e.g., Ti-6Al-4V; however, the initial velocity V0 may show a slight difference for different specimens or components in service. Thus, K could be kept fixed, but V0 will be corrected according to each specimen to be tested in the following measurements.

4. Experimental Measurement of Residual Stress

4.1. Velocity Measurement of Leaky Rayleigh Wave

After determining the acoustoelastic coefficient of Rayleigh wave in Ti-6Al-4V, to obtain residual stress, it is necessary to measure the leaky Rayleigh wave velocity in samples to be tested. The basic idea of the velocity measurement system is to first obtain the V(z) curve by changing the distance between the transducer and sample, and then calculate the wave velocity according to the oscillation interval Δz and Equation (3). The schematic of residual stress measurement system of the component is depicted in Figure 3, which consists of ultrasonic excitation-receiving apparatus, oscilloscope, focused ultrasonic transducer, water tank, stepping motor, microcontroller and computers.
In the velocity measurement system, a focused ultrasonic transducer (V317, Olympus Panametrics NDT, Waltham, MA, USA) with a central frequency of 20 MHz serves to excite and receive the acoustic signal; the focal length of the transducer is 71.10 mm. The receiver for the wave reflected from the sample is sensitive to the phase of the returning wave. The output voltage or amplitude is equal to the acoustic field of the returning pulse as it is integrated with the area of the transducer. In order to ensure that the transducer can move along the z-axial, the transducer is bonded with a linear stepping motor by a clamp. The linear stepping motor is mounted on a water tank. As the motor step precision is essential to the accuracy of the measured V(z) curve, the operation system is specifically designed by Labview and pulse code modulation. The output voltage of ultrasonic signal is recorded by the control software during the measurement, and then the V(z) curve is plotted to calculate the velocity of the leaky Rayleigh wave. Note that the distance between the transducer and the specimen surface must be less than the focal length of the transducer; special care should be taken to adjust transducer location.

4.2. Preliminary Verification of Measurement System

In order to verify the availability of measurement system, a nominal stress-free specimen of Ti-6Al-4V was measured based on the proposed method. First, the distance between the stepper motor and the specimen surface was adjusted to be much smaller than focal length of transducer, e.g., 25 mm. Then, the focused transducer controlled by stepper motor was translated vertically along z-axial with a step of 0.025 mm, measuring the output amplitude of ultrasonic signal for each step. The total movement distance is 1 mm. Finally, a V(z) curve representing the relationship between the output amplitude of signal and the lifting location of transducer can be obtained (Figure 4), where the average minimum oscillation interval of the curve is nearly 242 μm. According to Equation (3), the velocity of Rayleigh surface wave in this tested sample is 2810.61 m/s, from which the calculated stress is approximately 28 MPa. Note that the error of the measured stress (28 MPa) is much less than 10% of the yielding stress in Ti-6Al-4V (about 800 MPa). It can be reasonably concluded that the established experimental system has an acceptable measurement accuracy.

4.3. Specimens Preparation with Stress Concentration

In order to simulate specimens with residual stress concentration (such as impact of a foreign object on the aeroengine blade), two kinds of Ti-6Al-4V samples with artificial residual stresses were fabricated. One is plate-like edge with low curvature, simulating the tip of the blade, whose thickness is less than 4 mm (called Specimen 1#), and the other has a trapezoidal section with a large curvature for simulating the middle or root region of the blade (called Specimen 2#). Here, we make an assumption that the samples are free of defects in their initial state. All the residual stresses were produced by ball-gun shooting, where a 6 mm-diameter steel ball was used to shoot the surface of specimens at a speed of 200 m/s, resulting in plastic deformation. Figure 5 shows the deformed specimens after ball-gun shooting, in which Specimen 1# was impacted on the edge of the plate and Specimen 2# was perpendicularly impacted on the surface.
In order to measure the residual stresses on surfaces of the deformed blade specimens, a fixture was designed that adjusted the position of the specimen to cater to the measurement demands of the ultrasonic transducer. The measuring regions of Specimen 1# and Specimen 2# are marked in Figure 5a,b, respectively.

4.4. Ultrasonic Residual Stress Measurement Using V(z) Curve Method

Based on the proposed V(z) curve method, residual stresses were measured around the deformed area of specimens, as shown in Figure 5. It should be pointed out that several factors, such as the coupling status and the accuracy of stepper motor, affect stress measurement. Accordingly, two measures, i.e., water couplant and uni-directional movement of the stepper motor, were taken to keep the experimental conditions as steady as possible.
As shown in Table 1, residual stresses were measured along x-axial and y-axial directions at points 1 to 5 in Specimen 1#, where the x direction is along the blade edge. Each measurement point is about 3 mm away from the breakage edge. Near the deformed areas, the maximum compressive stress and tensile stress are about 200 MPa and 220 MPa, respectively. The distributions of residual stress might be caused by the blocking of elastic recovery along the direction of the deformation center. The measurement results of residual stress in Specimen 2# are shown in Table 2 and Figure 6, in which the stress distribution around two pits, i.e. pit 1 and pit 2, was determined. For each pit, such as pit 1, eight points around the circle were measured by the V(z) curve method, including points A1, B1, C1, D1, and A1-B1, B1-C1, C1-D1, D1-A1. Point A1-B1 represents the point between the middle position of the line AB, and similar meaning for others. As a fact of the highly non-uniform stress field caused by ball impact, in order to facilitate an effective detection, each measurement point is selected about 3 mm away from the edge of the pit. Five repeated measurements were carried out to obtain an average result for each point, in which a standard deviation is determined. It can be seen that, around the ball impact locations of pit 1 and pit 2, the maximum compressive stress is greater than 550 MPa and the maximum tensile stress is about 415 MPa.
Figure 6 shows the distribution maps of residual stress along x-axial and y-axial directions in Specimen 2# based on a method of two-dimensional interpolation, in which compressive stresses are presented near point B1 and D1, and tensile stresses are presented near A1 and C1. Based on the measured results, Figure 6a,b both display a reasonable symmetry that might be caused by extrusion deformation after the specimen suffers impact plastic deformation. The extrusion deformation generates a restoration force towards the direction of the pit center, which is one of the main reasons for the symmetric distribution of residual stress around the deformed areas of pit 1 and pit 2. Note that in the y-axial direction, the residual stress distributions of compressive stress and tensile stress are clearly inverse, compared to those in the x-axial direction. Of course, the trapezoidal section and measurement errors may also cause some variations in experimental results, such as the residual stresses of 255.45 MPa and 351.27 MPa measured in points A1 and C1, respectively, along the x-axial direction.

5. Comparison and Discussion

The X-ray diffraction (XRD) method, suitable for the measurement of residual stresses on the surface of materials, is based on determining elastic deformation, which will cause changes in interplanar spacing from their stress free value. Although this method generally cannot be used for the detection of in-service components, it is an effective way to measure residual stress due to its clear physical nature and reliable measurement result. Here, the XRD method was applied to verify the validity and accuracy of the proposed V(z) curve method. The measurements of XRD were carried out in the surfaces of Specimens 1# and 2# at the same measurement points. For the XRD analysis, the diffraction profiles were measured with a XRD stress analyzer (Proto-iXRD, Proto Manufacturing, Windsor, ON, Canada) using Cr Kα radiation, operating at 25 kV and 5 mA at a scan speed of 0.2°/min.
The comparison result of Specimen 1# is shown in Figure 7. It should be pointed out that the measurement of XRD is very time-consuming, so only an initial sample was measured repeatedly for five times to get an average experimental error that is about 25%. It is clear that the measured results using both the V(z) curve method and XRD method generally coincide well with each other in terms of curve tendency. However, due to the difference nature and test region, the residual stress obtained by the V(z) curve method in a subsurface layer was greater than that obtained by XRD method, where the maximum and minimum differences of the measured results are about 100 MPa and 10 MPa, respectively. In Figure 8, eight points (i.e., Ai to Di, i = 1, 2) in Specimen 2# were measured by XRD method and were compared with those in Table 2. In addition, the measurement results are consistent with the trend of stress measured by the proposed V(z) curve method, and the difference between them is less than 100 MPa in most of the measured points. However, there are some errors larger than 100 MPa between the two methods, which may be due to the complex distribution of the residual stress produced by foreign object impact.
It can be seen that the proposed V(z) curve method is suitable and effective for residual stress detection in a point-like region with a diameter of about 2 mm. Currently, the main difficulty with such a method is that the focused transducer and samples to be tested should be placed in a water tank. The most reported stress measurement methods using ultrasound usually focused on the precision determination of ultrasonic velocities; however, the relative deviations produced by the presence of stress are extremely small. Time-of-flight measurements are usually carried out to determine the velocity difference. The accuracy of such measurements obviously depends on the time duration of a probe pulse. It is thus difficult to obtain a high resolution of propagation time such as nanosecond ultrasonic pulses with a traditional piezoelectric technique. In this view, it may be easy to control the precision of velocity measurement based on amplitude measurement of the proposed V(z) curve method.

6. Conclusions

The V(z) curve method and residual stress measurement system were presented for stress characterization of complicated components. Titanium alloy Ti-6Al-4V extracted from raw materials of aeroengine blade was used for calibrating the relationship between velocity and stress and determining the acoustoelastic coefficient with a wedge method by tensile loading machine. A nominal stress-free specimen of Ti-6Al-4V was measured, based on the proposed method to verify the availability of the established experimental set-up. The calibration result indicated that the established experimental system has acceptable measurement accuracy in stress evaluation.
Two kinds of plastic-deformed Ti-6Al-4V samples fabricated by ball-gun shooting were measured by the proposed method for obtaining the residual stress distribution in the sample surface. The results showed a symmetrical residual stress distribution of compressive stress and tensile stress around the pits. The measured residual stresses on aeroengine blade specimens were finally verified by XRD, whose results correlate well with each other in curve tendency. Therefore, the proposed V(z) curve method and its experimental set-up appear to be a potential in characterizing residual stress at a point-like region in complicated components.

Author Contributions

Conceptualization, Y.X. and M.D.; Methodology, Y.L.; Software, D.T.; Validation, C.L. and F.X.; Formal Analysis, Y.X.; Investigation, Y.X.; Resources, M.D. and F.X.; Data Curation, Y.L. and D.T.; Writing–Original Draft Preparation, Y.X.; Writing–Review & Editing, F.X.; Visualization, Y.X.; Supervision, F.X.; Project Administration, F.X.; Funding Acquisition, F.X.

Funding

This research was funded by the National Natural Science Foundation of China (11622430, 11774090 and 11474361), the National Key Research and Development Program of China (2016YFC0801903), and the Fundamental Research Funds for the Central Universities (222201717005 and 222201718005).

Acknowledgments

The authors would like to thank Ying Li (AECC Commercial Aircraft Engine Co., Ltd.) for his help of making Ti-6Al-4V samples.

Conflicts of Interest

The authors declare no conflict of interest.

References

  1. Liu, J.; Wei, D.; Liu, C.; Yang, J. Surface residual stress test for aero-engine blade and its safety assessment. Sci. Technol. Eng. 2009, 11, 006. (In Chinese) [Google Scholar]
  2. Joseph, A.; Palanichamy, P.; Jayakumar, T. Evaluation of residual stresses in carbon steel weld joints by ultrasonic LCR wave technique. J. Nondestr. Eval. 2015, 34, 266. [Google Scholar] [CrossRef]
  3. Javadi, Y.; Azari, K.; Ghalehbandi, S.M.; Roy, M.J. Comparison between using longitudinal and shear waves in ultrasonic stress measurement to investigate the effect of post-weld heat-treatment on welding residual stresses. Res. Nondestr. Eval. 2017, 28, 101–122. [Google Scholar] [CrossRef]
  4. Rossini, N.S.; Dassisti, M.; Benyounis, K.Y.; Olabi, A.G. Methods of measuring residual stresses in components. Mater. Design. 2012, 35, 572–588. [Google Scholar] [CrossRef] [Green Version]
  5. Ceretti, M.; Braham, C.; Lebrun, J.L.; Bonnafe, J.P.; Perrin, M.; Lodini, A. Residual stress analysis by neutron and X-ray diffraction applied to the study of two phase materials: Metal matrix composites. Exp. Tech. 1996, 20, 14–18. [Google Scholar] [CrossRef]
  6. Zhu, Z.; Post, M.A.; Meguid, S.A. The potential of ultrasonic non-destructive measurement of residual stresses by modal frequency spacing using leaky lamb waves. Exp. Mech. 2012, 52, 1329–1339. [Google Scholar] [CrossRef]
  7. DsdSadeghi, S.; Najafabadi, M.A.; Javadi, Y.; Mohammadisefat, M. Using ultrasonic waves and finite element method to evaluate through-thickness residual stresses distribution in the friction stir welding of aluminum plates. Mater. Design. 2013, 52, 870–880. [Google Scholar] [CrossRef]
  8. Moussaoui, K.; Segonds, S.; Rubio, W.; Mousseigne, M. Studying the measurement by X-ray diffraction of residual stresses in Ti-6Al-4V titanium alloy. Mater. Sci. Eng. A 2016, 667, 340–348. [Google Scholar] [CrossRef]
  9. Haque, R.; Wong, Y.C.; Paradowska, A.; Blacket, S.; Durandet, Y. SPR characteristics curve and distribution of residual stress in self-piercing riveted joints of steel sheets. Adv. Mater. Sci. Eng. 2017, 2017, 5824171. [Google Scholar] [CrossRef]
  10. Haque, R. Residual stress in self-piercing riveting (SPR) joints—A review. Mater. Perform. Charact. 2018, 7, 20170109. [Google Scholar] [CrossRef]
  11. Hughes, D.S.; Kelly, J.L. Second-order elastic deformation of solids. Phys. Rev. 1953, 92, 1145. [Google Scholar] [CrossRef]
  12. Crecraft, D.I. The measurement of applied and residual stresses in metals using ultrasonic waves. J. Sound Vib. 1967, 5, 173–192. [Google Scholar] [CrossRef]
  13. Bray, D.E.; Junghans, P. Application of the LCR ultrasonic technique for evaluation of post-weld heat treatment in steel plates. NDT E Int. 1995, 28, 235–242. [Google Scholar] [CrossRef]
  14. Bray, D.E.; Tang, W. Subsurface stress evaluation in steel plates and bars using the LCR ultrasonic wave. Nucl. Eng. Design. 2001, 207, 231–240. [Google Scholar] [CrossRef]
  15. Javadi, Y.; Hasani, M.; Sadeghi, S. Investigation of clamping effect on the welding sub-surface residual stress and deformation by using the ultrasonic stress measurement and finite element method. J. Nondestr. Eval. 2015, 34, 3. [Google Scholar] [CrossRef]
  16. Javadi, Y.; Pirzaman, H.S.; Raeisi, M.H.; Najafabadi, M.A. Ultrasonic inspection of a welded stainless steel pipe to evaluate residual stresses through thickness. Mater. Design. 2013, 49, 591–601. [Google Scholar] [CrossRef]
  17. Atalar, A.; Quate, C.F.; Wickramasinghe, H.K. Phase imaging in reflection with the acoustic microscope. Appl. Phys. Lett. 1977, 31, 791–793. [Google Scholar] [CrossRef]
  18. Weglein, R.D. A model for predicting acoustic material signatures. Appl. Phys. Lett. 1979, 34, 179–181. [Google Scholar] [CrossRef]
  19. Obata, M.; Shimada, H.; Mihara, T. Stress dependence of leaky surface wave on PMMA by line-focus-beam acoustic microscope. Exp. Mech. 1990, 30, 34–39. [Google Scholar] [CrossRef]
  20. SdsadLee, Y.C.; Kim, J.O.; Achenbach, J.D. Measurement of stresses by line-focus acoustic microscopy. Ultrasonics 1994, 32, 359–365. [Google Scholar] [CrossRef]
  21. Sathish, S.; Moran, T.J.; Martin, R.W.; Reibel, R. Residual stress measurement with focused acoustic waves and direct comparison with X-ray diffraction stress measurements. Mater. Sci. Eng. A 2005, 399, 84–91. [Google Scholar] [CrossRef]
  22. Miyasaka, C.; Tittmann, B.R.; Tanaka, S.I. Characterization of stress at a ceramic/metal joined interface by the V(z) technique of scanning acoustic microscopy. J. Press. Vessel Technol. 2002, 124, 336–342. [Google Scholar] [CrossRef]
  23. Li, Y.; Liu, C.; Xiang, Y.; Li, Y. Characterization of local residual stress on curved blades by ultrasound. In Proceedings of the 2016 IEEE International Ultrasonics Symposium (IUS), Tours, France, 18–21 September 2016. [Google Scholar] [CrossRef]
Figure 1. The schematic description of the focused acoustic beam.
Metals 08 00651 g001
Figure 2. The relationship between the velocity of Rayleigh surface wave and the applied stress.
Metals 08 00651 g002
Figure 3. The schematic representation of residual stress measurement system.
Metals 08 00651 g003
Figure 4. The V(z) curve representing the transducer output versus the lifting location of transducer.
Metals 08 00651 g004
Figure 5. Two kinds of deformed Ti-6Al-4V samples: (a) Specimen 1# and its schematic diagram; and (b) Specimen 2# and its schematic diagram.
Metals 08 00651 g005
Figure 6. Residual stress distribution in x and y directions of specimen 2# (pit 1): (a) x direction; and (b) y direction.
Metals 08 00651 g006
Figure 7. Comparison of stress results measured by ultrasound and XRD in Specimen 1#: (a) x-axial direction; and (b) y-axial direction.
Metals 08 00651 g007
Figure 8. Comparison of stress results measured by ultrasound and XRD in Specimen 2#: (a) x-axial direction; and (b) y-axial direction.
Metals 08 00651 g008
Table 1. Stress in plastic-deformed area of specimen 1#.
Pointsx Direction (MPa)y Direction (MPa)
133.45−56.81
2202.45−201.45
3−145.84221.36
4198.73−199.27
5100.5586.36
Table 2. Stress in plastic-deformed area of specimen 2#.
Pointsx Direction (MPa)y Direction (MPa)
A1255.45−109.45
A1-B1185.37−145.37
B1−557.64129.82
B1-C1339.44−330.26
C1351.72−79.63
C1-D1251.71−543.15
D1−343.45350.64
D1-A1379.23−171.33
A2415.09−105.64
B2−240.36360.18
C2112.45−159.55
D2−150.18115.64

