Microstructural Evolution of Reaction Layer of 1.5 GPa Boron Steel Hot-Dipped in Al-7wt%Ni-6wt%Si Alloy


Abstract
:1. Introduction
2. Materials and Methods
3. Results and Discussion
3.1. Microstructure of Solidification Layer
3.1.1. Identification of Solidification Layer Phases
3.1.2. Microstructural Evolution of Solidification Layer
3.2. Microstructure of Reaction Layer
3.2.1. Microstructural Identification of Reaction Layer
3.2.2. Microstructural Evolution of Reaction Layer
4. Conclusions
- (1)
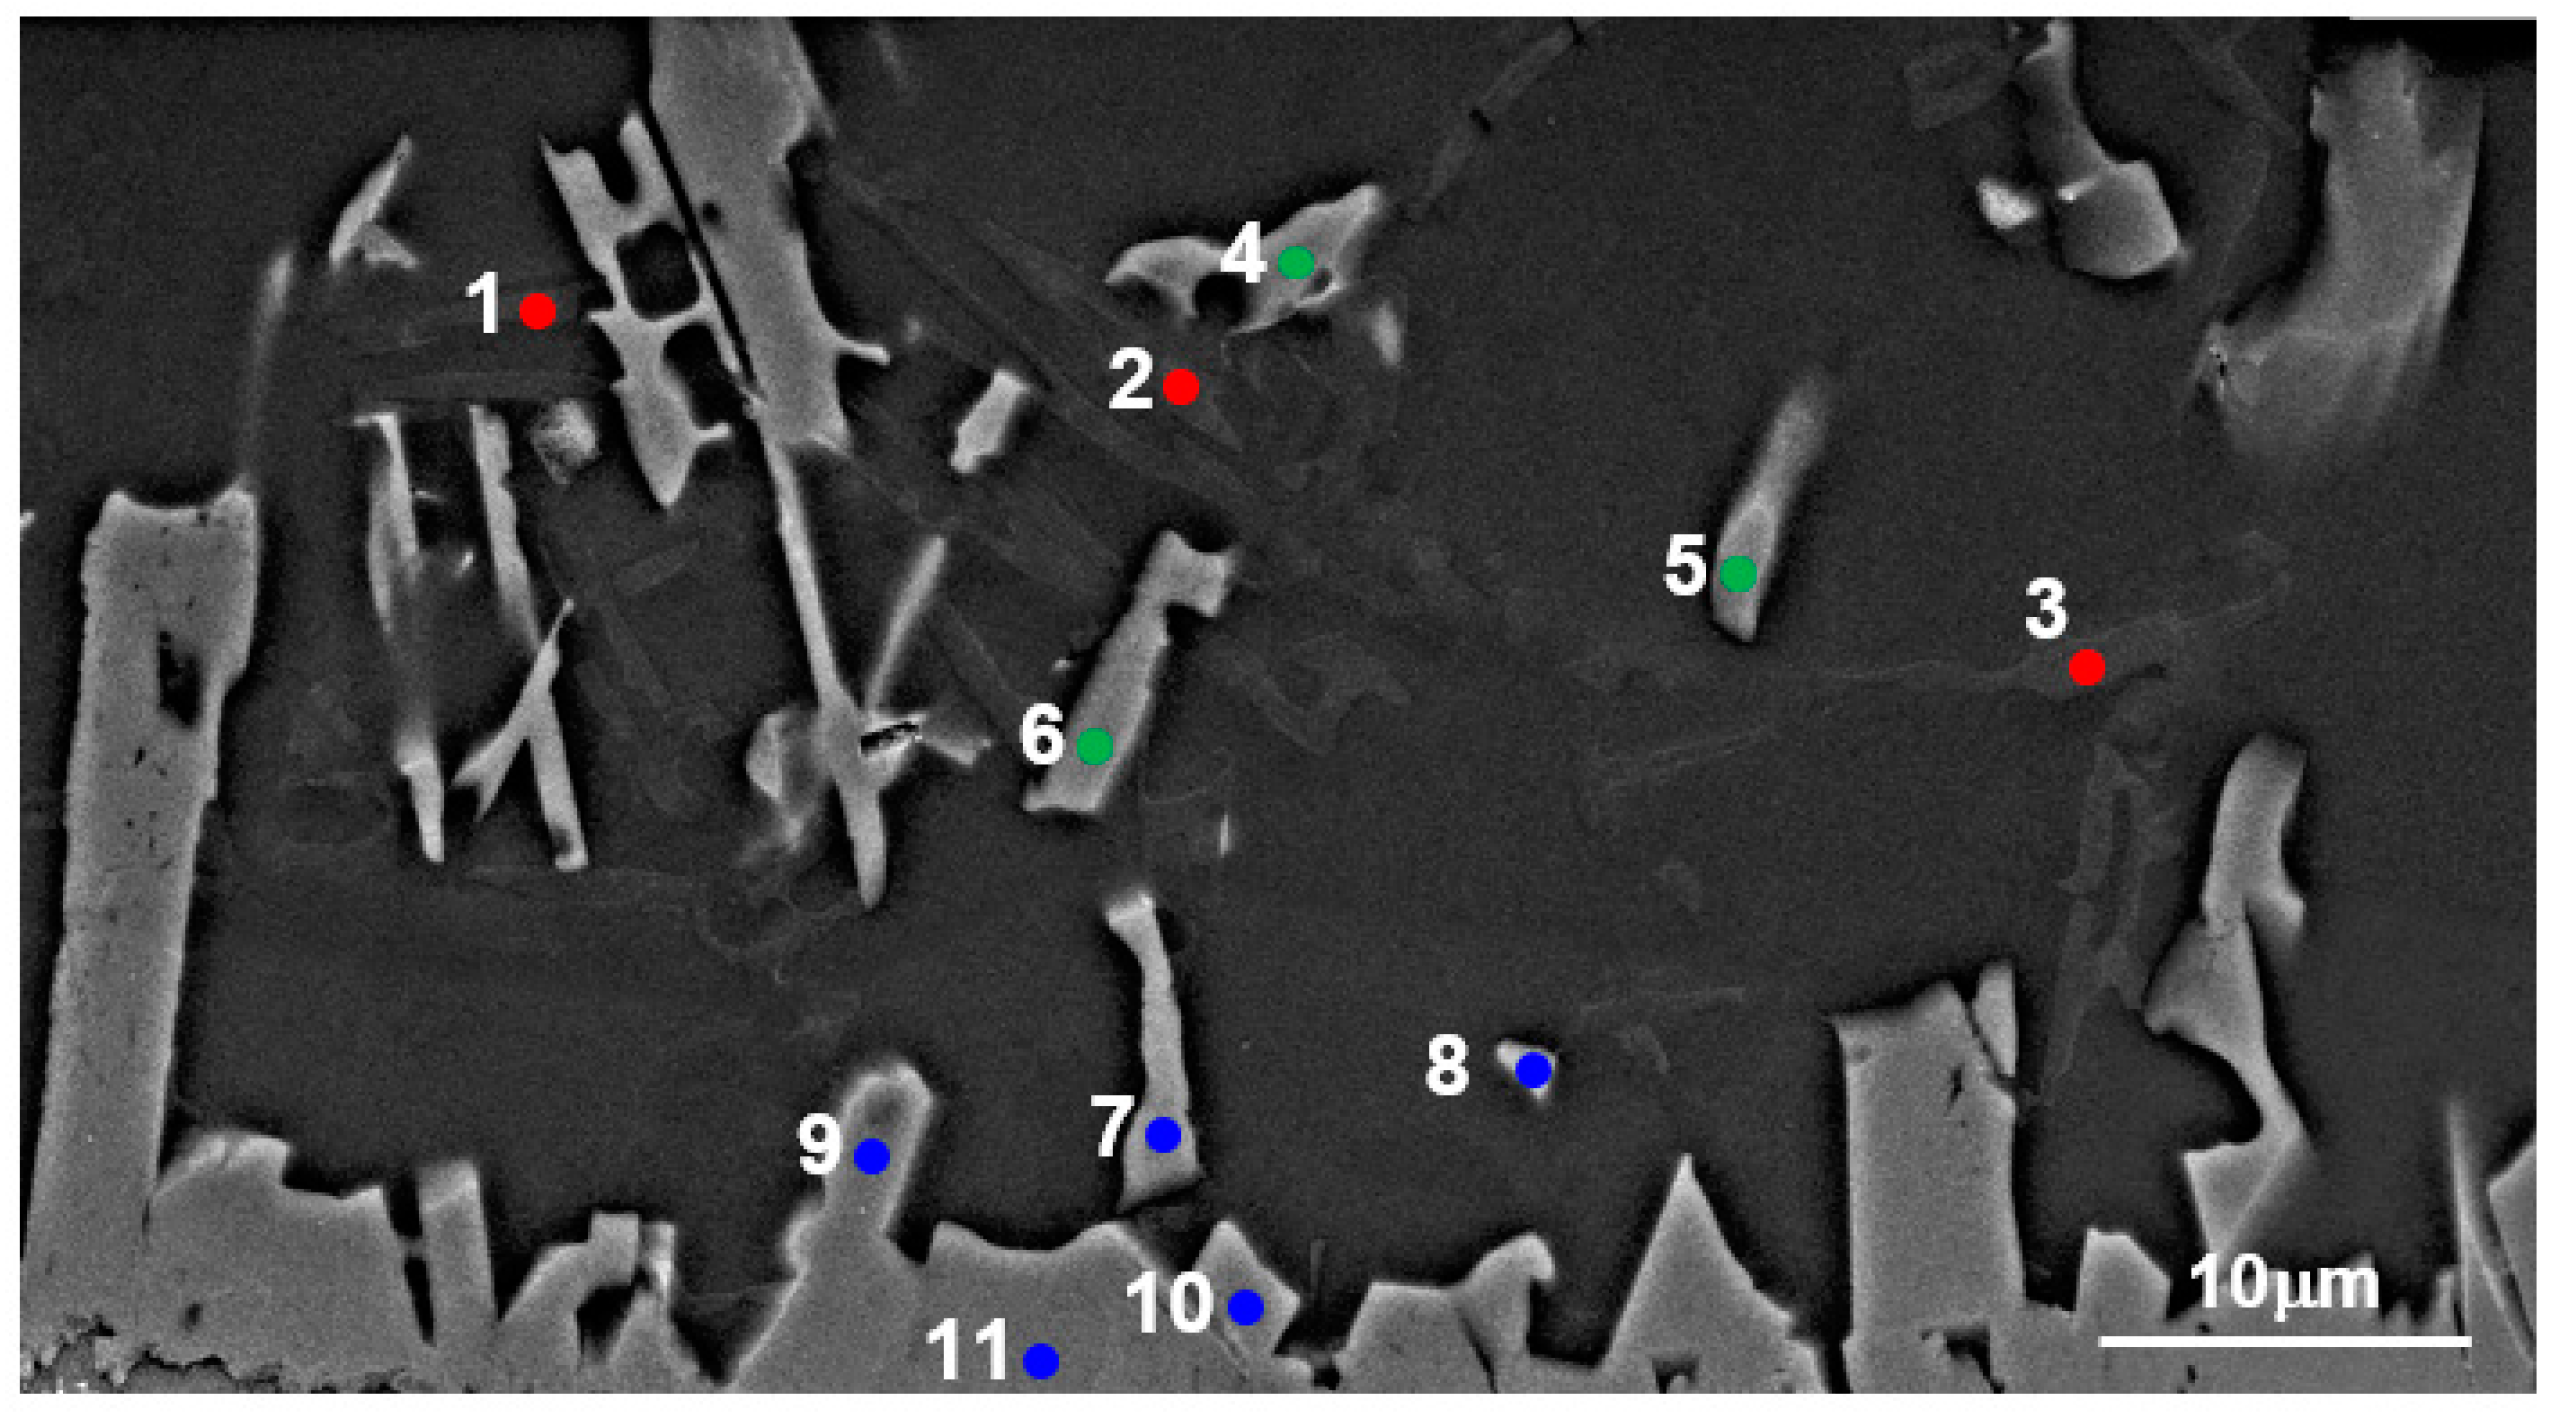
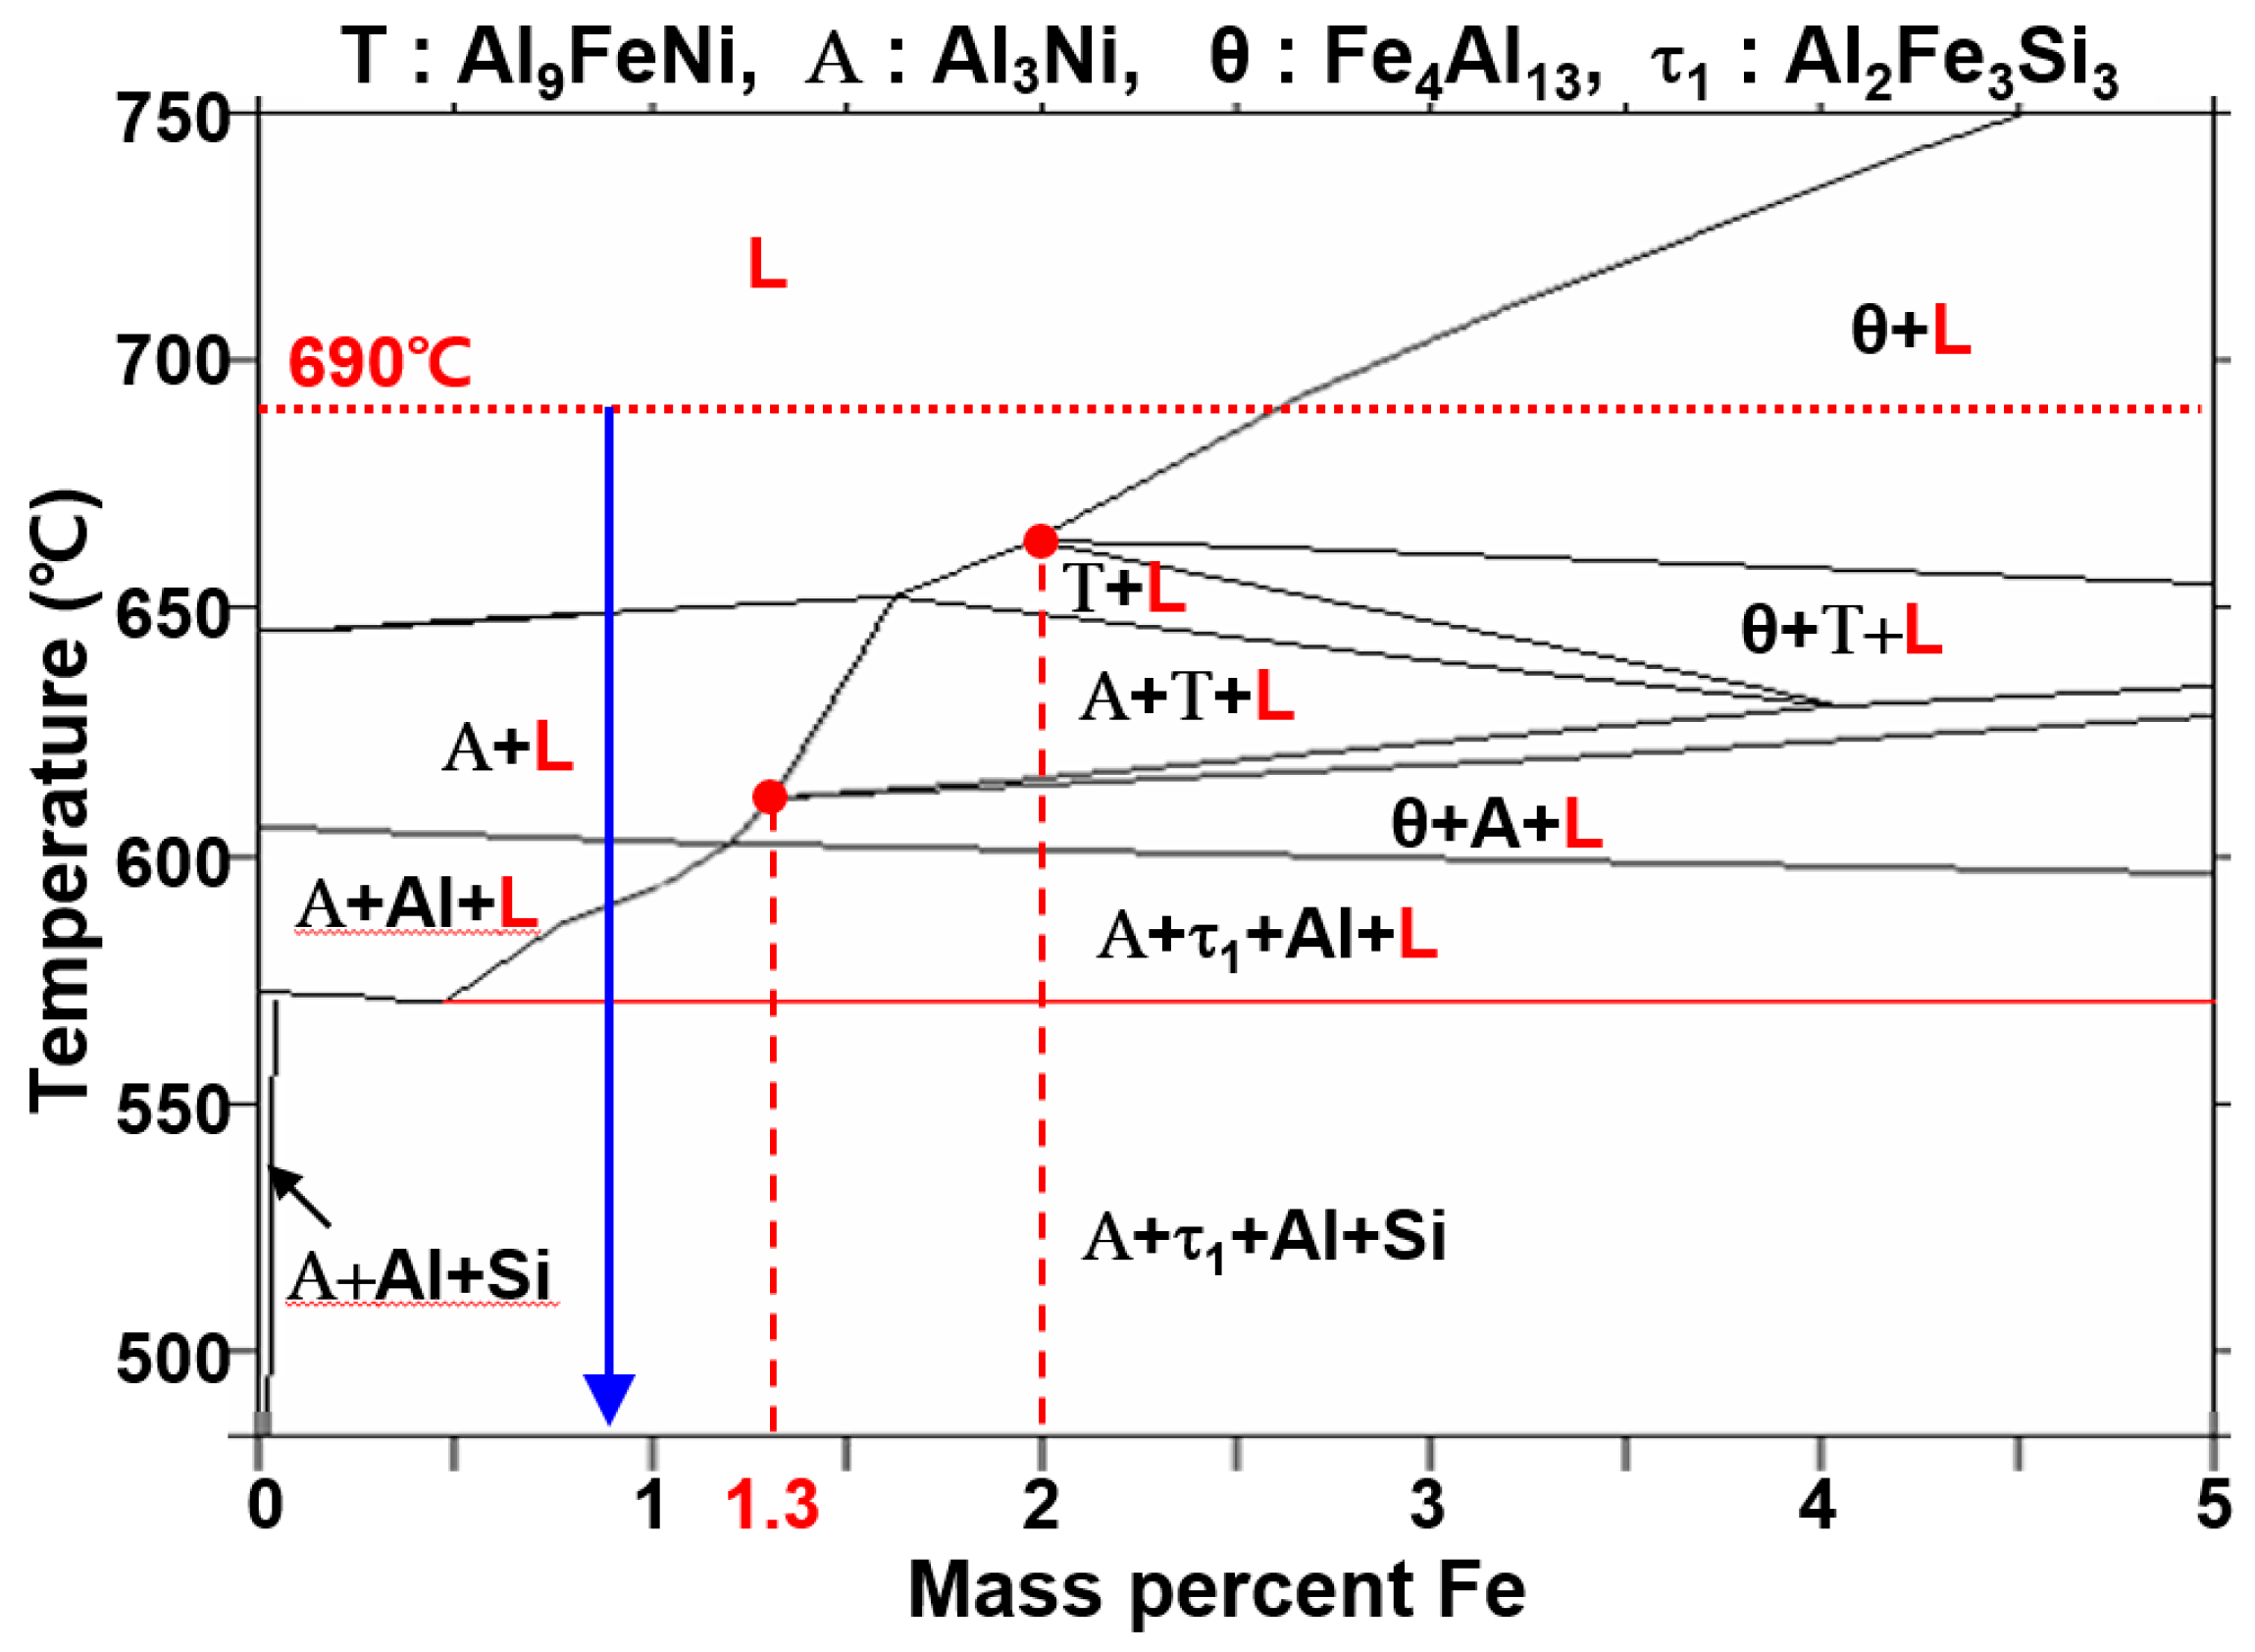
- The solidification layer consisted mainly of Al, Al3Ni, and Si phases, and a small Al9FeNi(T) phase was observed near the reaction layer. By analyzing the solidification process using a phase diagram, it was found that three phases (Al, Al3Ni and Si) were formed in the low Fe concentration region (0.92 wt% of Fe). Moreover, a T phase was formed during cooling in the high Fe concentration region (1.3 wt% of Fe or higher).
- (2)
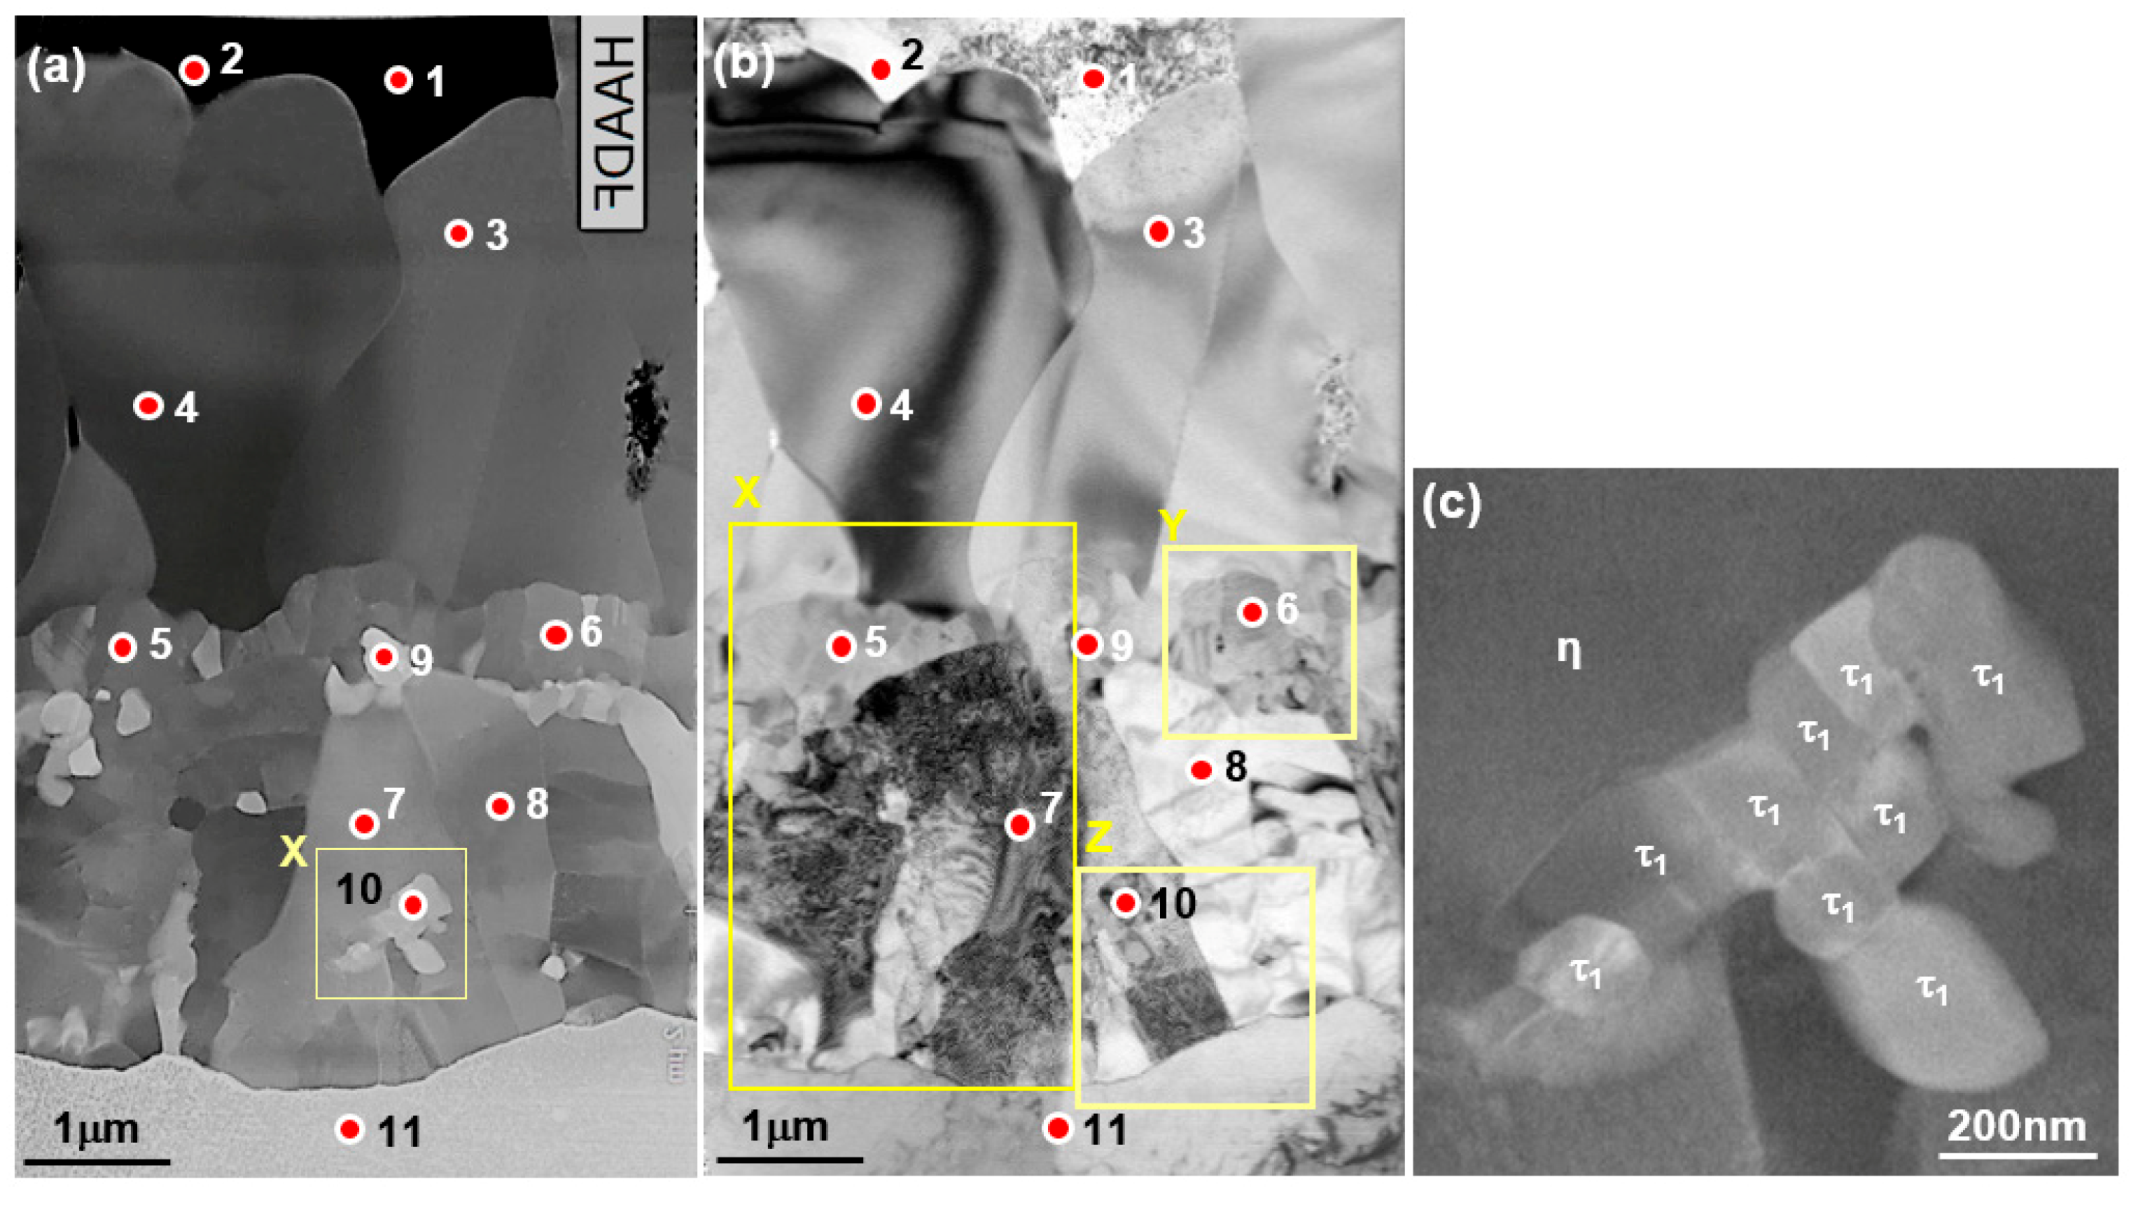
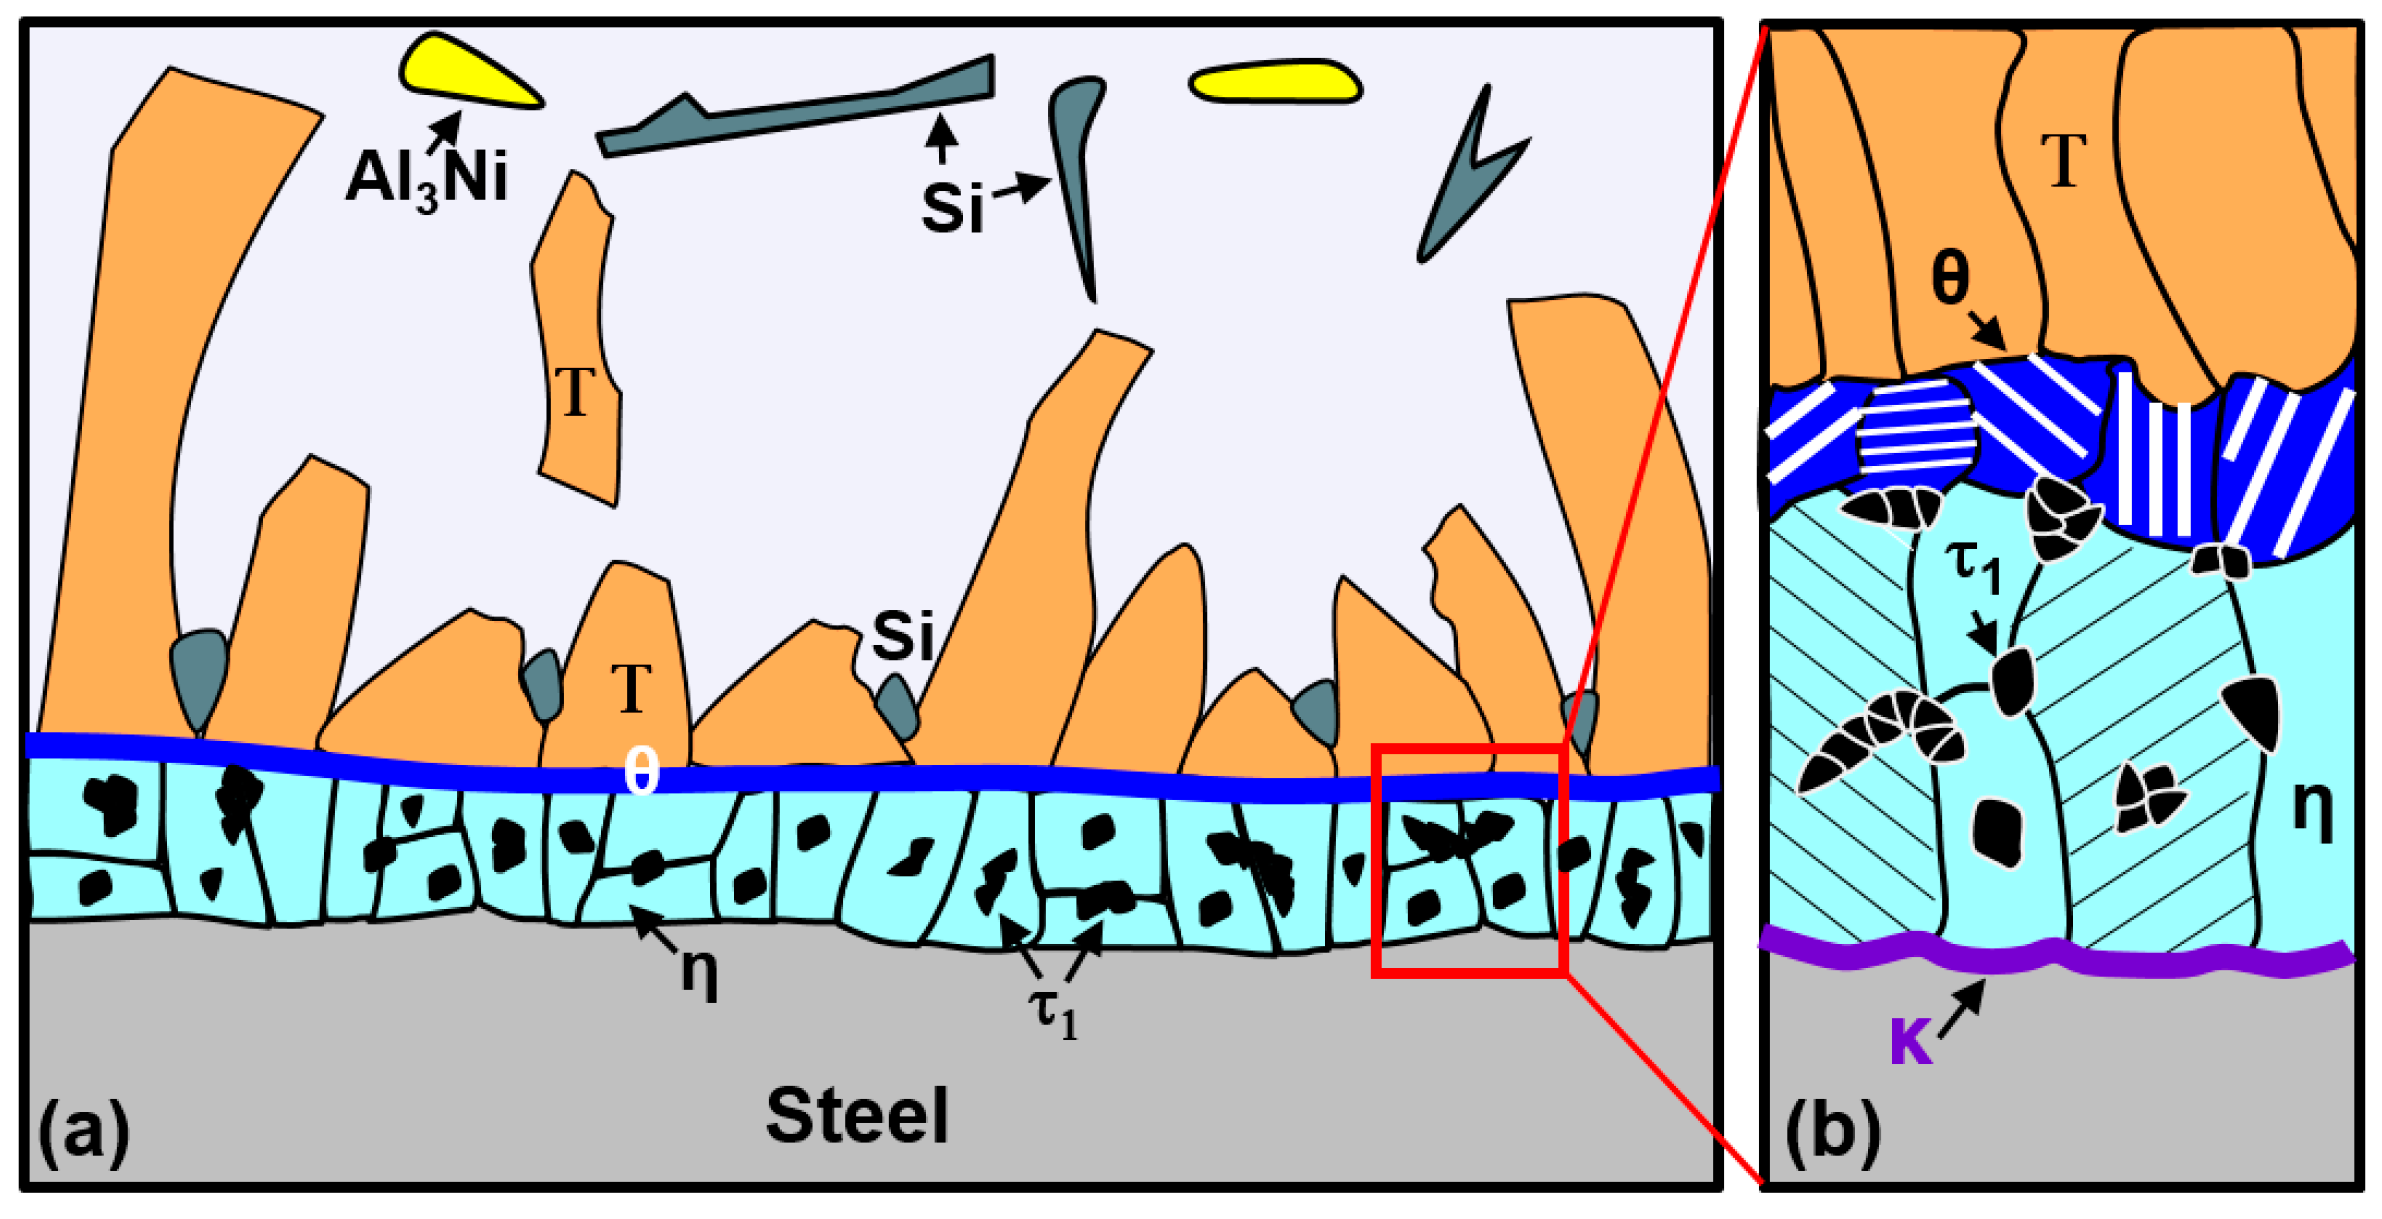
- The reaction layers were formed in the order of Al9FeNi(Τ), Fe4Al13(θ), and Fe2Al5(η) from the solidification side, and the average thicknesses of the phases were 4.7 μm, 500 nm and 2.0 μm, respectively. Moreover, Si was formed around the T phase, and the Fe3AlC(κ) layer was formed at the Fe2Al5(η) layer/steel interface with a thickness of approximately 10–15 nm.
- (3)
- The Al9FeNi(Τ) phase possessed a monoclinic crystal structure (space group: P21/C), and the grains on the side of the solidification layer were larger than those on the side of the base metal. The Fe4Al13(θ) phase possessed a monoclinic crystal structure (space group: C1/m1(12)), the grain diameter was approximately 100–500 nm, and twin formations were present. By analyzing the formation mechanisms using the (Al-7wt%Ni-6wt%Si)-xFe pseudo-binary phase diagram, it was confirmed that Fe4Al13(θ) was formed by the dissolution reaction of Fe in the liquid phase. Moreover, Fe4Al13(θ) can be formed when the Fe concentration exceeds 2.63 wt% in the 690 °C Al-7wt%Ni-6wt%Si molten metal. When the concentration of Fe increased to 10.0–29.0 wt%, isothermal solidification occurred in the Fe4Al13(θ) and Al9FeNi(Τ) phases simultaneously. Moreover, given that the T phase did not dissolve Si, it was discharged, and the Si phase was formed around the T phase.
- (4)
- Fe2Al5(η) was interpreted from the phase diagram as being formed by a diffusion reaction between Fe4Al13(θ) and steel, not a dissolution reaction. Given that the difference in the compositions of Fe4Al13(θ) and Fe2Al5(η) was the smallest, Fe4Al13(θ) was transformed into Fe2Al5(η) by mutual diffusion. This was confirmed by the grain size of Fe4Al13(θ) adjacent to Fe2Al5(η), which was significantly smaller than that of Fe4Al13(θ) adjacent to Al9FeNi(Τ). Moreover, given that Fe4Al13(θ) does not exhibit Si solubility, Si was discharged into Fe2Al5(η) or steel. Hence, Al2Fe3Si3(τ1), which contained a large amount of Si, was precipitated. This is consistent with the formation of Al2Fe3Si3(τ1), especially at the Fe4Al13(θ)/Fe2Al5(η) interface.
- (5)
- The Fe3AlC(κ) layer was formed by carbon accumulation that discharged in the Fe2Al5(η) region transformed from steel to Fe2Al5(η).
- (6)
- The twin formations in the Fe4Al13(θ) and Fe2Al5(η) grains were due to strains caused by the lattice transformation (Al9FeNi(Τ)→Fe4Al13(θ), Fe4Al13(θ)→Fe2Al5(η)) in the constrained state, wherein these phases were present between the Al9FeNi(Τ) layer and steel.
Author Contributions
Funding
Conflicts of Interest
References
- Aranda, L.G.; Ravier, P.; Chastel, Y. Hot Stamping of Quenchable Steels: Material Data and Process Simulations. In Proceedings of the IDDRG, Bled, Slovenia, 11–14 May 2003; pp. 164–166. [Google Scholar]
- Vaissiere, L.; Laurent, J.; Reinhardt, A. Development of Pre-Coated Boron Steel for Applications on psa Peugeot Citroen and Renault Bodies in White. SAE Tech. Pap. 2002. [Google Scholar] [CrossRef]
- Mega, T.; Hasegawa, K.; Kawabe, H. Ultra high-strength steel sheets for bodies, reinforcement parts, and seat frame parts of automobile—Ultra high-strength steel sheets leading to great improvement in crash-worthiness. JFE Tech. Rep. 2004, 4, 38–43. [Google Scholar]
- Kolleck, R.; Veit, R.; Merklein, M.; Lechler, J.; Geiger, M. Investigation on induction heating for hot stamping of boron alloyed steels. CIRP Ann. 2009, 58, 275–278. [Google Scholar] [CrossRef]
- Liu, H.; Xing, Z.; Bao, J.; Song, B. Investigation of the hot-stamping process for advanced high-strength steel sheet by numerical simulation. J. Mater. Eng. Perform. 2010, 19, 325–334. [Google Scholar] [CrossRef]
- Kobayashi, S.; Yakou, T. Control of intermetallic compound layers at interface between steel and aluminum by diffusion-treatment. Mater. Sci. Eng. A 2002, 338, 44–53. [Google Scholar] [CrossRef]
- Chang, Y.-Y.; Tsaur, C.-C.; Rock, J.C. Microstructure studies of an aluminide coating on 9Cr-1Mo steel during high temperature oxidation. Surf. Coat. Technol. 2006, 200, 6588–6593. [Google Scholar] [CrossRef]
- Wang, C.-J.; Chen, S.-M. The high-temperature oxidation behavior of hot-dipping Al–Si coating on low carbon steel. Surf. Coat. Technol. 2006, 200, 6601–6605. [Google Scholar] [CrossRef]
- Jarnverk Ab, N. Manufacturing of a hardened steel article. UK Patent GB1490535, 2 November 1977. [Google Scholar]
- Ehling, W.; Cretteur, L.; Pic, A.; Vierstraete, R.; Yin, Q. Development of a Laser Decoating Process for Fully Functional al-si Coated Press Hardened Steel Laser Welded Blank Solutions. In Proceedings of the 5th International WLT-Conference on Lasers in Manufacturing 2009, Munich, Germany, 15–18 June 2009; p. 6. [Google Scholar]
- Jung, B.-H.; Kong, J.-P.; Kang, C.-Y. Effect of hot-stamping heat treatment on microstructure and hardness in TWB laser joints of Al-Si-coated boron steel and Zn-coated DP steel. Korean J. Metals Mater. 2012, 50, 224–232. [Google Scholar]
- Oh, M.-H.; Kong, J.-P.; Kwon, M.-S.; Kang, C.-Y. Effect of hot-stamping on microstructures and tensile properties of Al-Si coated boron steel welds with laser source. J. Weld. Join. 2013, 31, 96–106. [Google Scholar] [CrossRef]
- Yoon, T.-J.; Oh, M.-H.; Shin, H.-J.; Kang, C.-Y. Comparison of microstructure and phase transformation of laser-welded joints in Al-10wt% Si-coated boron steel before and after hot stamping. Mater. Charact. 2017, 128, 195–202. [Google Scholar] [CrossRef]
- Kwak, S.-Y.; Yun, J.-G.; Lee, J.-H.; Shin, D.-I.; Kang, C.-Y. Identification of intermetallic compounds and its formation mechanism in boron steel hot-dipped in Al-7 wt.% Mn alloy. Coatings 2017, 7, 222. [Google Scholar] [CrossRef]
- Lee, J.-H.; Yun, J.-G.; Kwak, S.-Y.; Kang, C.-Y. Nucleation and growth of intermetallic compounds formed in boron steel hot-dipped in Al–Ni alloy. Coatings 2017, 7, 195. [Google Scholar] [CrossRef]
- Eggeler, G.; Auer, W.; Kaesche, H. On the influence of silicon on the growth of the alloy layer during hot dip aluminizing. J. Mater. Sci. 1986, 21, 3348–3350. [Google Scholar] [CrossRef]
- Akdeniz, M.V.; Mekhrabov, A.O.; Yilmaz, T. The role of si addition on the interfacial interaction in Fe-Al diffusion layer. Scr. Metall. Mater. 1994, 31, 1723–1728. [Google Scholar] [CrossRef]
- Shady, M.; El-Sissi, A.; Attia, A.; El-Mahallawy, N.; Taha, M.; Reif, W. On the technological properties of steel strips aluminized in Al-Si baths. J. Mater. Sci. Lett. 1996, 15, 1032–1036. [Google Scholar] [CrossRef]
- Heumann, T.; Dittrich, S. Uber die kinetik der reaktion von festem und flûssigem aluminium mit eisen. Z. Metall. 1959, 50, 617–625. [Google Scholar]
- Lemmens, B.; Springer, H.; Duarte, M.J.; De Graeve, I.; De Strycker, J.; Raabe, D.; Verbeken, K. Atom probe tomography of intermetallic phases and interfaces formed in dissimilar joining between Al alloys and steel. Mater. Charact. 2016, 120, 268–272. [Google Scholar] [CrossRef]
- Shankar, S.; Apelian, D. Die soldering: Mechanism of the interface reaction between molten aluminum alloy and tool steel. Metall. Mater. Trans. B 2002, 33, 465–476. [Google Scholar] [CrossRef]
- Zhang, K.; Bian, X.; Li, Y.; Liu, Y.; Yang, C. New evidence for the formation and growth mechanism of the intermetallic phase formed at the Al/Fe interface. J. Mater. Res. 2013, 28, 3279–3287. [Google Scholar] [CrossRef]
- Lemmens, B.; Springer, H.; De Graeve, I.; De Strycker, J.; Raabe, D.; Verbeken, K. Effect of silicon on the microstructure and growth kinetics of intermetallic phases formed during hot-dip aluminizing of ferritic steel. Surf. Coat. Technol. 2017, 104–109. [Google Scholar] [CrossRef]
- Yun, J.-G.; Lee, J.-H.; Kwak, S.-Y.; Kang, C.-Y. Study on the formation of reaction phase to Si addition in boron steel hot-dipped in Al–7Ni alloy. Coatings 2017, 7, 186. [Google Scholar] [CrossRef]
- Handbook, A. Alloy phase diagrams. ASM Int. 1992, 3, 2–319. [Google Scholar]
- Cheng, W.-J.; Wang, C.-J. Microstructural evolution of intermetallic layer in hot-dipped aluminide mild steel with silicon addition. Surf. Coat. Technol. 2011, 205, 4726–4731. [Google Scholar] [CrossRef]
- Springer, H.; Kostka, A.; Payton, E.; Raabe, D.; Kaysser-Pyzalla, A.; Eggeler, G. On the formation and growth of intermetallic phases during interdiffusion between low-carbon steel and aluminum alloys. Acta Mater. 2011, 59, 1586–1600. [Google Scholar] [CrossRef]
- Gui, Z.-X.; Liang, W.-K.; Liu, Y.; Zhang, Y.-S. Thermo-mechanical behavior of the Al–Si alloy coated hot stamping boron steel. Mater. Des. 2014, 60, 26–33. [Google Scholar] [CrossRef]
- Shin, D.; Lee, J.-Y.; Heo, H.; Kang, C.-Y. Formation procedure of reaction phases in Al hot dipping process of steel. Metals 2018, 8, 820. [Google Scholar] [CrossRef]
- Takata, N.; Nishimoto, M.; Kobayashi, S.; Takeyama, M. Crystallography of Fe2Al5 phase at the interface between solid Fe and liquid Al. Intermetallics 2015, 67, 1–11. [Google Scholar] [CrossRef]
- Pearson, W.B. A handbook of Lattice Spacings and Structures of Metals and Alloys—2; Pergamon: London, UK, 1967. [Google Scholar]
- Black, P. The structure of FeAl3. II. Acta Crystallogr. 1955, 8, 175–182. [Google Scholar] [CrossRef] [Green Version]


| C | Si | Mn | Cr | Nb | Ti | B | P | S | Fe |
|---|---|---|---|---|---|---|---|---|---|
| 0.2285 | 0.2383 | 1.1890 | 0.1833 | 0.0036 | 0.0363 | 0.0023 | 0.0015 | 0.0015 | Bal. |
| No. | at%/wt% | Al | Ni | Si | Fe | Phase |
|---|---|---|---|---|---|---|
| 1 | at% | 11.5 | - | 88.5 | - | Si |
| wt% | 11.1 | - | 88.9 | - | ||
| 2 | at% | 5.3 | - | 94.7 | - | Si |
| wt% | 5.1 | - | 94.9 | - | ||
| 3 | at% | 6.0 | - | 94.0 | - | Si |
| wt% | 5.8 | - | 94.2 | - | ||
| 4 | at% | 82.5 | 15.9 | 1.1 | 0.5 | Al3Ni |
| wt% | 69.2 | 28.9 | 0.9 | 1.0 | ||
| 5 | at% | 87.9 | 10.2 | 1.5 | 0.4 | Al3Ni |
| wt% | 78.1 | 19.8 | 1.4 | 0.7 | ||
| 6 | at% | 84.4 | 12.8 | 2.1 | 0.7 | Al3Ni |
| wt% | 72.8 | 24.1 | 1.9 | 1.2 | ||
| 7 | at% | 80.2 | 12.7 | 3.1 | 4.0 | Al9FeNi(T) |
| wt% | 67.2 | 23.1 | 2.7 | 7.0 | ||
| 8 | at% | 81.5 | 13.0 | 1.0 | 4.5 | Al9FeNi(T) |
| wt% | 67.8 | 23.5 | 0.9 | 7.8 | ||
| 9 | at% | 78.2 | 11.4 | 3.5 | 6.9 | Al9FeNi(T) |
| wt% | 64.7 | 0.5 | 3.0 | 11.8 | ||
| 10 | at% | 80.1 | 10.3 | 2.1 | 7.5 | Al9FeNi(T) |
| wt% | 66.7 | 18.5 | 1.8 | 13.0 | ||
| 11 | at% | 78.5 | 8.9 | 3.1 | 9.5 | Al9FeNi(T) |
| wt% | 65.0 | 16.0 | 2.7 | 16.3 |
| No. | at%/wt% | Al | Ni | Si | Fe | Phase |
|---|---|---|---|---|---|---|
| 1 | at% | 79.0 | 14.3 | 0.6 | 6.1 | Al9FeNi(T) |
| wt% | 64.0 | 25.1 | 0.5 | 10.4 | ||
| 2 | at% | 63.6 | 0.5 | 2.9 | 33.0 | Fe4Al13(θ) or Fe2Al5(η) |
| wt% | 46.8 | 0.7 | 2.2 | 50.3 | ||
| 3 | at% | 38.9 | - | 18.5 | 42.6 | Al2Fe3Si3(τ1) |
| wt% | 26.5 | - | 13.2 | 60.3 | ||
| 4 | at% | 58.5 | 0.1 | 3.3 | 38.1 | Fe4Al13(θ) or Fe2Al5(η) |
| wt% | 41.5 | 0.1 | 2.5 | 55.9 | ||
| 5 | at% | 0.1 | 1.3 | 1.0 | 97.6 | Fe |
| wt% | 0.2 | 1.2 | 2.0 | 96.6 |
| No. | at%/wt% | Al | Ni | Si | Fe | Phase |
|---|---|---|---|---|---|---|
| 1 | at% | 98.5 | 0.3 | 1.0 | 0.2 | Al |
| wt% | 98.0 | 0.6 | 1.0 | 0.4 | ||
| 2 | at% | 5.3 | 1.1 | 93.5 | 0.1 | Si |
| wt% | 5.1 | 2.3 | 92.5 | 0.1 | ||
| 3 | at% | 79.7 | 11.6 | 1.7 | 7.0 | Al9FeNi(T) |
| wt% | 65.8 | 20.9 | 1.4 | 11.9 | ||
| 4 | at% | 79.5 | 10.7 | 1.8 | 8.0 | Al9FeNi(T) |
| wt% | 65.5 | 19.3 | 1.5 | 13.7 | ||
| 5 | at% | 73.1 | 0.1 | 3.6 | 23.2 | Fe4Al13(θ) |
| wt% | 58.4 | 0.2 | 3.1 | 38.3 | ||
| 6 | at% | 72.2 | - | 4.1 | 23.7 | Fe4Al13(θ) |
| wt% | 57.5 | - | 3.4 | 39.1 | ||
| 7 | at% | 71.6 | - | 2.6 | 25.8 | Fe2Al5(η) |
| wt% | 56.1 | - | 2.1 | 41.8 | ||
| 8 | at% | 71.8 | - | 1.7 | 26.5 | Fe2Al5(η) |
| wt% | 56.0 | - | 1.4 | 42.6 | ||
| 9 | at% | 32.6 | - | 31.7 | 35.7 | Al2Fe3Si3(τ1) |
| wt% | 23.4 | - | 23.6 | 53.0 | ||
| 10 | at% | 39.3 | - | 24.1 | 36.6 | Al2Fe3Si3(τ1) |
| wt% | 28.0 | - | 17.9 | 54.1 | ||
| 11 | at% | 0.7 | 0.6 | 0.8 | 97.9 | Fe |
| wt% | 0.3 | 0.7 | 0.4 | 98.6 |
| Phase at 690 °C | at%/wt% | Al | Ni | Si | Fe |
|---|---|---|---|---|---|
| T - Al9FeNi | at% | 81.9 | 7.6 | - | 10.5 |
| wt% | 68.0 | 13.8 | - | 18.2 | |
| θ1 - Fe4Al13 | at% | 76.1 | 3.9 | - | 20.0 |
| wt% | 60.4 | 6.7 | - | 32.9 | |
| θ2 - Fe4Al13 | at% | 73.3 | - | 3.3 | 23.4 |
| wt% | 58.6 | - | 2.7 | 38.7 | |
| η - Fe2Al5 | at% | 68.9 | 1.4 | 2.8 | 26.9 |
| wt% | 52.7 | 2.4 | 2.2 | 42.7 | |
| β - FeAl | at% | 41.8 | 2.8 | 11.7 | 43.7 |
| wt% | 27.8 | 4.0 | 8.1 | 60.1 | |
| τ1 - Al2Fe3Si3 | at% | 63.1 | - | 14.7 | 22.2 |
| wt% | 50.8 | - | 12.2 | 37.0 |
© 2018 by the authors. Licensee MDPI, Basel, Switzerland. This article is an open access article distributed under the terms and conditions of the Creative Commons Attribution (CC BY) license (http://creativecommons.org/licenses/by/4.0/).
Share and Cite
Lee, J.-Y.; Heo, H.; Kang, N.; Kang, C.-Y. Microstructural Evolution of Reaction Layer of 1.5 GPa Boron Steel Hot-Dipped in Al-7wt%Ni-6wt%Si Alloy. Metals 2018, 8, 1069. https://doi.org/10.3390/met8121069
Lee J-Y, Heo H, Kang N, Kang C-Y. Microstructural Evolution of Reaction Layer of 1.5 GPa Boron Steel Hot-Dipped in Al-7wt%Ni-6wt%Si Alloy. Metals. 2018; 8(12):1069. https://doi.org/10.3390/met8121069
Chicago/Turabian StyleLee, Jeong-Yong, Hoejun Heo, Namhyun Kang, and Chung-Yun Kang. 2018. "Microstructural Evolution of Reaction Layer of 1.5 GPa Boron Steel Hot-Dipped in Al-7wt%Ni-6wt%Si Alloy" Metals 8, no. 12: 1069. https://doi.org/10.3390/met8121069