Article

Annealing Behavior of Surface-Locally Cold-Deformed Low-Carbon Steel with a Large Strain Gradient

1
School of Metallurgical and Ecological Engineering, University of Science and Technology Beijing (USTB), Beijing 100083, China
2
Division of Materials Science and Engineering, Faculty of Engineering, Hokkaido University, Kita 13 Nishi 8, Kita-ku, Sapporo, Hokkaido 060-8628, Japan
*
Author to whom correspondence should be addressed.
Metals 2018, 8(11), 976; https://doi.org/10.3390/met8110976
Submission received: 23 October 2018 / Revised: 11 November 2018 / Accepted: 16 November 2018 / Published: 21 November 2018

Abstract

:
The annealing behavior of surface-locally cold-deformed 0.2 mass% carbon steel with a large strain gradient was investigated, with special attention paid to the change in grain size. The surface local deformation was introduced by a ball-dropping (BD) model experiment. The local plastic strain profile evaluated from pure iron was used to confirm the occurrence of surface local deformation. It was found that the BD test led to severe local deformation near the surface, with a large strain gradient. Both the ferrite and as-transformed austenite exhibited a gradual change in grain size along the depth direction after annealing. The increased nucleation density of austenite in the deformed surface layer is not attributed to the increase in the density of the recrystallized ferrite–ferrite grain boundaries, but rather to the broken and dispersed cementite particles introduced by the deformation. The gradual change in ferrite and austenite grain size should be attributed to be the gradual change in the deformation degree of ferrite and perlite.

1. Introduction

Material failures such as fatigue, fretting, damage, and wear, usually originate from the exterior layers of the work piece. These phenomena are extremely sensitive to the structure and properties of the material surface. Therefore, it is of technological importance to control the surface microstructure. Surface local plastic deformation (SLPD) processes, such as ball milling [1,2] and high-energy shot peening [3], which are characterized by high strain rates, have been widely utilized in industrial processes. In the authors’ previous study [4], it was found that high strain rates lead to large strain gradients and severe plastic deformation near the surface.
A cold-worked specimen, being in a state of higher energy, is thermodynamically unstable. During annealing, the cold-worked specimen tends to transform to states of lower energies through a sequence of recovery, recrystallization, and grain growth processes with microstructural changes [5]. In addition, ferrite-to-austenite transformation occurs at high annealing temperatures. The degree of local plastic deformation may strongly influence the development of grain structure in recrystallization, and the ferrite-to-austenite transformation kinetics during heat treatment processes. Hence, it is important to understand the annealing behavior of the steels with strain gradient.
Previous works were mainly focused on the ferrite recrystallization and ferrite-to-austenite transformation behaviors in globally cold-deformed steels with uniform strain, [6,7,8,9,10,11,12,13,14,15,16] or un-deformed steels [17]. Little attention has been paid to the influences of gradual change in local plastic strain within a thin deformed surface layer. Beswick [13] investigated the effect of cold deformation on ferrite-to-austenite transformation in a 1.0C-1.5Cr (mass%) bearing steel. It was found that the temperatures for the start (Ac1) and end (Ac3) of the ferrite-to-austenite transformation were lowered due to cold work. The prior cold deformation resulted in a refinement of the austenite grain size. However, the annealing behavior of cold-deformed carbon steels with a large strain gradient within a thin deformed surface layer has rarely been studied. For example, it is unclear how the strain gradient field affects ferrite recrystallization and ferrite-to-austenite transformation during annealing in such a thin surface layer. The purpose of this study was to clarify the effects of a large strain gradient near the surface of carbon steel on ferrite recrystallization and ferrite-to-austenite transformation during annealing, with special attention paid to the change in grain size.
The surface local deformation in this study was introduced using a ball-dropping (BD) test with a high strain rate. The local plastic strain distribution, evaluated from pure iron by means of an electron backscatter diffraction (EBSD) analysis, was used to confirm the occurrence of surface local deformation. To evaluate the local plastic strain, it is necessary to obtain the misorientation inside each grain. The microstructure of low-carbon steel is complex, and is composed of ferrite and perlite aggregates. The orientations of the interlamellar pearlitic ferrite within each pearlite block varies greatly, even without deformation [18]. Therefore, it is difficult to evaluate local plastic strain within the perlite regions. In the authors’ previous study [4], the local plastic strain distribution was successfully measured by means of an EBSD analysis of pure iron of single ferrite structure. The quantitative relationship between the misorientation and plastic strain has been obtained, and can be applied in the present study. Therefore, it is convenient to evaluate the local plastic strain in pure iron.
According to Karlsson and Linden’s work [19], the ferrite matrix is continuous in carbon steels with a carbon content lower than 0.4–0.5 mass%. It was found that the ferrite, pearlitic ferrite, and even cementite were all plastically deformed when applying cold deformation (10%) in low-carbon steel with a continuous ferrite matrix [19]. In addition, the previous work [4] revealed that the strain gradient is mainly determined by the strain rate at a given overall strain. Therefore, by applying the same deformation conditions (same strain rate and overall strain), the surface local deformation can be induced in the 0.2 mass% carbon steel as well, although the local plastic strain profile may not be the same between the two materials. Moreover, the overall strain gradient evaluated from the single ferrite structure of pure iron can be taken as a reference to help understand the deformation and annealing behavior of the 0.2 mass% carbon steel.
As is shown in the following sections, the present study demonstrated that the high strain rate ball-dropping test produced a surface local deformation. Both the ferrite and as-transformed austenite structures exhibited a gradual change in grain size after annealing.

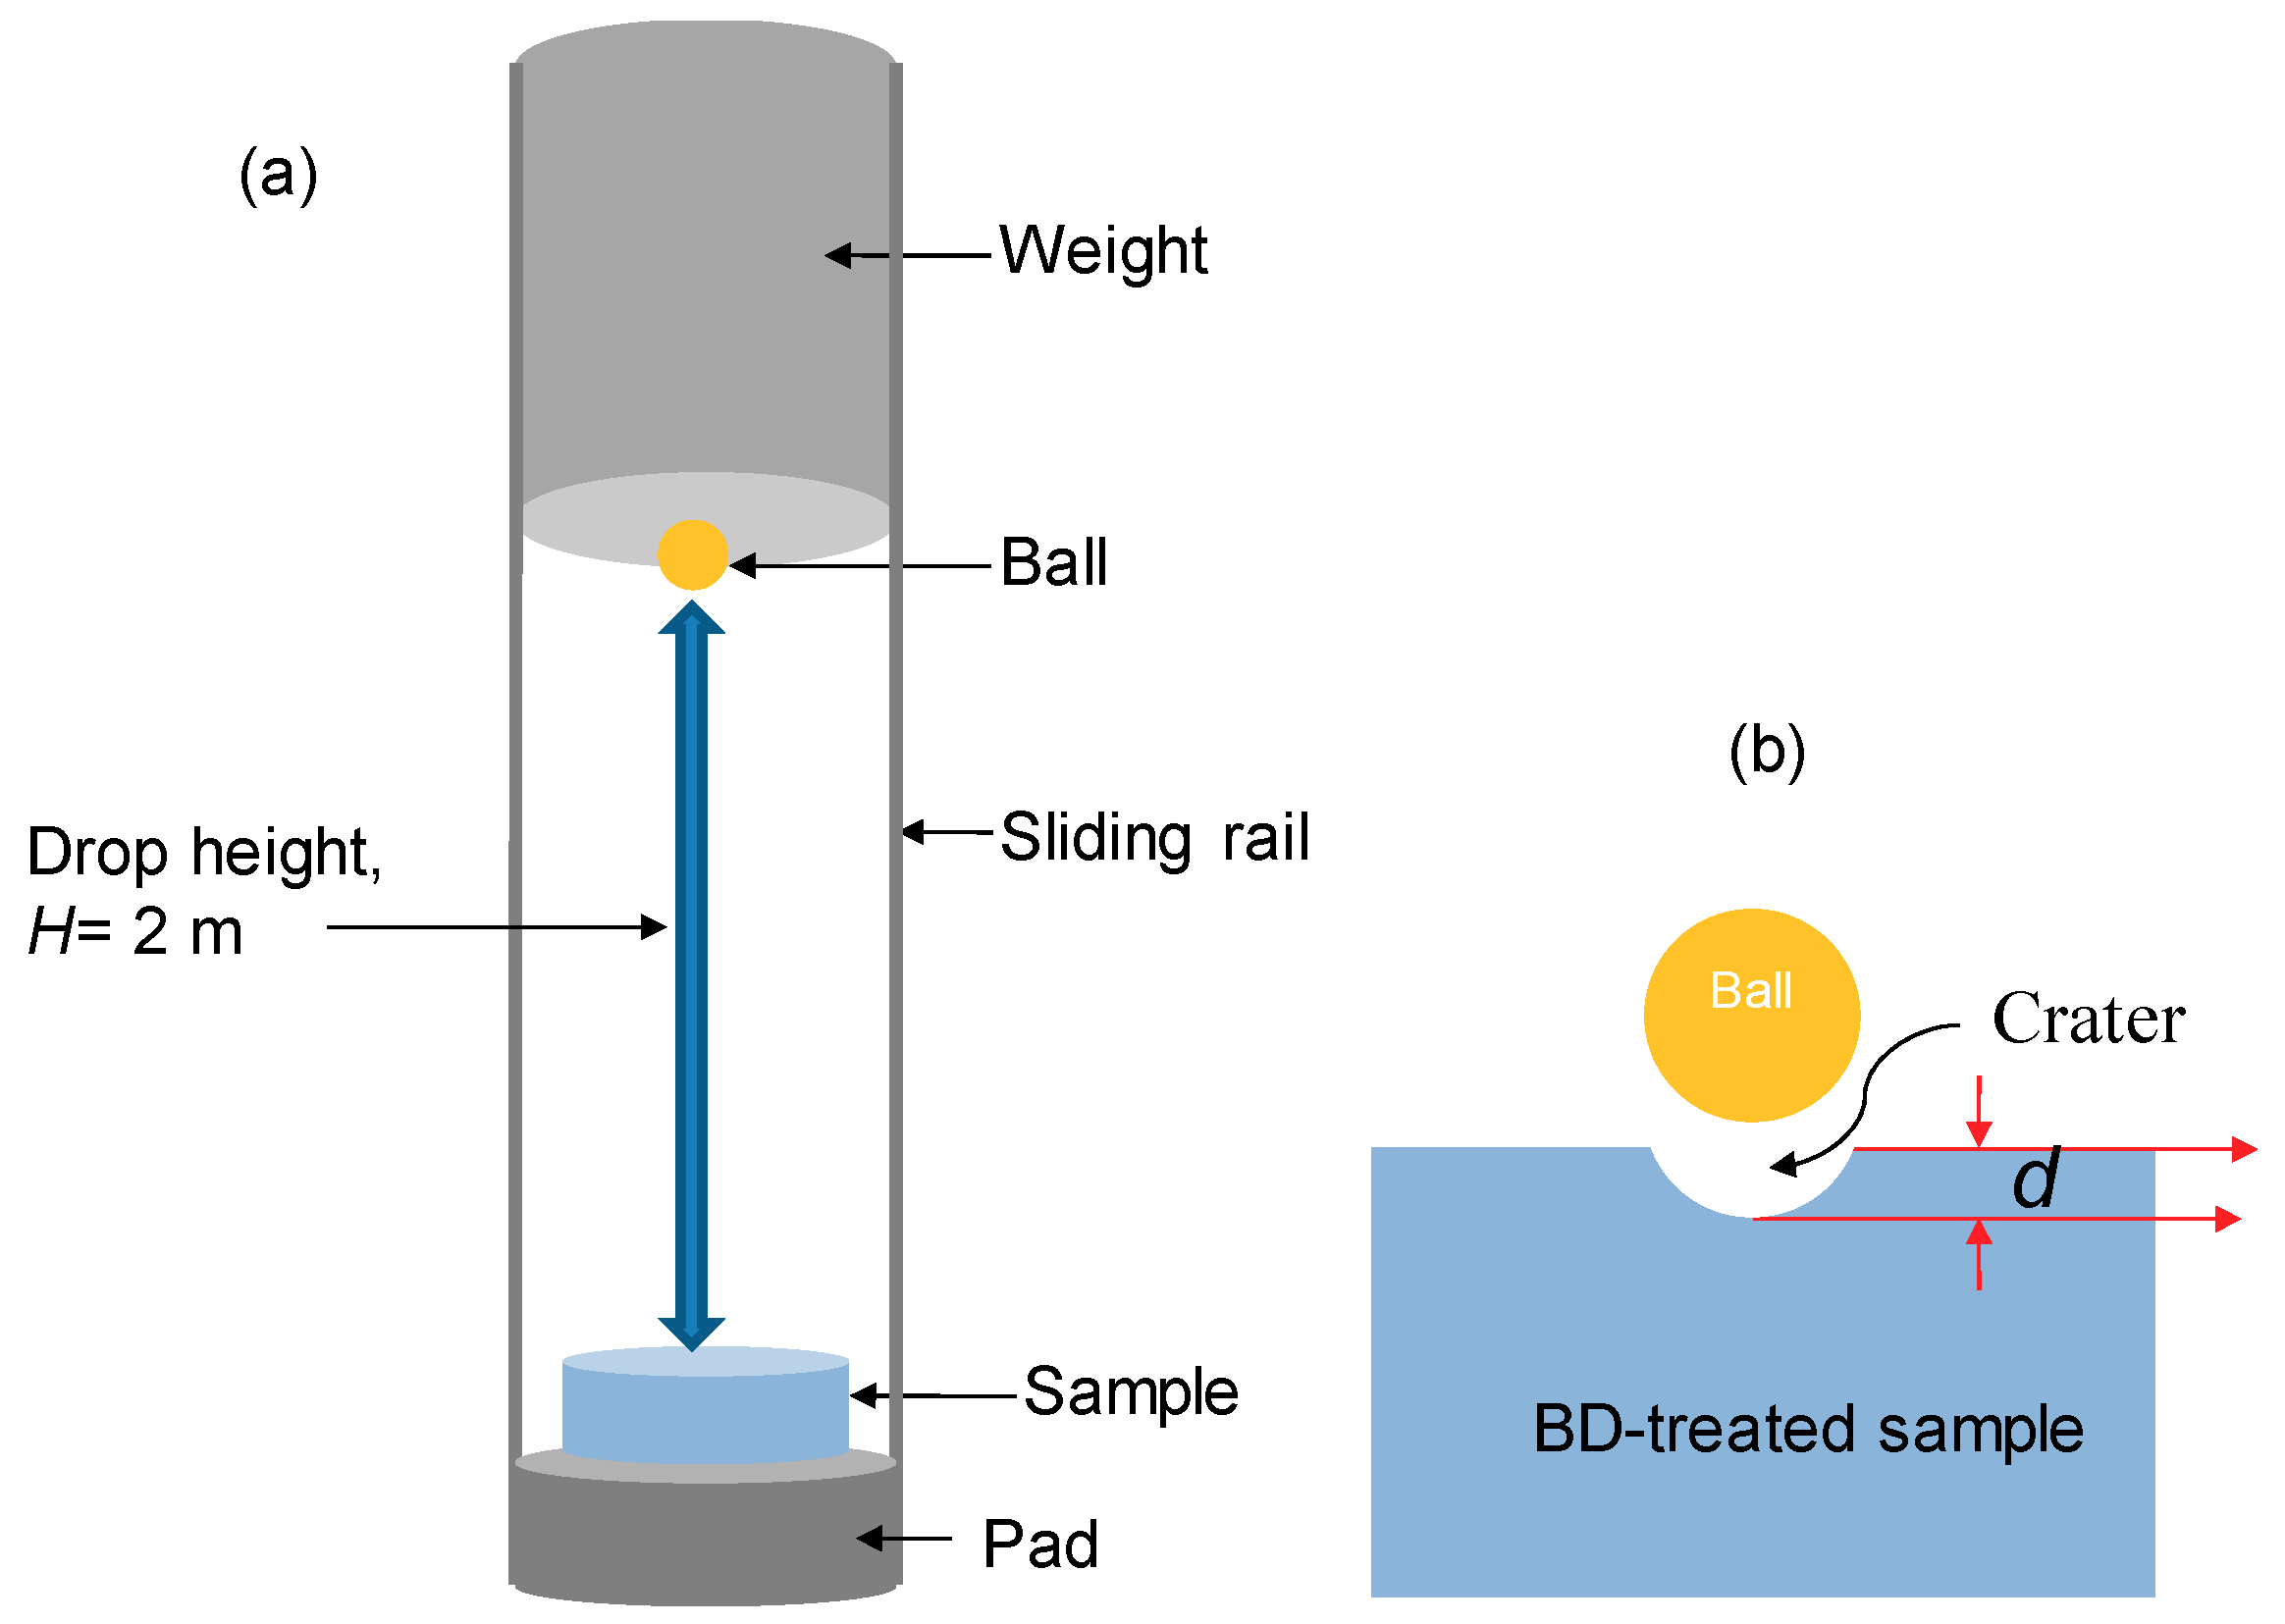
2. Materials and Methods

The chemical composition of the carbon steel used in this study is shown in Table 1. To remove the residual stress in the as-received steel bars, the samples were normalized at 1000 °C for 60 min and naturally cooled to room temperature in an air atmosphere (approximately 10 K/s). Commercial pure iron (Si < 0.01, Mn < 0.01, P < 0.002, S < 0.002, and Al < 0.001 mass%) with a purity of 99.95 mass% was used for the local plastic strain evaluation. The as-received pure iron bars were annealed at 1000 °C for 60 min, and then air-cooled (approximately 10 K/s) to room temperature to obtain homogeneous ferrite grains. All the samples were of cylindrical shape and the same size (30 mm in diameter and 10 mm in thickness). The cold deformation was carried out by a BD test which is characterized by high strain rate. The schematic drawing of the BD test is shown in Figure 1a. A spherical steel ball attached to the bottom of a cylinder was dropped from a height of 2 m onto a flat surface of pure Fe sample. The balls used had diameters of 8 mm and weighed 3–5 kg. All tests were carried out at room temperature in an air atmosphere. To make the experimental parameters less complicated, a single dropping test was performed for each case. The BD test is very useful to deform materials at a high strain rate, and the strain rate and overall strain can be controlled by simply changing the drop height and weight of the cylinder. However, due to the adjustable limitations of the drop height and weight of the cylinder, there are limitations in adjusting the strain rate and overall strain. The BD test produced a crater-shaped concavity on the surface of the sample, as schematically shown in Figure 1b. The crater depth was measured by Optical Microscopy (OM) for each case. The BD test was performed to produce a 1.2 mm depth crater in pure iron samples. After the deformation, the longitudinal midplane sections were prepared for EBSD measurement. The surface was polished using a 100 nm alumina polishing slurry followed by colloidal silica, to achieve relatively flat surfaces without any damage associated with the sample preparation for the EBSD analysis. This was an important step in obtaining good diffraction patterns of the surface. The EBSD measurements were done with a JEOL JSM-6500F field-emission Scanning Electron Microscope (FE-SEM) equipped with TSL software. The step size was set to 1 μm in all cases.
Subsequently, the annealing behavior was examined in the cold-deformed 0.2 mass% carbon steel deformed with a crater depth of approximately 1.2 mm. The samples were heated up to 700–900 °C at a continuous heating rate of 5 °C/s, with no holding time, and immediately quenched in iced water. The longitudinal sections of the quenched samples were observed by OM or scanning electron microscopy (SEM) after grinding and polishing followed by chemical etching with 3% nital or supersaturated picric acid at 60 °C (to reveal the prior austenite grain boundaries). A linear intercept method was employed to assess the grain size. Approximately 350–450 intercepts were counted for each sample.

3. Results and Discussion

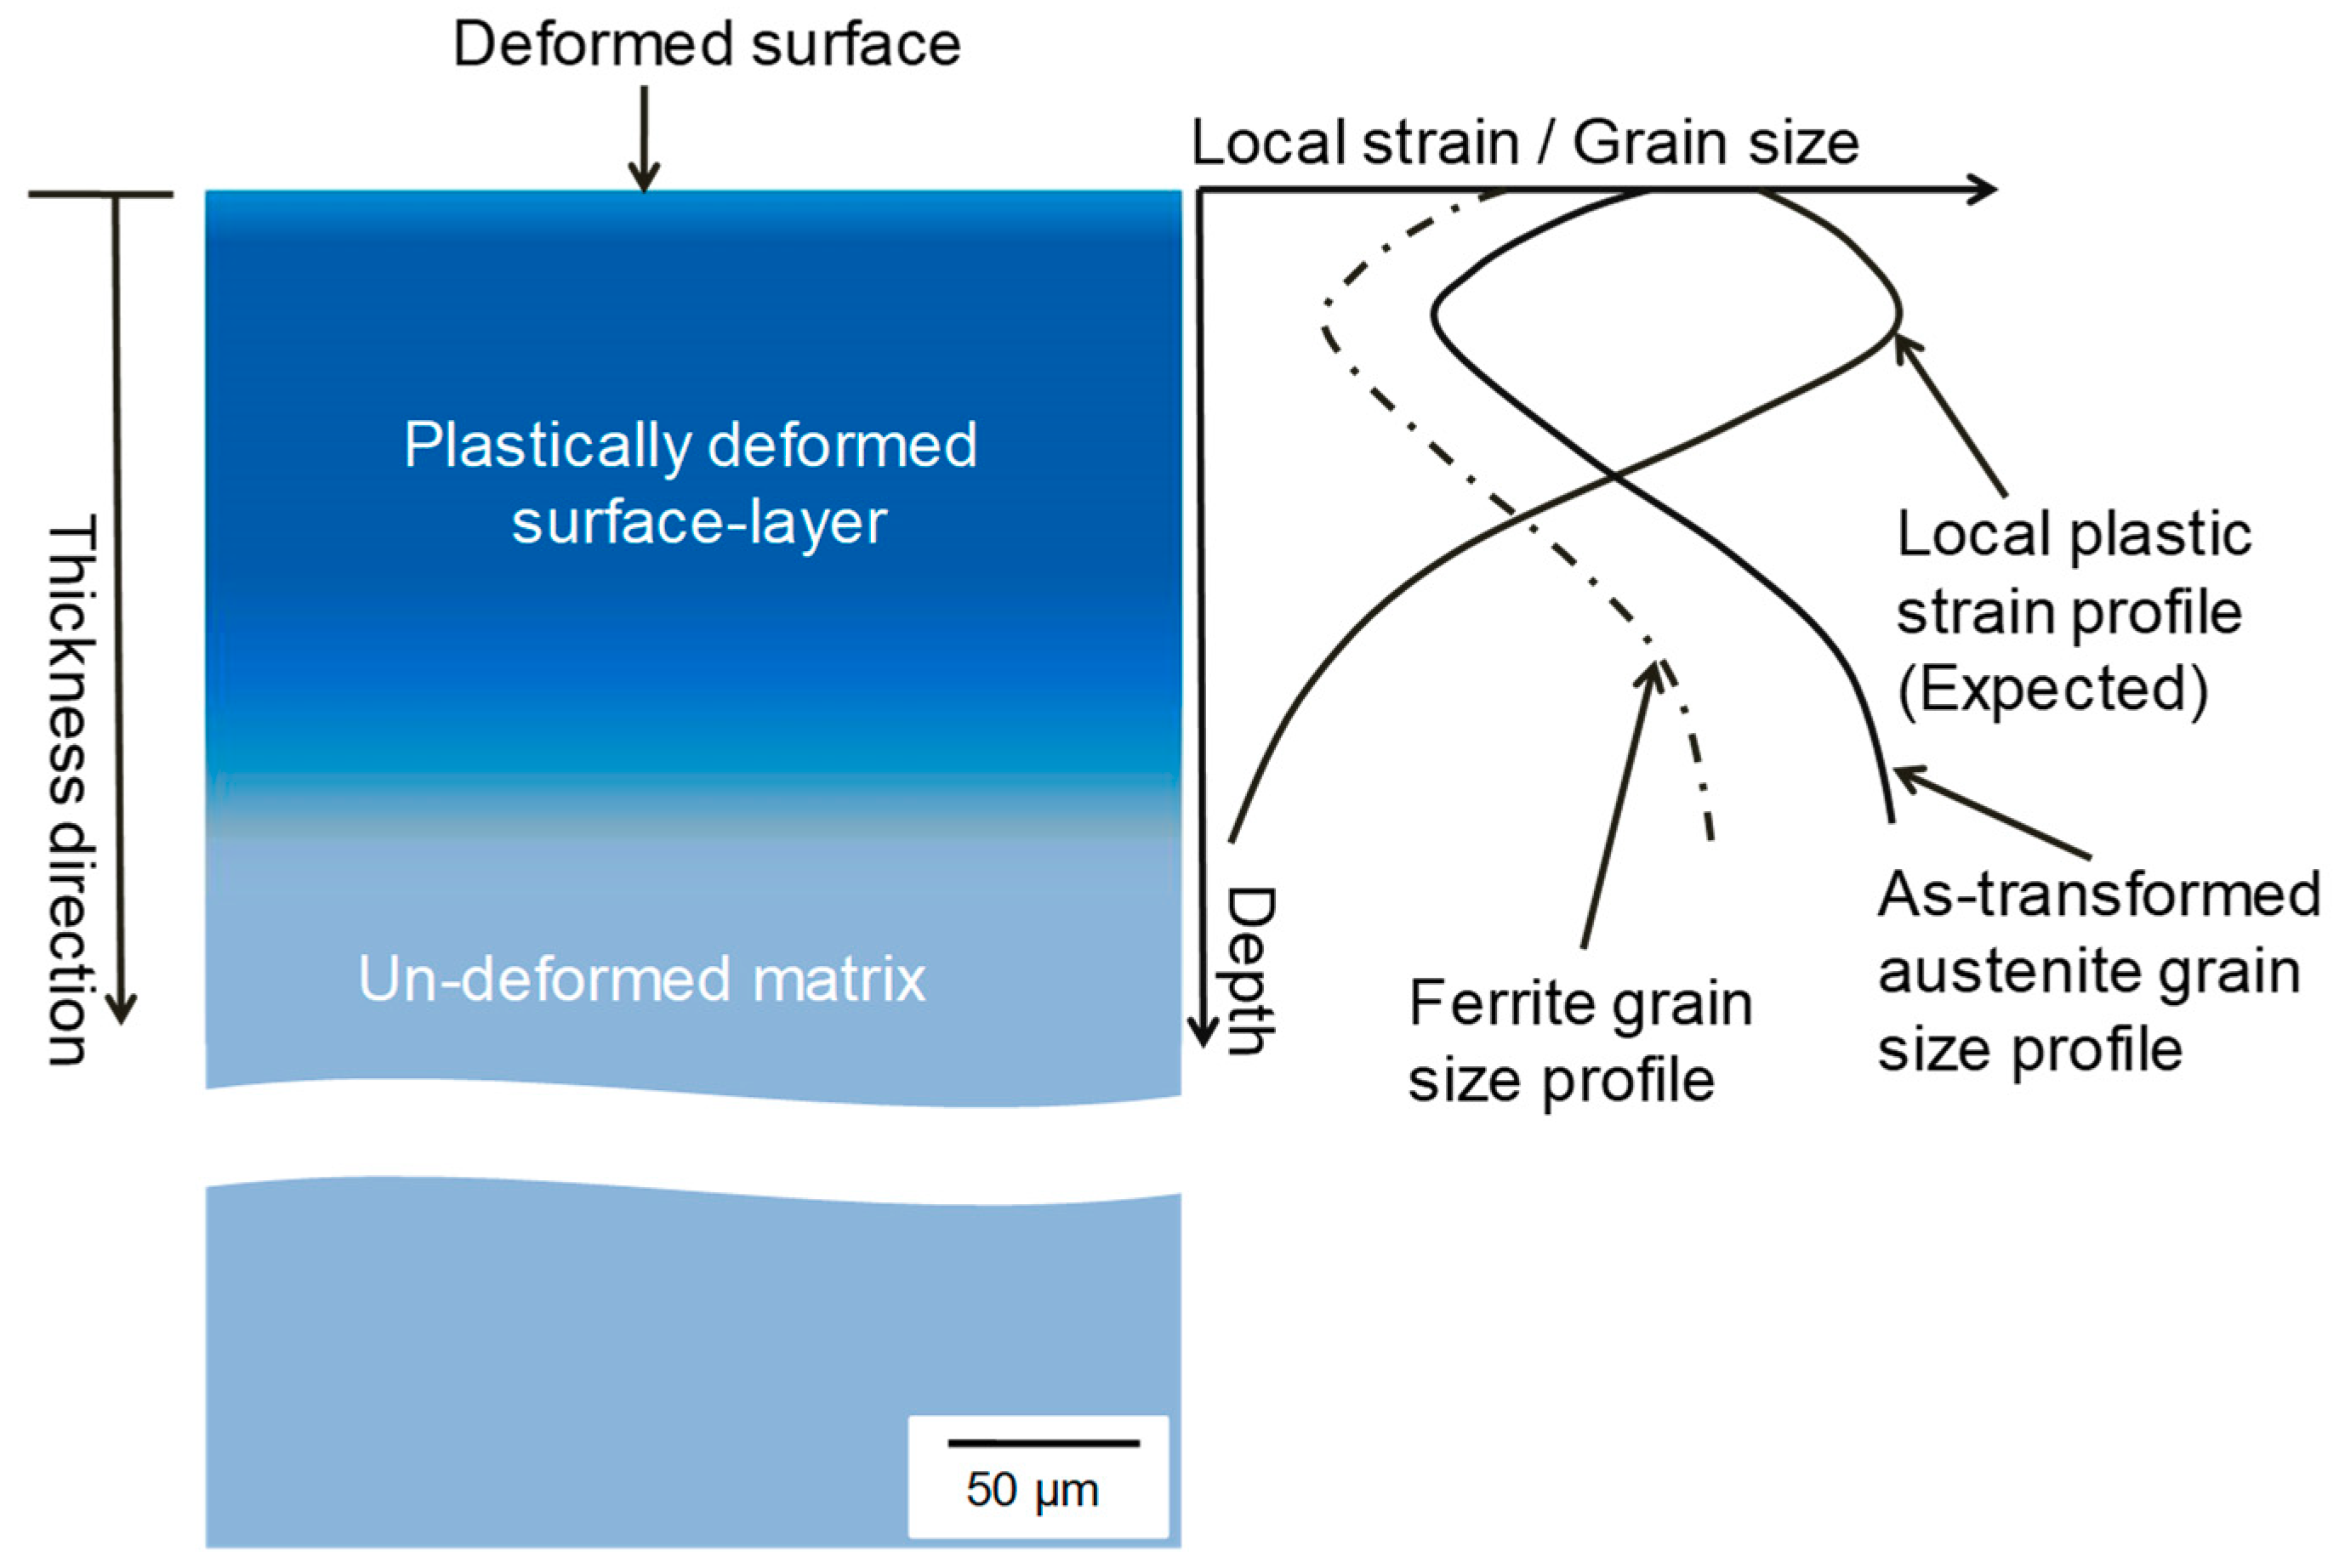
3.1. Local Plastic Strain Profile in Pure Iron

Figure 2a,b shows the ferrite orientation maps of the undeformed and deformed samples, respectively. Different colors indicate various crystal orientations. Unique color, and thus unique orientation, was observed in each grain in the undeformed sample, as shown in Figure 2a. However, the individual grains showed varying shades of colors: that is, a local change in orientations in the single crystal grain was observed in the deformed sample (Figure 2b). It is known that plastic deformation causes crystallographic slip and geometrically necessary dislocations. The accumulation of stored dislocations causes the local change in crystal orientation [20]. This suggests that the variations in lattice orientation (misorientation) in the crystal grain may reflect the degrees of deformation (strain).
A linear relationship between misorientation (Mave) and plastic strain (εave) has been found in many polycrystalline materials, including pure iron [4], austenitic stainless steel, and nickel alloy [20,21,22]. It can be described as follows:
Mave = A + Bεave
where εave is given in percent and A and B are constants. A and B were fitted to be 1.08 and 0.2, respectively, in pure iron [4]. Therefore, the local plastic strain εL(ave) can be estimated from Equation (1) by substituting the local value of Mave, which is described here as ML(ave), into it as follows:
ε L ( ave ) = M L ( ave ) A B  
The misorientation inside a grain is quantified in reference to an average orientation measured for each grain. Thus, Mave can be evaluated by the following equation [4]:
  M ave = k = 1 n g ( i = 1 n k f i , k / n k )  
where fi,k denotes the misorientation angle at point i inside grain k in reference to the average orientation of grain k, nk is the number of points in grain k, and ng is the number of grains.
The measured local average misorientation and the evaluated local plastic strain from Equation (2) vs. the distance from the deformed surface is shown in Figure 2c,d, respectively. Both the average local misorientation and local plastic strain showed a gradual change along the depth direction, and the maximum local plastic strain is not located exactly at the deformed surface, but immediately beneath the surface. It is clear that a steep narrow distribution profile of local plastic strain was introduced into the sample. The plastically deformed depth is less than 2.5 mm. The annealing behavior of the carbon steel that deformed at the same condition as that of the pure iron is shown in the next sections.

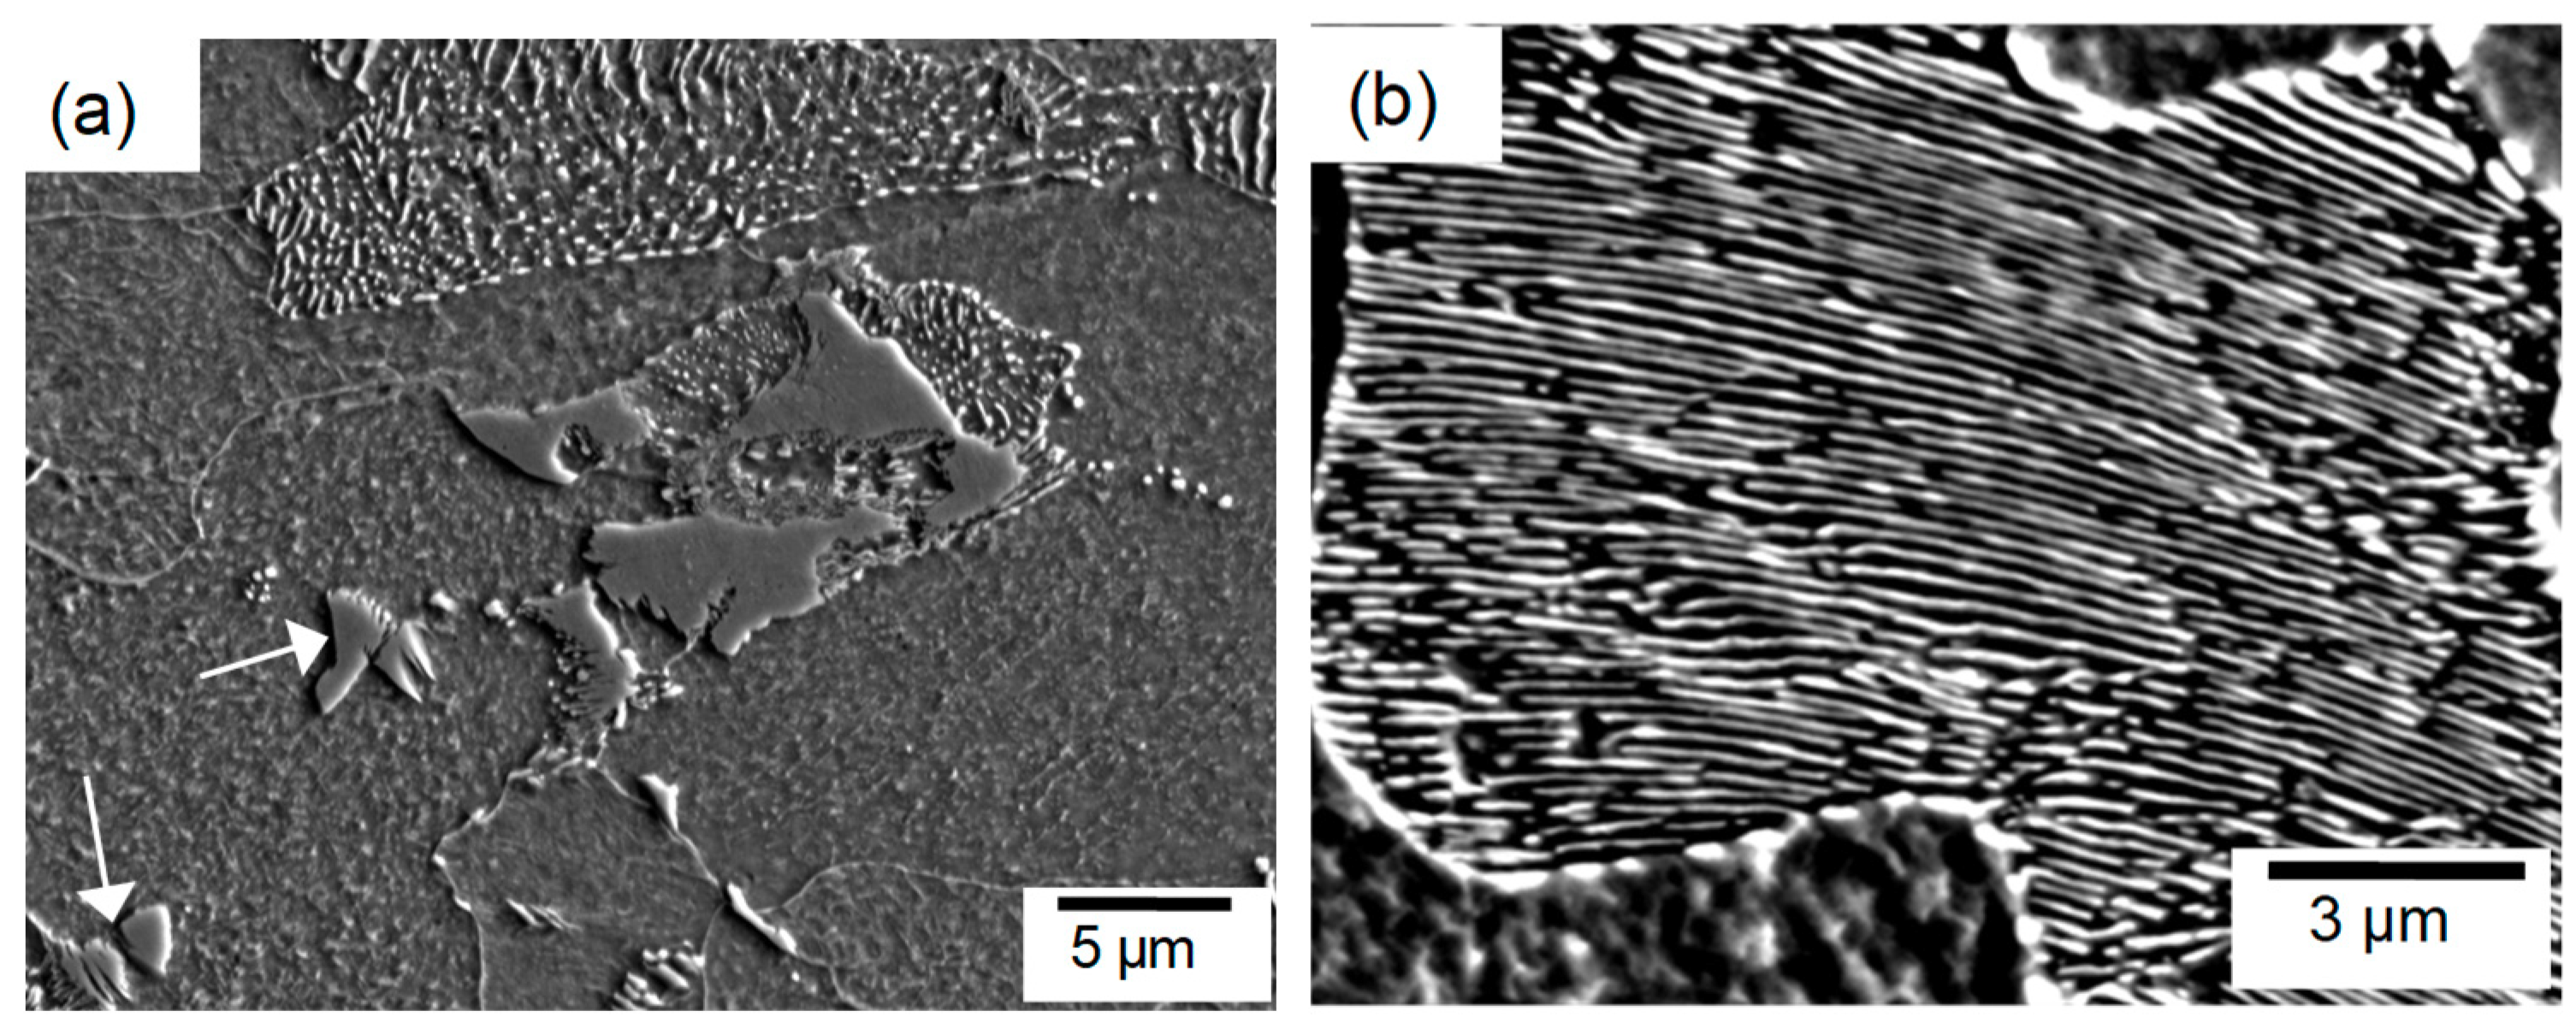
3.2. Recrystallization of Ferrite in Cold-Deformed 0.2 mass% Carbon Steel

The grain structure of the normalized 0.2 mass% carbon steel represented a typical ferrite (white, smooth etching)–pearlite (dark etching) structure, as shown in Figure 3a observed by OM. After cold deformation (Figure 3b), the morphology of both phases became elongated in the region near the surface, indicating that both ferrite and pearlite were plastically deformed.
The OM image of the BD-treated sample after annealing at 700 °C is shown in Figure 3c,d. In the region near the deformed surface (with the distance L = 0.75 mm, Figure 3c), fine and equiaxed ferrite grains completely replaced the deformed and elongated ferrite grains, due to the ferrite recrystallization. However, in the region far from the deformed surface (L = 5 mm, Figure 3d), the structure showed no change in comparison with that of the normalized specimen shown in Figure 3a. When the annealing temperature was increased to 750 °C, the recrystallized ferrite grain size increased in the region near the surface (Figure 3e), while in the deeper region, the microstructure of ferrite remained unchanged (Figure 3f). According to Figure 2d, the deeper region should correspond to the undeformed area.
The average ferrite grain size vs. the distance from the surface, measured from the specimen reheated to 700 °C, is shown in Figure 4. For comparison, the ferrite grain size of the un-deformed sample is also plotted. The ferrite grain size gradually increased with the increase in distance from the surface, and a trough existed slightly beneath the surface. The ferrite grain size approached to the grain size of the undeformed sample at the thickness of 2 mm. This indicates that the recrystallization mainly occurred in a thin surface-layer of less than 2 mm beneath the deformed surface.
On the other hand, it is important that the shape of the ferrite grain size profile shared the same character as that of the local plastic strain profile shown in Figure 2d. It is known that larger strain usually leads to finer recrystallized grain size [8]. This suggests that the gradual change in ferrite grain size should be caused by the gradual change in local plastic strain.
Additionally, the martensite phase was observed in the sample annealed at 750 °C, as indicated by the blue arrows in Figure 3e,f, which indicates that the austenite phase existed before quenching. By comparing the microstructures of Figure 3c,e, it can be seen that the ferrite recrystallization occurred before the austenite formation.

3.3. Austenite Formation in Cold-Deformed 0.2 mass% Carbon Steel

As described above, partial ferrite-to-austenite transformation occurred when the 0.2 mass% carbon steel was reheated to 750 °C. Importantly, the density of the nucleated austenite grains was larger in the near-surface deformed region (Figure 5a) than in the deeper region (Figure 5b), as shown in Figure 5. Figure 5a reveals that the austenite grains nucleated not only at pearlite regions but also within the ferrite grains, as indicated by the black arrows. However, the recrystallized ferrite–ferrite grain boundaries seem not to be the preferential nucleation sites for austenite, as indicated by the red arrows. As for the region far from the surface (Figure 5b), one can observe that the austenite seemed mostly to nucleate and grow from pearlite regions, and few austenite grains nucleated at ferrite–ferrite grain boundaries in comparison with the microstructure before the ferrite-to-austenite transformation in Figure 2d. It is well known that austenite nucleation during reversion needs a carbon source. Austenite nucleation may strongly depend on the dispersion of cementite, which needs to be clarified.
The pearlite in the normalized sample is characterized by a typical ferrite–cementite lamellar structure, as shown in Figure 6a. However, the lamellar structure was broken, and cementite was dispersed by the cold deformation in the region near the surface (L = 0.75 mm, Figure 6b). With increase in distance from the surface, the pearlite was less deformed (L = 3 mm, Figure 6c). The perfect lamellar structure was maintained in the deeper region of 5.0 mm beneath the deformed surface (Figure 6d). Therefore, the degree of perlite deformation gradually decreased along the depth direction.
The microstructure of the sample reheated to 730 °C is shown in Figure 7, which is the earlier stage in which the nucleation of austenite could be observed.
Spheroidization of the pearlitic cementite occurred in the region near the surface. In addition, several martensite, and thus austenite, islands nucleated along a cluster of spheroidized cementite particles. It is important that some of the spheroidized cementite particles survived in the ferrite grain interiors, and served as the later intragranular sites for the nucleation of austenite, as indicated by the white arrows in Figure 7a. This may have led to the nucleation of austenite within the ferrite grains. However, no austenite could be observed to be nucleated at the ferrite–ferrite grain boundaries. As for the region far from the surface (L = 5 mm, Figure 7b), the pearlite lamellar structure was not changed by annealing, and it was difficult to find the reverted austenite. Therefore, the nucleation of austenite was accelerated in the deformed area.
According to the above analysis, the high nucleation density of austenite in the deformed area is not attributed to the increase in density of the recrystallized ferrite–ferrite grain boundaries, but rather to the broken pearlite structure. Plastic deformation broke the lamellar structure and the cementite was dispersed, which provided more nucleation sites for austenite.
The as-transformed austenite grain size profile along the thickness direction is shown in Figure 8, measured from the sample reheated to 900 °C just after the reversion. For comparison, the as-transformed austenite grain size of the undeformed sample is also plotted. It is clear that the as-transformed austenite grain size exhibited a gradual increase in grain size with a trough slightly beneath the surface, sharing the same character as that of the local plastic strain profile in pure iron. The increase in austenite grain size was due to the decreases in nucleation density of austenite, and thus the decrease in the degree of perlite deformation along the thickness direction.
Figure 9 schematically shows the grain size profile beneath the deformed surface in the BD-treated carbon steel. By applying high strain rate deformation, the near surface layer was locally deformed, and the matrix was free of deformation. Both the ferrite and as-transformed austenite showed a gradual change in grain size after annealing. According to the above discussion, the gradual change of the ferrite grain size and as-transformed austenite grain size may suggest the gradual change of local plastic strain in carbon steel. The expected gradual change in local plastic strain profile is plotted as well. Moreover, it is important that this study provides a guideline to control the microstructure near the surface of carbon steels, through the surface local deformation and annealing treatment.

4. Summary

In summary, the annealing behavior of the surface-locally cold-deformed 0.2 mass% carbon steel with a large strain gradient has been studied. It was found that both the ferrite and as-transformed austenite exhibited a gradual change in grain size along the depth direction. Austenite grains formed densely at the pearlite regions, as well as within recrystallized ferrite grains in the severely deformed surface layer.

Author Contributions

X.Z., K.M. and M.O. conceived and designed the experiments; X.Z. performed the experiments and collected the data; X.Z. and K.M. analyzed the data; X.Z. wrote the paper; K.M. and M.O. discussed with the results and revised the manuscript.

Funding

This work was partially supported by “Nanotechnology Platform’’ Program of the Ministry of Education, Culture, Sports, Science and Technology (MEXT), Japan.

Conflicts of Interest

The authors declare no conflict of interest.

References

  1. Fecht, H.J.; Hellstern, E.; Fu, Z.; Johnson, W.L. Nanocrystalline metals prepared by high-energy ball milling. Metall. Mater. Trans. A 1990, 21, 2333–2337. [Google Scholar] [CrossRef]
  2. Eckert, J.; Holzer, J.C.; Krill, C.E.; Johnson, W.L. Structural and thermodynamic properties of nanocrystalline fcc metals prepared by mechanical attrition. J. Mater. Res. 1992, 7, 1751–1761. [Google Scholar] [CrossRef]
  3. Bagheri, S.; Guagliano, M. Review of shot peening processes to obtain nanocrystalline surfaces in metal alloys. Surf. Eng. 2009, 25, 3–14. [Google Scholar] [CrossRef]
  4. Zhang, X.; Matsuura, K.; Ohno, M.; Suzuki, S. Quantification of local plastic strain distribution beneath surface of deformed iron. Mater. Sci. Eng. A 2013, 564, 169–175. [Google Scholar] [CrossRef]
  5. Mankins, W.L. Recovery, recrystallization, and grain-growth structures. ASM Int. 2004, 9, 207–214. [Google Scholar]
  6. Huang, J.; Poole, W.J.; Militzer, M. Austenite formation during intercritical annealing. Metall. Mater. Trans. A 2004, 35, 3363–3375. [Google Scholar] [CrossRef]
  7. Nedjada, S.H.; Moghaddama, Y.Z.; Vazirabadia, A.M.; Shirazib, H.; Ahmadabadib, M.N. Grain refinement by cold deformation and recrystallization of bainite and acicular ferrite structures of C–Mn steels. Mater. Sci. Eng. A 2011, 528, 1521–1526. [Google Scholar] [CrossRef]
  8. Yang, D.Z.; Brown, E.L.; Matlock, D.K.; Krauss, G. Ferrite recrystallization and austenite formation in cold-rolled intercritically annealed steel. Metall. Mater. Trans. A 1985, 16, 1385–1392. [Google Scholar] [CrossRef]
  9. Yang, D.Z.; Brown, E.L.; Matlock, D.K.; Krauss, G. The Formation of austenite at low intercritical annealing temperatures in a normalized 0.08C-1.45Mn-0.21Si steel. Metall. Mater. Trans. A 1985, 16, 1523–1526. [Google Scholar] [CrossRef]
  10. Park, K.T.; Lee, E.G.; Lee, C.S. Reverse austenite transformation behavior of equal channel angular pressed low carbon ferrite/pearlite steel. ISIJ Int. 2007, 47, 294–298. [Google Scholar] [CrossRef]
  11. Tokizane, M.; Matsumuara, N.; Tsuzaki, K.; Maki, T.; Tamura, I. Recrystallization and formation of austenite in deformed lath martensitic structure of low carbon steels. Metall. Mater. Trans. A 1982, 13, 1379–1388. [Google Scholar] [CrossRef]
  12. Keichel, J.; Foct, J.; Gottstein, G. Deformation and annealing behavior of nitrogen alloyed duplex stainless steels. Part II: annealing. ISIJ Int. 2003, 43, 1788–1794. [Google Scholar] [CrossRef]
  13. Beswick, J. Effect of prior cold work on the martensite transformation in SAE 52100. Metall. Mater. Trans. A 1984, 15, 299–306. [Google Scholar] [CrossRef]
  14. Yi, J.J.; Kim, I.S.; Choi, H.S. Austenitization during intercritical annealing of an Fe-C-Si-Mn dual-phase steel. Metall. Mater. Trans. A 1985, 16, 1237–1245. [Google Scholar] [CrossRef]
  15. Asadabad, M.A.; Goodarzi, M.; Kheirandish, S. Kinetics of austenite formation in dual phase steels. ISIJ Int. 2008, 48, 1251–1255. [Google Scholar] [CrossRef]
  16. Garcia, C.I.; Deardo, A.J. Formation of austenite in 1.5 pct Mn steels. Metall. Mater. Trans. A 1981, 12, 521–530. [Google Scholar] [CrossRef]
  17. Speich, G.R.; Demarest, V.A.; Miller, R.L. Formation of austenite during intercritical annealing of dual-phase steels. Metall. Mater. Trans. A 1981, 12, 1419–1482. [Google Scholar] [CrossRef]
  18. Li, Z.D.; Miyamoto, G.; Yang, Z.G.; Furuhara, T. Kinetics of reverse transformation from pearlite to austenite in an Fe-0.6 mass pct C Alloy and the effects of alloying elements. Metall. Mater. Trans. A 2011, 45, 1586–1596. [Google Scholar] [CrossRef]
  19. Karlsson, B.; Linden, G. Plastic Deformation of Ferrite-Pearlite Structures in Steel. Mater. Sci. Eng. 1975, 17, 209–219. [Google Scholar] [CrossRef]
  20. Kamaya, M.; Wilkinson, A.J.; Titchmarsh, J.M. Quantification of plastic strain of stainless steel and nickel alloy by electron backscatter diffraction. Acta Mater. 2006, 54, 539–548. [Google Scholar] [CrossRef]
  21. Kamaya, M.; Wilkinson, A.J.; Titchmarsh, J.M. Measurement of plastic strain of polycrystalline material by electron backscatter diffraction. Nucl. Eng. Des. 2005, 235, 713–725. [Google Scholar] [CrossRef]
  22. Sáez-Maderuelo, A.; Castro, L.; De Diego, G. Plastic strain characterization in austenitic stainless steels and nickel alloys by electron backscatter diffraction. J. Nucl. Mater. 2011, 416, 75–79. [Google Scholar] [CrossRef]
Figure 1. Schematic illustrations of the (a) ball-dropping test and (b) crater depth measurement.
Metals 08 00976 g001
Figure 2. Ferrite orientation map of the (a) undeformed and (b) cold-deformed pure iron. (c) The measured local average misorientation and (d) the evaluated local plastic strain profiles vs. the distance from the deformed surface after being deformed by the ball-dropping test with a 1.2 mm crater depth.
Metals 08 00976 g002
Figure 3. Ferrite–pearlite structures of the (a) as-normalized and subsequently (b) cold-deformed samples at a position of 0.75 mm beneath the surface. Optical micrographs of the sample reheated to 700 °C at the positions of (c) 0.75 and (d) 5.0 mm beneath the surface. Optical micrographs of the sample reheated to 750 °C at the positions (e) 0.75 and (f) 5.0 mm beneath the deformed surface. The blue arrows in (e) and (f) indicate the martensite, and thus the austenite, before quenching.
Metals 08 00976 g003
Figure 4. Average ferrite grain size vs. distance from the deformed surface in the sample reheated to 700 °C. α: Ferrite.
Metals 08 00976 g004
Figure 5. Optical micrographs of the sample reheated to 750 °C at positions of (a) 0.75 and (b) 5.0 mm beneath the surface. The black arrows indicate the nucleation of austenite within the ferrite grains, and the red arrows indicate the recrystallized ferrite–ferrite grain boundaries, which are not the preferential nucleation sites for austenite.
Metals 08 00976 g005
Figure 6. SEM micrographs of the (a) as-normalized sample, and cold-deformed sample observed at the positions of (b) 0.75, (c) 1.3, and (d) 5.0 mm beneath the surface.
Metals 08 00976 g006
Figure 7. SEM micrographs of the sample reheated to 730 °C at the positions of (a) 0.75 and (b) 5.0 mm beneath the surface. The white arrows in (a) indicate the nucleation of austenite at the cementite particles within the ferrite grains.
Metals 08 00976 g007
Figure 8. Variations of as-transformed austenite grain size with the depth from the deformed surface in the sample reheated to 900 °C, immediately after the reverse transformation. γ: Austenite.
Metals 08 00976 g008
Figure 9. Schematic illustration of the annealed results of surface-locally cold-deformed low-carbon steel with a large strain gradient.
Metals 08 00976 g009
Table 1. Chemical composition of the steel used in this study (mass%).
CSiMnPAlNFe
0.20.20.80.0150.040.006Bal.

