Article

Hydrogen Evolution Reaction Property in Alkaline Solution of Molybdenum Disulfide Modified by Surface Anchor of Nickel–Phosphorus Coating

School of Environmental and Chemical Engineering, Yanshan University, Qinhuangdao 066004, China
*
Author to whom correspondence should be addressed.
Metals 2017, 7(6), 211; https://doi.org/10.3390/met7060211
Submission received: 3 May 2017 / Revised: 1 June 2017 / Accepted: 3 June 2017 / Published: 7 June 2017

Abstract

:
Molybdenum disulfide (MoS2) is unfavorable for practical application in the hydrogen evolution reaction (HER) process due to its inert basal surface, inferior conductivity, and limited amount of active edge sites. For the purpose of enhancing the HER performance of this catalyst, the HER activity of its basal surface should be increased. Herein, three types of nickel-phosphorus (Ni–P) coatings—namely, low phosphorus (LP), medium phosphorus (MP) and high phosphorus (HP) —were anchored onto the surfaces of MoS2 nanoparticles via an electroless plating process; thus, three Ni–P/MoS2 composites (Ni–LP/MoS2, Ni–MP/MoS2, and Ni–HP/MoS2) were fabricated. Crystal structures, morphologies, chemical components, and HER performances of each in an alkaline solution were characterized. Both Ni–LP/MoS2 and Ni–MP/MoS2 showed a crystal nature, while the amorphous feature for Ni–HP/MoS2 was validated. The three Ni–P/MoS2 composites exhibited a higher HER activity than the pure MoS2. The HER performance of the Ni–MP/MoS2 composite was more outstanding than those of other two composites, which could be attributed to the presence of metastable nickel phosphides, and the excellent conductivity of Ni–MP coating anchored on the basal surface of MoS2.

Graphical Abstract

1. Introduction

Hydrogen as a charming and clean energy carrier has received tremendous attention to relieve the energy crisis and environmental problems caused by the consumption of traditional fossil fuels [1]. In general, the electrocatalytic hydrogen evolution reaction (HER) process is extensively employed for the generation of hydrogen. The well-known platinum (Pt) and Pt-based alloys possess a superior electrocatalytic HER property [2,3], but the limited availability and high price retard their large-scale applications. In view of this situation, the exploitation of cost-effective and earth-abundant alternatives of Pt-based catalysts is very crucial to push the engineering practice of HER.
Until present, carbides [4], borides [5], selenides [6], nitrides [7], phosphides [8], as well as transition metal sulfides [9] have been recommended as HER catalysts. Among them, molybdenum disulfide (MoS2) can be identified as a promising alternative because of the earth-abundant and low-cost advantages, and the passable electrocatalytic property of this material. Nevertheless, the defects of inert basal plane, insufficient edge sites, and the inferior electron-transport feature of MoS2 restrict its HER performance [10,11]. Conventionally, there are three approaches employed to promote the HER activity of MoS2: (i) increasing the active number of edge sites, (ii) enhancing the activity of active sites, and (iii) improving electrical conductivity within the interparticle and interdomain. Thus, numerous attempts—including interlayer intercalation [12,13], gentle oxidation [14,15], phase transformation (from 2H–MoS2 to 1T–MoS2) [16,17], functional structural design [10,18], as well as stabilizing the edge layers with organic molecules [19]—have been made for enhancing the HER property of MoS2. Also, the improvement in the electrical contact between the active sites has been attempted, and various promoters such as gold [12], carbon materials [20], core-shell MoO3 [21], graphene [22,23], graphene oxide [24,25], and nickel–phosphorus powders [26] have been applied as electrical conduction supports to improve the electrical contact between active sites of MoS2.
With respect to the reported efforts mentioned above, unquestionably, attempts made for the increase in abundant active sites, the increment in stacked height along the (002) basal plane aiming to gain a maximum value of edge/basal ratio, and the enhancement in electrical conductivity within the interparticle and interdomain are valuable for the enhancement in HER performance of MoS2. However, for this catalyst, the enhancement in HER property of its inert basal plane has not been comprehensively attempted. The electroless nickel–phosphorus (Ni–P) coating possesses merits such as facile fabrication, wear resistance, anticorrosion, excellently electrical conductivity, and promising HER activity, so the anchor of Ni–P coating onto the inert basal plane may be competent for the enhancement in HER performance of MoS2. To date, according to our best knowledge so far, the electroless Ni–P coating anchored onto the surface of MoS2 to enhance the HER property of this catalyst has not been attempted. In this sense, this work will offer a novel sight for the enhancement in HER property of MoS2.
The purpose of this research is to reveal the effect of Ni–P coatings with different phosphorus content on the HER activity of MoS2. Three Ni–P coatings, i.e., low phosphorus (Ni–LP), medium phosphorus (Ni–MP), and high phosphorus (Ni–HP) coatings were anchored onto the surface of MoS2 by an electroless plating process. Three Ni–P/MoS2 composites (Ni–LP/MoS2, Ni–MP/MoS2, and Ni–HP/MoS2) were fabricated. Morphologies, structures, compositions, and crystallinities of these three Ni–P/MoS2 composites were characterized by scanning electron microscope (SEM), energy dispersive spectrometry (EDS), X-ray diffraction (XRD), and X-ray photoelectron spectroscopy (XPS). Also, the HER properties of them in 1 mol/L KOH solution were evaluated using linear sweep voltammetry (LSV), Tafel polarization, cyclic voltammetry (CV), and electrochemical impedance spectroscopy (EIS).

2. Experimental Details

2.1. Material

The analytical grade reagents including ammonium molybdate tetrahydrate ((NH4)6Mo7O24·4H2O, 99 wt %), thiourea (CH4N2S, 99 wt %), nickel sulfate hexahydrate (NiSO4·6H2O), citric acid monohydrate (C6H8O7·H2O), sodium hypophosphite monohydrate (NaH2PO2·H2O), succinic acid (C4H6O4), ammonium hydrogen fluoride (NH4HF), sodium acetate trihydrate (NaAc·3H2O), ammonia solution (25 wt %), potassium hydroxide (KOH), hydrochloric acid (36.5 wt %), N, N–dimethylacetamide (DMAc), palladium chloride (PdCl2) powder, and stannous chloride dehydrate (SnCl2·2H2O) were purchased from Jingchun Scientific Co. Ltd. (Shanghai, China). All of them were used as received and without further purification. The 5 wt % of Nafion solution was supplied by Alfa Aesar Chemicals Co. Ltd. (Shanghai, China). The Pt/C power (20 wt % Pt on Vulcan XC–72R) was provided by Yu Bo Biotech Co. Ltd. (Shanghai, China).

2.2. Preparation and Pretreatment of MoS2

Firstly, 1.41 g of (NH4)6Mo7O24·4H2O and 0.26 g of CH4N2S were dissolved in 20 mL of deionized water, then this mixed solution was vigorously stirred for 5 min and followed by transfer to a 25 mL Teflon-lined stainless steel autoclave placed in an electric cooker (WRN-010, Eurasian, Tianjin, China). Afterward, the temperature of this cooker was increased from room temperature to 200 °C and kept this temperature for 24 h. After the reaction, the temperature of electric cooker was naturally cooled to ambient temperature, then the mixed solution was centrifuged and the obtained MoS2 powders were washed with deionized water. Finally, MoS2 powders were dried at 60 °C under a vacuum atmosphere condition.
The pretreatment process of synthesized MoS2 powder was as follows: 15 mg of MoS2 powder was dispersed in 75 mL of DMAc by stirring, then the suspend solution was ultrasonically treated for 22 h using a ultrasonic cleaner (KQ–500DB, Kunshan Ultrasonic Apparatus Co. Ltd., Kunshan, China). After that, this suspended solution was added into 10 mL 50 g/L of SnCl2 solution (pH of the SnCl2 solution was previously adjusted to 1 using hydrochloric acid), and the mixed solution was ultrasonically dispersed for 10 min. Then the MoS2 powders were collected and washed with deionized water adequately. Subsequently, the washed powders were ultrasonically dispersed in 5 mL of activation solution (containing 1 mg of PdCl2) for 20 min; pH of this activation solution was previously adjusted to 2 using hydrochloric acid. At last, the treated MoS2 powders was centrifugally collected and washed five times with deionized water, and followed by dried in a desiccator ( DL-101, Zhonghuan Electric Furnace Co. Ltd., Tianjin, China).

2.3. Synthesis of Ni–P/MoS2 Composites

The composition of the electroless Ni–P bath was shown as that: 30 g/L of NiSO4·6H2O, 20 g/L of C6H8O7·H2O, 15 g/L of NaAc, 5 g/L of C4H6O4, 5 g/L of NH4HF, and 7.5 g/L of NaH2PO2·H2O for Ni–LP plating (15 g/L for Ni–MP and 30 g/L for Ni–HP). When all added reagents were dissolved in deionized water, pH of the solution was adjusted to 4.8–5.0 by the dropwise addition of ammonia solution. After that, the solution temperature was increased from room temperature to 85 ± 2 °C, and 5 mg of pretreated MoS2 powders were put into 200 mL of Ni–P bath; the plating process lasted for 30 min. As the plating process finished, the prepared Ni–P/MoS2 powders were collected and washed with deionized water. Finally, the collected powders were dried at 60 °C in a vacuum oven (DZF-6050, Boxun Industrial Co. Ltd., Shanghai, China) Thus, three Ni–P/MoS2 composites (denoted as Ni–LP/MoS2, Ni–MP/MoS2 and Ni–HP/MoS2) were fabricated.

2.4. Characterization

Crystal structures of the synthesized Ni–P/MoS2 composites were characterized by an X-ray diffractometer (XRD, SmartLab, Tokyo, Japan) using Cu Kα radiation (λ = 1.5418 Å) with a scan rate of 2° (2θ)/s. Morphologies of the composites were observed using a scanning electron microscope (SEM, S–4800, Hitachi, Tokyo, Japan) with an accelerating voltage of 5 kV. Compositions of the three Ni–P/MoS2 samples were determined by an energy-dispersive X-ray spectrometry (EDS) attached to the scanning electron microscope mentioned above. The X-ray photoelectron spectra (XPS, ESCALAB MK II, Thermo Fisher Scientific, Waltham, MA, USA) of the fabricated composites were characterized with Mg Kα as the excitation source; the binding energy was calibrated by that of the C 1s peak at 284.6 eV derived from the graphitic carbon.

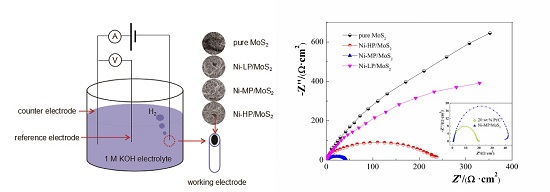
2.5. Electrochemical Measurements

5 mg of Ni–P/MoS2 catalyst and 50 μL of Nafion solution were ultrasonically dispersed in 1mL of solution consisting of 250 μL ethanol and 750 μL deionized water for 30 min to obtain a homogeneous slurry. Subsequently, 5 μL of the slurry was dropped onto a glassy carbon electrode (GCE, 3 mm in diameter, the catalyst load was ~0.337 mg/cm2). The well-known Pt/C catalyst was also loaded to another GCE for comparison in HER property. Before the electrochemical tests, all electrodes naturally dried at room temperature.
All electrochemical tests were conducted by an electrochemical workstation (CHI 650C, Chenhua Co. Ltd, Shanghai, China) in a 1.0 mol/L of KOH electrolyte. A standard three-electrode system was employed, where the GCE bearing the synthesized Ni–P/MoS2 composite (MoS2 or Pt/C) acted as the working electrode, a platinum foil served as the counter electrode and a Ag/AgCl electrode employed as the reference electrode. The pure N2 gas was purged into the solution for 30 min to degas the dissolved oxygen before the tests. The obtained potentials related to the Ag/AgCl electrode were calibrated to the reversible hydrogen electrode (RHE) scale: ERHE = EAg/AgCl + 0.059 pH + 0.209 V. Linear sweep voltammetry (LSV) was carried out at a scan rate of 2 mV/s with the potential ranging from −0.3 to 0.8 V (vs. RHE). Tafel polarization curves were obtained with a potential window of 0.3~1.5 V (vs. RHE) at a scan rate of 10 mV/s. Cyclic voltammetry (CV) measurements were conducted at a scan rate of 10 mV/s with the potential in the range of −0.6 and 0.2 V (vs. RHE). The electrochemical impedance spectroscopy (EIS) measurements were conducted at a cathodic overpotential of 0.7 V (vs. RHE) with the frequency ranging from 105 to 0.01 Hz; 5 mV of the sinusoidal signal was employed. To guarantee the reproducibility of the experimental data, all measurements were performed in triplicate.

3. Results and Discussion

3.1. Characterizations of Ni–P/MoS2 Composites

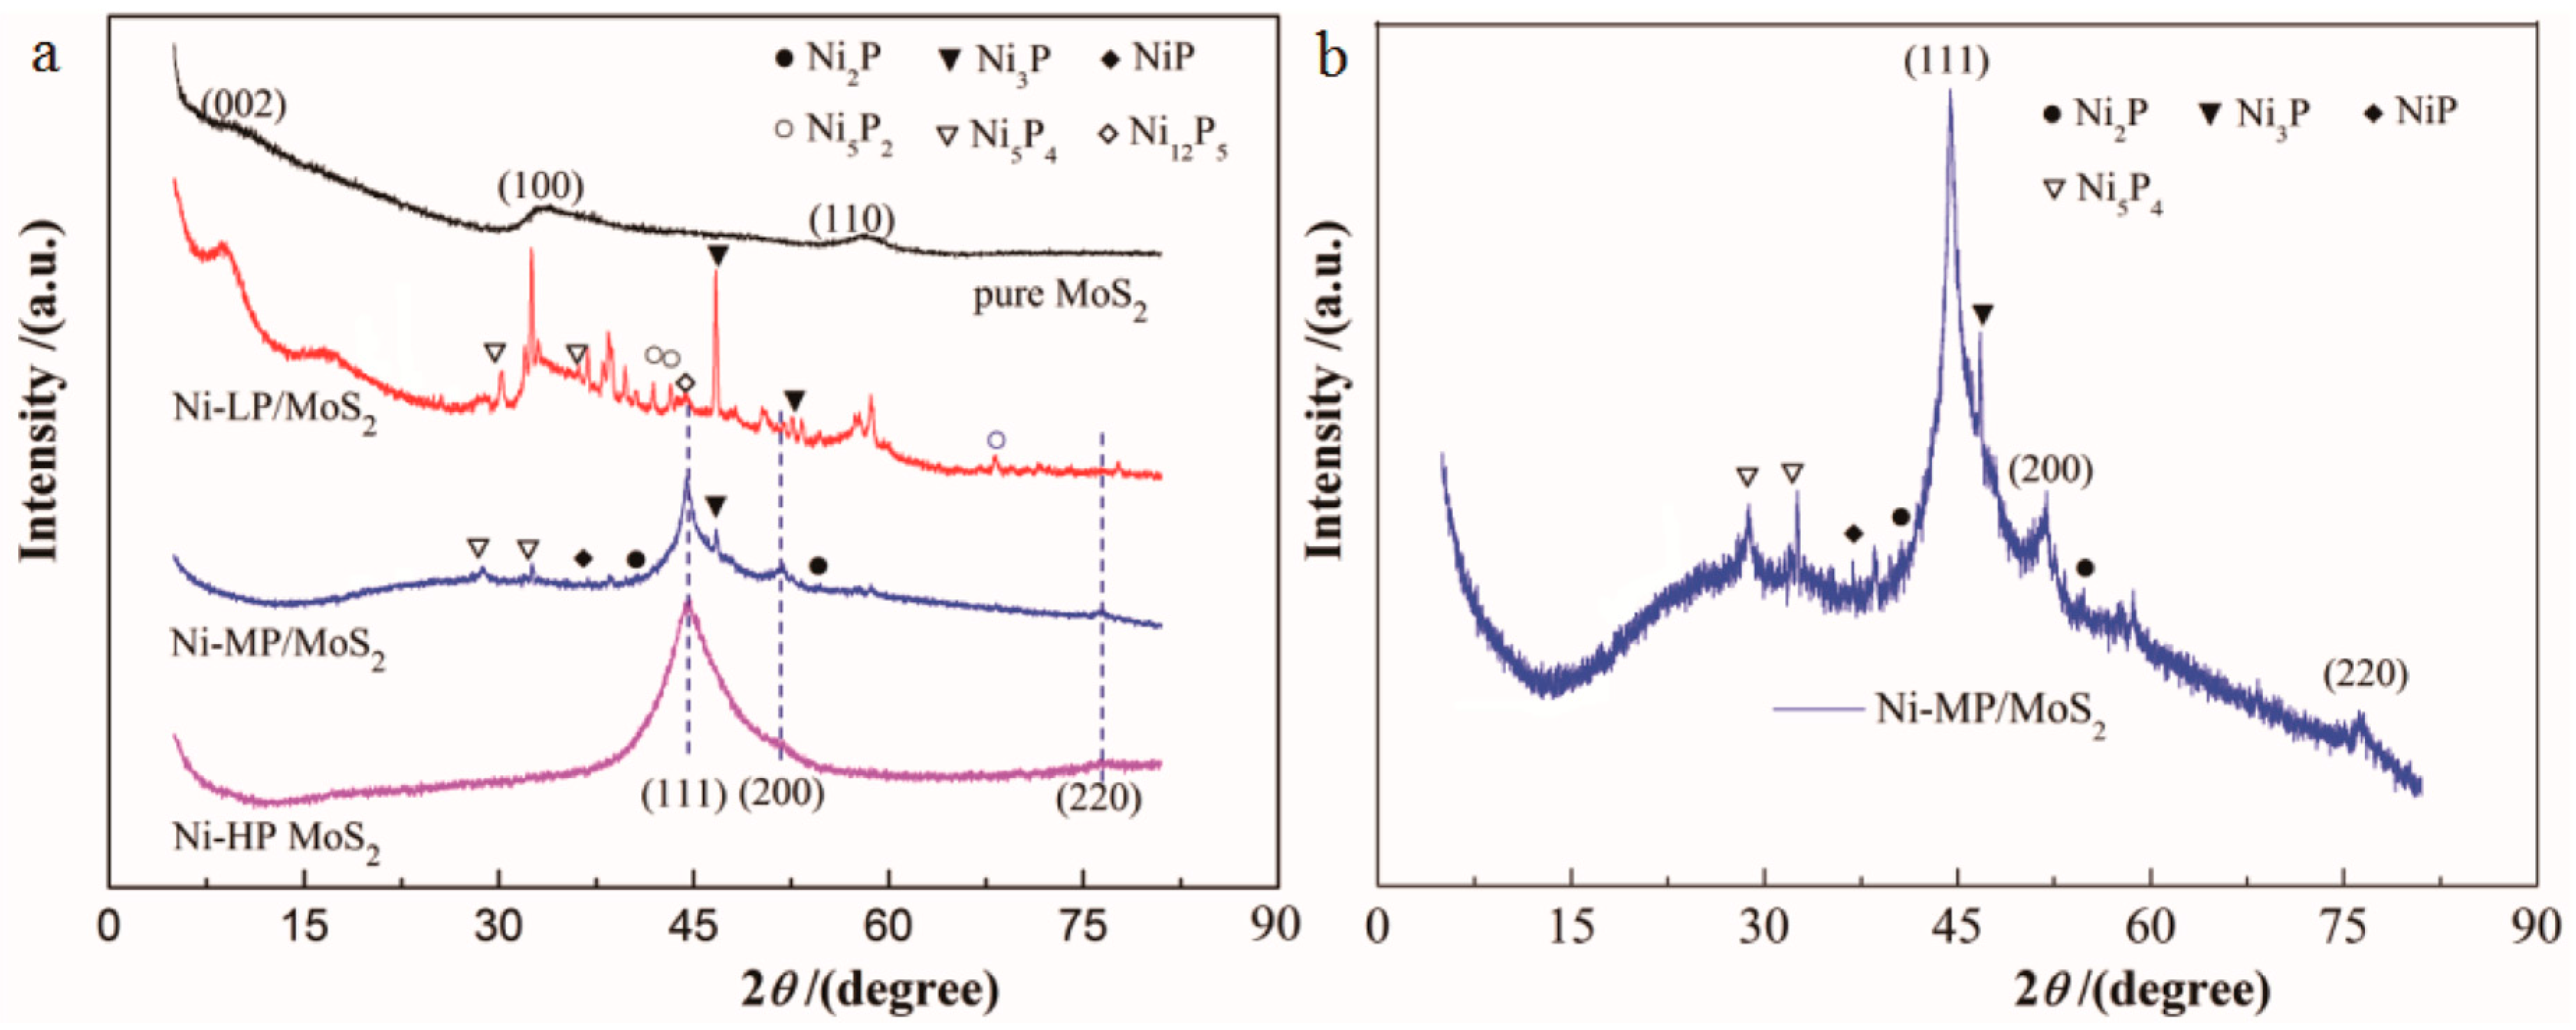
3.1.1. X-ray Diffraction (XRD) Analysis

The XRD patterns of the pure MoS2 and three Ni–P/MoS2 composites were displayed in Figure 1. For the pure MoS2 sample, three characteristics peaks at 2θ = 9.8°, 33.5°, and 58.4° corresponding to (002), (100), and (110) crystal planes of hexagonal MoS2 can be observed. The diffraction peak at 2θ = 9.8° is correlated to the stacked layers of MoS2 along the c axis, indicating the cumulated structure for the (002) plane during the hydrothermal process. In contrast with that of the pure MoS2, the dispersive peaks for Ni–LP/MoS2 composite are identified as follows: 44.4° for Ni12P5, 30.1° and 36.1° for Ni5P4; 41.9°, 43.2°, and 68.1° for Ni5P2; and 46.6° and 51.8° for Ni3P. As for the XRD pattern of Ni–MP/MoS2, the detected peaks are ascribed as that: 28.9° and 32.0° for Ni5P4; 36.8° for NiP; 40.8° and 55.0° for Ni2P; and 46.6° for Ni3P. The presence of nickel phosphides would be helpful for the enhancement in HER of the composite [27]. Both Ni–LP/MoS2 and Ni–MP/MoS2 composites remain the crystal features of the corresponding Ni–P coatings; but the crystallinity of Ni–LP/MoS2 is higher than that of Ni–MP/MoS2. For the Ni–LP/MoS2 composite, intensities of peaks at 2θ = 44.7°, 51.9°, and 76.3° corresponding to (111), (200), and (220) planes of the fcc nickel become very weak, which may be due to the thin thickness of Ni–LP coating and the insufficient covering of nickel phosphides. However, for the Ni–MP/MoS2 composite, these three peaks mentioned above can be easily identified. In addition, for Ni–LP/MoS2 and Ni–MP/MoS2 composites, the trace signal of MoS2 can still be found, suggesting that Ni–LP and Ni–MP coatings do not cover the surface of MoS2 completely. Thus, Ni–LP/MoS2 and Ni–MP/MoS2 composites show the mixed crystal characteristics (consisting of crystalline or microcrystalline, and amorphous phases). The presence of mixed crystal phases will be helpful for the electrocatalytic HER activity [10,28]. For the Ni–HP/MoS2 composite compared with other two composites, only one obvious broad peak at 2θ = 44.7° is easily observed, so the amorphous structure of this composite is validated. The (111) reflection of fcc nickel becomes broadened with the increase in the phosphorus content of Ni–P coating (0.05 at % of P for Ni–LP, 7.37 at % of P for Ni–MP, and 11.25 at % of P for Ni–HP). The increasing phosphorus content of Ni–P coating will lead to the increase in lattice disorder and the decrease in crystallinity of the composite.

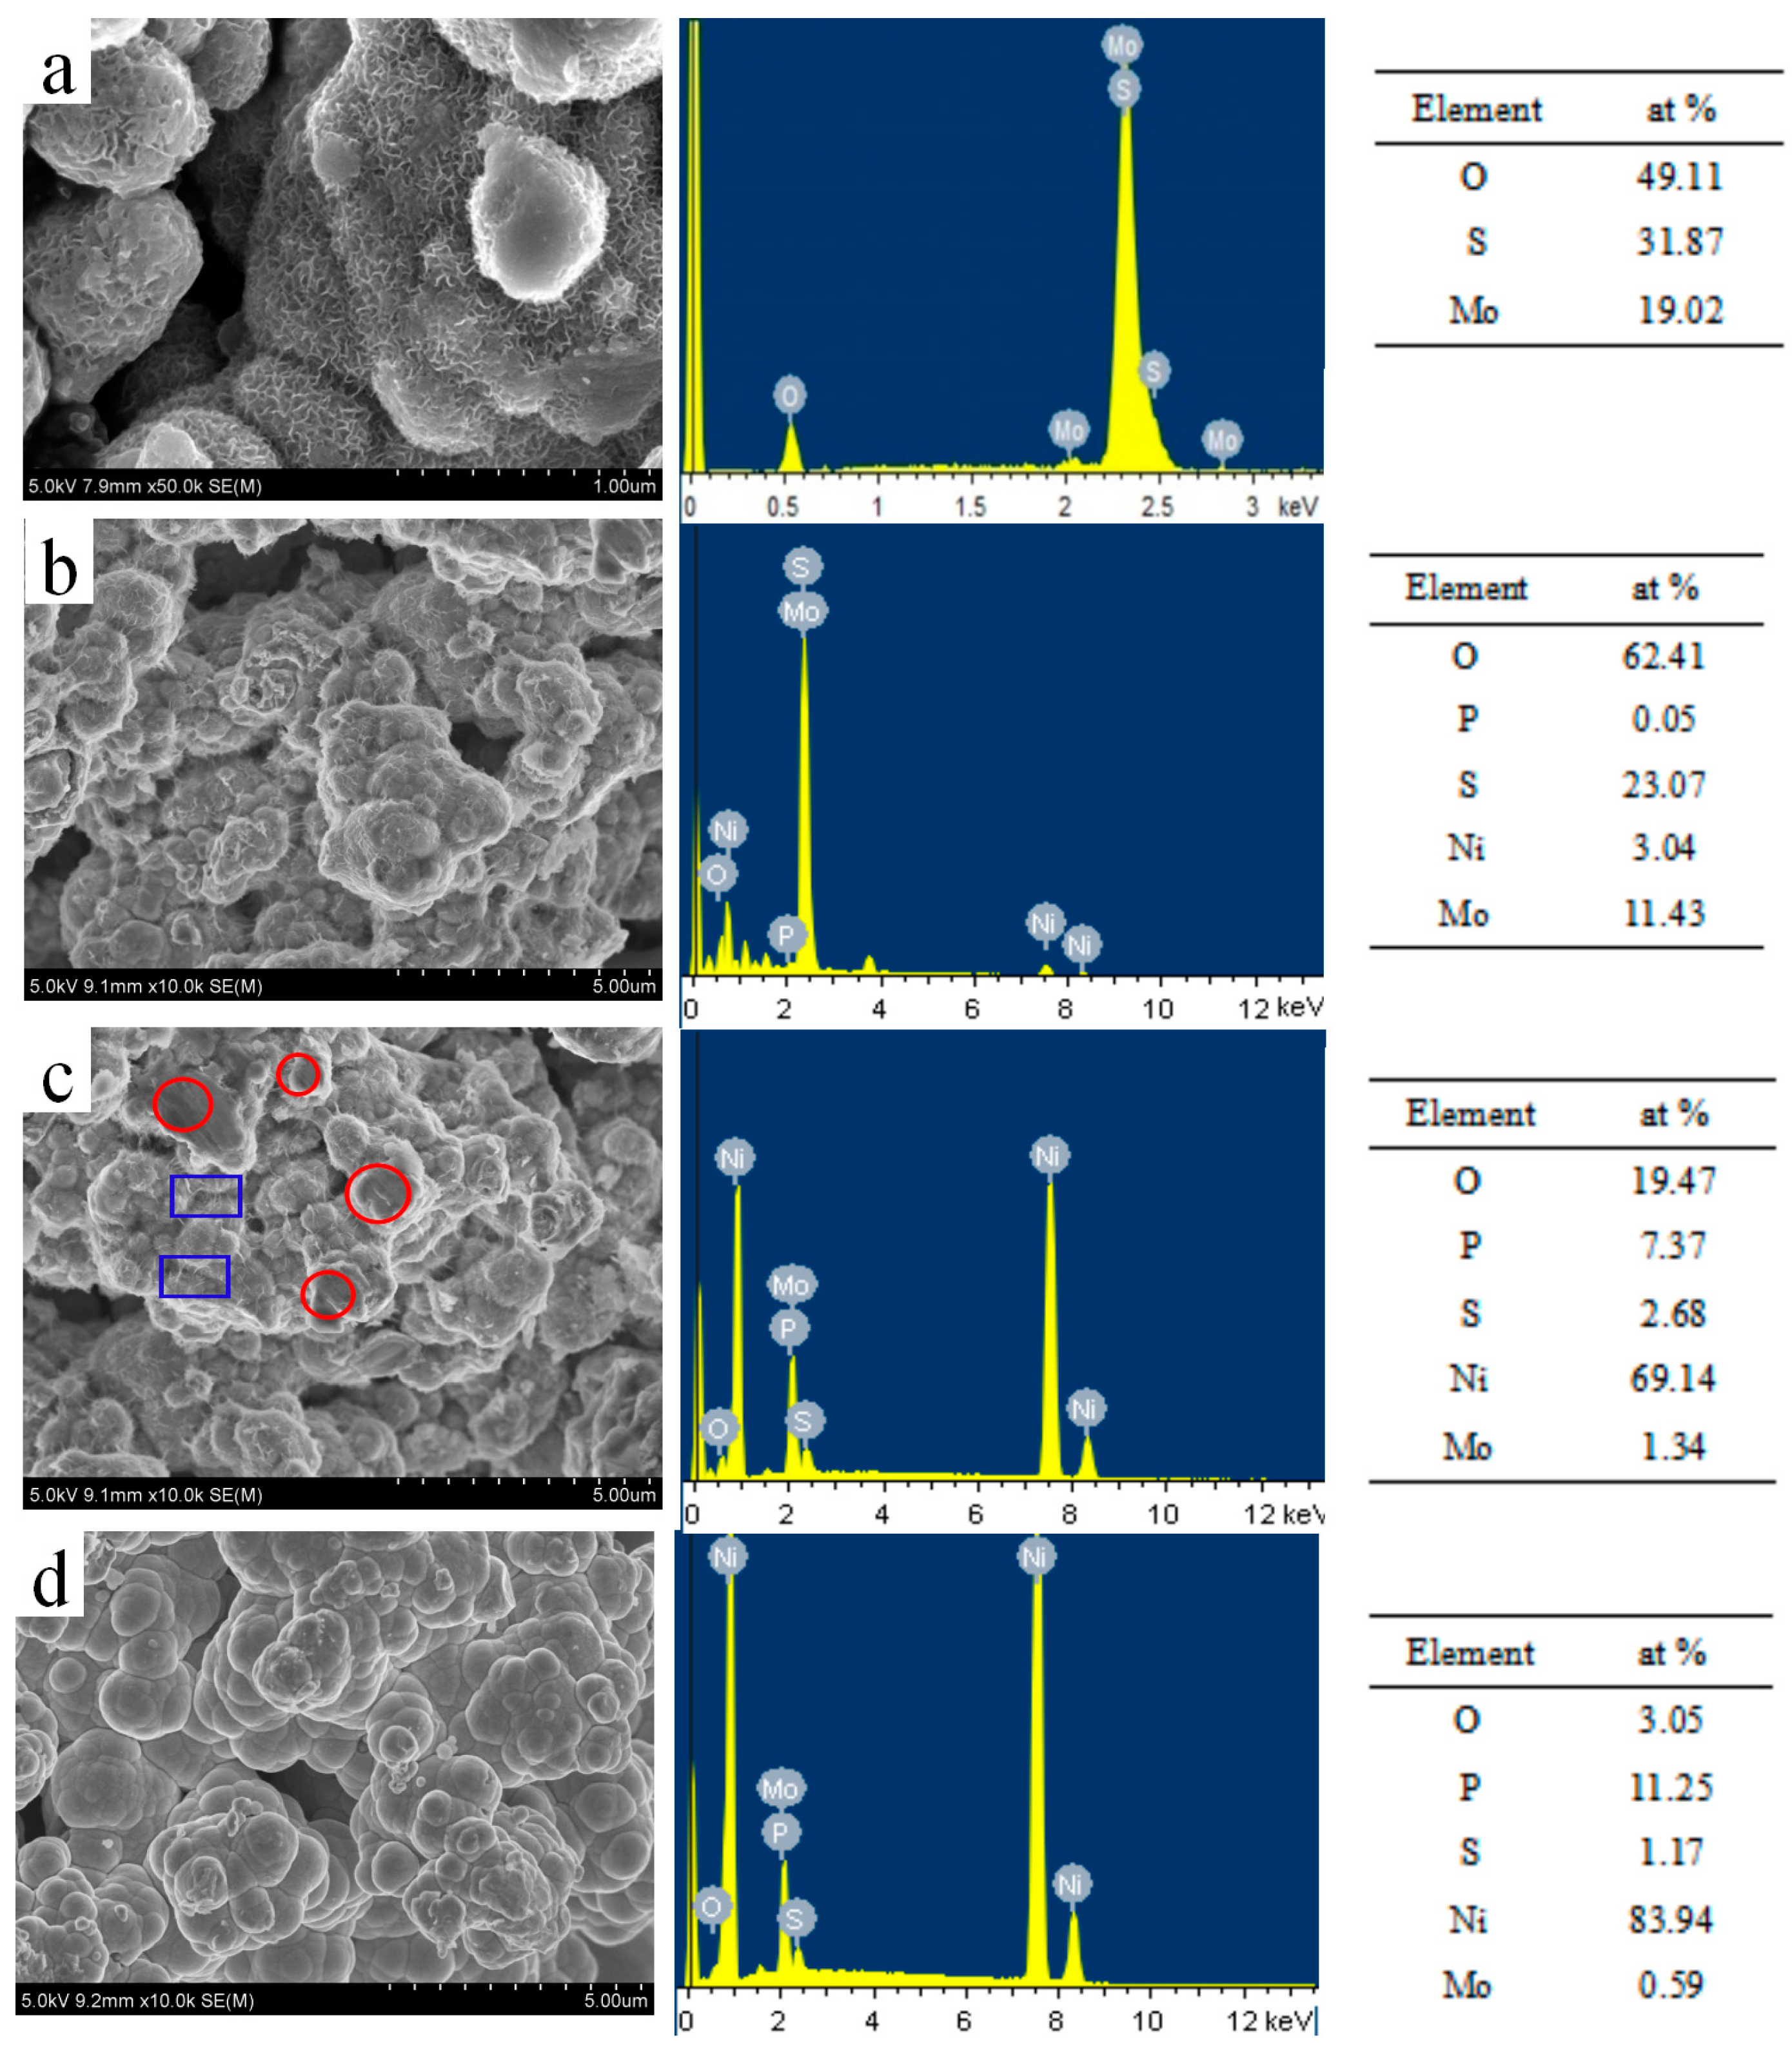
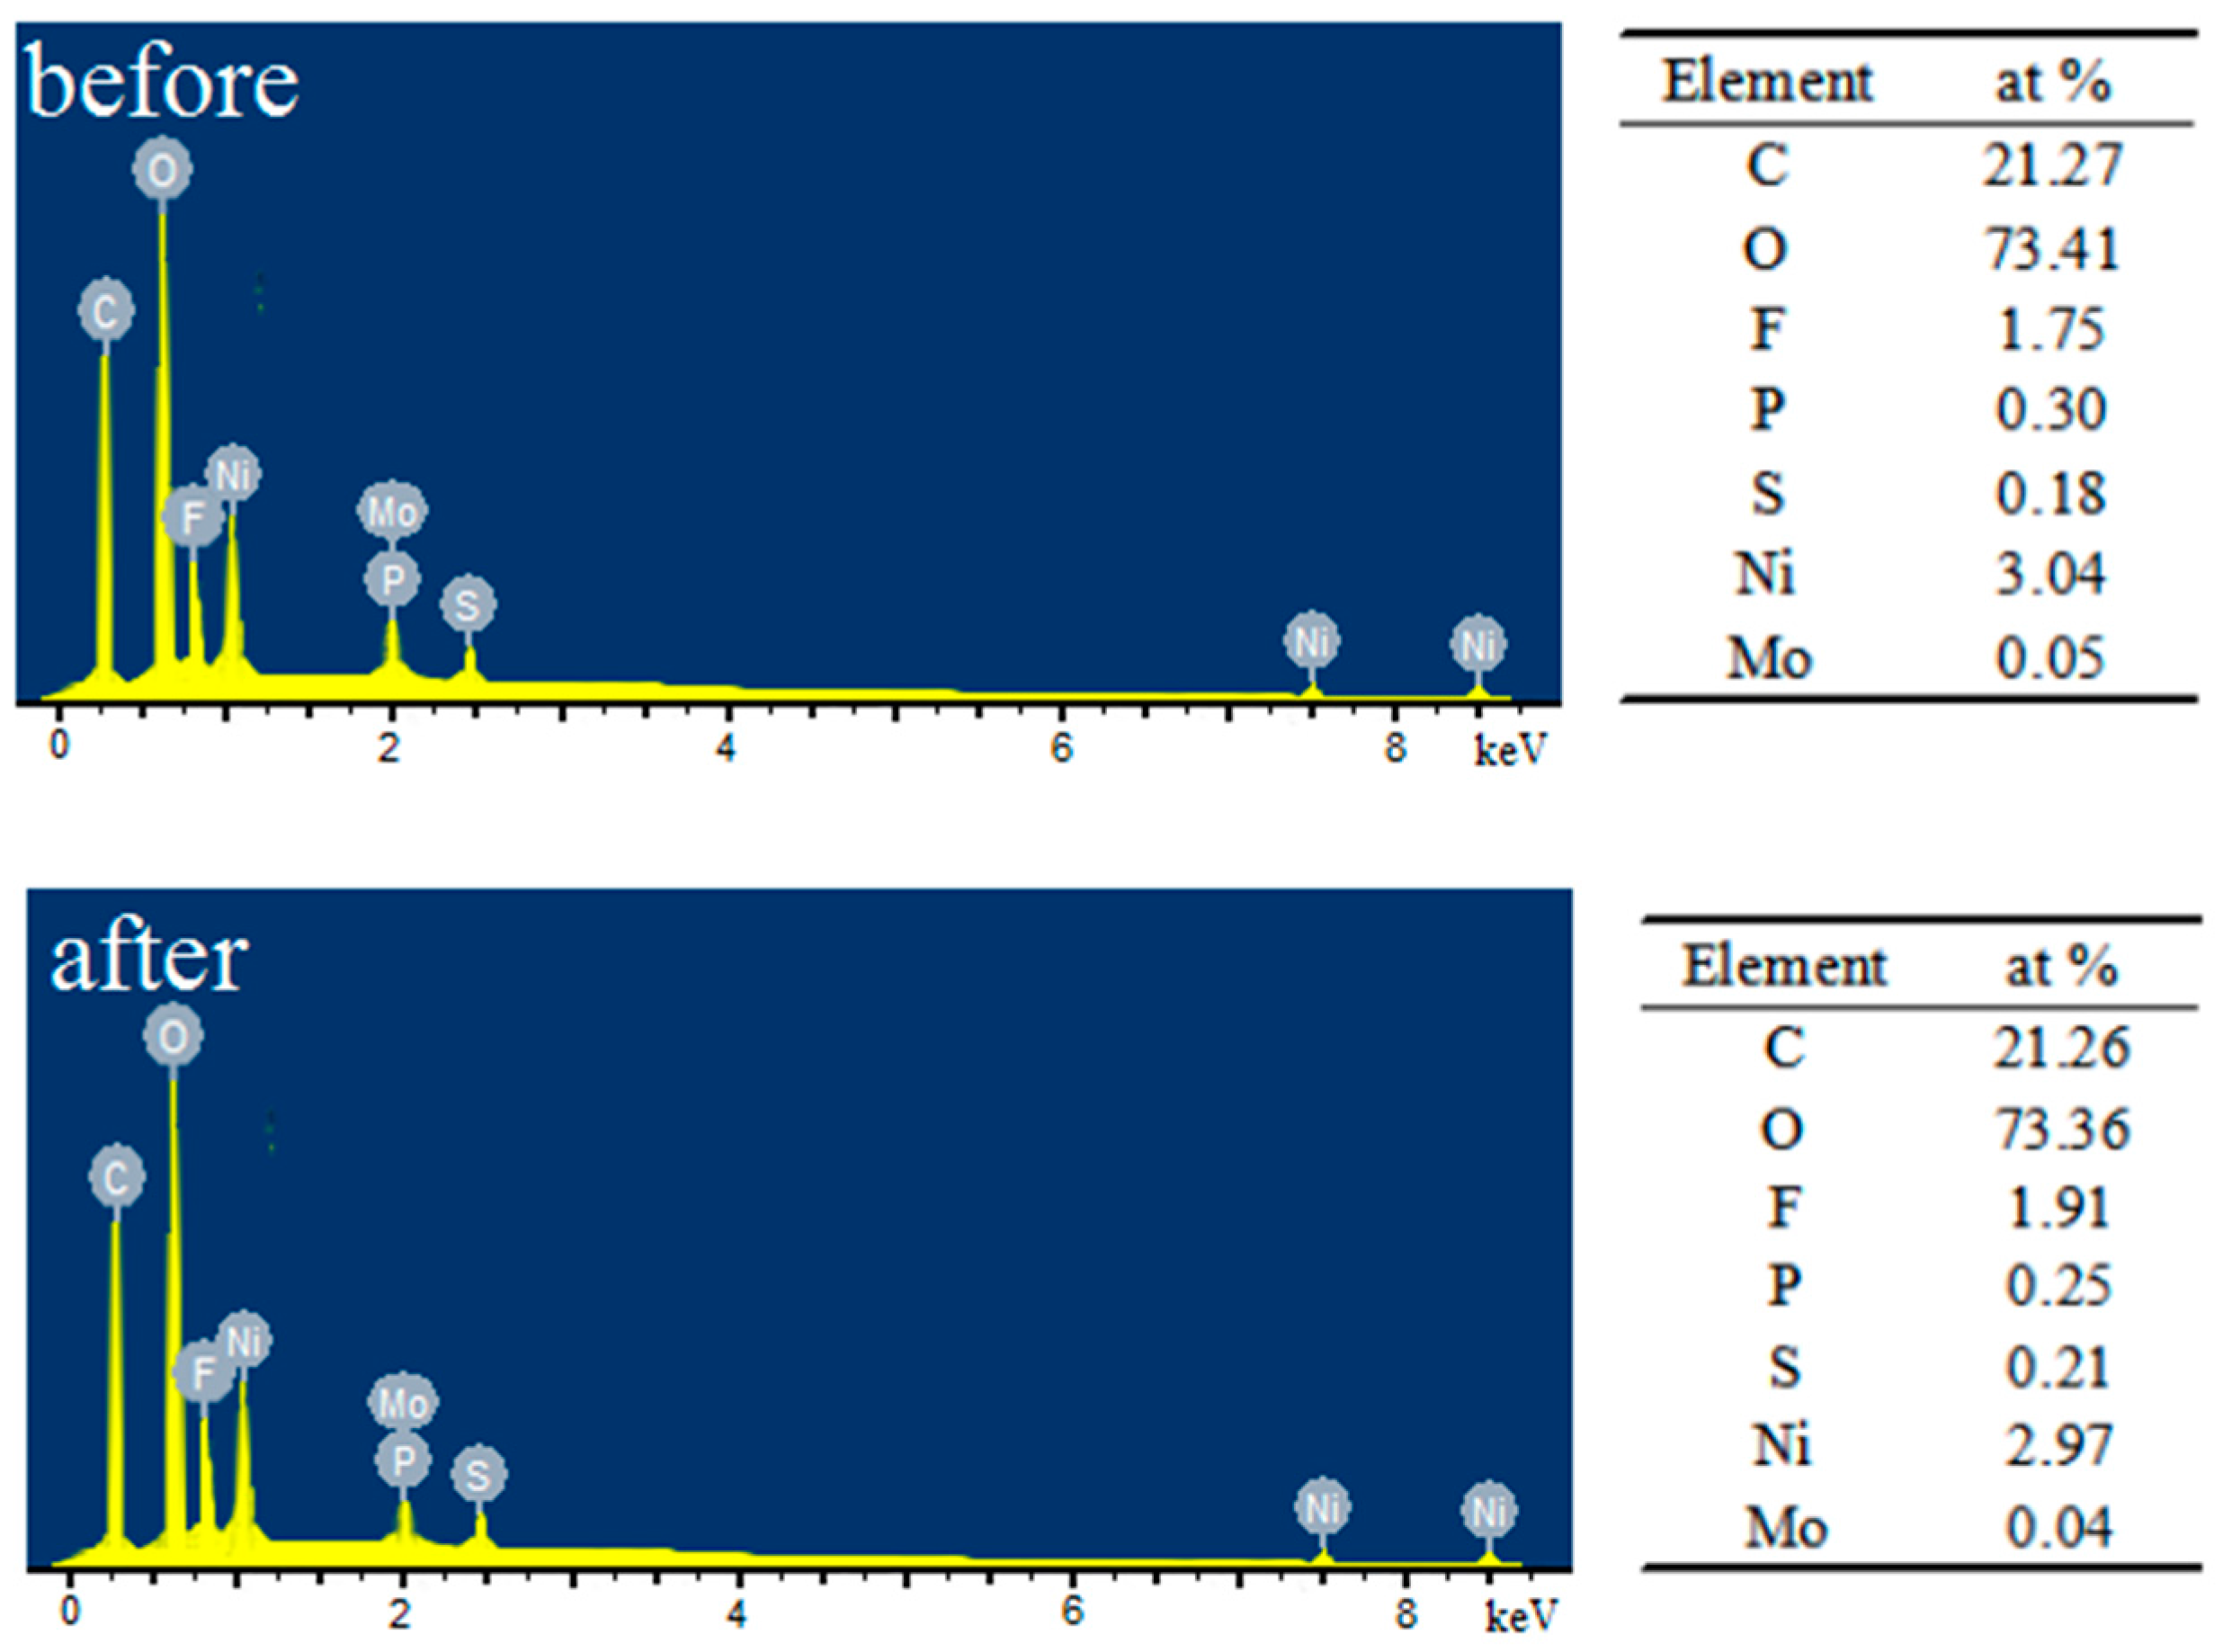
3.1.2. Scanning Electron Microscope (SEM) and Energy Dispersive Spectrometry (EDS)

SEM images of the pristine MoS2 and the three Ni–P/MoS2 composite samples are presented in Figure 2. The MoS2 sample shows a nanoflower-like morphology (Figure 2a). As for the Ni–LP/MoS2 composite, the morphology (Figure 2b) of this sample is similar to that of MoS2, but some scattered agglomerates stacking on the surfaces of MoS2 particles can be found. The nanoflower-like morphology corresponding to MoS2 can still be detected, suggesting that the Ni–LP coating does not cover the MoS2 surface completely. For the Ni–MP/MoS2 composite, the nanoflower-like structure of MoS2 (labeled by a blue rectangle in Figure 2c) cannot readily identified; many plates can be found (described by red circles in Figure 2c), which can be assigned to the deposited Ni–MP particles. Unlike the sample of Ni–LP/MoS2, defects (such as void and segregation) existing on the surface of Ni–MP/MoS2 composite are reduced. The morphology of Ni–MP/MoS2 different from that of the Ni–LP/MoS2 could be attributed to the medium crystalline nature of the Ni–MP coating. The smooth, uniform, and cauliflower-like morphology of Ni–HP/MoS2 composite (Figure 2d) can be observed, indicating the amorphous nature of this composite sample. This can be due to the uniform Ni–HP coating anchored to the surface of MoS2.
EDS spectra of the three Ni–P/MoS2 composites were measured, and results are also given in Figure 2. Compared with that of MoS2, as demonstrated by Figure 2, except for S, Mo, and O elements, the existence of Ni and P elements for the three Ni–P/MoS2 composites reveals the anchor of Ni–P coatings on the surface of MoS2. The presence of O element may be assigned to the oxidation of MoS2 particles and Ni–P coatings in air and/or the hydrothermal synthesis process [29,30]. The P and Ni contents (at %) for both Ni–MP/MoS2 and Ni–HP/MoS2 samples are very higher than that of Ni–LP/MoS2 sample, and they follow the order of Ni–LP/MoS2 < Ni–MP/MoS2 < Ni–HP/MoS2; however, S and Mo contents for these three composites are in a reverse trend (Ni–LP/MoS2 > Ni–MP/MoS2 > Ni–HP/MoS2). This can be explained as the plating rate of Ni–LP bath system being smaller than those of the Ni–MP and Ni–HP systems, because of the low addition of sodium hypophosphite in the Ni–LP bath solution. Generally, plating rates of the three Ni–P plating systems follow the sequence: Ni–HP > Ni–MP > Ni–LP, the thickness of Ni–LP coating will be thinner than those of other two Ni–P coatings. Thus, the overlapped percentage of MoS2 by the Ni–LP coating is smaller than those by Ni–MP and Ni–HP coatings, that is, the exposed sites of MoS2 for Ni–LP/MoS2 are larger than those for Ni–MP/MoS2 and Ni–HP/MoS2 composites. Based on this analysis, for the three Ni–P/MoS2 composites, we can confirm that the contents of P, Ni, S, and Mo elements follow the order mentioned above.

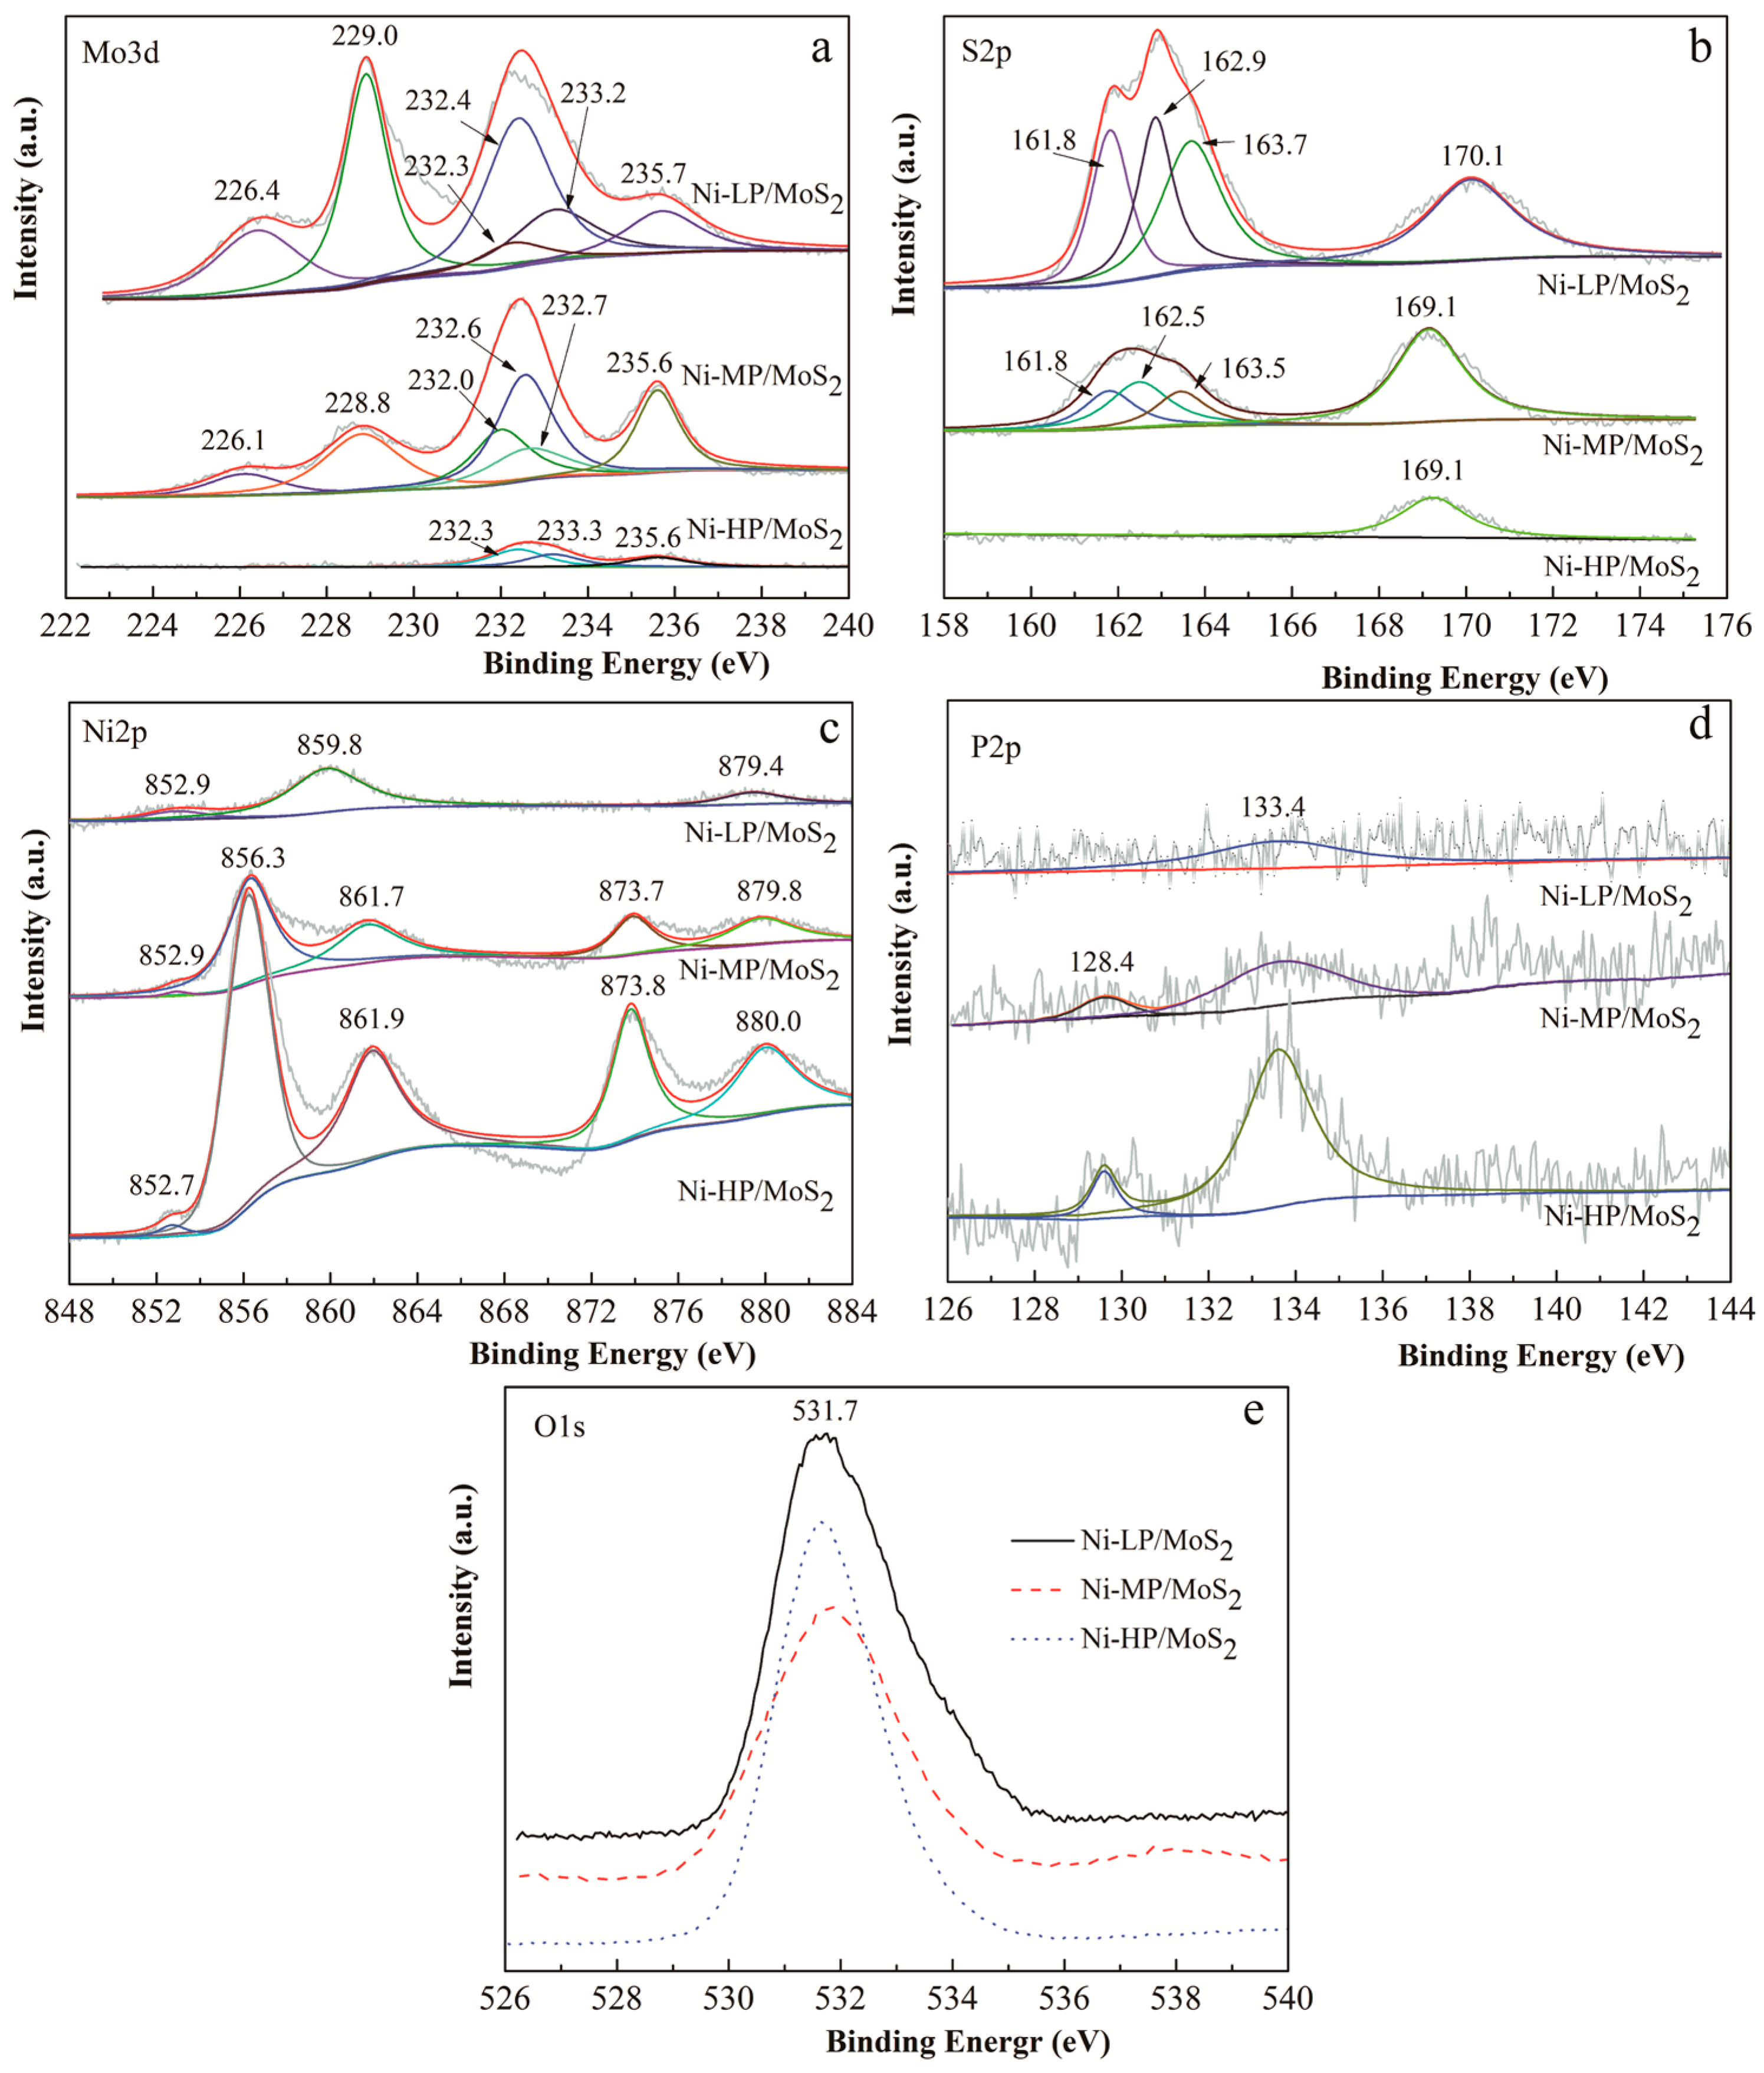
3.1.3. X-ray Photoelectron Spectroscopy (XPS)

The elemental compositions and chemical states of the three Ni–P/MoS2 composites were characterized by XPS, and results are depicted in Figure 3.
The Mo 3d XPS spectra (Figure 3a) are deconvoluted into six peaks, the two peaks appearing at 226.4 and 232.3 eV (Ni–LP/MoS2), and 226.1 and 232.0 eV (Ni–MP/MoS2) can be attributed to the S 2s of MoS2; the peaks at 229.0 eV (Ni–LP/MoS2) and 228.8 eV (Ni–MP/MoS2) correspond to Mo 3d5/2. Peaks at 232.4 eV (Ni–LP/MoS2), 232.6 eV (Ni–MP/MoS2) and 232.3 eV (Ni–HP/MoS2) can be assigned to Mo 3d3/2, which suggests the existence of Mo(IV) [16]. Moreover, the peaks at 233.2 eV for Ni–LP/MoS2, 232.7 eV for Ni–MP/MoS2, and 233.3 eV for Ni–HP/MoS2 are ascribed to Mo 3d5/2 component [21]. The peaks with a binding energy of 235.7 eV for Ni–LP/MoS2, and 235.6 eV for the other two composites may be assigned to MoO3 or MoO42−, indicating the oxidation of these samples [29]. As shown by Figure 3b, with respect to S 2p spectrum, four peaks can be observed for the Ni–LP/MoS2 and Ni–MP/MoS2; the peaks at 161.8 and 163.7 eV for Ni–LP/MoS2 (163.5 eV for Ni–MP/MoS2) correspond to the S 2p3/2 and S 2p1/2 lines of MoS2, indicating a −2 oxidation state of sulfur. The peak appearing at 162.9 eV (Ni–LP/MoS2) and 162.5 eV (Ni–MP/MoS2) may be indexed to S2O32−, which can be attributed to the oxidation of sulfur element during the hydrothermal process. The peaks at 170.1 eV (Ni–LP/MoS2) and 169.1 eV (for Ni–MP/MoS2 and Ni–HP/MoS2) are identified to the S4+ state in SO32−, which tends to locate at edges of MoS2 layers [30,31], and also suggesting the oxidation of MoS2.
As for the Ni 2p spectrum (Figure 3c), peaks observed at 852.9 eV (Ni–LP/MoS2 and Ni–MP/MoS2) and 852.7 eV (Ni–HP/MoS2) are corresponding to the fcc Ni. For samples of Ni–MP/MoS2 and Ni–HP/MoS2, the peak at 856.3 eV can be attributed to the oxidized Ni species with a 2+ oxidation state. The peaks with binding energy of 859.8 eV (Ni–LP/MoS2), 861.7 eV (Ni–MP/MoS2), and 861.9 eV (Ni–HP/MoS2) can be ascribed to the satellite of the Ni 2p3/2 line [26,27]. Meanwhile, peaks at 873.7 eV (Ni–MP/MoS2) and 873.8 eV (Ni–HP/MoS2) can be assigned to oxidized Ni species. Peaks at 879.4 eV for Ni–LP/MoS2 (879.8 eV for Ni–MP/MoS2, and 880.0 eV for Ni–HP/MoS2) are corresponding to the satellite of the Ni 2p1/2 line [26,27]. For the P 2p spectrum (Figure 3d), the presence of peak at 128.4 eV for both Ni–LP/MoS2 and Ni–MP/MoS2 composites represents the formation of phosphide [32]; another peak appearing at 133.4 eV for all three Ni–P/MoS2 composites suggests the formation of phosphate [33]. Finally, for the three composites, only one peak at 531.7 eV in correlation to the O 1s can be observed (Figure 3e), indicating the bond formation of Mo(IV)–O [15] because of the oxidation.

3.2. Hydrogen Evolution Reaction (HER) Performance of the Ni–P/MoS2 Composite

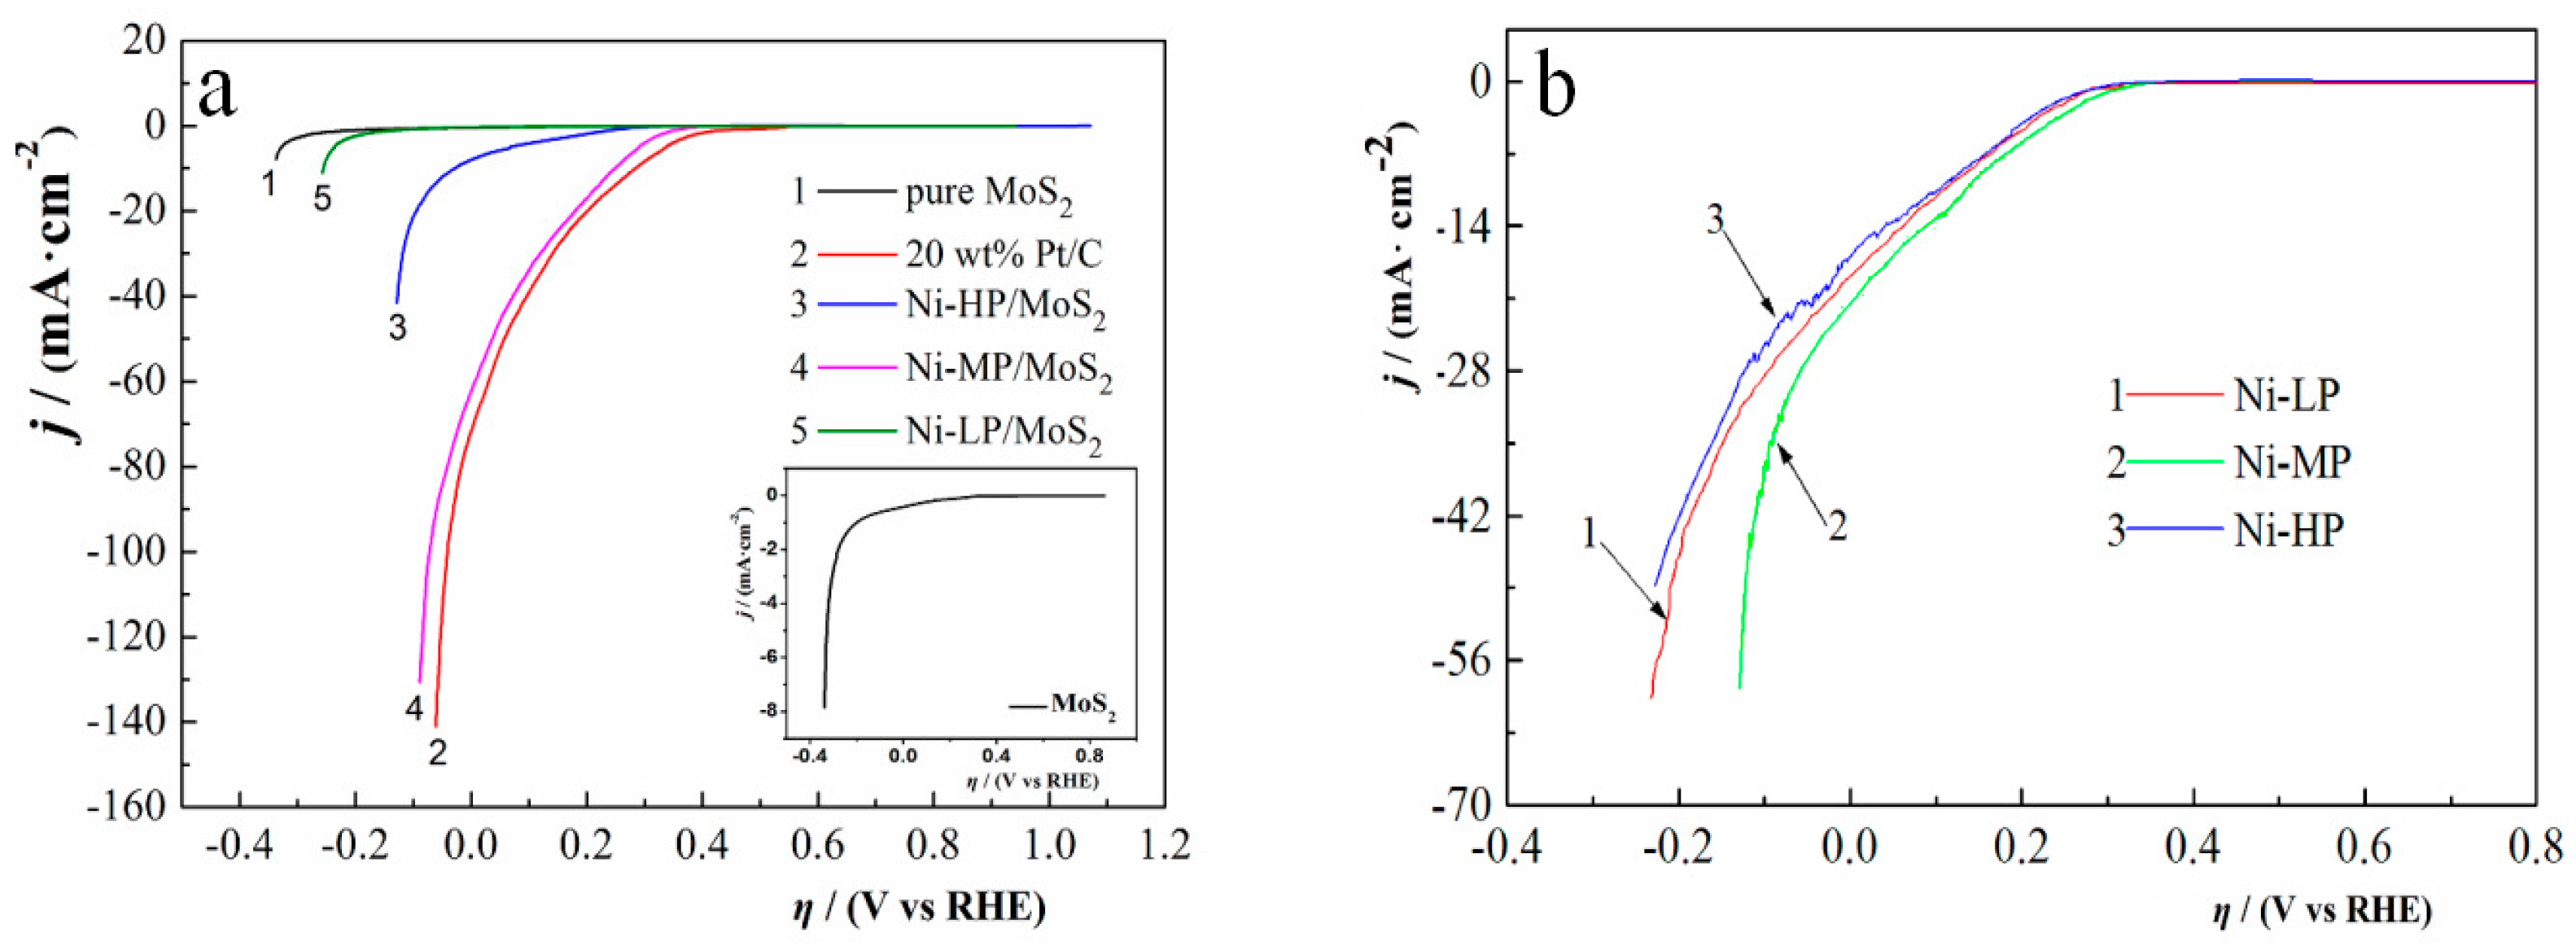
3.2.1. Linear Sweep Voltammetry (LSV)

LSV curves of all samples (MoS2, Ni–LP/MoS2, Ni–MP/MoS2, Ni–HP/MoS2, and Pt/C) measured at room temperature with a scan rate of 2 mV/s are presented in Figure 4a; the obtained onset overpotentials (OVP) are tabulated in Table 1. Besides, for the purpose of comparison, the LSV curves of Ni–LP, Ni–MP, and Ni–HP samples anchored on the GCE electrodes were measured within a potential window between −0.4 V and 0.8 V (vs. RHE), and the results are presented in Figure 4b. Among the eight samples, the commercial Pt/C shows the best HER activity with a current density of 143 mA/cm2 (cathodic overpotential is ~−70 mV vs. RHE) and a positive OVP (360 mV vs. RHE). By contrast, the pure MoS2 exhibits an inferior HER activity because of the more negative OVP than other samples. The HER activities of three Ni–P samples are smaller than those of Ni–MP/MoS2 and Ni–HP/MoS2 composites because of their more negative OVP (vs. RHE) (196 mV for Ni–LP, 214 mV for Ni–MP, 188 mV for Ni–HP). Although HER performances of the three Ni–P/MoS2 composites are lower than that of the commercial Pt/C, they show a more notable HER activity than the sample of MoS2. Of all three Ni–P/MoS2 composites, the Ni–MP/MoS2 sample exhibits the best HER activity; the current density of this sample at the cathodic overpotential of −70 mV (vs. RHE) is 100 mA/cm2, about 70% as that of Pt/C. Also, the OVP value of this sample is higher 475 and 20 mV than those of Ni–LP/MoS2 and Ni–HP/MoS2. Thus, the Ni–MP/MoS2 composite will be competent for being a candidate employed in HER.
The HER activity of Ni–LP/MoS2 is smaller than those of other two composites, this can be due to the fact that the low sodium hypophosphite addition in the plating bath will result in the poor Ni–P deposition, so the enhancement in conductivity of the Ni–LP/MoS2 composite is inconsiderable. With the increase in the sodium hypophosphite addition (from 7.5 to 15 g/L), the Ni–P coating will be easily obtained and the coating becomes thick, thereby giving rise to a high conductivity of the Ni–MP/MoS2 composite. Also, the existence of metastable nickel phosphides, particularly the presence of Ni2P, will be beneficial to the enhancement in electrocatalytic property [34]. Thus, the sample of Ni–MP/MoS2 reflects a profound HER activity. As the addition of sodium hypophosphite in the bath increases from 15 to 30 g/L, the amorphous feature of Ni–HP/MoS2 composite will exert a detrimental effect on the HER performance (by a comparison of curves 4 and 5 in Figure 4a).

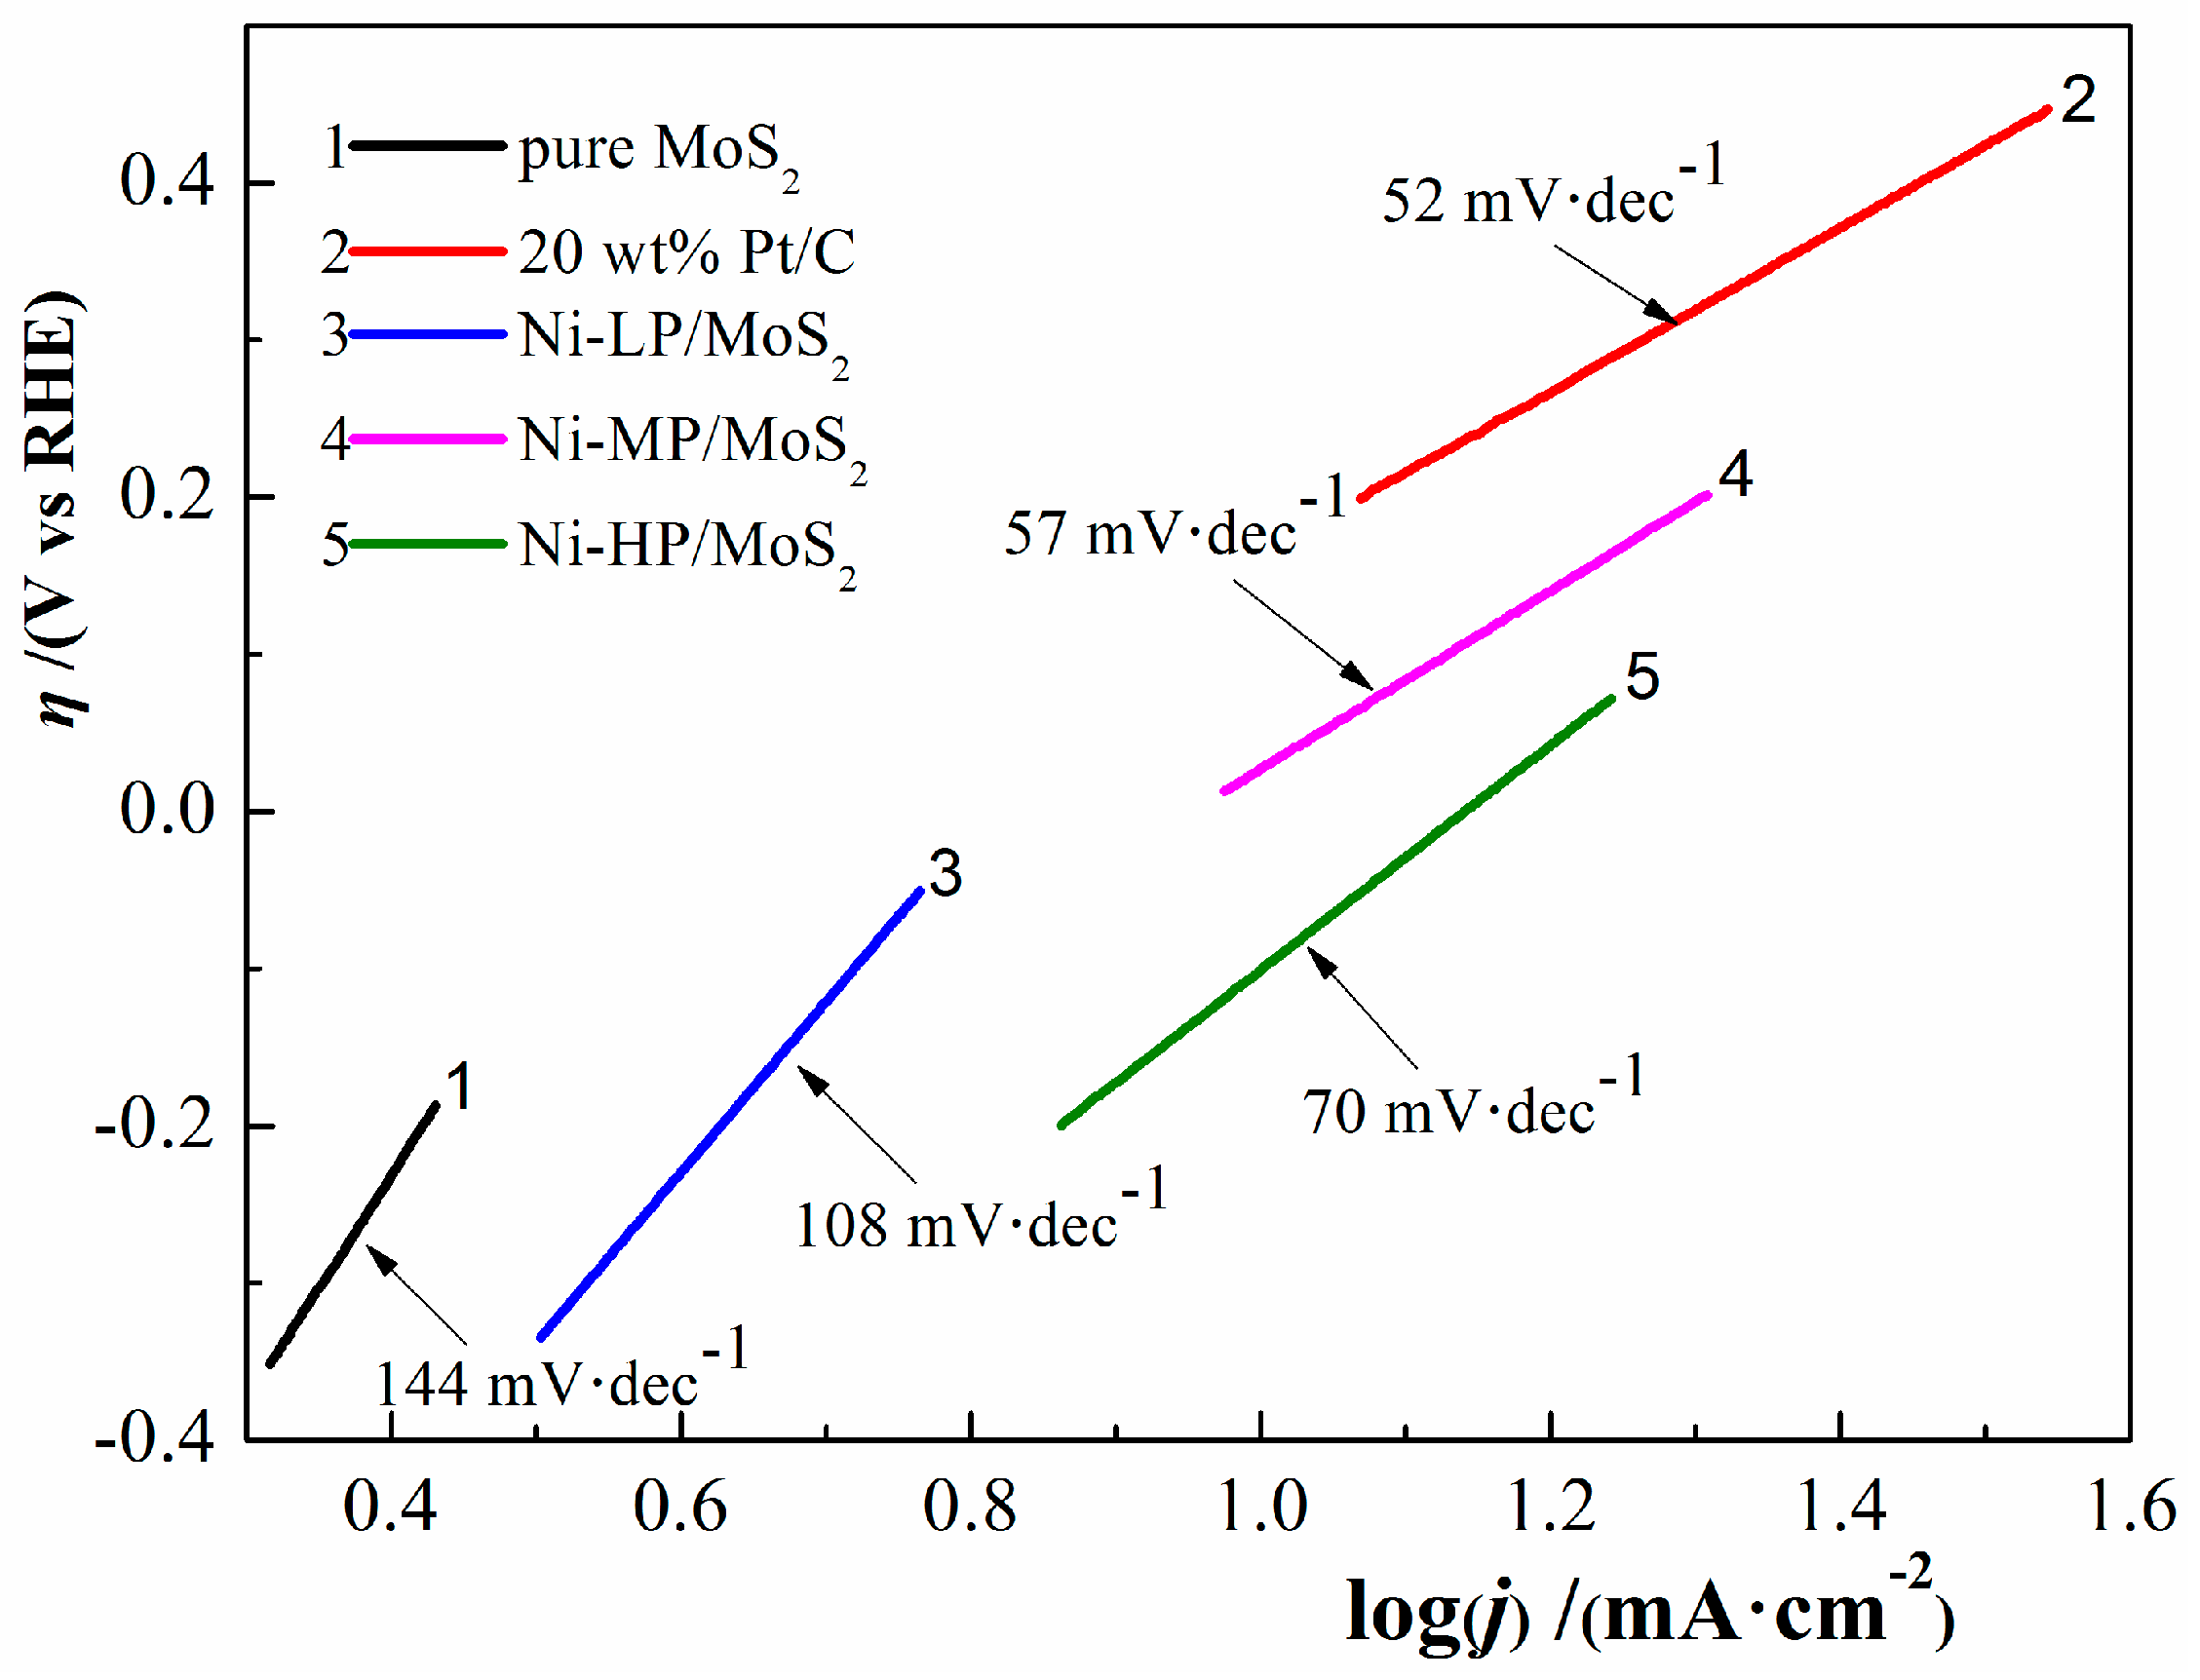
3.2.2. Tafel Polarization

The linear Tafel polarization curves are shown in Figure 5, the relation between overpotential (η) and current density (log j) is illustrated using Equation (1)
η = b × log j + a
where, b represents the Tafel slope, a is a constant. Moreover, the symmetry factor (β) reflecting the HER activity can be calculated by the Tafel slope via Equation (2)
β = 2.303   R T n e b F
where, parameters of R, T, ne, and F are corresponding to the gas constant (8.314 J/(K·mol)), absolute temperature, number of exchanged electrons, and the Faraday constant (96,485 C/mol), respectively. The values of b and β derived from the analysis of Figure 5 are also summarized in Table 1.
A small Tafel slope indicates a high HER activity; as shown by Figure 5, the HER performance of the pure MoS2 is inferior because of the large value of Tafel slope (144 mV/decade). Among the three Ni–P/MoS2 samples, the Ni–MP/MoS2 composite possesses a minimum b value (57 mV/decade) very close to that of the Pt/C sample (52 mV/decade), thereby indicating the promising HER performance of this composite. However, values of b for Ni–LP/MoS2 and Ni–HP/MoS2 composites are 108 and 70 mV/decade, respectively, so their HER performances are lower than that of Ni–MP/MoS2 sample [35].

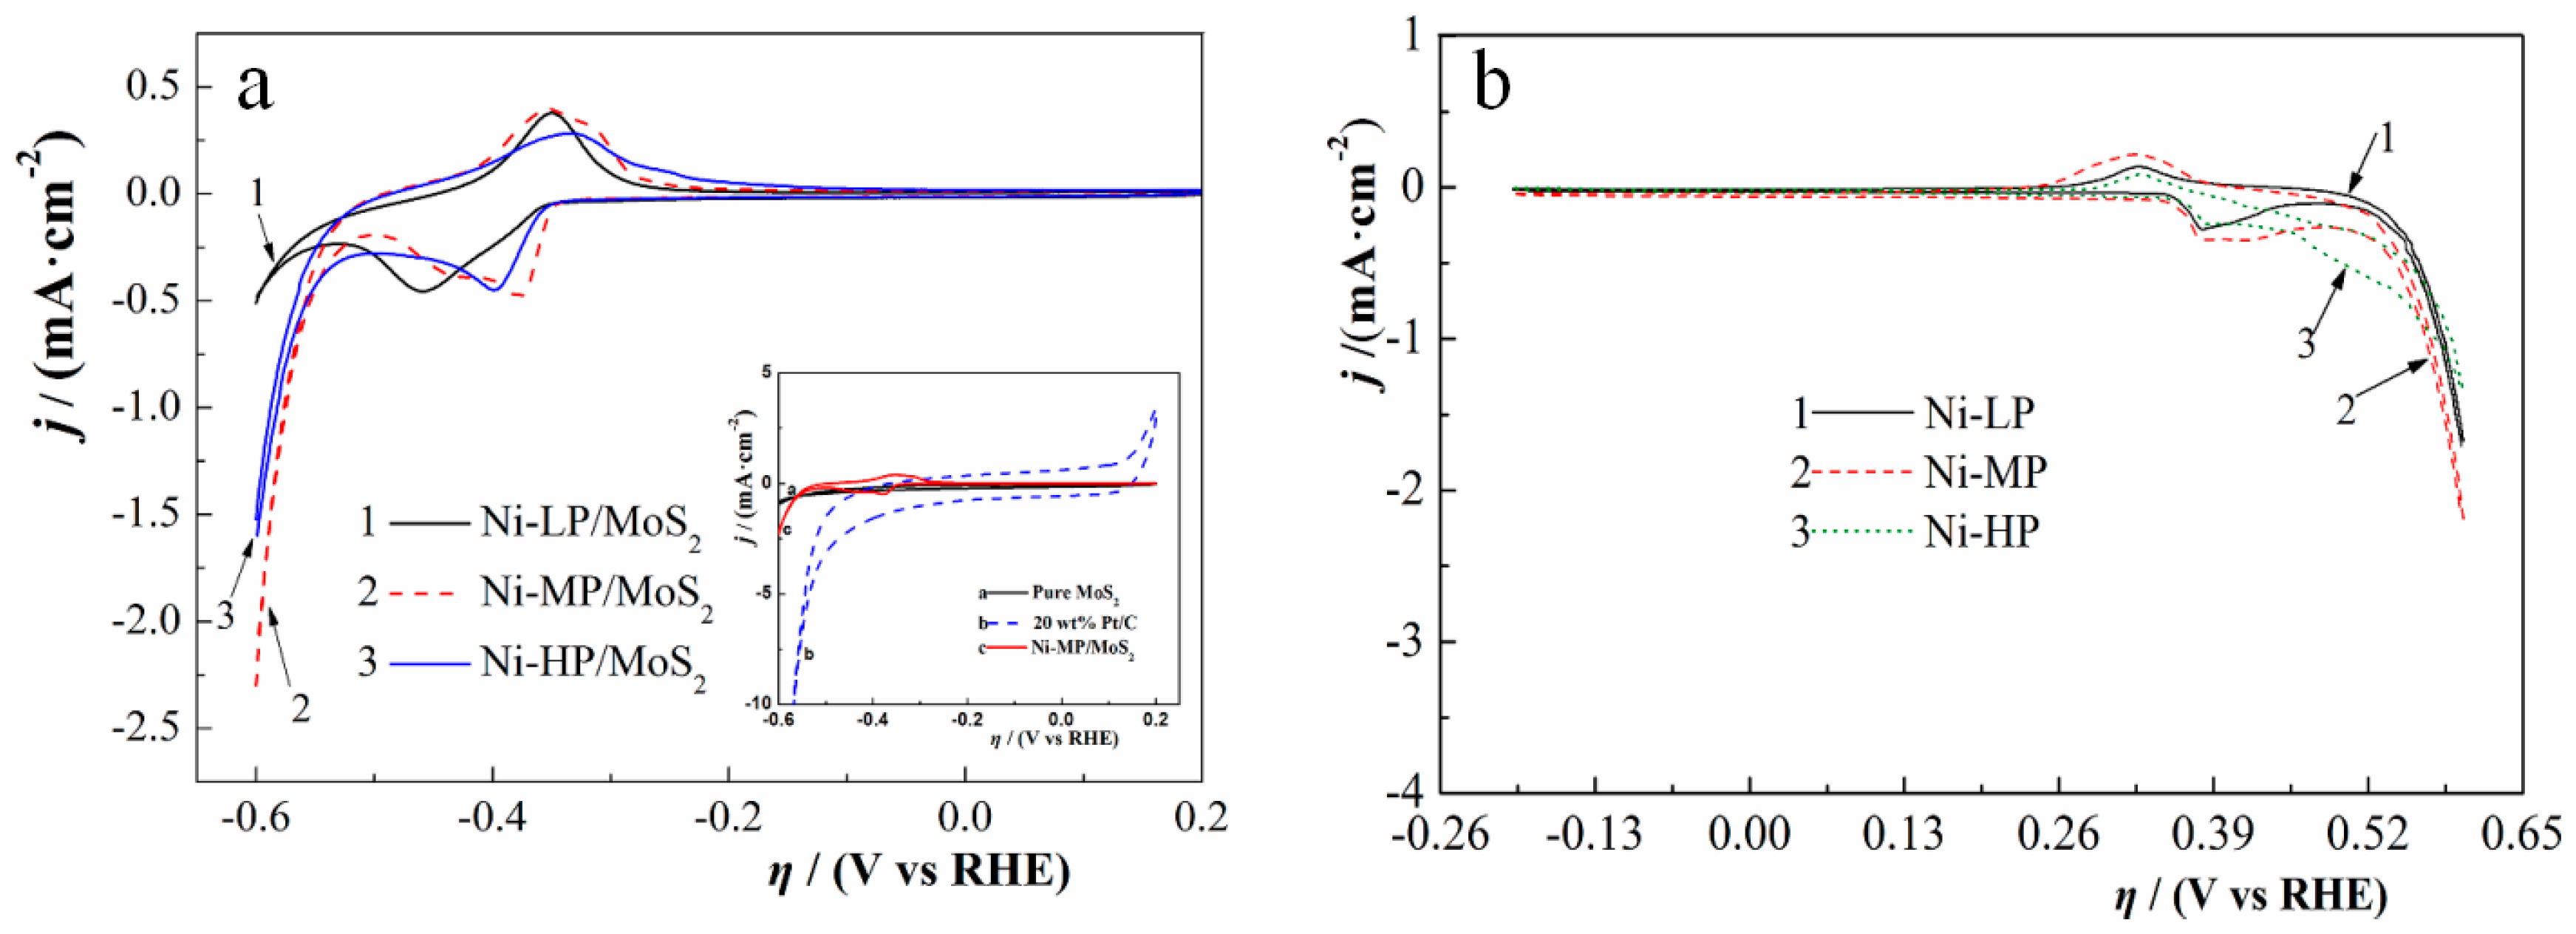
3.2.3. Cycle Voltammograms (CV)

CV curves of the three Ni–P/MoS2 samples were tested within a potential window of −0.6 to 0.2 V (vs. RHE) at a scan rate of 10 mV/s (Figure 6a). As indicated byFigure 6a, the oxidation peaks locate at the range from −0.35 to −0.32 V, while the reduction peaks appear at the potential in the range of −0.46~−0.37 V. The detected quasi-reversible redox peaks may be related to the processes of electrochemical hydrogen adsorption and electrochemical hydrogen desorption. The CV curves of the pure MoS2 and Pt/C samples (inset in Figure 6a) show a similar potential window as those of Ni–P/MoS2 composites. The peak current density for all samples follows the trend: MoS2 < Ni–LP/MoS2 < Ni–HP/MoS2 < Ni–MP/MoS2 < Pt/C, revealing the prominent HER performances of the commercial Pt/C and three Ni–P/MoS2 composites. In addition, CV curves of three Ni–P samples were demonstrated in Figure 6b. These three samples show an oxidation peak at ~0.32 V and a reduction peak at ~0.38 V. The reduction peak may be assigned to the hydrogen adsorption and desorption processes. The parameter (n, the number of active sites, mol/cm2) embodying the HER activity can be obtained using Equation (3) [36]
n = Q 2 F
where Q is the voltammetric charge (C/cm2), F is the Faraday constant, and the coefficient of 2 represents the fact that two electrons are required to form a hydrogen molecule from two water molecules. In comparison with the value of n, HER performances for all samples in Figure 6a with a descending order of Pt/C > Ni–MP/MoS2 > Ni–HP/MoS2 > Ni–LP/MoS2 > MoS2 can be attested. For comparison, we also calculated the active number of sites of three Ni–P samples (2.04 × 10⁻⁸ mol/cm2 for Ni–LP, 2.42 × 10⁻⁸ mol/cm2 for Ni–MP, and 2.19 × 10⁻⁸ mol/cm2 for Ni–HP). Among the three Ni–P samples, the Ni–MP coating shows a higher HER performance than Ni–LP and Ni–HP samples because of the small m values of them; but m values of these three Ni–P samples are smaller than that of Ni–MP/MoS2. Thus, except for that of the well known commercial Pt/C, the HER activity of Ni–MP/MoS2 is most noticeable.

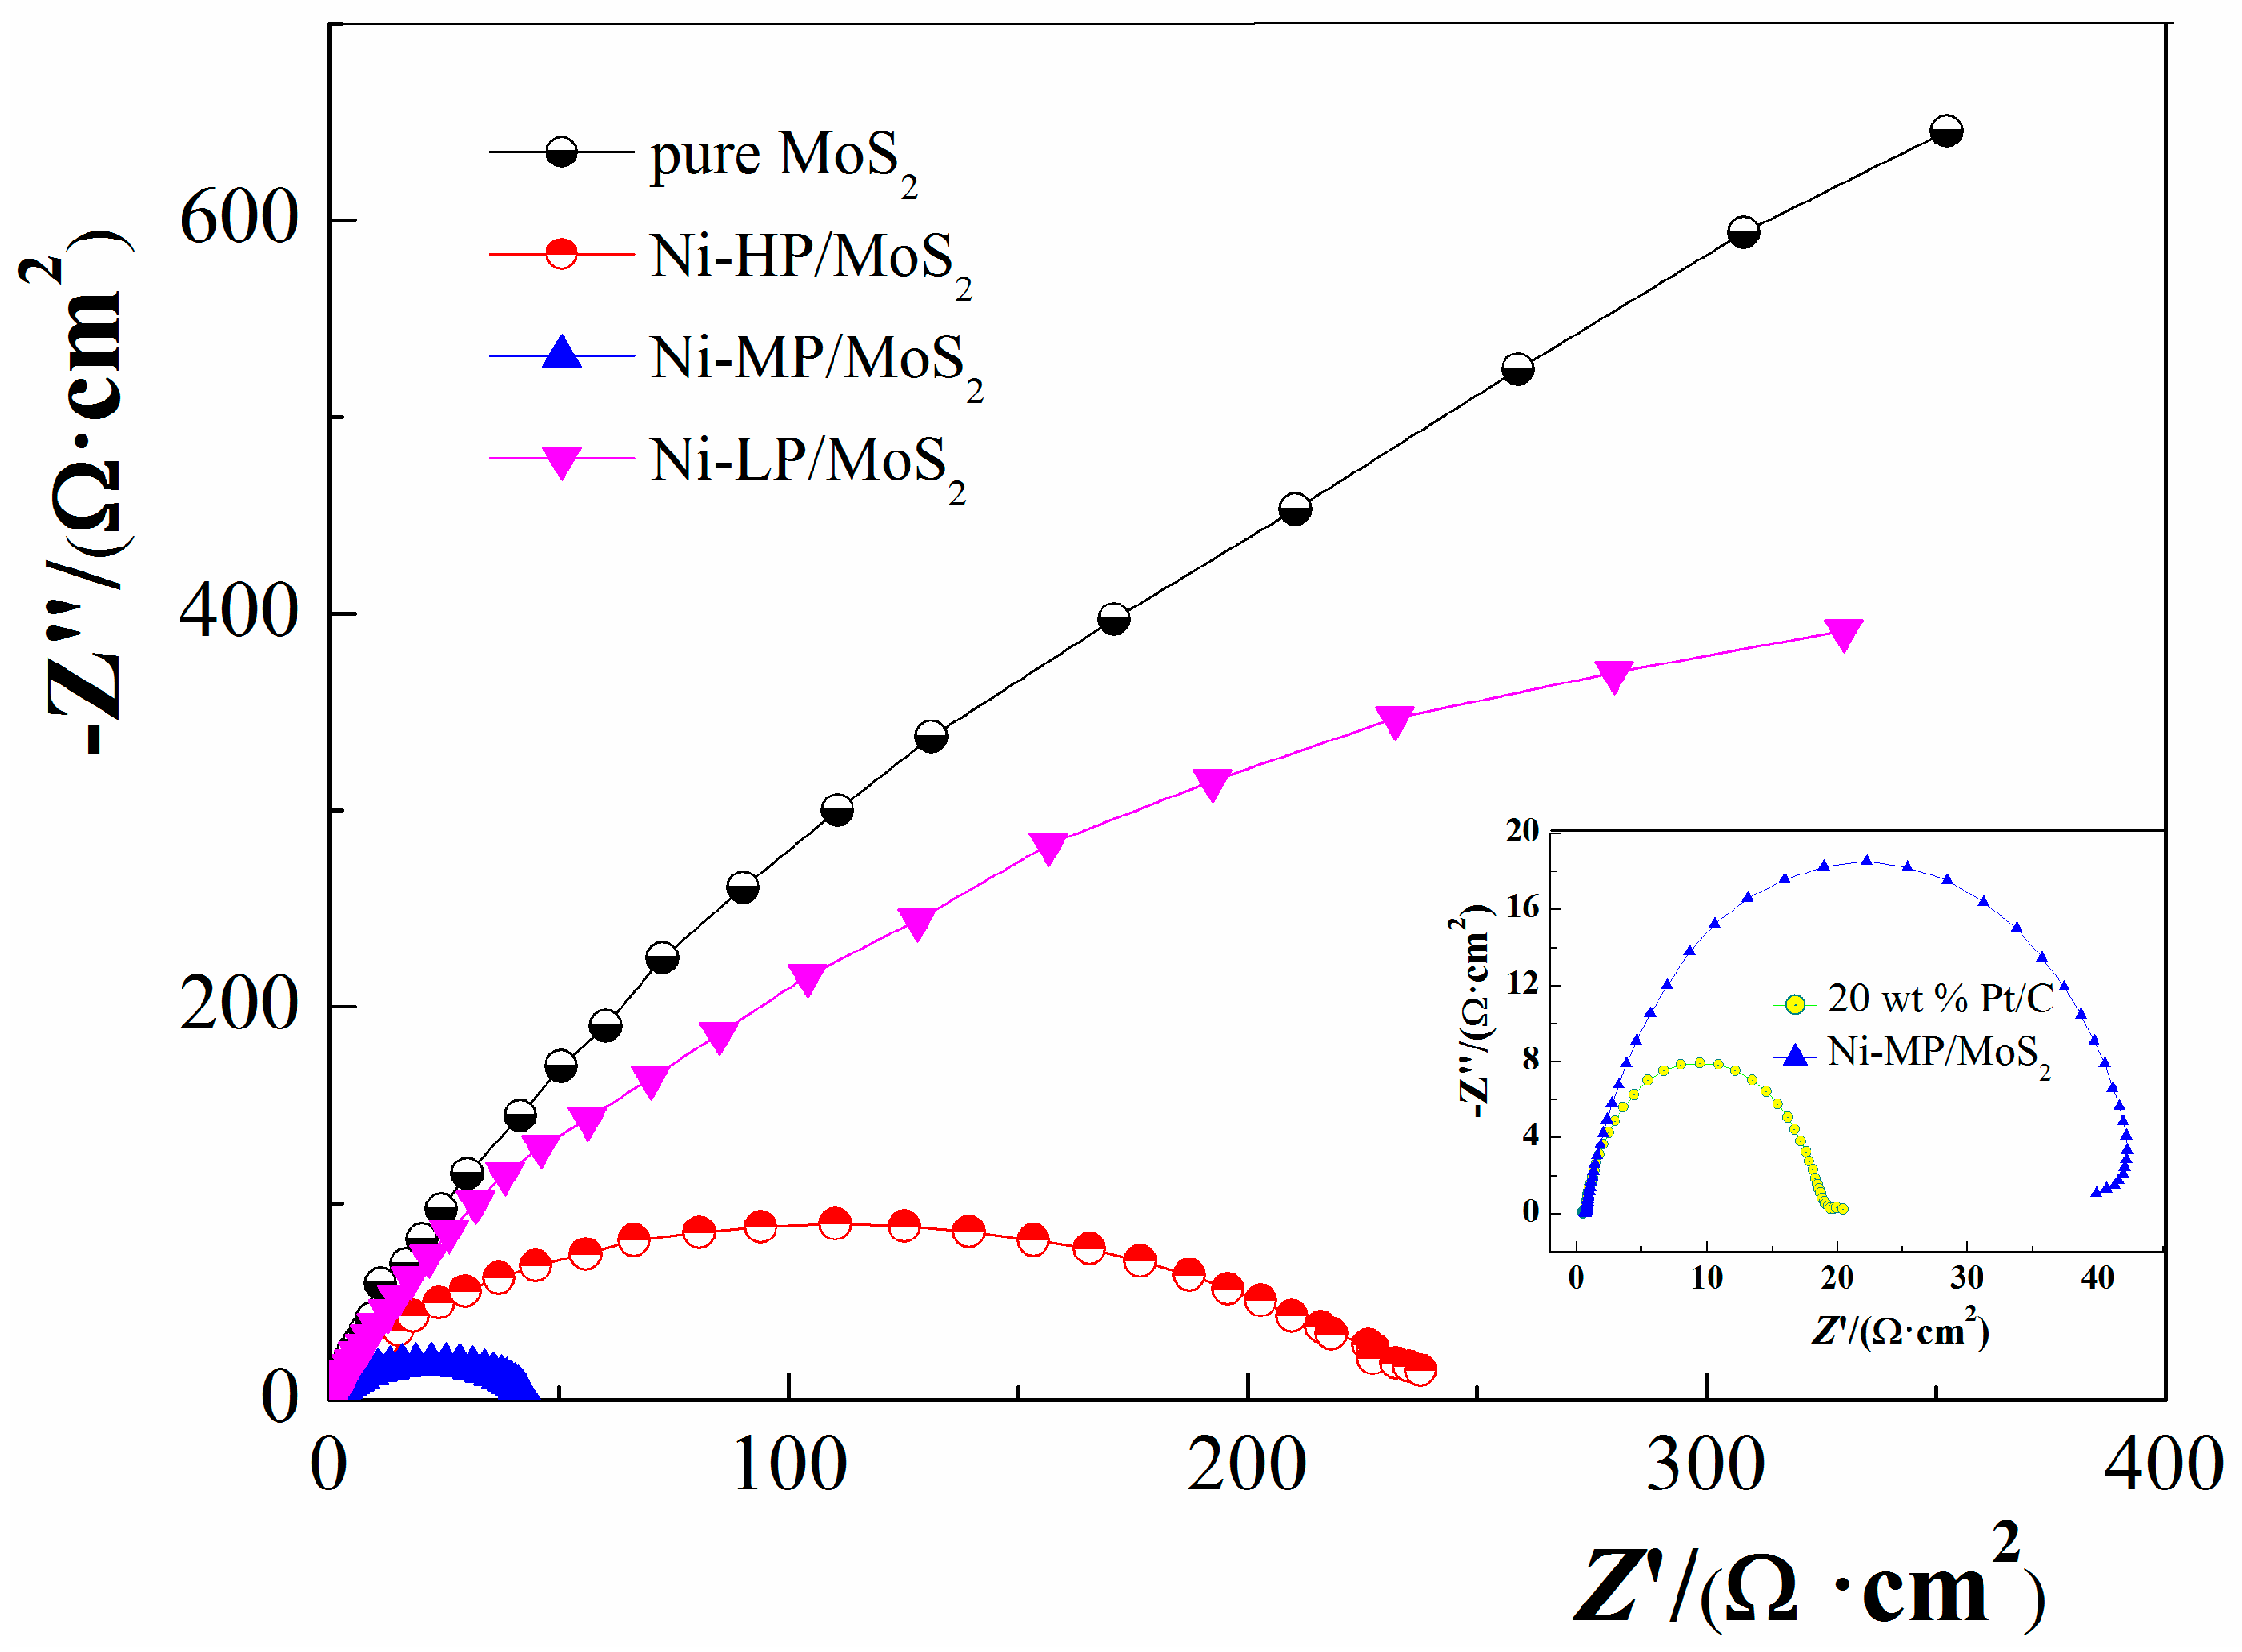
3.2.4. Electrochemical Impedance Spectroscopy (EIS)

The obtained Nyquist plots for the three Ni–P/MoS2 samples are shown in Figure 7. An equivalent circuit model of Rs(QRct) (where, Rs, and Rct are the solution resistance, and charge transfer resistance; Q presents the constant phase element, CPE) was employed to analyze the electrochemical impedance data. The value of double layer capacity (Cdl) is calculated using Equation (4).
C dl = Y 0 × ( R s 1 + R ct 1 ) m 1
where, Y0 (S s/cm2) is the CPE coefficient in line with the double layer capacitance; m, related to the constant phase angle, is the CPE exponent. The EIS data were analyzed by the free-charged Zsimpwin software, and the results are summarized in Table 2. Based on the value of m (ranging from 0.835 to 0.871), CPE shows a capacity nature; the low Rs for all samples indicates the excellent conductivity of the electrolyte. The smaller Rct and the higher Cdl for the sample of Ni–MP/MoS2 manifests that this composite owns a more excellent HER property than other two composites.
In addition, another parameter of exchange current density (j0) can also be calculated using Equation (5)
j 0 = R T n e F R ct
where, ne is the number of transferred electrons, and parameters of R, T, and F are already defined by Equation (2). As ascertained by the data (Table 2), without any doubt, the Pt/C sample shows the best HER performance followed by the Ni–P/MoS2 composites and last by MoS2 sample. The three Ni–P/MoS2 samples show a larger j0 than the virgin MoS2, consistent with the analyses of Rct and Cdl. The value of j0 for the Ni–MP/MoS2 sample is larger than those of other two composite samples, so the charming HER behavior of Ni–MP/MoS2 sample is further validated [37].

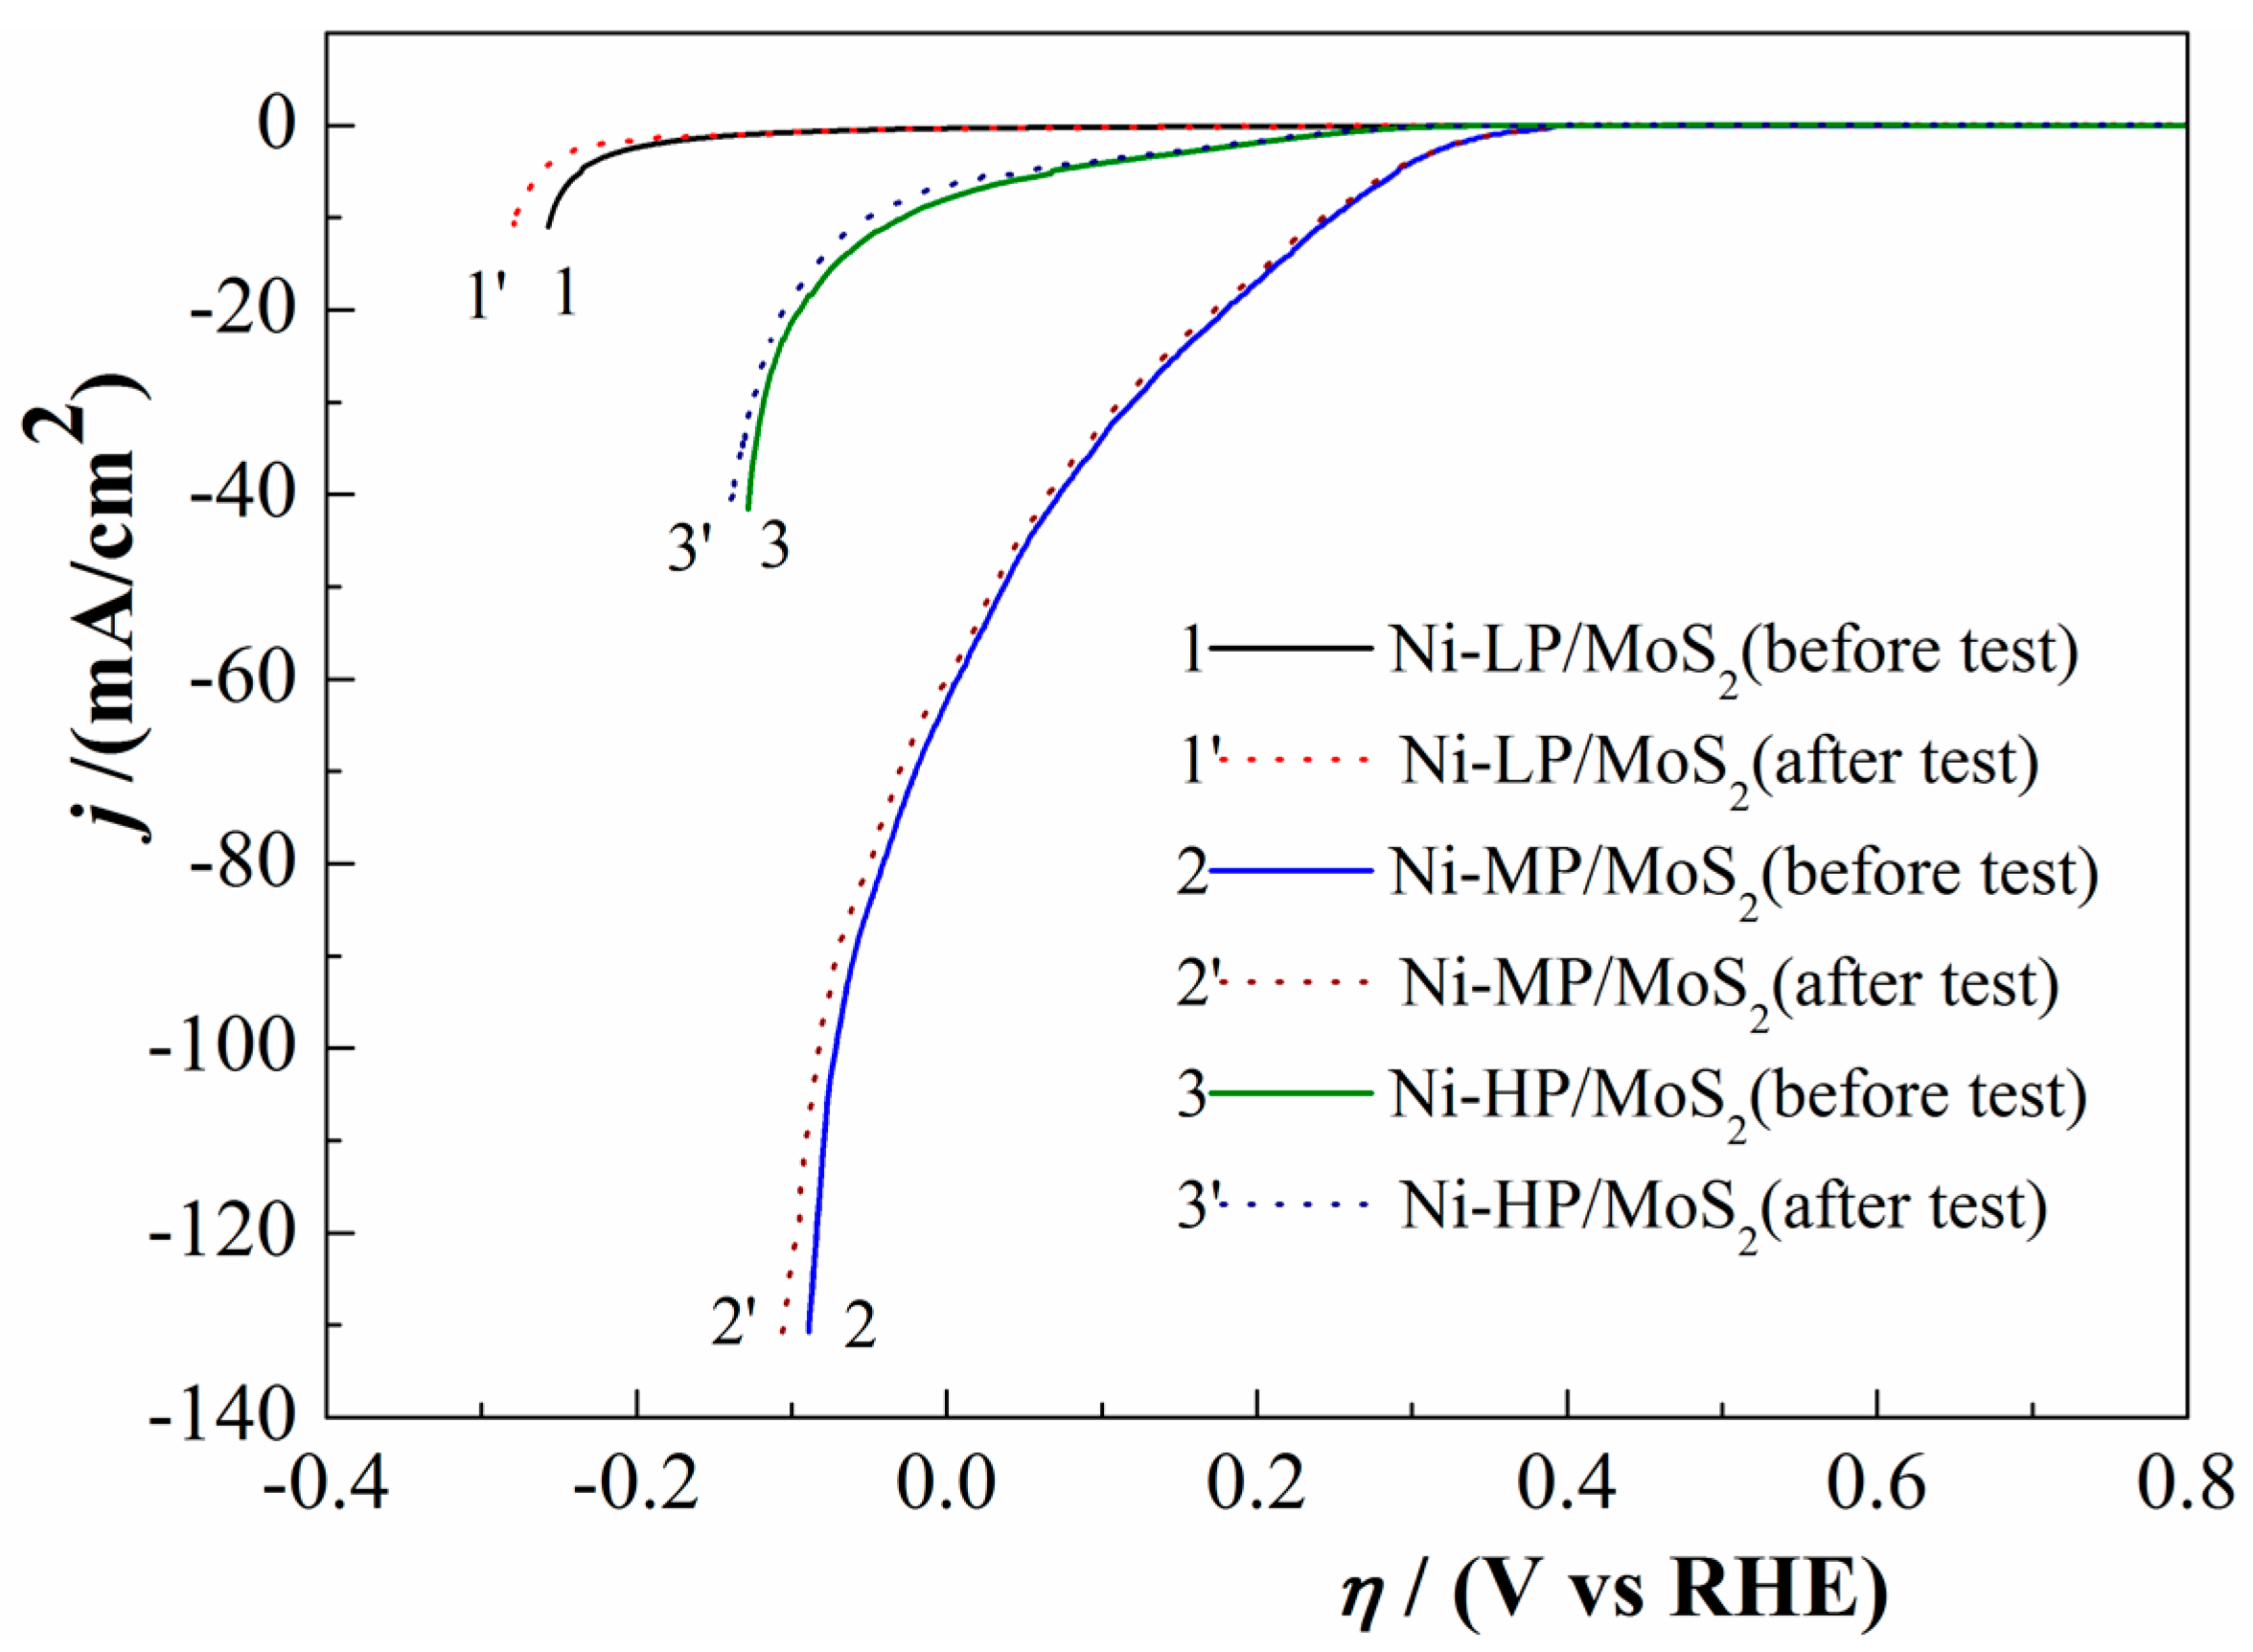
3.3. HER Stability of the Ni–P/MoS2 Hybrid Composites

From an engineering perspective, besides the HER activity, the stability is another essential requirement to guarantee the durability of Ni–P/MoS2 composite. Hence, continuous CV tests for 1000 cycles were carried out at a rate of 50 mV/s (Figure 8) to evaluate the stabilities of Ni–LP/MoS2, Ni–MP/MoS2, and Ni–HP/MoS2 composites. As shown in Figure 8, by a comparison of the current density at the initial time and after the long-term test, electrocatalytic behaviors of the three Ni–P/MoS2 composites just show a very slight decay, and thereby indicate an excellent HER durability of the composite. For example, the cathodic current density of Ni–MP/MoS2 composite only shows a decrease of 4% (η = 80 mV vs. RHE). In addition, EDS spectra of the Ni–MP/MoS2 composite before and after the stability tests were measured (Figure 9) to monitor the leaching of phosphorus element. As indicated by data reported in Figure 9, about 16.7% phosphorus element is leached out; thus, in the further research, the enhancement in the stability for the Ni–MP/MoS2 sample will be considered.

4. Conclusions

In summary, three types Ni–P coatings (Ni–LP, Ni–MP, and Ni–HP) were anchored to the surface of MoS2 via an electroless plating process. Structures, morphologies, chemical components of the fabricated Ni–LP/MoS2, Ni–MP/MoS2, and Ni–HP/MoS2 composites were characterized. Also, the HER performances of them in 1.0 mol/L KOH solution were evaluated. The main conclusions are shown as follows:
(1)
The mixed crystal features for both Ni–LP/MoS2 and Ni–MP/MoS2, and the amorphous characteristic for Ni–HP/MoS2 are validated. The phosphorous content of Ni–P coating shows a remarkable influence on the crystallinity and the morphology of the Ni–P/MoS2 composite. The anchor of Ni–P coatings on the surface of MoS2 is helpful in the enhancement of its HER property, the fabricated Ni–P/MoS2 composite shows a more remarkable HER activity than the pure MoS2.
(2)
Among the three Ni–P/MoS2 composites, the HER performance of Ni–MP/MoS2 sample is higher than those of other two samples, which is validated by positive onset potential (~320 mV), large cathodic current (100 mA/cm2 at η = −70 mV vs. RHE), and small Tafel slope (~57 mV/decade).
(3)
The excellent HER property of Ni–MP/MoS2 composite can be due to the excellent conductivity of Ni–MP coating, as well as the coexistence of some nickel phosphides.

Acknowledgments

This work was supported by the Hebei Provincial Natural Science Foundation of China (Grant No. B2016203012).

Author Contributions

Jun He prepared the manuscript. Laizhou Song designed this work and gave the guidance for HER evaluation. Jun He and Jiayun Yan analyzed the data and reviewed the manuscript. Ning Kang, Yingli Zhang, and Wei Wang performed the experiments and the measurement of HER. All authors read and approved the manuscript.

Conflicts of Interest

The authors declare no conflict of interest.

References

  1. Wang, D.Z.; Pan, Z.; Wu, Z.Z.; Wang, Z.P.; Liu, Z.H. Hydrothermal synthesis of MoS2 nanoflowers as highly efficient hydrogen evolution reaction catalysts. J. Power Sources 2014, 264, 229–234. [Google Scholar] [CrossRef]
  2. Liu, N.; Yang, L.C.; Wang, S.N.; Zhong, Z.W.; He, S.N.; Yang, X.Y.; Gao, Q.S.; Tang, Y. Ultrathin MoS2 nanosheets growing within an in-situ-formed template as efficient electrocatalysts for hydrogen evolution. J. Power Sources 2015, 275, 588–594. [Google Scholar] [CrossRef]
  3. Min, S.X.; Lu, G.X. Sites for high efficient photocatalytic hydrogen evolution on a limited-layered MoS2 cocatalyst confined on graphene sheets-the role of graphene. J. Phys. Chem. C 2012, 116, 25415–25424. [Google Scholar] [CrossRef]
  4. Dang, H.F.; Qiu, Y.F.; Cheng, Z.Y.; Yang, W.; Wu, H.Y.; Fan, H.B.; Dong, X.F. Hydrothermal preparation and characterization of nanostructured CNTs/ZnFe2O4 composites for solar water splitting application. Ceram. Int. 2016, 42, 10520–10525. [Google Scholar] [CrossRef]
  5. Komova, O.V.; Kayl, N.L.; Odegova, G.V.; Netskina, O.V.; Simagina, V.I. Destabilization of NH3BH3 by water during hydrothermolysis as a key factor in the high hydrogen evolution rates. Int. J. Hydrog. Energy 2016, 41, 17484–17495. [Google Scholar] [CrossRef]
  6. Frame, F.A.; Osterloh, F.E. CdSe–MoS2: A quantum size-confined photocatalyst for hydrogen evolution from water under visible light. J. Phys. Chem. C 2010, 114, 10628–10633. [Google Scholar] [CrossRef]
  7. Cheng, R.L.; Zhang, L.X.; Fan, X.Q.; Shi, J.L. One-step construction of FeOx modified g–C3N4 for largely enhanced visible-light photocatalytic hydrogen evolution. Carbon 2016, 101, 62–70. [Google Scholar] [CrossRef]
  8. Popczun, E.J.; McKone, J.R.; Read, C.G.; Read, C.G.; Biacchi, A.J.; Wiltrout, A.M.; Lewis, N.S.; Schaak, R.E. Nanostructured nickel phosphide as an electrocatalyst for the hydrogen evolution reaction. J. Am. Chem. Soc. 2013, 135, 9267–9270. [Google Scholar] [CrossRef] [PubMed]
  9. Voiry, D.; Yamaguchi, H.; Li, J.W.; Silva, R.; Alves, D.C.; Fujita, T.; Chen, M.W.; Asefa, T.; Shenoy, V.B.; Eda, G.; et al. Enhanced catalytic activity in strained chemically exfoliated WS2 nanosheets for hydrogen evolution. Nat. Mater. 2013, 12, 850–855. [Google Scholar] [CrossRef] [PubMed]
  10. Zheng, X.L.; Xu, J.B.; Yan, K.Y.; Wang, H.; Wang, Z.L.; Yang, S.H. Space-confined growth of MoS2 nanosheets within graphite: The layered hybrid of MoS2 and graphene as an active catalyst for hydrogen evolution reaction. Chem. Mater. 2014, 26, 2344–2353. [Google Scholar] [CrossRef]
  11. Liu, Y.R.; Hu, W.H.; Li, X.; Dong, B.; Shang, X.; Han, G.Q.; Chai, Y.M.; Liu, Y.Q.; Liu, C.G. Facile one-pot synthesis of CoS2–MoS2/CNTs as efficient electrocatalyst for hydrogen evolution reaction. Appl. Surf. Sci. 2016, 384, 51–57. [Google Scholar] [CrossRef]
  12. Tsai, C.; Abild-Pedersen, F.; Nørskov, J.K. Tuning the MoS2 edge-site activity for hydrogen evolution via support interactions. Nano Lett. 2014, 14, 1381–1387. [Google Scholar] [CrossRef] [PubMed]
  13. Jing, Y.; Ortiz-Quiles, E.O.; Cabrera, C.R.; Chen, Z.F.; Zhou, Z. Layer-by-layer hybrids of MoS2 and reduced graphene oxide for lithium ion batteries. Electrochim. Acta 2014, 147, 392–400. [Google Scholar] [CrossRef]
  14. Liang, T.; Sawyer, W.G.; Perry, S.S.; Sinnott, S.B.; Phillpot, S.R. Energetics of oxidation in MoS2 nanoparticles by density functional theory. J. Phys. Chem. C 2011, 115, 10606–10616. [Google Scholar] [CrossRef]
  15. Xie, J.F.; Zhang, J.J.; Li, S.; Grote, F.B.; Zhang, X.D.; Zhang, H.; Wang, R.X.; Lei, Y.; Pan, B.C.; Xie, Y. Controllable disorder engineering in oxygen-incorporated MoS2 ultrathin nanosheets for efficient hydrogen evolution. J. Am. Chem. Soc. 2013, 135, 17881–17888. [Google Scholar] [CrossRef] [PubMed]
  16. Lukowski, M.A.; Daniel, A.S.; Meng, F.; Forticaux, A.; Li, L.S.; Jin, S. Enhanced hydrogen evolution catalysis from chemically exfoliated metallic MoS2 nanosheets. J. Am. Chem. Soc. 2013, 135, 10274–10277. [Google Scholar] [CrossRef] [PubMed]
  17. Voiry, D.; Salehi, M.; Silva, R.; Fujita, T.; Chen, M.; Asefa, T. Conducting MoS2 nanosheets as catalysts for hydrogen evolution reaction. Nano Lett. 2013, 13, 6222–6227. [Google Scholar] [CrossRef] [PubMed]
  18. Wu, Z.Z.; Fang, B.Z.; Wang, Z.P.; Wang, C.L.; Liu, Z.H.; Liu, F.Y.; Wang, W.; Alfantazi, A.; Wang, D.Z.; Wilkinson, D.P. MoS2 nanosheets: A designed structure with high active site density for the hydrogen evolution reaction. ACS Catal. 2013, 3, 2101–2107. [Google Scholar] [CrossRef]
  19. Wang, H.T.; Lu, Z.Y.; Kong, D.S.; Sun, J.; Hymel, T.M.; Cui, Y. Electrochemical tuning of MoS2 nanoparticles on three-dimensional substrate for efficient hydrogen evolution. ACS Nano 2014, 8, 4940–4947. [Google Scholar] [CrossRef] [PubMed]
  20. Bian, X.J.; Zhu, J.; Liao, L.; Scanlon, M.D.; Ge, P.Y.; Ji, C.; Girault, H.H.; Liu, B.H. Nanocomposite of MoS2 on ordered mesoporous carbon nanospheres: A highly active catalyst for electrochemical hydrogen evolution. Electrochem. Commun. 2012, 22, 128–132. [Google Scholar] [CrossRef]
  21. Chen, Z.B.; Cummins, D.; Reinecke, B.N.; Clark, E.; Sunkara, M.K.; Jaramillo, T.F. Core-shell MoO3–MoS2 nanowires for hydrogen evolution: A functional design for electrocatalytic materials. Nano Lett. 2011, 11, 4168–4175. [Google Scholar] [CrossRef] [PubMed]
  22. Li, Y.G.; Wang, H.L.; Xie, L.M.; Liang, Y.Y.; Hong, G.S.; Dai, H.J. MoS2 nanoparticles grown on graphene: An advanced catalyst for the hydrogen evolution reaction. J. Am. Chem. Soc. 2011, 133, 7296–7299. [Google Scholar] [CrossRef] [PubMed]
  23. Li, X.D.; Yu, S.; Wu, S.Q.; Wen, Y.H.; Zhou, S.; Zhu, Z.Z. Structural and electronic properties of superlattice composed of graphene and monolayer MoS2. J. Phys. Chem. C 2013, 117, 15347–15353. [Google Scholar] [CrossRef]
  24. Zhang, J.M.; Zhao, L.; Liu, A.P.; Li, X.Y.; Wu, H.P.; Lu, C.D. Three-dimensional MoS2/rGO hydrogel with extremely high double-layer capacitance as active catalyst for hydrogen evolution reaction. Electrochim. Acta 2015, 182, 652–658. [Google Scholar] [CrossRef]
  25. Pan, Y.; Yang, N.; Chen, Y.J.; Lin, Y.; Li, Y.P.; Liu, Y.Q.; Liu, C.G. Nickel phosphide nanoparticles-nitrogen-doped graphene hybrid as an efficient catalyst for enhanced hydrogen evolution activity. J. Power Sources 2015, 297, 45–52. [Google Scholar] [CrossRef]
  26. Song, L.Z.; Wang, X.L.; Wen, F.S.; Niu, L.J.; Shi, X.M.; Yan, J.Y. Hydrogen evolution reaction performance of the molybdenum disulfide/nickel–phosphorus composites in alkaline solution. Int. J. Hydrog. Energy 2016, 41, 18942–18952. [Google Scholar] [CrossRef]
  27. Liu, Q.; Gu, S.; Li, C.M. Electrodeposition of nickel–phosphorus nanoparticles film as a Janus electrocatalyst for electro-splitting of water. J. Power Sources 2015, 299, 342–346. [Google Scholar] [CrossRef]
  28. Yu, Q.Y.; Zeng, Z.X.; Zhao, W.J.; Ma, Y.C.; Wu, X.D.; Xue, Q.J. Patterned Ni–P alloy films prepared by “Reducing-Discharging” process and the hydrophobic property. ACS Appl. Mater. Interfaces 2014, 6, 1053–1060. [Google Scholar] [CrossRef] [PubMed]
  29. Wang, H.W.; Skeldon, P.; Thompson, G.E. XPS studies of MoS2 formation from ammonium tetrathiomolybdate solutions. Surf. Coat. Technol. 1997, 91, 200–207. [Google Scholar] [CrossRef]
  30. Koroteev, V.O.; Bulusheva, L.G.; Asanov, I.P.; Shlyakhova, E.V.; Vyalikh, D.V.; Okotrub, A.V. Charge transfer in the MoS2/carbon nanotube composite. J. Phys. Chem. C 2011, 115, 21199–21204. [Google Scholar] [CrossRef]
  31. Benck, J.D.; Chen, Z.B.; Kuritzky, L.Y.; Forman, A.J.; Jaramillo, T.F. Amorphous molybdenum sulfide catalysts for electrochemical hydrogen production: Insights into the origin of their catalytic activity. ACS Catal. 2012, 2, 1916–1923. [Google Scholar] [CrossRef]
  32. Grosvenor, A.P.; Wik, S.D.; Cavell, R.G.; Mar, A. Examination of the bonding in binary transition-metal monophosphides MP (M = Cr, Mn, Fe, Co) by X-ray photoelectron spectroscopy. Inorg. Chem. 2005, 44, 8988–8998. [Google Scholar] [CrossRef] [PubMed]
  33. Cecilia, J.A.; Infantes-Molina, A.; Rodríguez-Castellón, E.; Jiménez-López, A. A novel method for preparing an active nickel phosphide catalyst for HDS of dibenzothiophene. J. Catal. 2009, 263, 4–15. [Google Scholar] [CrossRef]
  34. Liu, Y.R.; Hu, W.H.; Li, X.; Dong, B.; Shang, X.; Han, G.Q.; Chai, Y.M.; Liu, Y.Q.; Liu, C.G. One-pot synthesis of hierarchical Ni2P/MoS2 hybrid electrocatalysts with enhanced activity for hydrogen evolution reaction. Appl. Surf. Sci. 2016, 383, 276–282. [Google Scholar] [CrossRef]
  35. Mech, K.; Żabiński, P.; Kowalik, R.; Tokarski, T.; Fitzner, K. Electrodeposition of Co–Pd alloys from ammonia solutions and their catalytic activity for hydrogen evolution reaction. J. Appl. Electrochem. 2014, 44, 97–103. [Google Scholar] [CrossRef]
  36. Paseka, I. Hydrogen evolution reaction on Ni–P alloys: The internal stress and the activities of electrodes. Electrochim. Acta 2008, 53, 4537–4543. [Google Scholar] [CrossRef]
  37. Manazoğlu, M.; Hapçı, G.; Orhan, G. Effect of electrolysis parameters of Ni–Mo alloy on the electrocatalytic activity for hydrogen evaluation and their stability in alkali medium. J. Appl. Electrochem. 2016, 46, 191–204. [Google Scholar] [CrossRef]
Figure 1. X-ray diffraction (XRD) spectra of the pure MoS2 and three Ni–P/MoS2 composites: (a) pure MoS2, Ni–LP/MoS2, Ni–MP/MoS2, and Ni–HP/MoS2 composites; and (b) Ni–MP/MoS2 composite.
Metals 07 00211 g001
Figure 2. Scanning Electron Microscope (SEM) images and Energy Dispersive Spectrometry (EDS) spectra of the pure MoS2 and three Ni–P/MoS2 composites: (a) pure MoS2; (b) Ni–LP/MoS2; (c) Ni–MP/MoS2; and (d) Ni–HP/MoS2.
Metals 07 00211 g002
Figure 3. X-ray photoelectron spectra (XPS) of three Ni–P/MoS2 composites. (a) Mo 3d; (b) S 2p; (c) Ni 2p; (d) P 2p; and (e) O 1s.
Metals 07 00211 g003
Figure 4. Linear sweep voltammetry (LSV) curves of the samples: (a) pure MoS2, 20 wt % Pt/C, Ni–LP/MoS2, Ni–MP/MoS2, and Ni–HP/MoS2. Scan rate: 2 mV/s, potential window: −0.3~0.8 V (vs. RHE); (b) Ni–LP, Ni–MP, and Ni–HP. Scan rate: 2 mV/s, potential window: −0.4~0.8 V (vs. RHE).
Metals 07 00211 g004
Figure 5. Tafel plots of the pure MoS2, 20 wt % Pt/C, Ni–LP/MoS2, Ni–MP/MoS2, and Ni–HP/MoS2. Scan rate: 10 mV/s, potential window: 0.3~1.6 V (vs. RHE).
Metals 07 00211 g005
Figure 6. Cyclic voltammetry (CV) curves of the samples: (a) pure MoS2, 20 wt % Pt/C, Ni–LP/MoS2, Ni–MP/MoS2, and Ni–HP/MoS2. Scan rate: 10 mV/s, potential window: –0.6~0.2 V (vs. RHE); (b) Ni–LP, Ni–MP, and Ni–HP. Scan rate: 20 mV/s, potential window: −0.25~0.6 V (vs. RHE).
Metals 07 00211 g006
Figure 7. Electrochemical impedance spectroscopy (EIS) curves of the pure MoS2, 20 wt % Pt/C, Ni–LP/MoS2, Ni–MP/MoS2, Ni–HP/MoS2. Cathodic overpotential: 0.7 V (vs. RHE), frequency: 100 KHz–10 mHz, amplitude of the sinusoidal signal: 5 mV.
Metals 07 00211 g007
Figure 8. Stability tests for Ni–LP/MoS2, Ni–MP/MoS2, and Ni–HP/MoS2 composites. Scan rate: 50 mV/s; potential window: −0.3 and 0.8 V (vs. RHE).
Metals 07 00211 g008
Figure 9. EDS spectra of the Ni–MP/MoS2 composite before and after the stability test.
Metals 07 00211 g009
Table 1. The obtained values of onset overpotentials (OVP), Tafel slope (b), symmetry factor (β), and active site (n).
SamplesOVP/(mV)b/(mV/decade)βn/(×10−8 mol/cm2)
MoS2−3201440.410.97
20 wt % Pt/C360521.1416.8
Ni–LP/MoS2−1551080.551.94
Ni–MP/MoS2320571.042.69
Ni–HP/MoS2300700.842.28
Table 2. Parameters of solution resistance (Rs), charge transfer resistance (Rct), double-layer capacitance (Cdl), the dimensionless CPE exponent m, and exchange current density (j0) analyzed from the EIS spectra.
SamplesRs/(Ω·cm2)Rct/(Ω·cm2)mCdl/(×10−4·F/cm2)j0/(×10−5·A/cm2)
MoS20.4630420.8502.840.84
Pt/C0.4219.20.84951.2133
Ni–LP/MoS20.4327580.8456.410.93
Ni–MP/MoS20.6043.20.87146.059.4
Ni–HP/MoS20.50239.30.8357.858.75

