
Structure, Texture and Phases in 3D Printed IN718 Alloy Subjected to Homogenization and HIP Treatments

 ,
, 
Abstract
:
1. Introduction
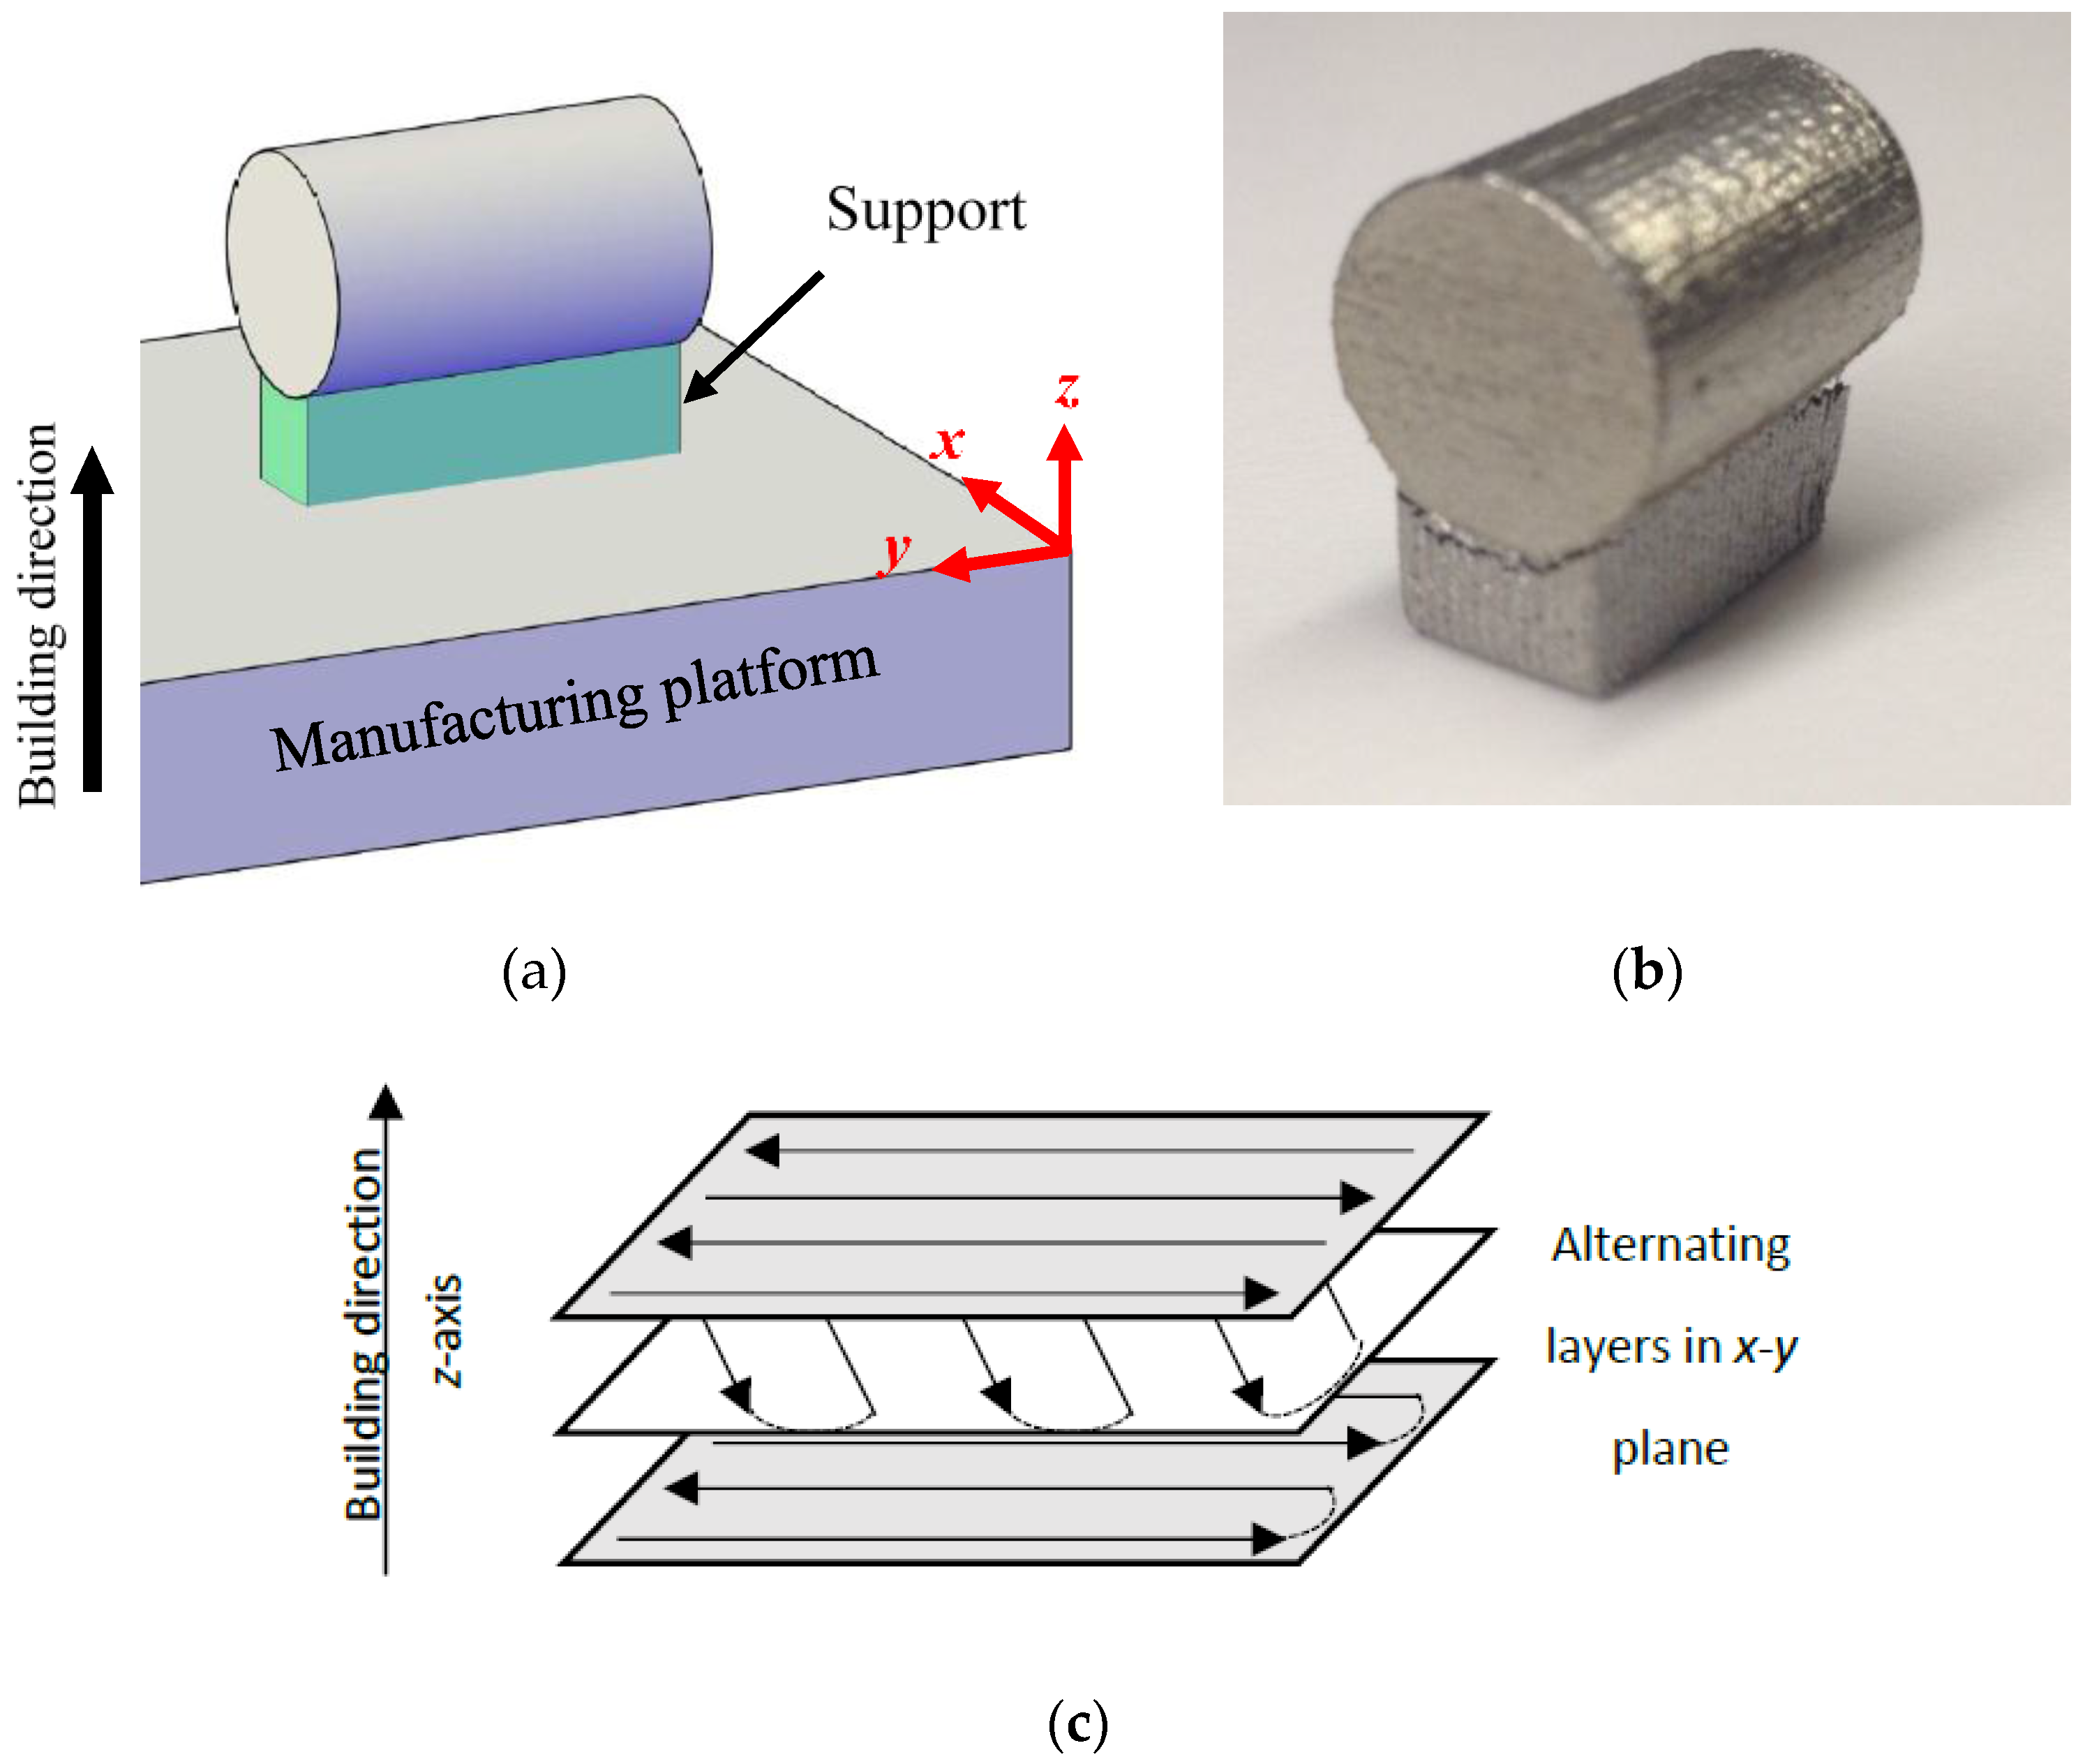
2. Materials and Methods
3. Results and Discussion
3.1. Microstructural Characterization
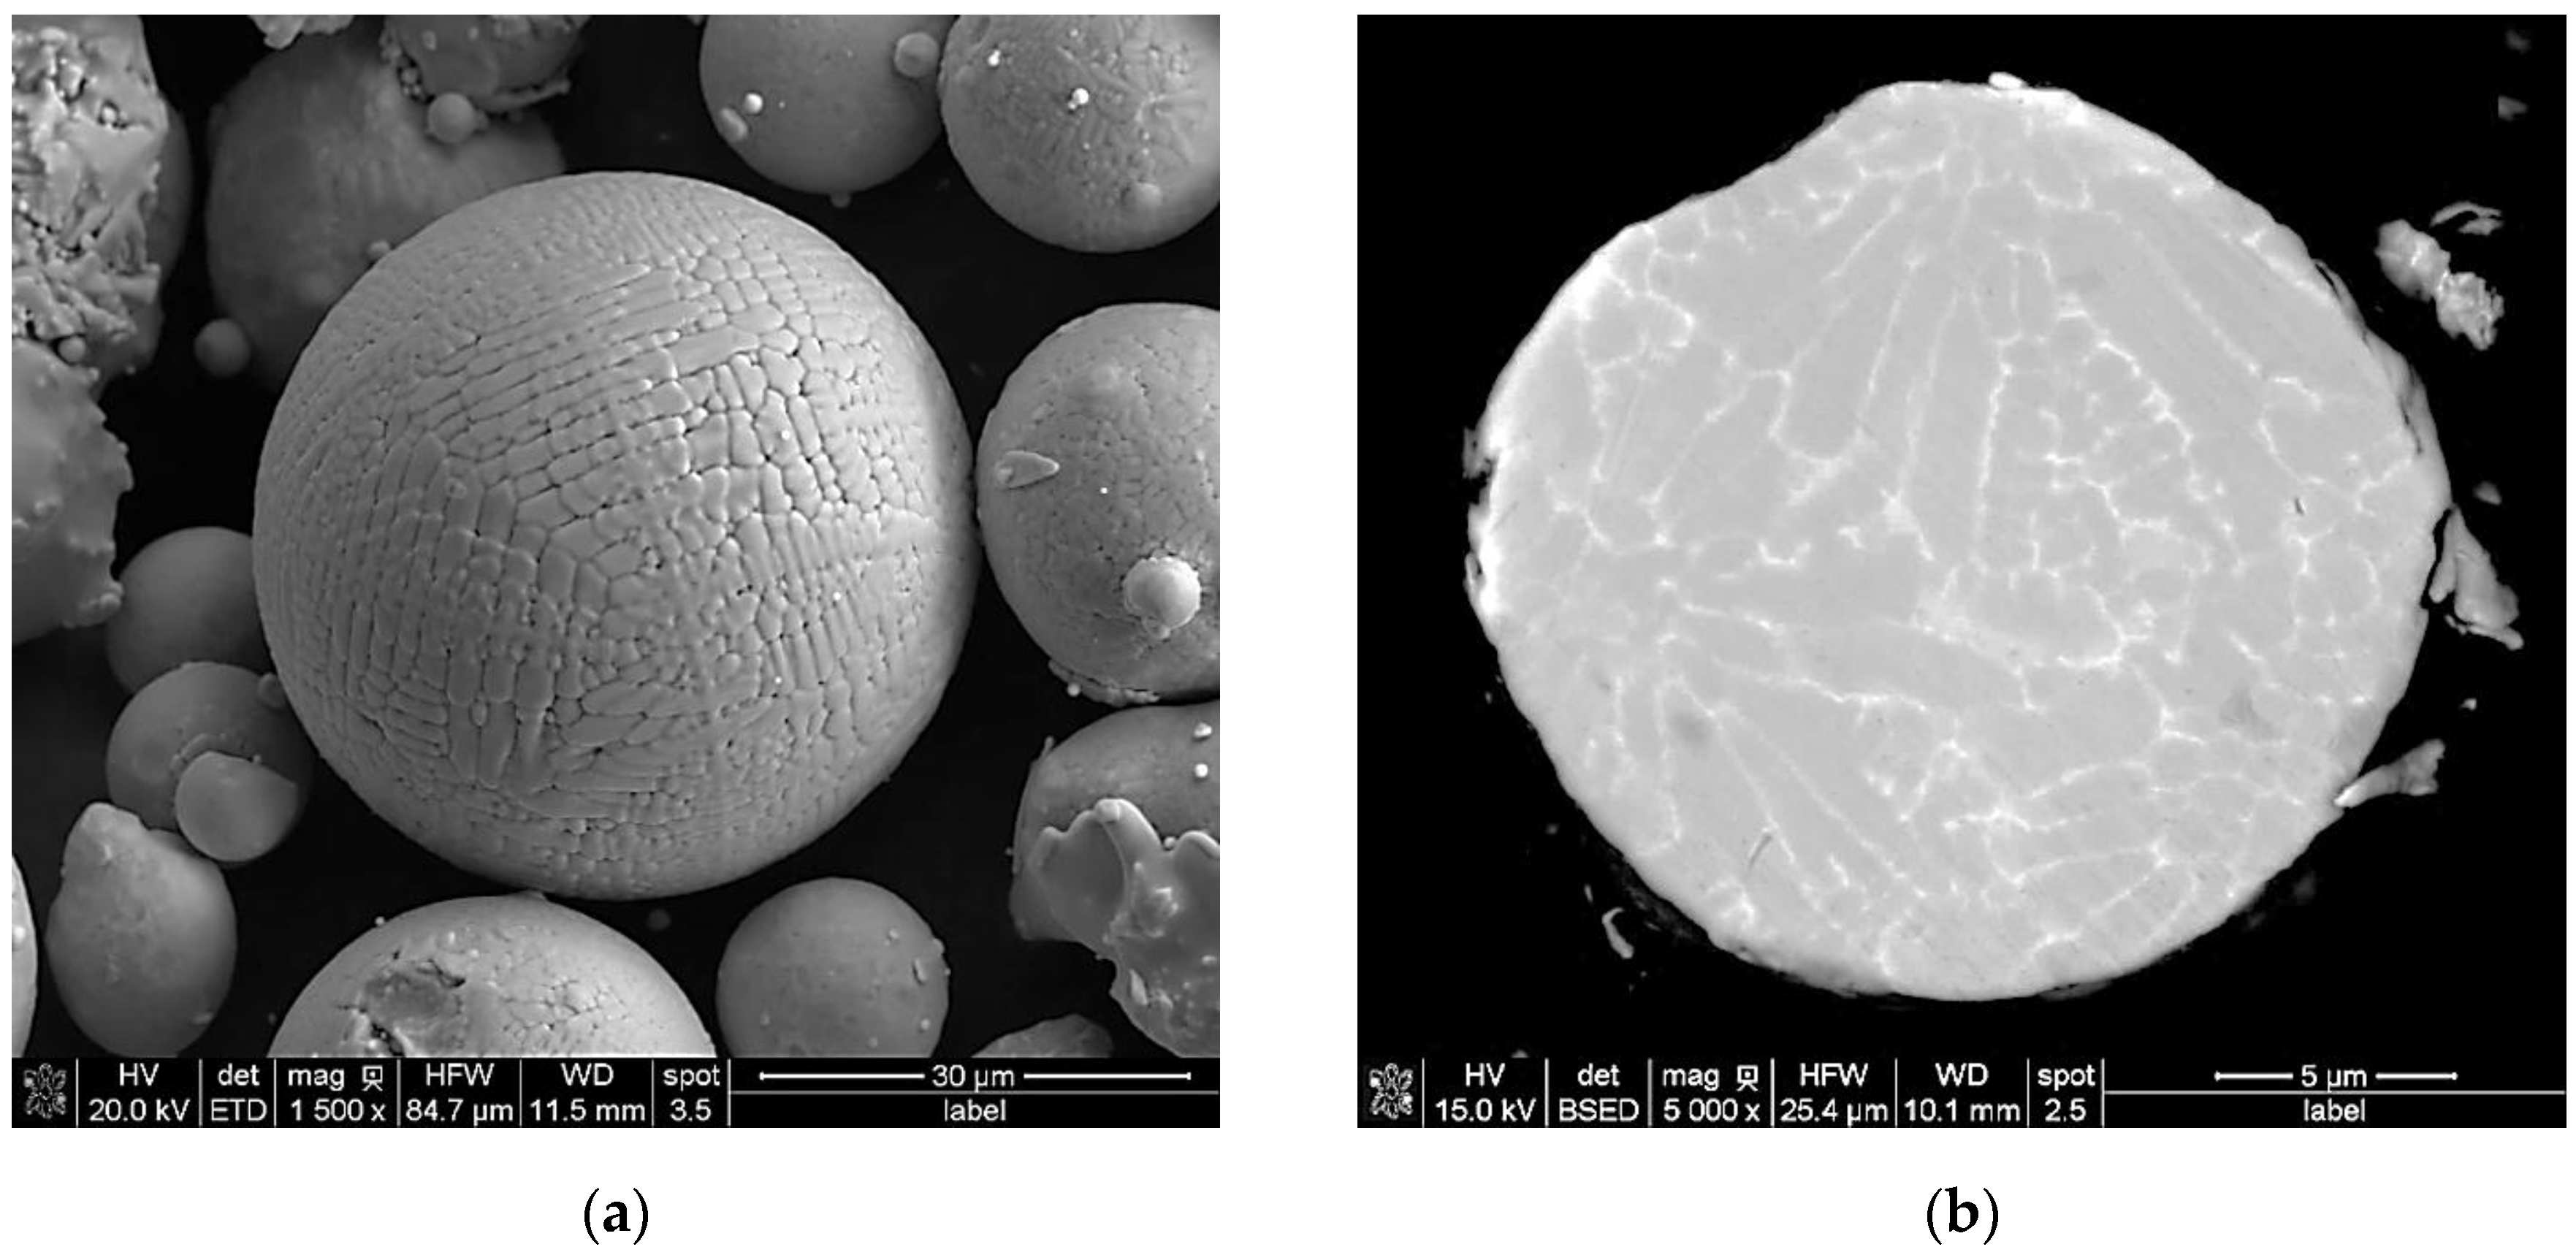
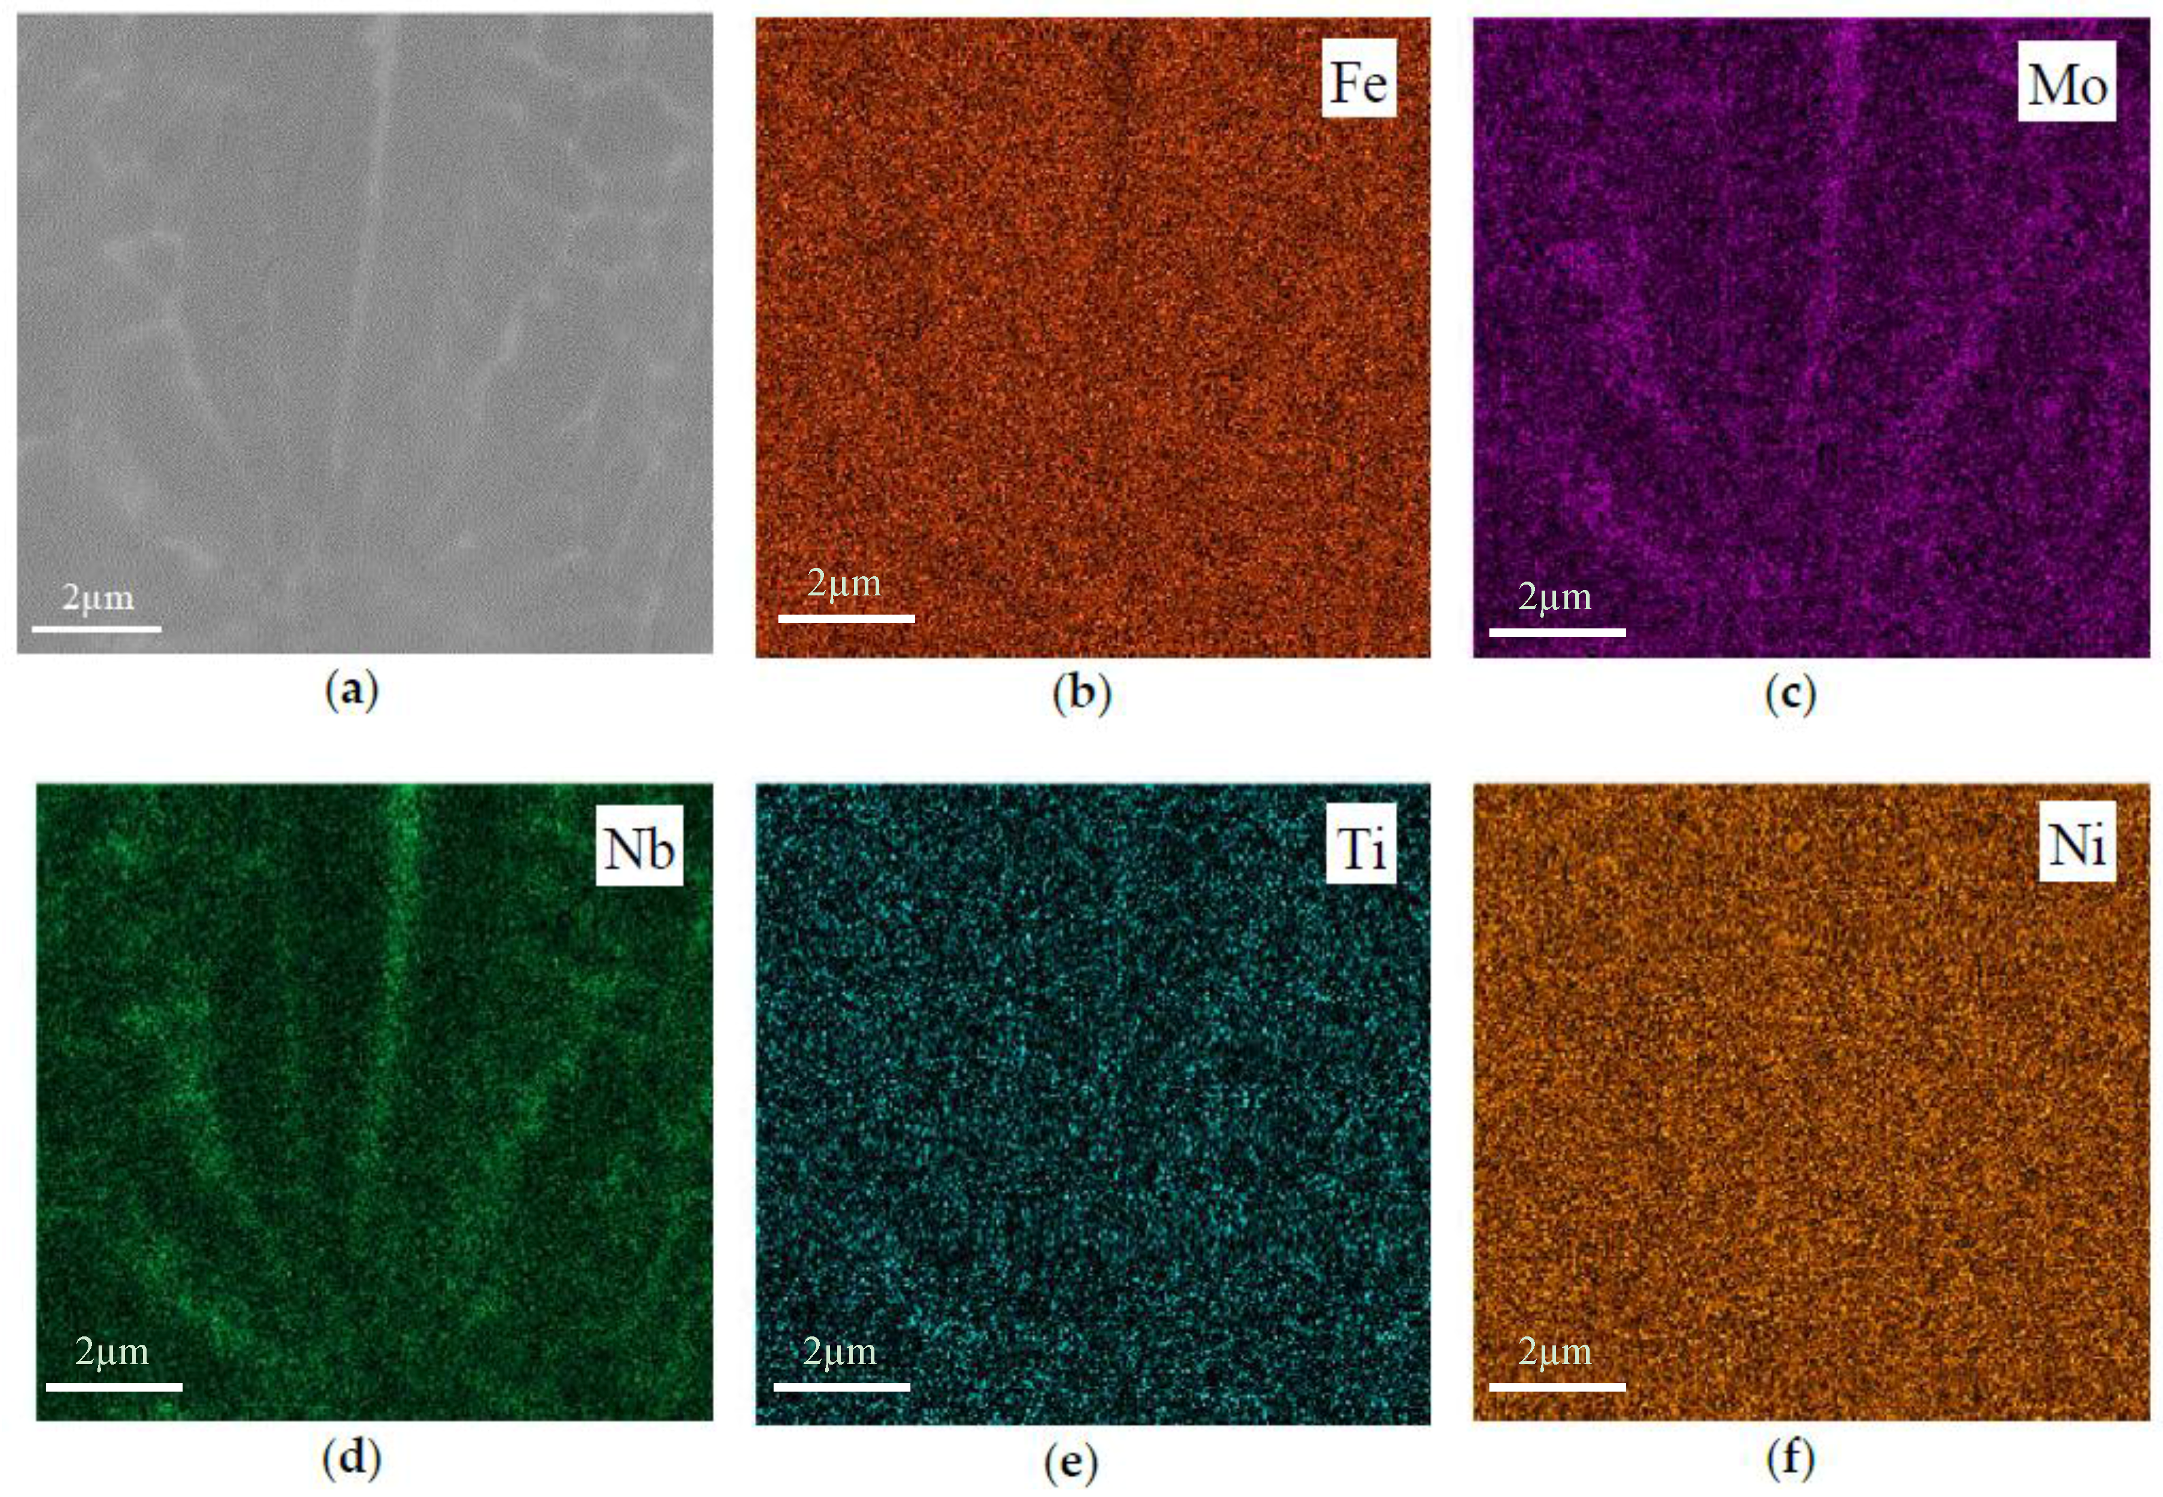
3.1.1. Microstructure of the as-Received Powder
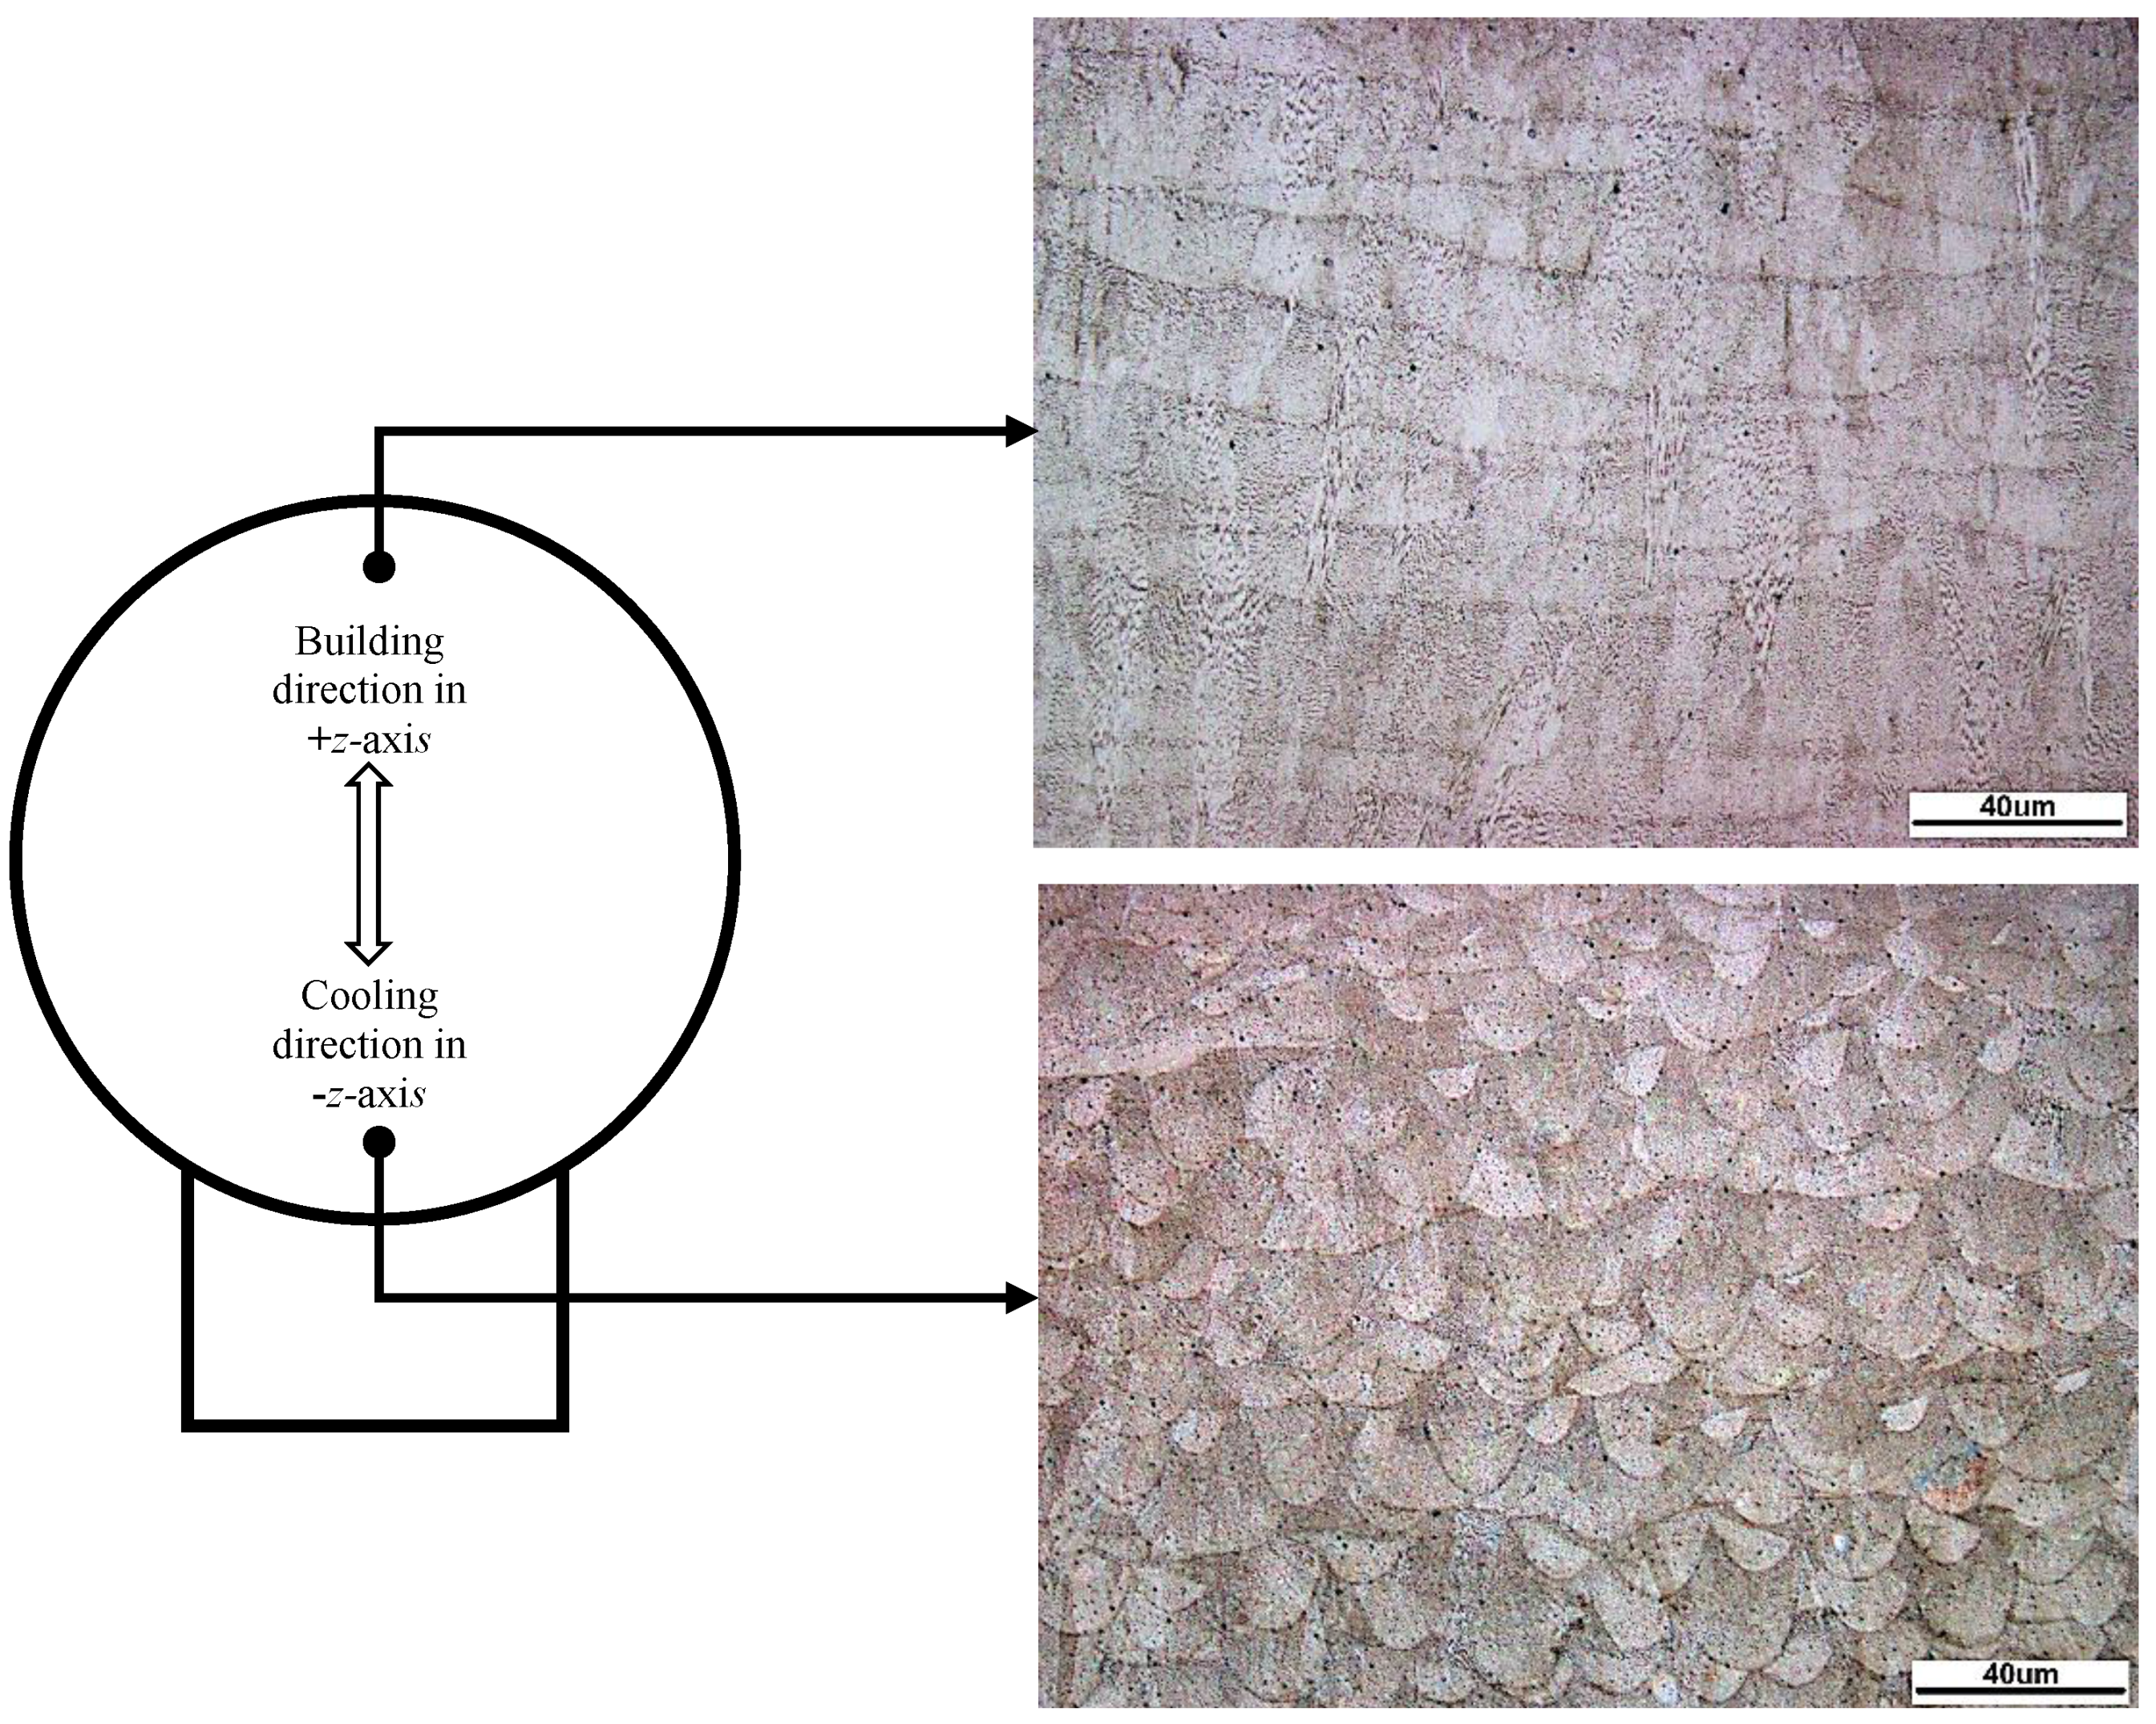
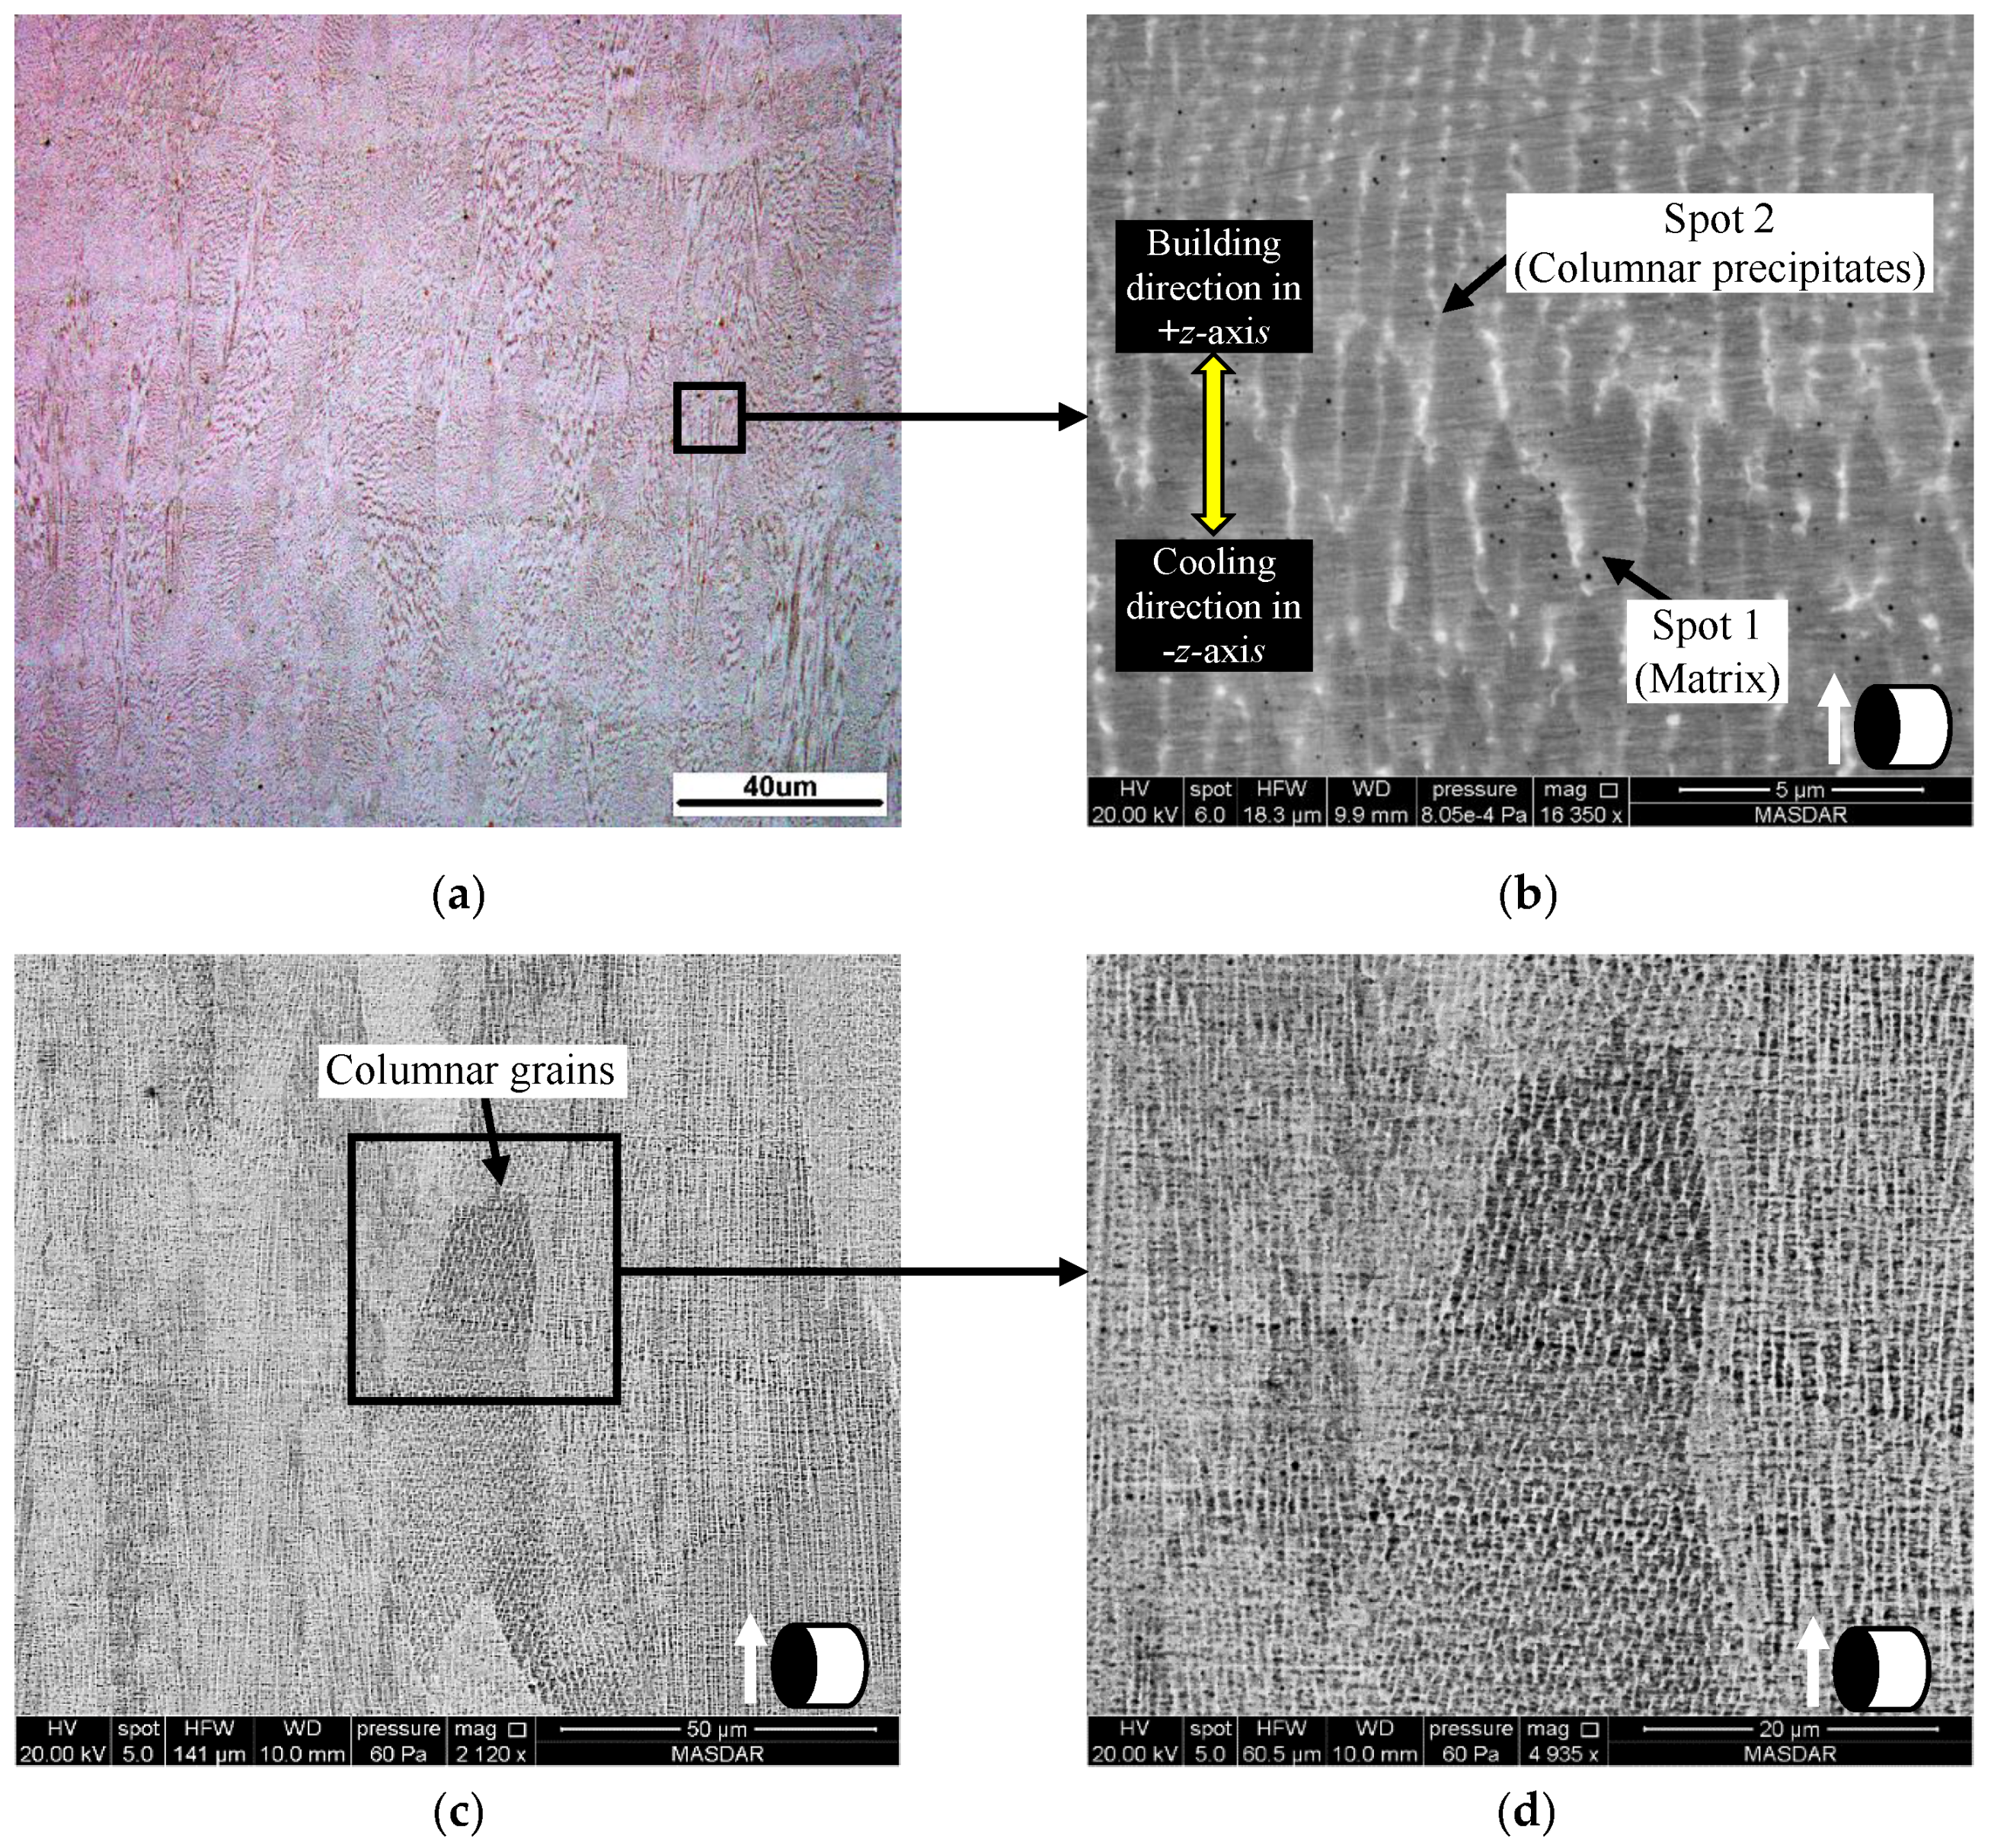
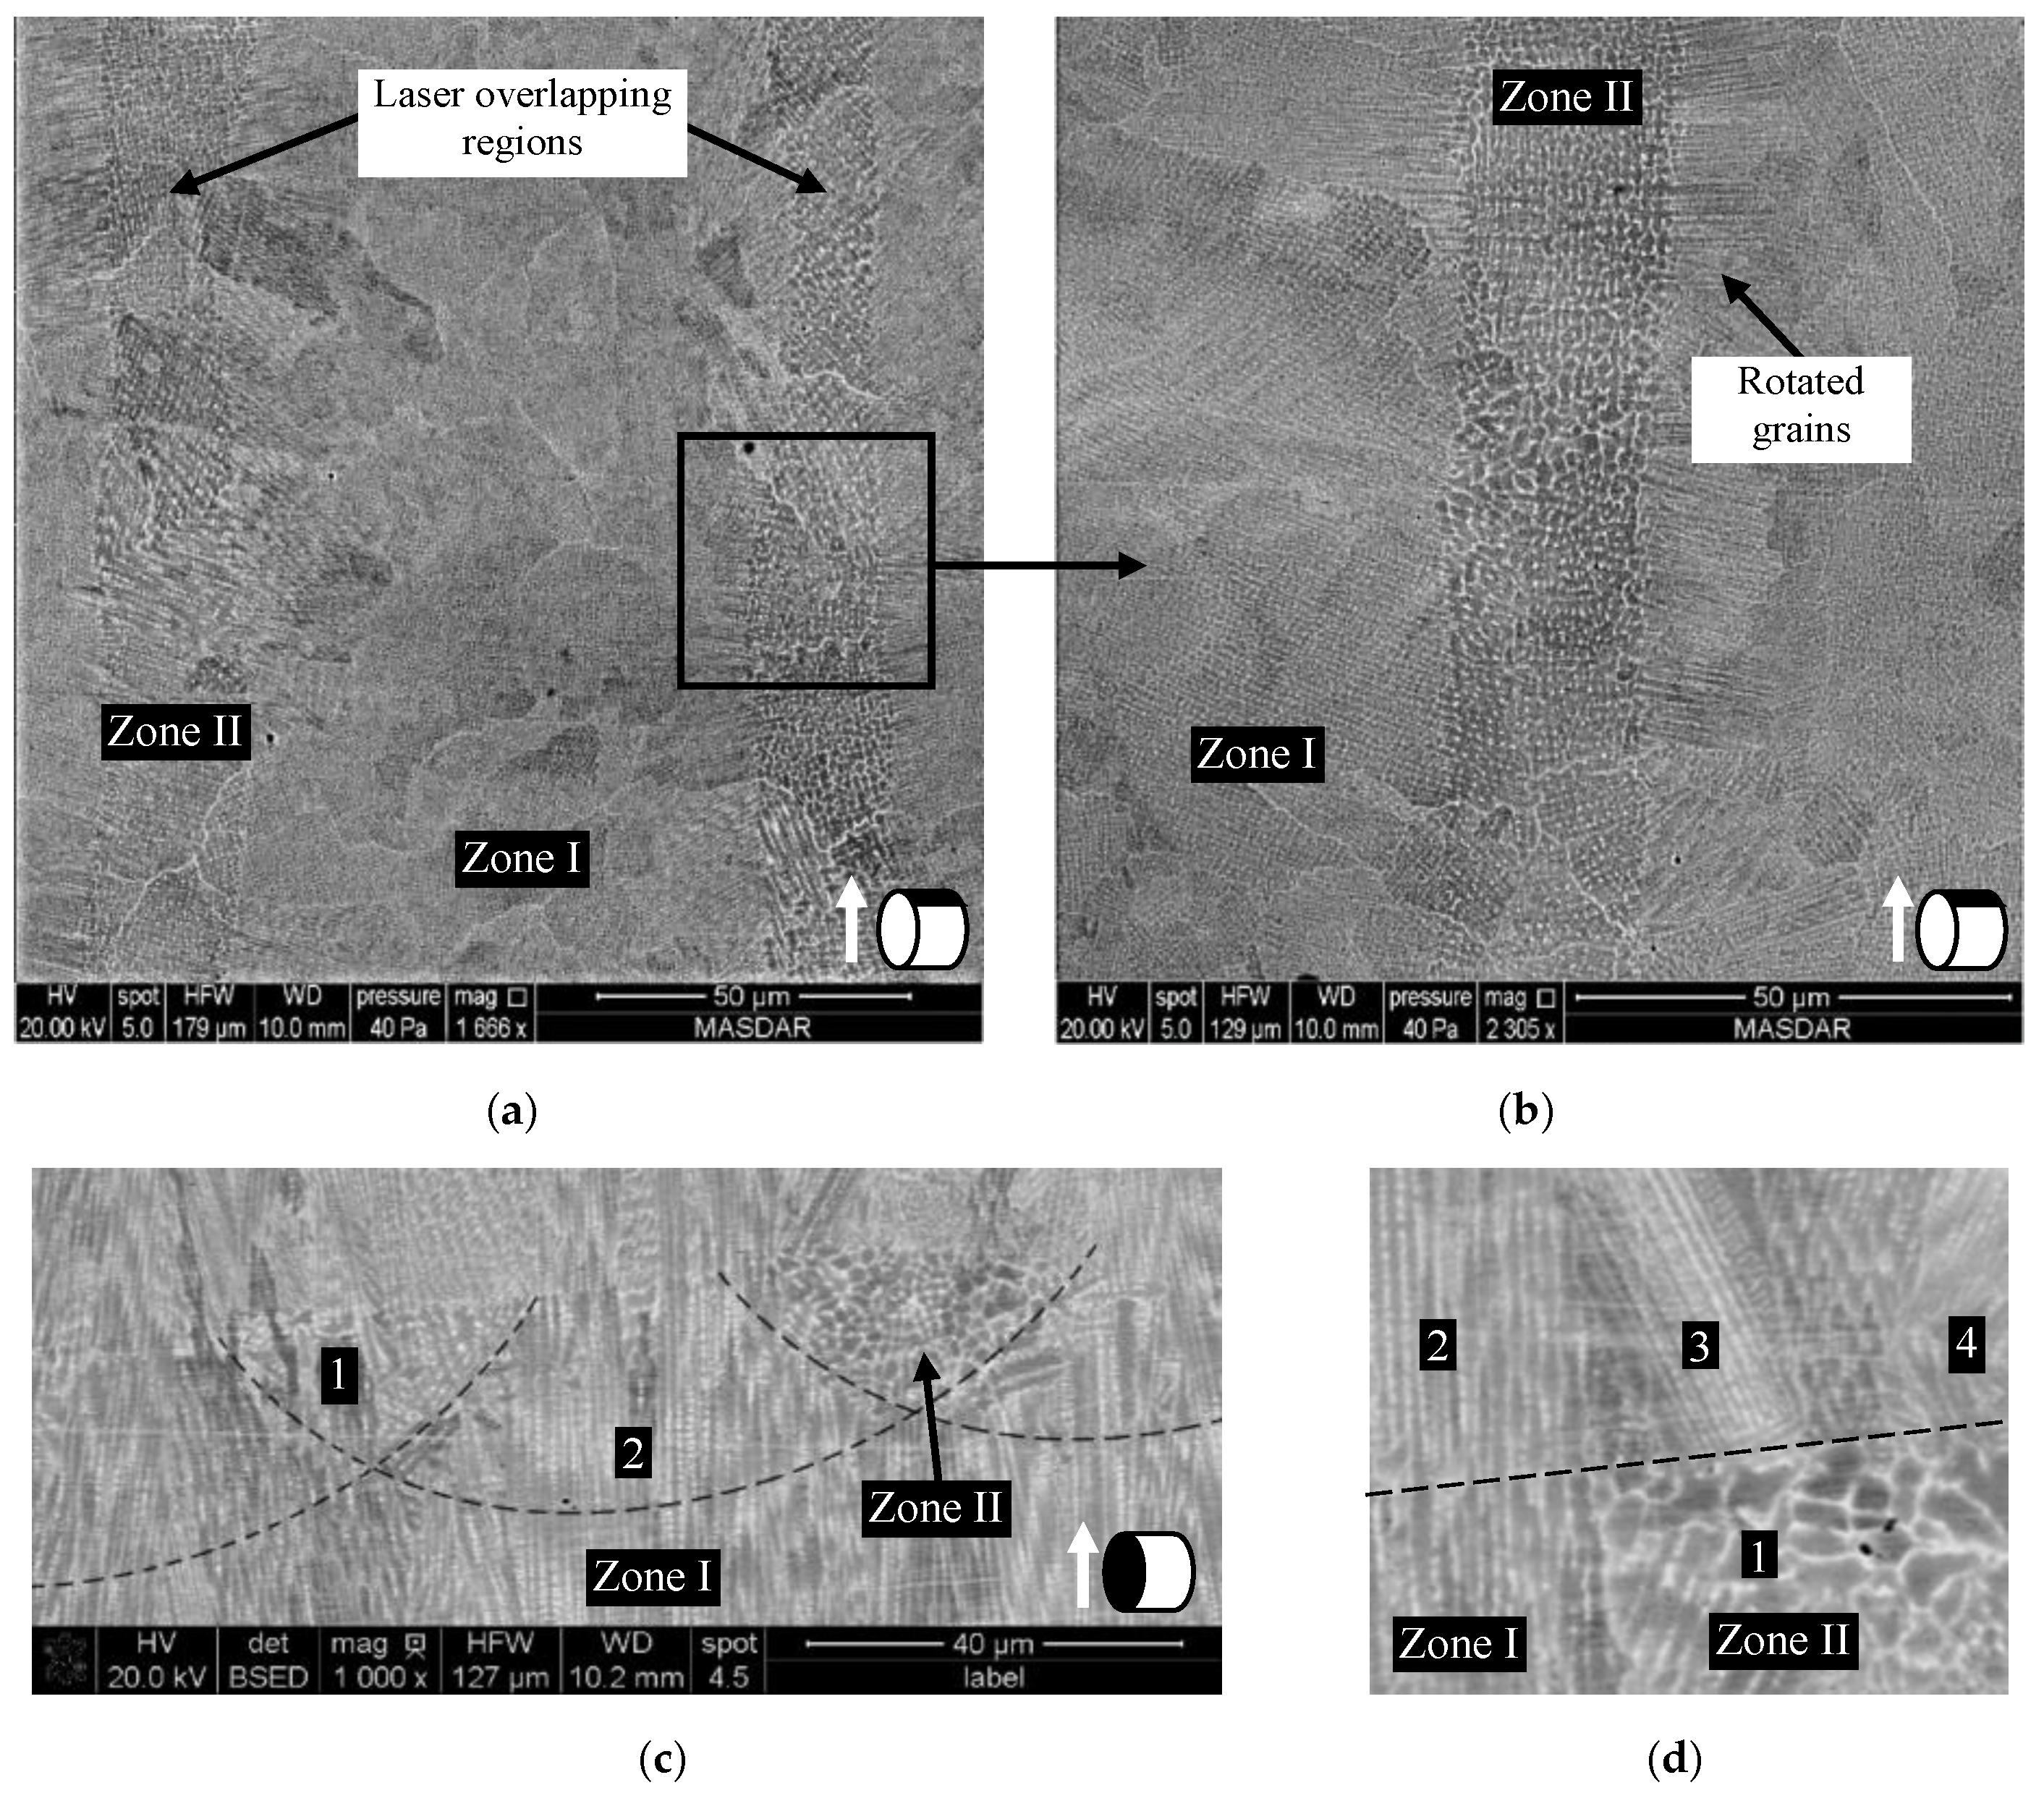
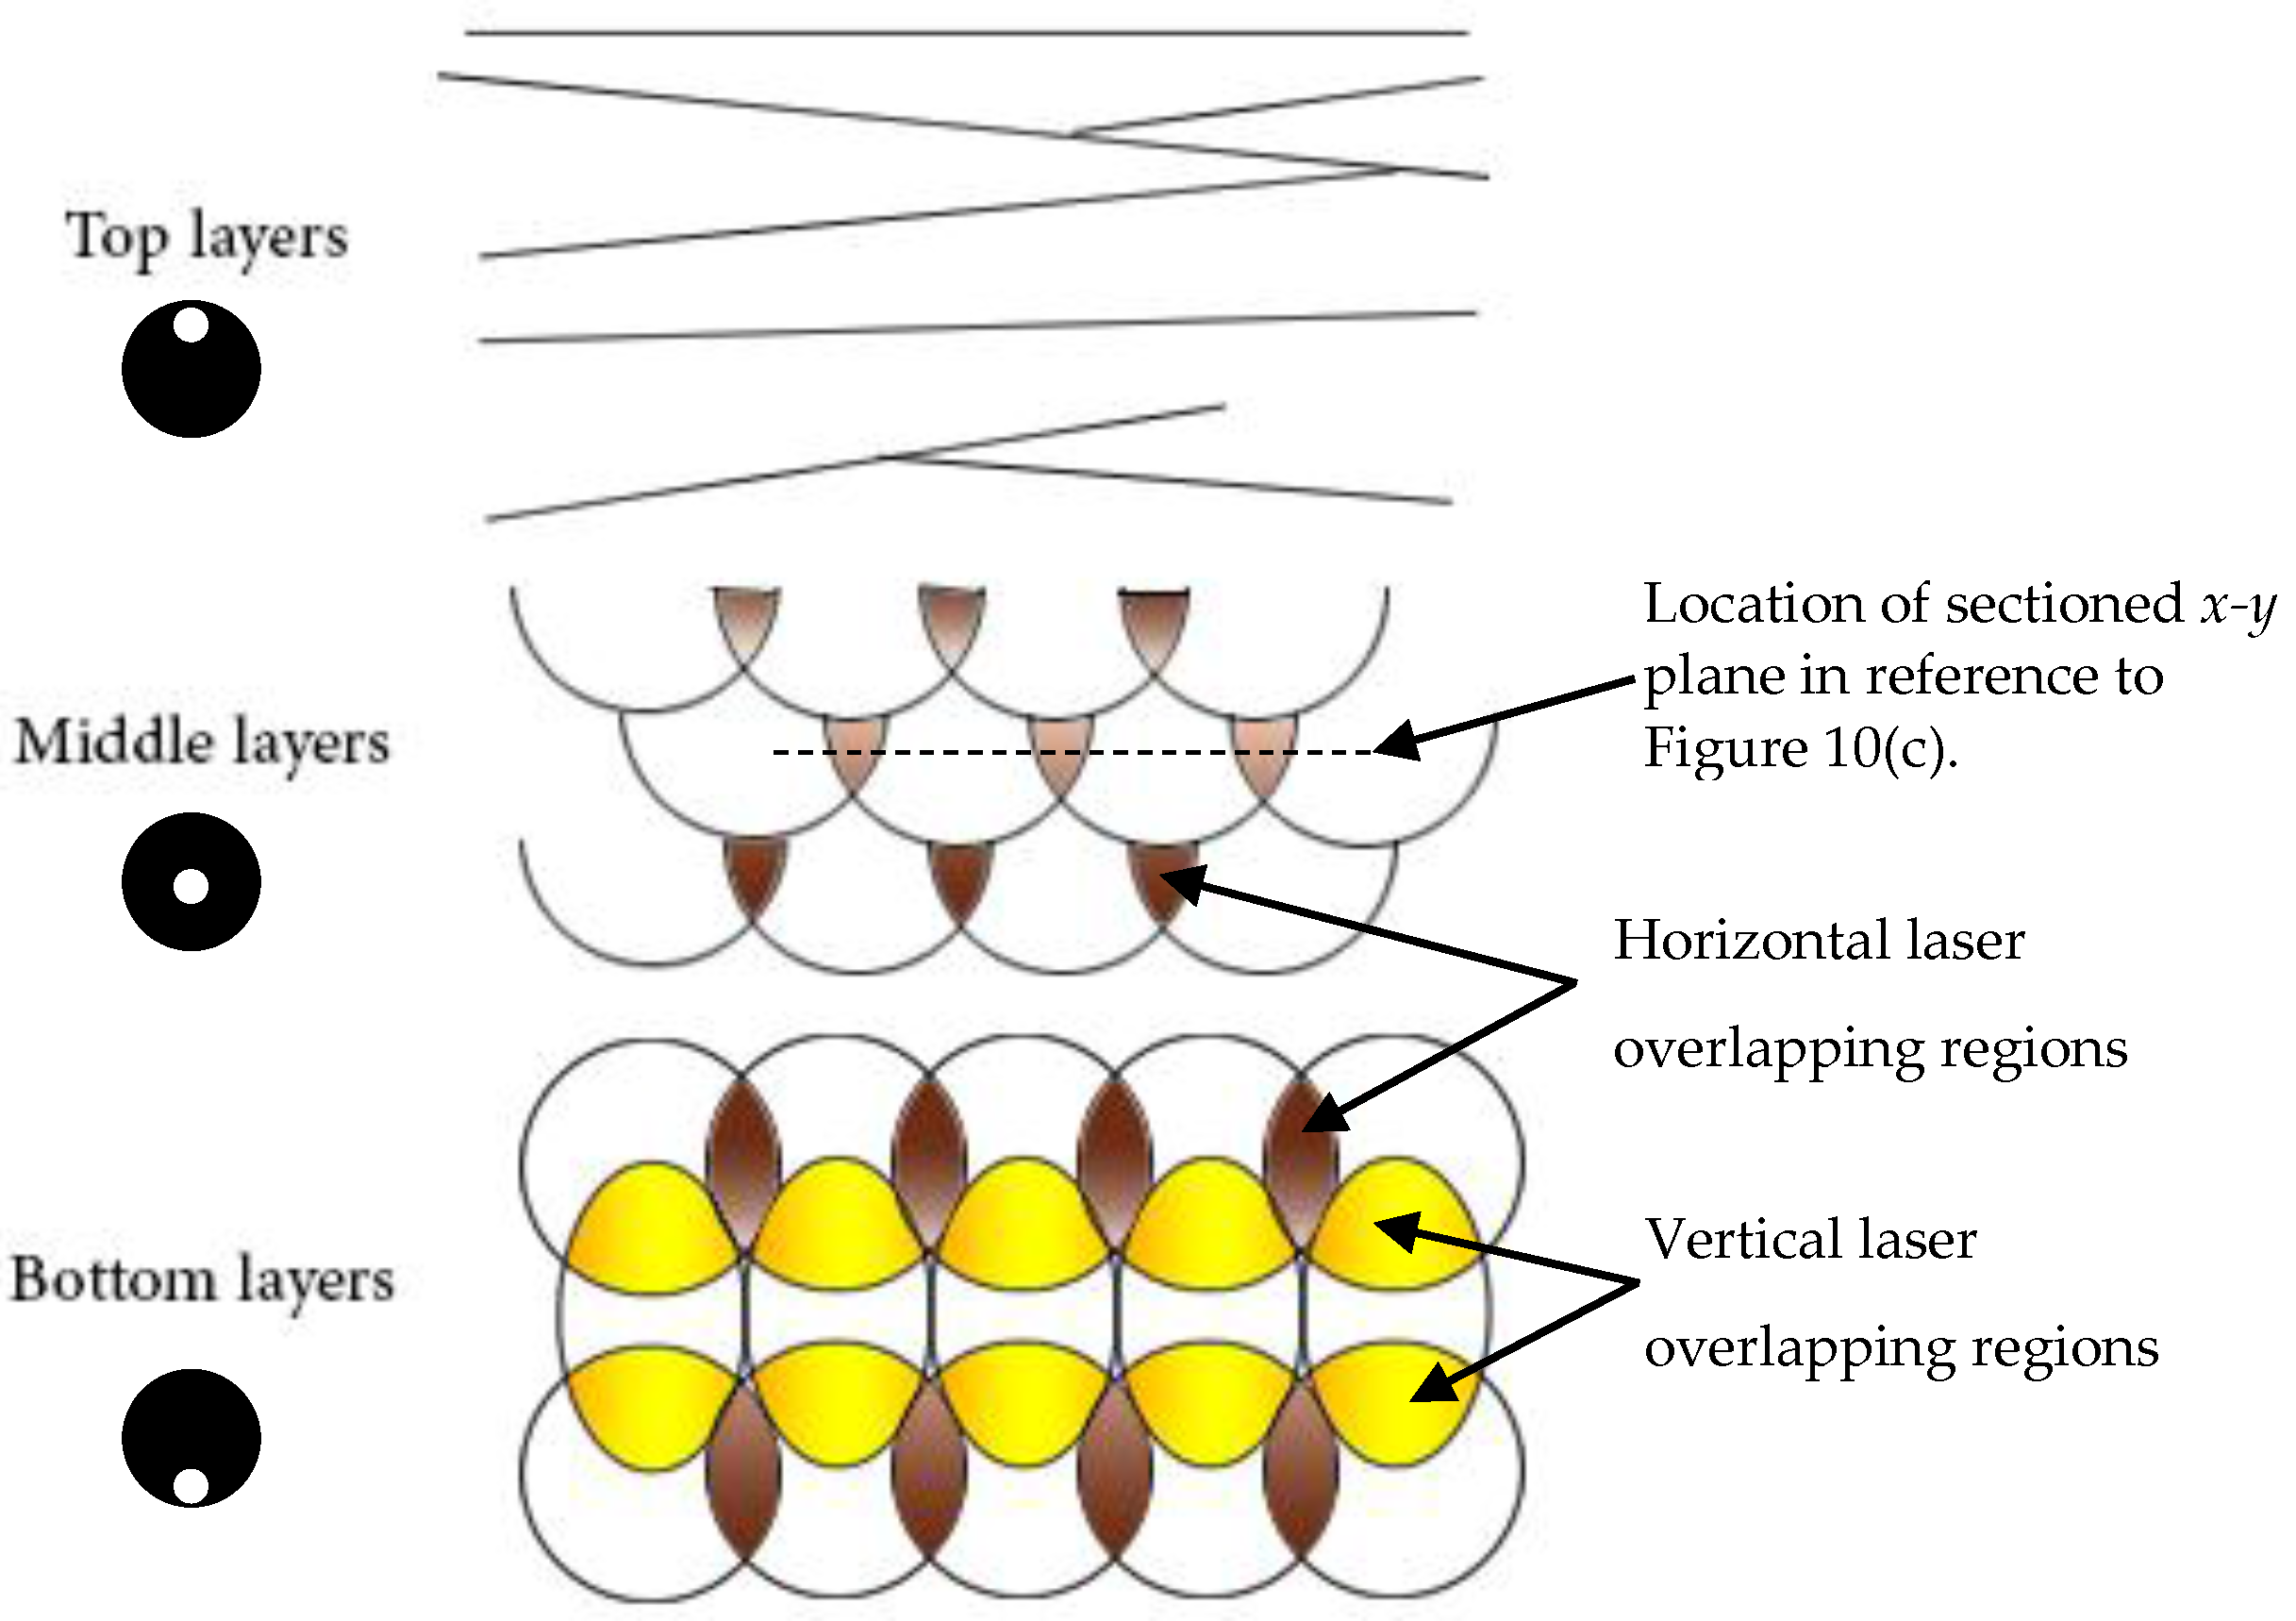
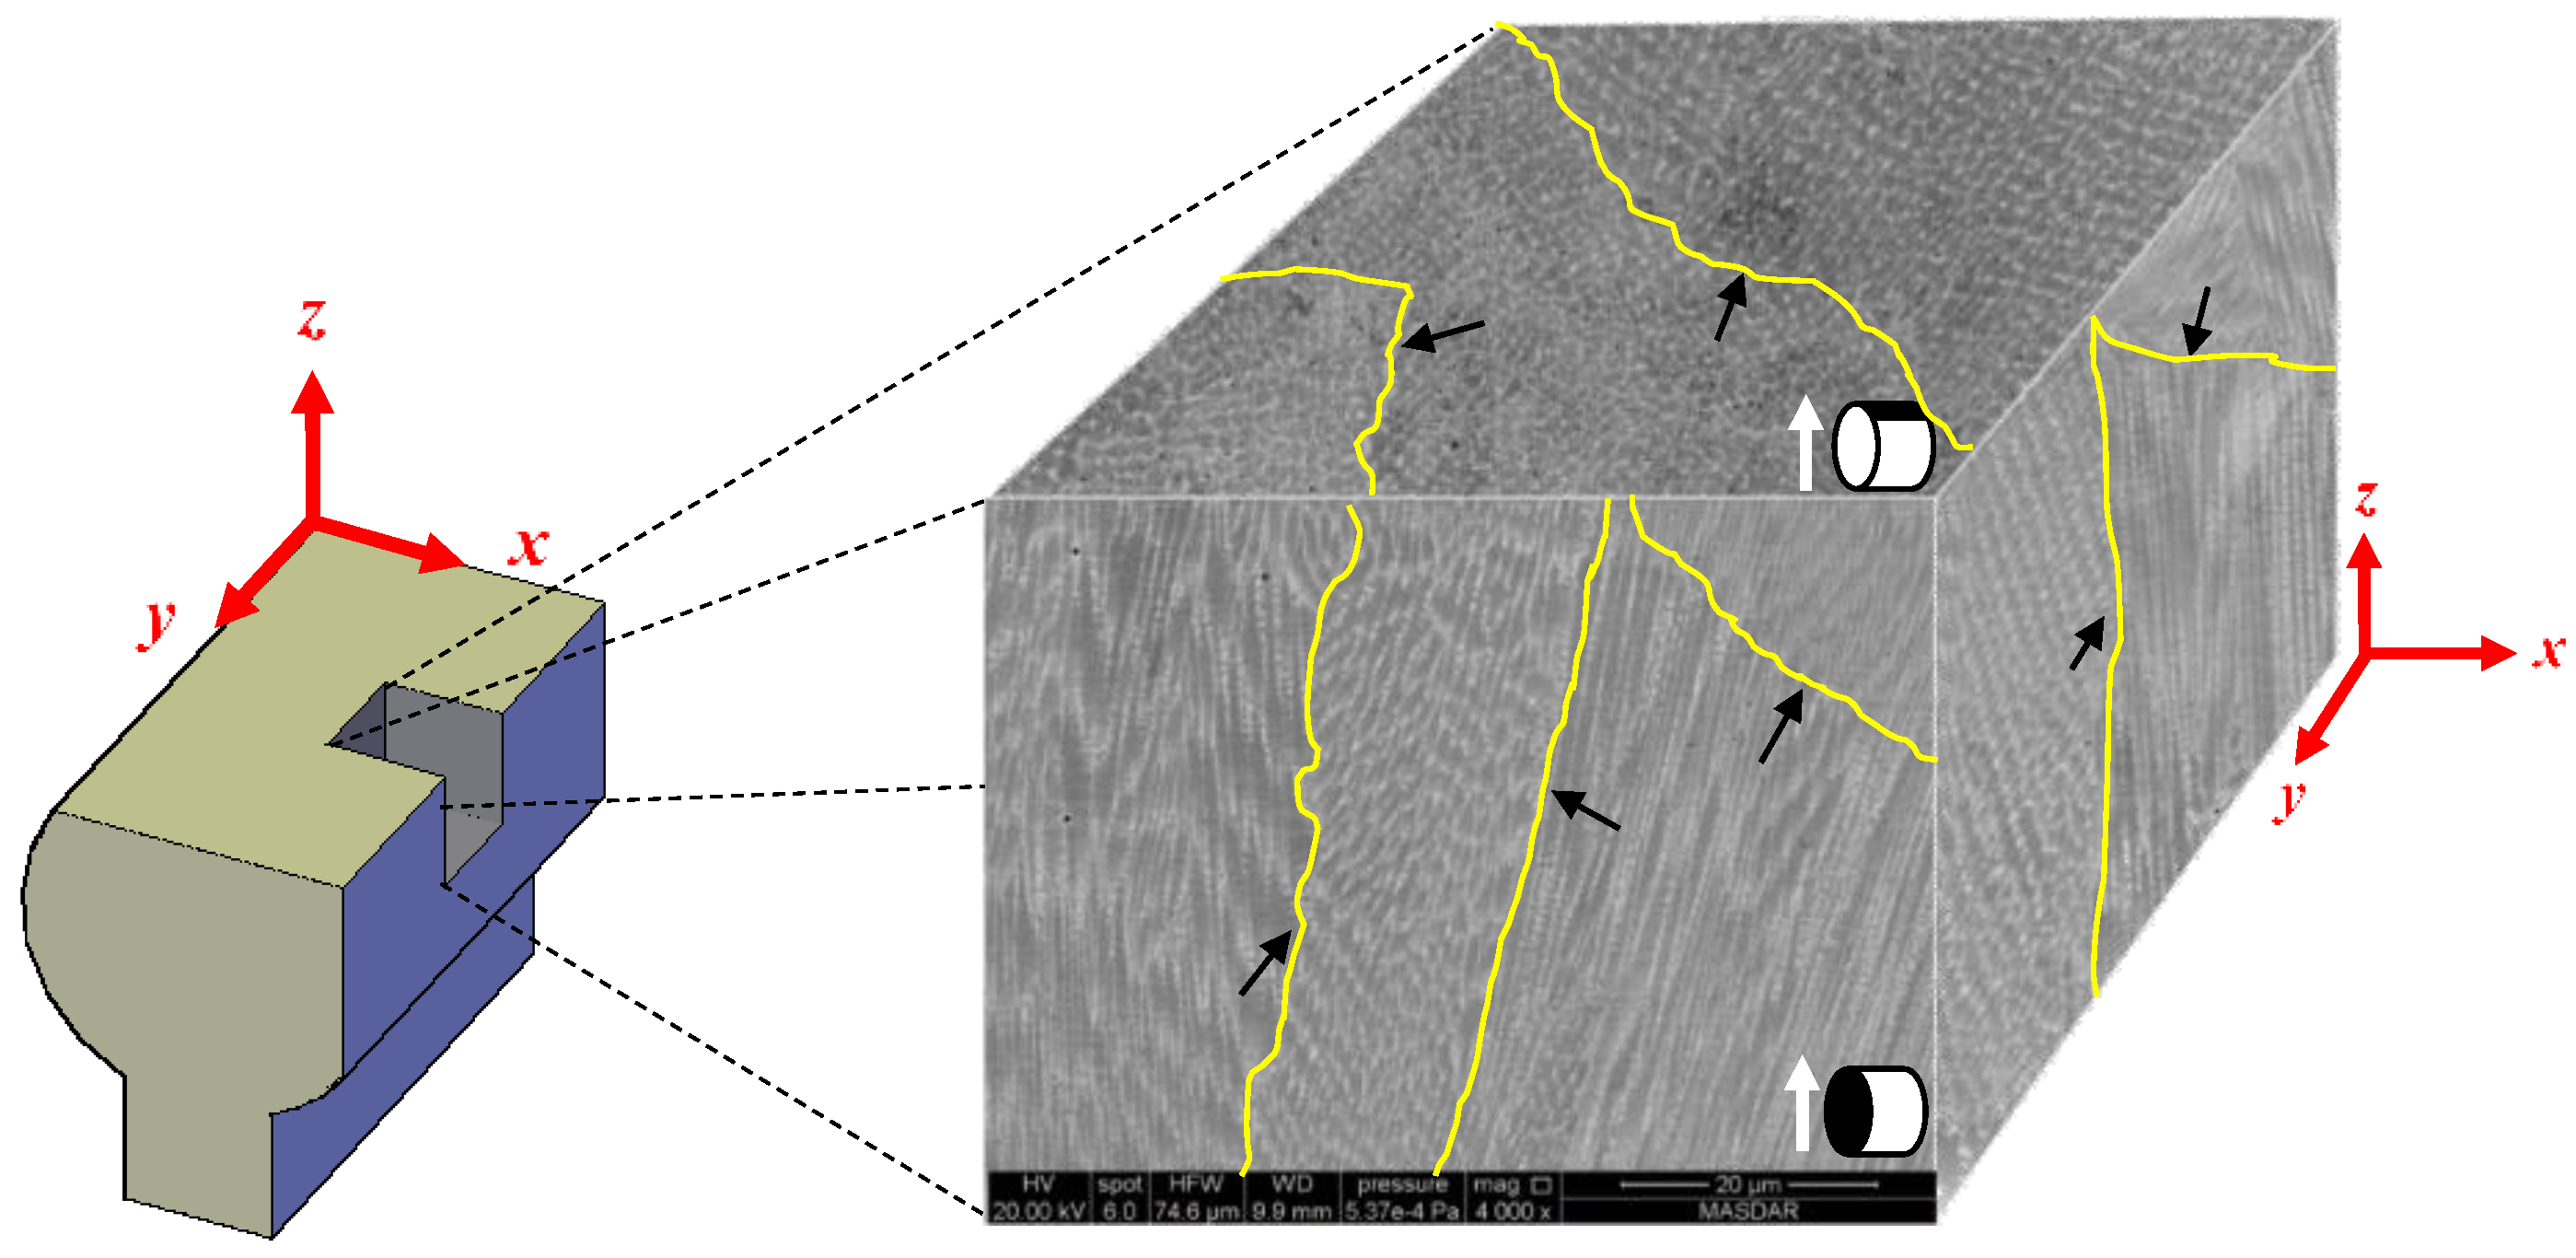
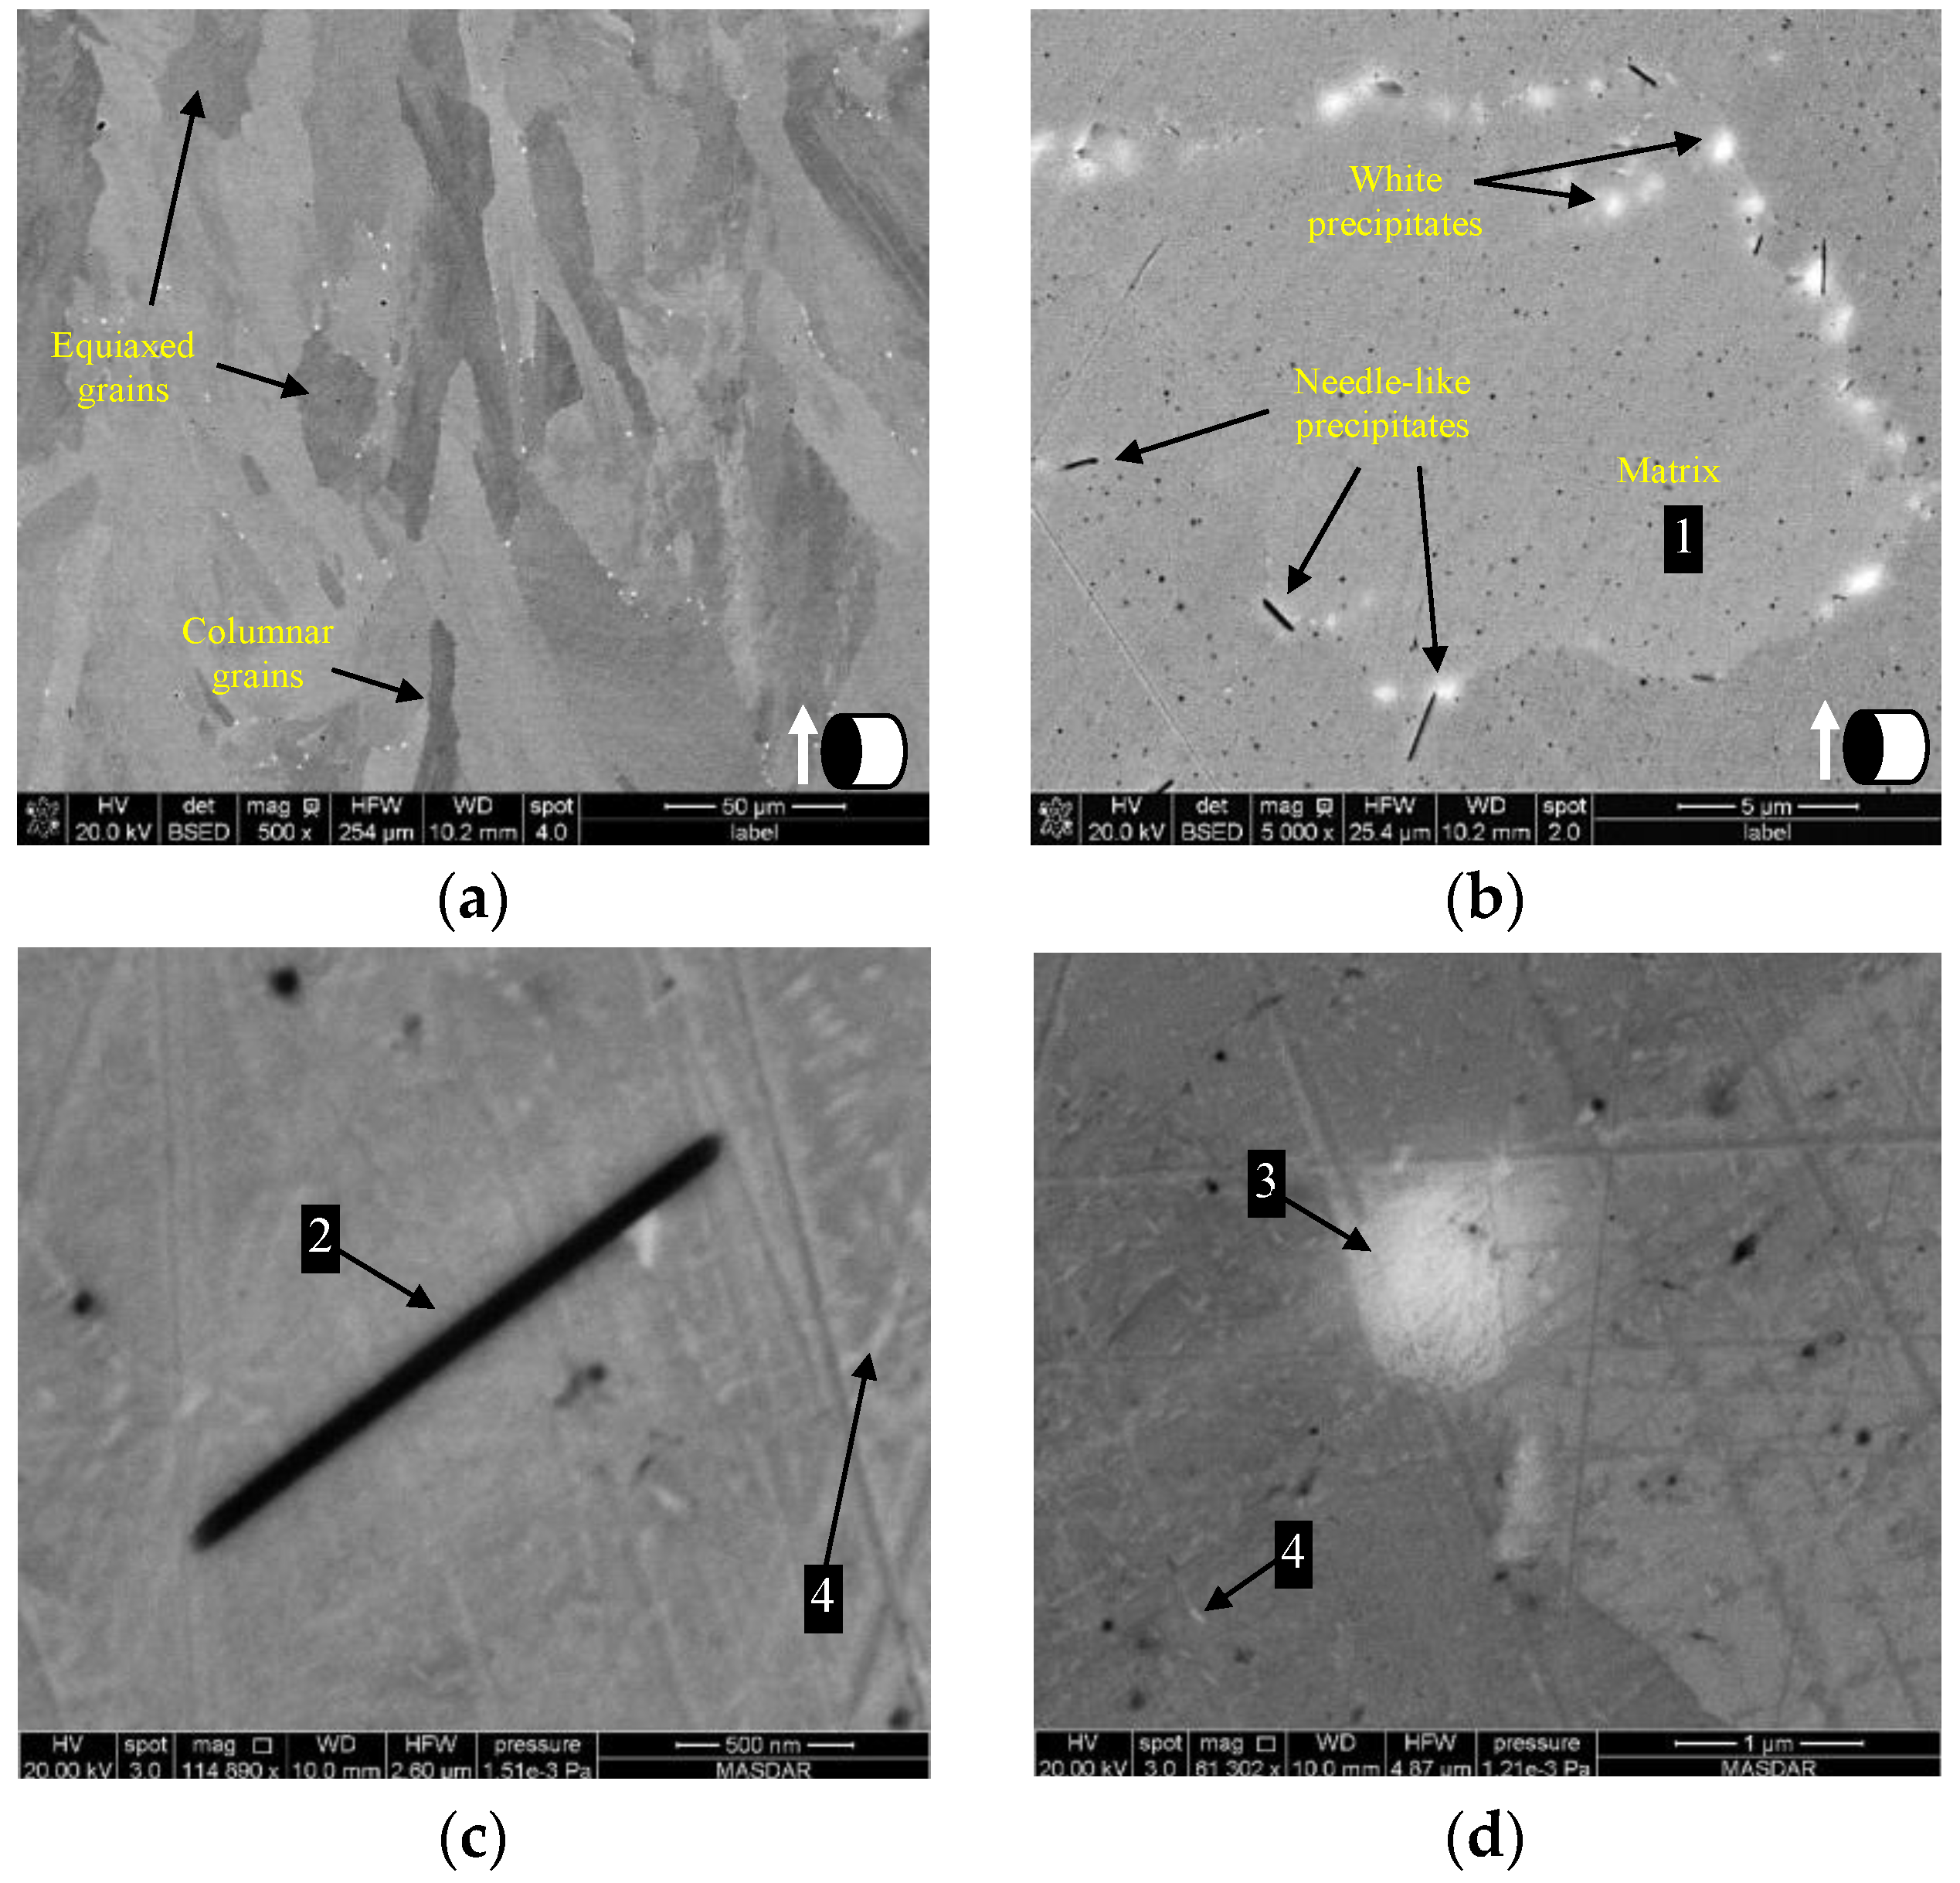
3.1.2. Microstructure of the as SLM-Printed Specimens
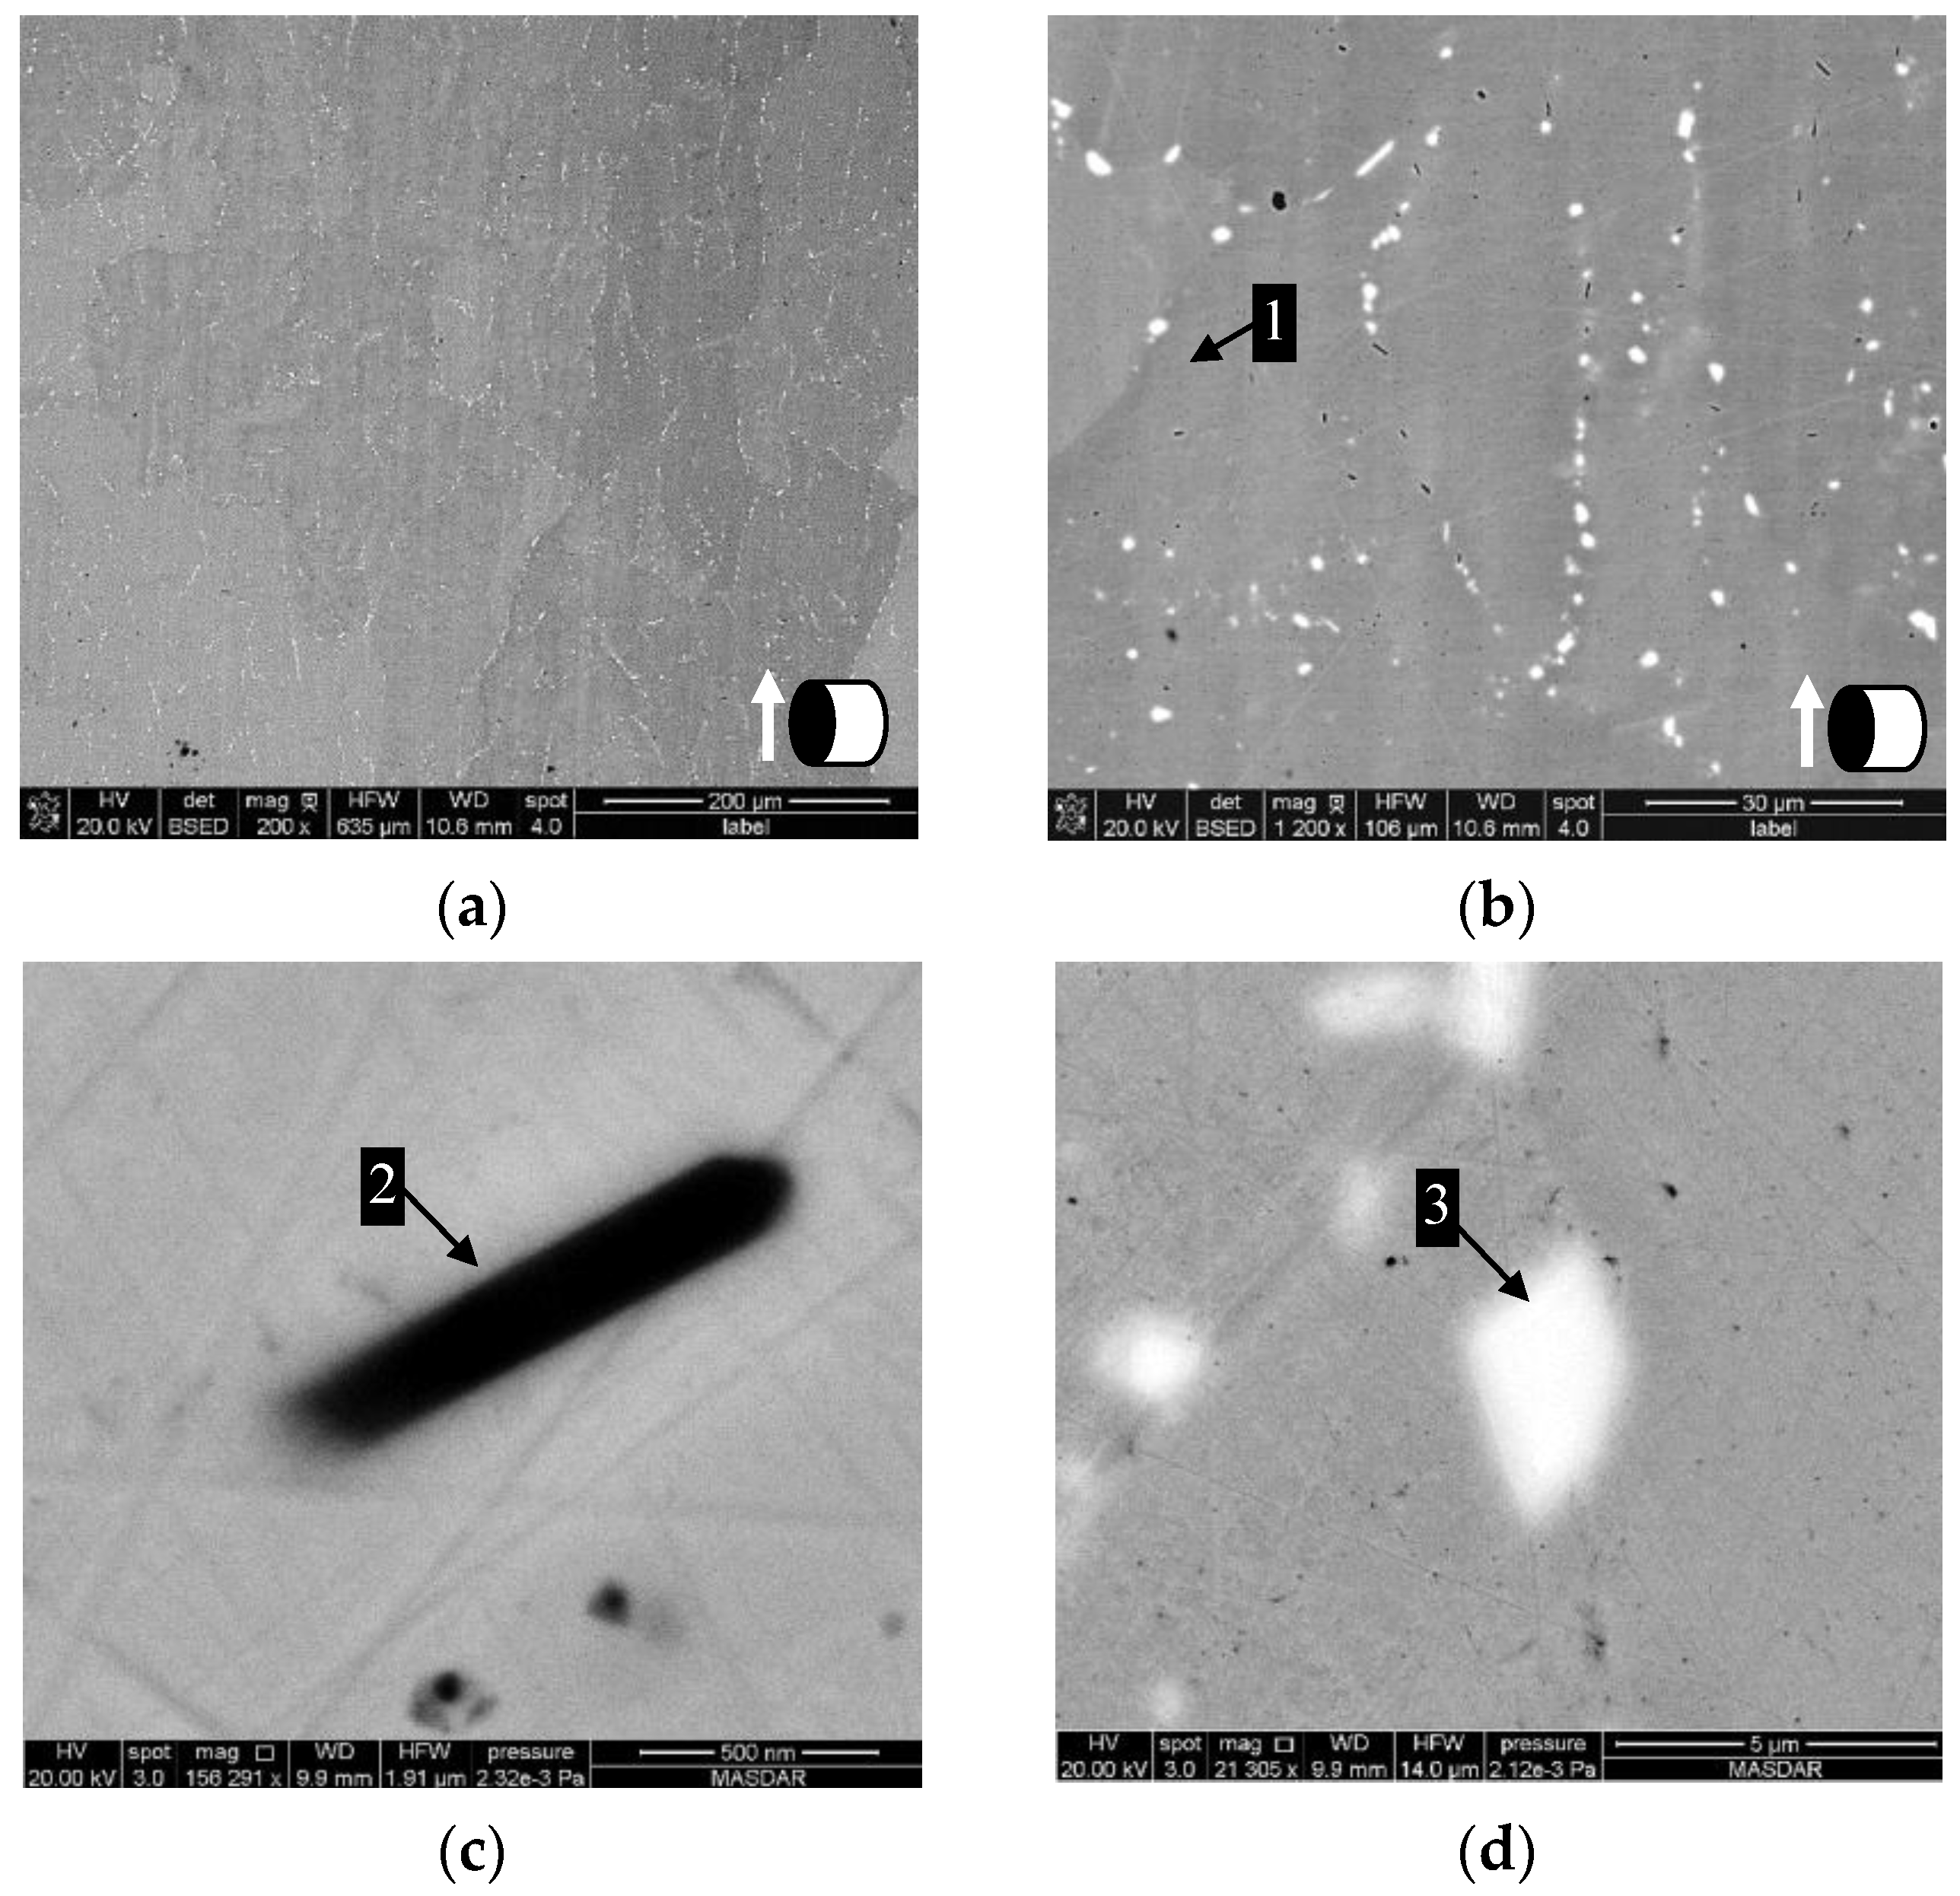
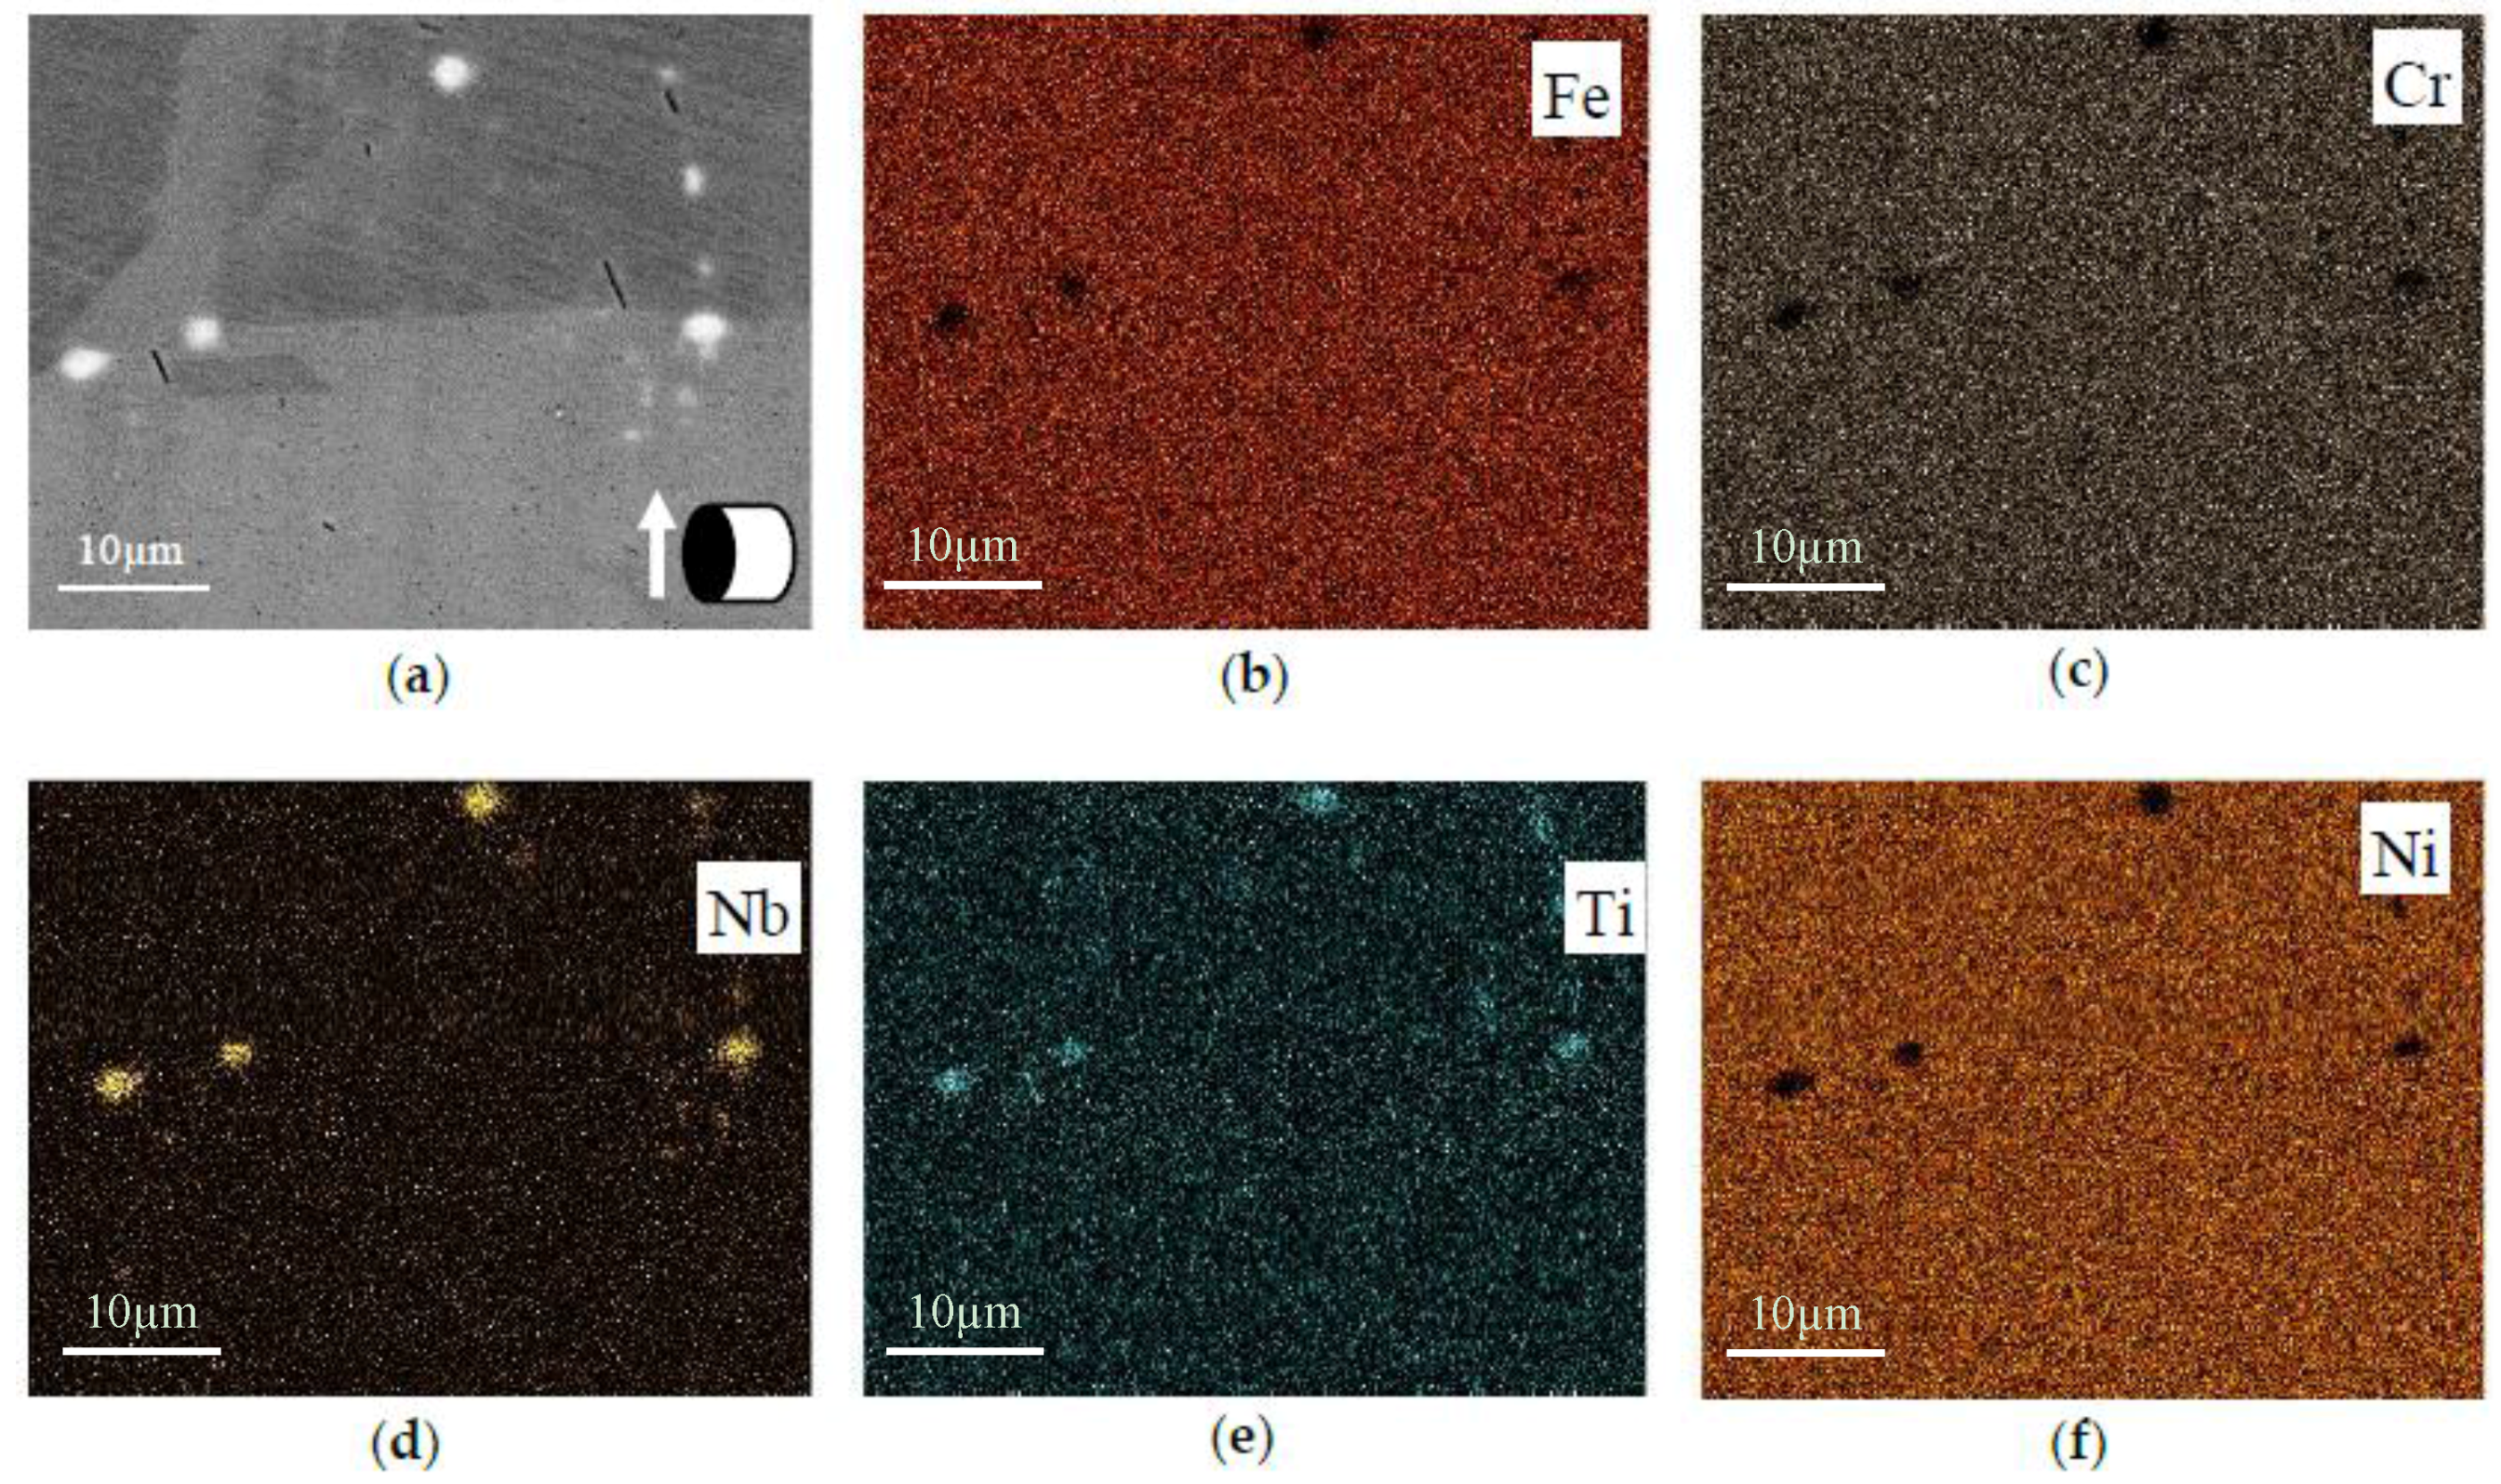
3.1.3. Microstructure Evolution in Homogenized and HIP-Treated Specimens
3.2. Phase Analysis of Heat Treated Specimens
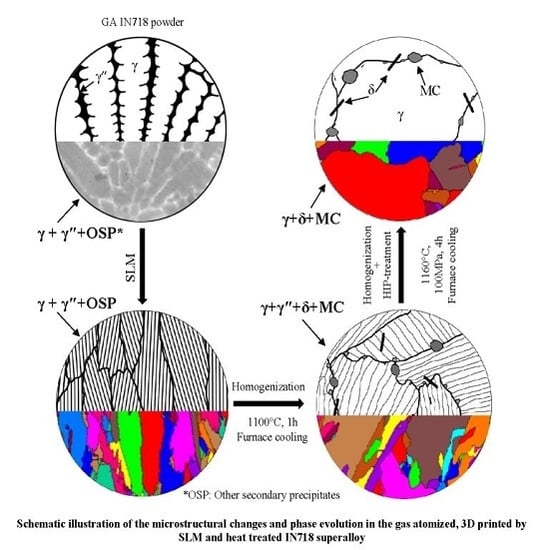
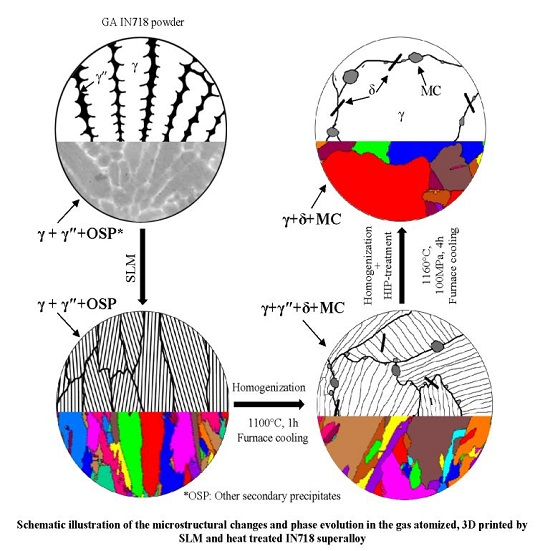
3.3. Structure, Texture and Phase Evolution
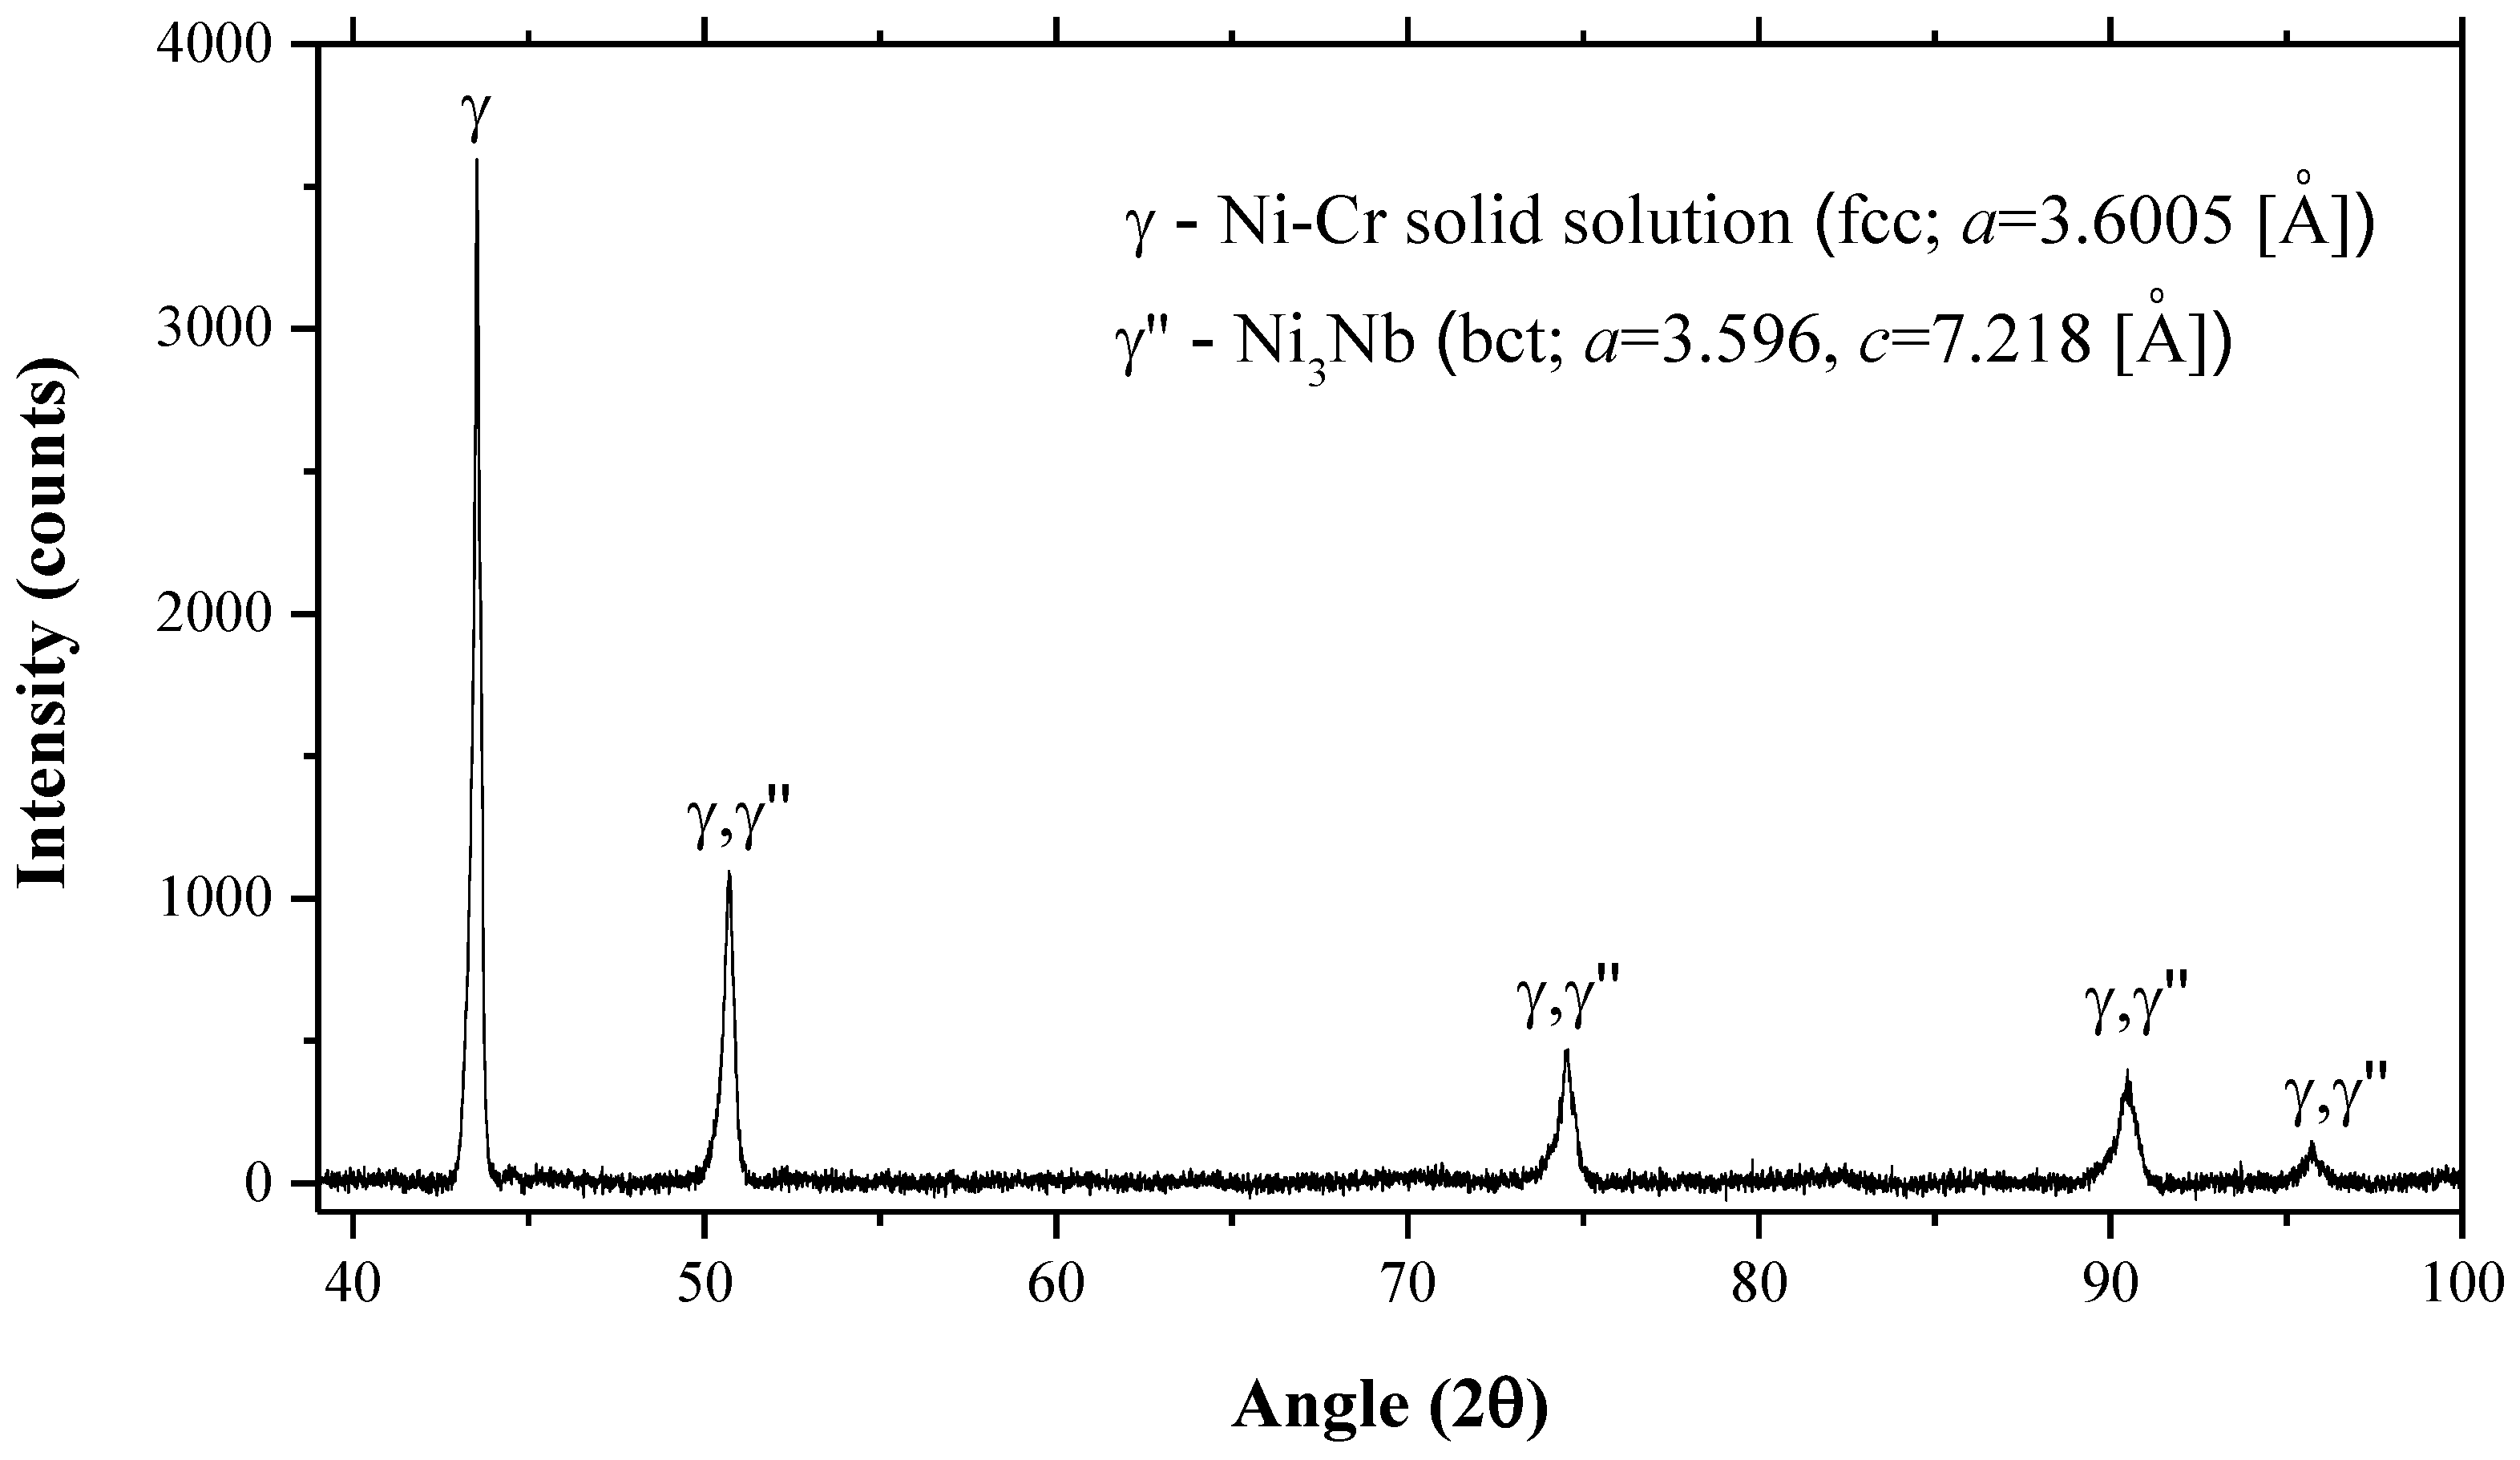
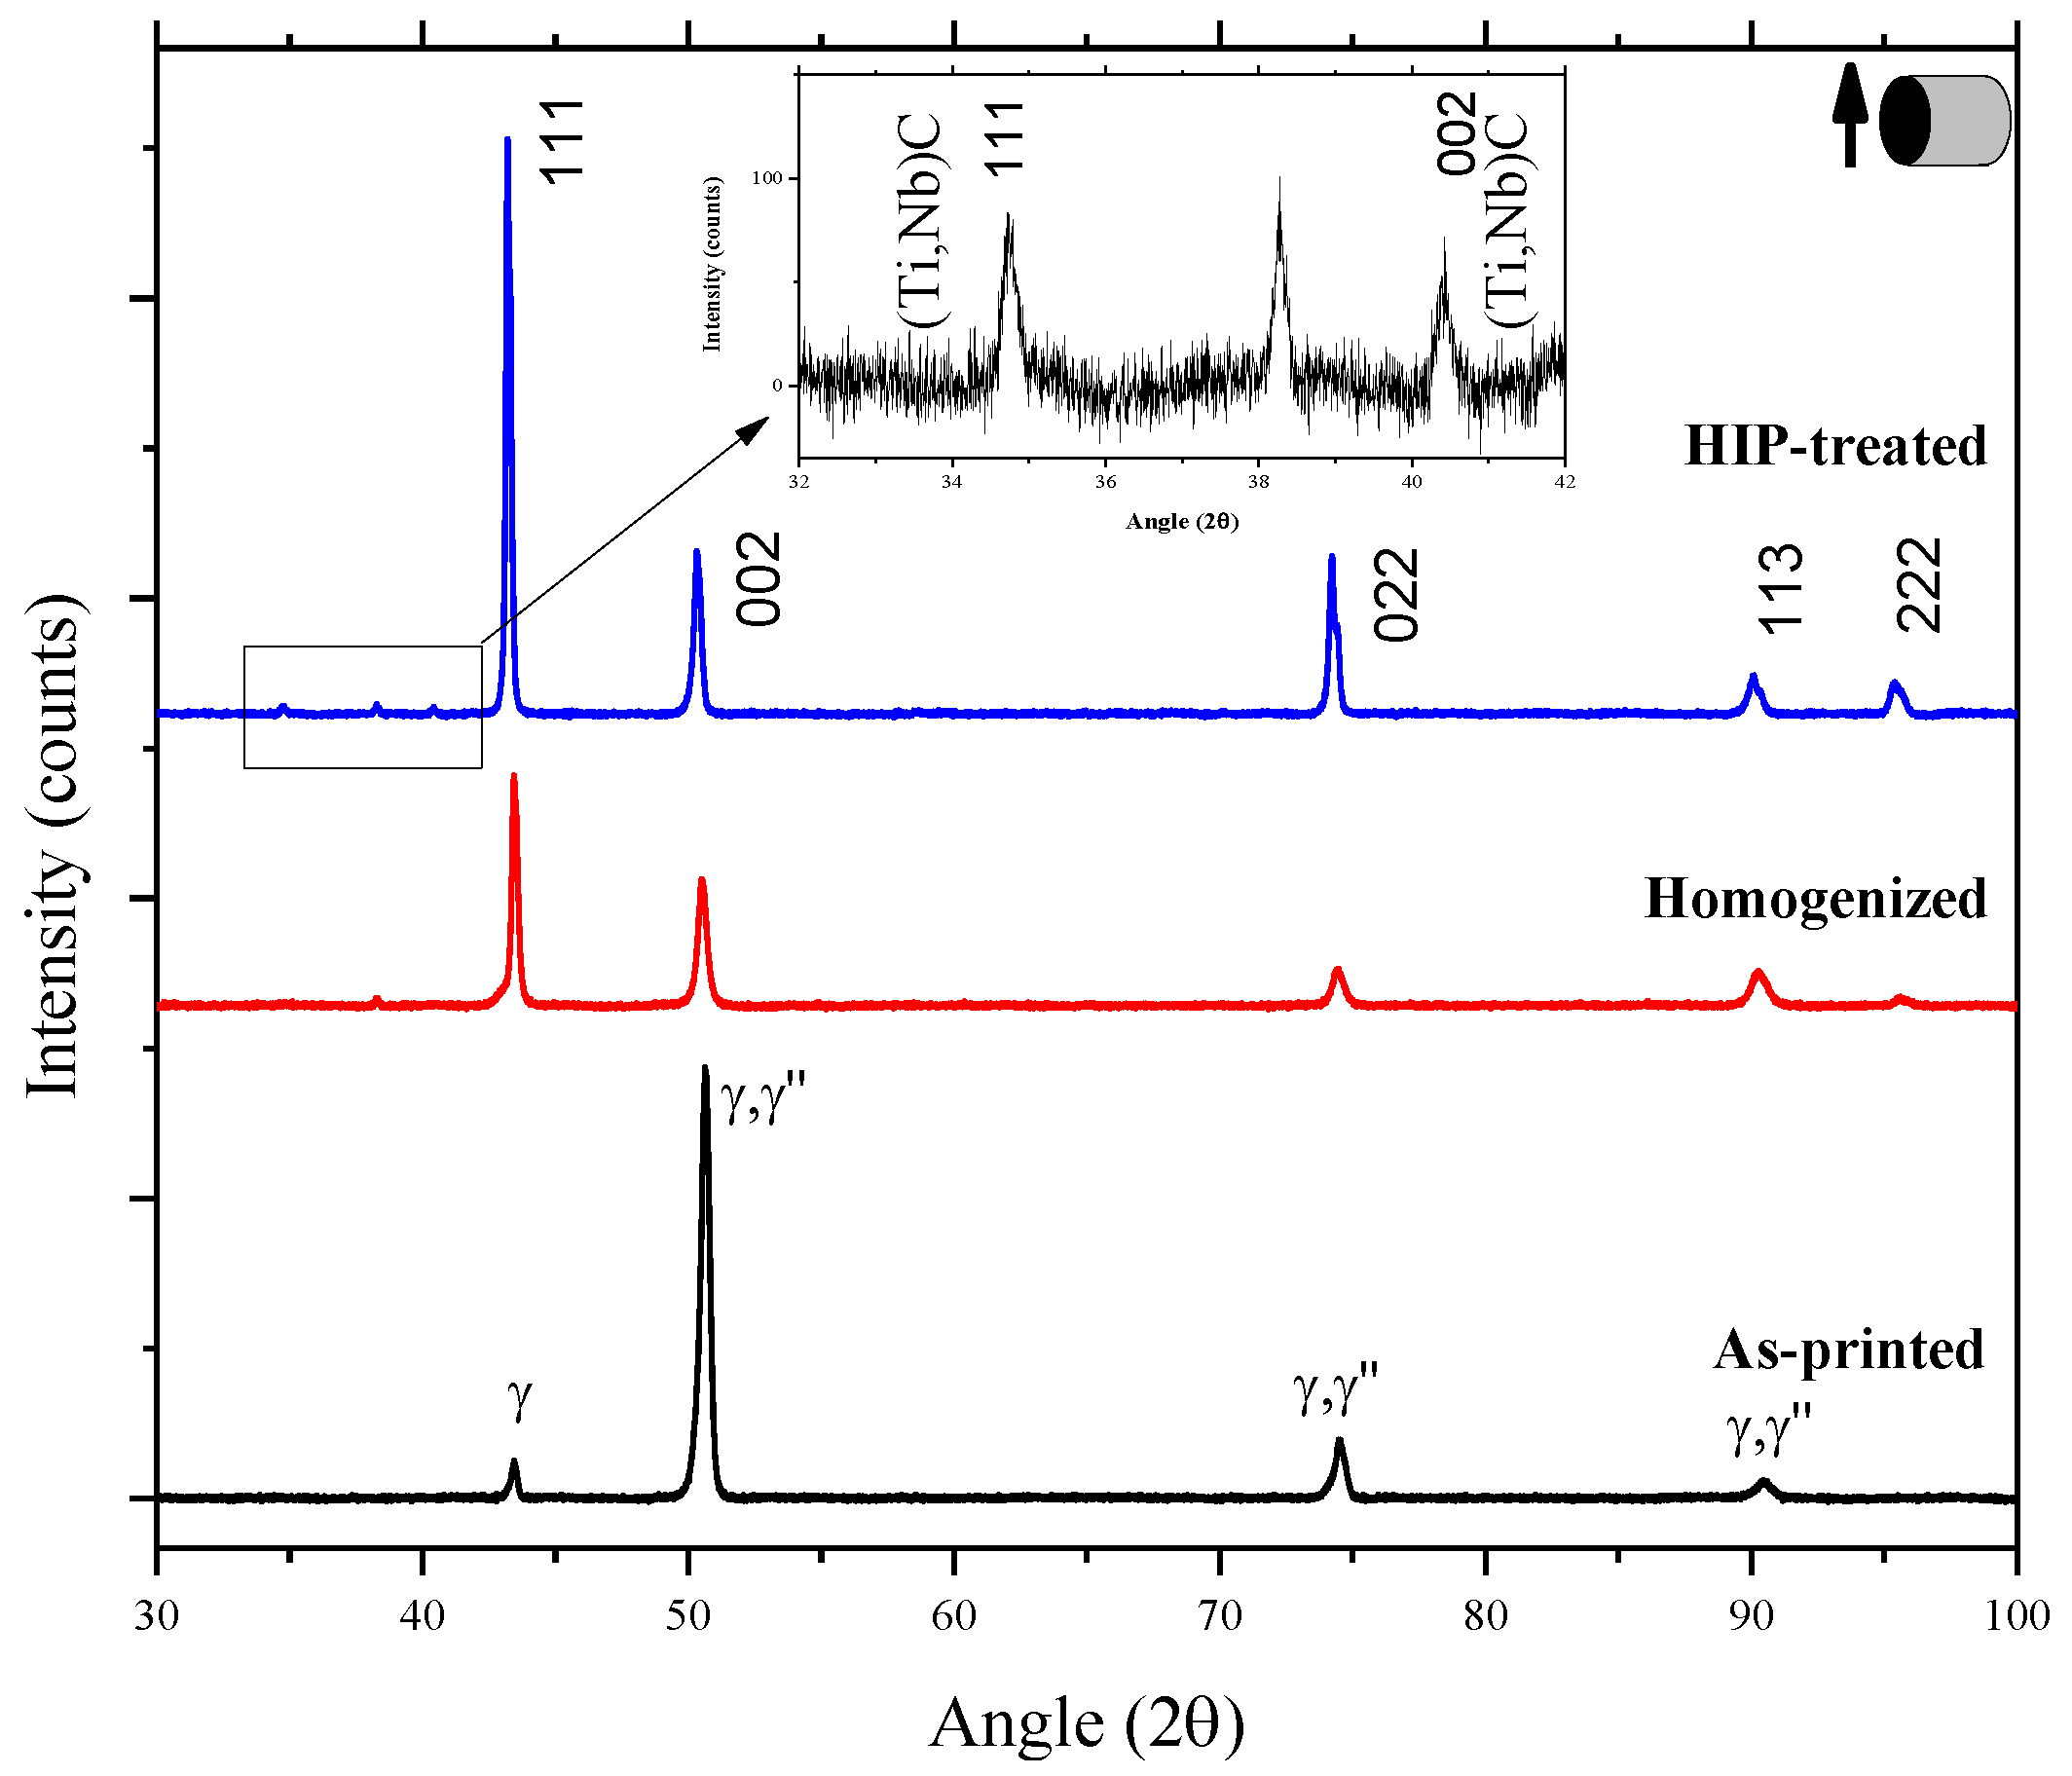
3.3.1. Structure and Phase Analysis Using XRD
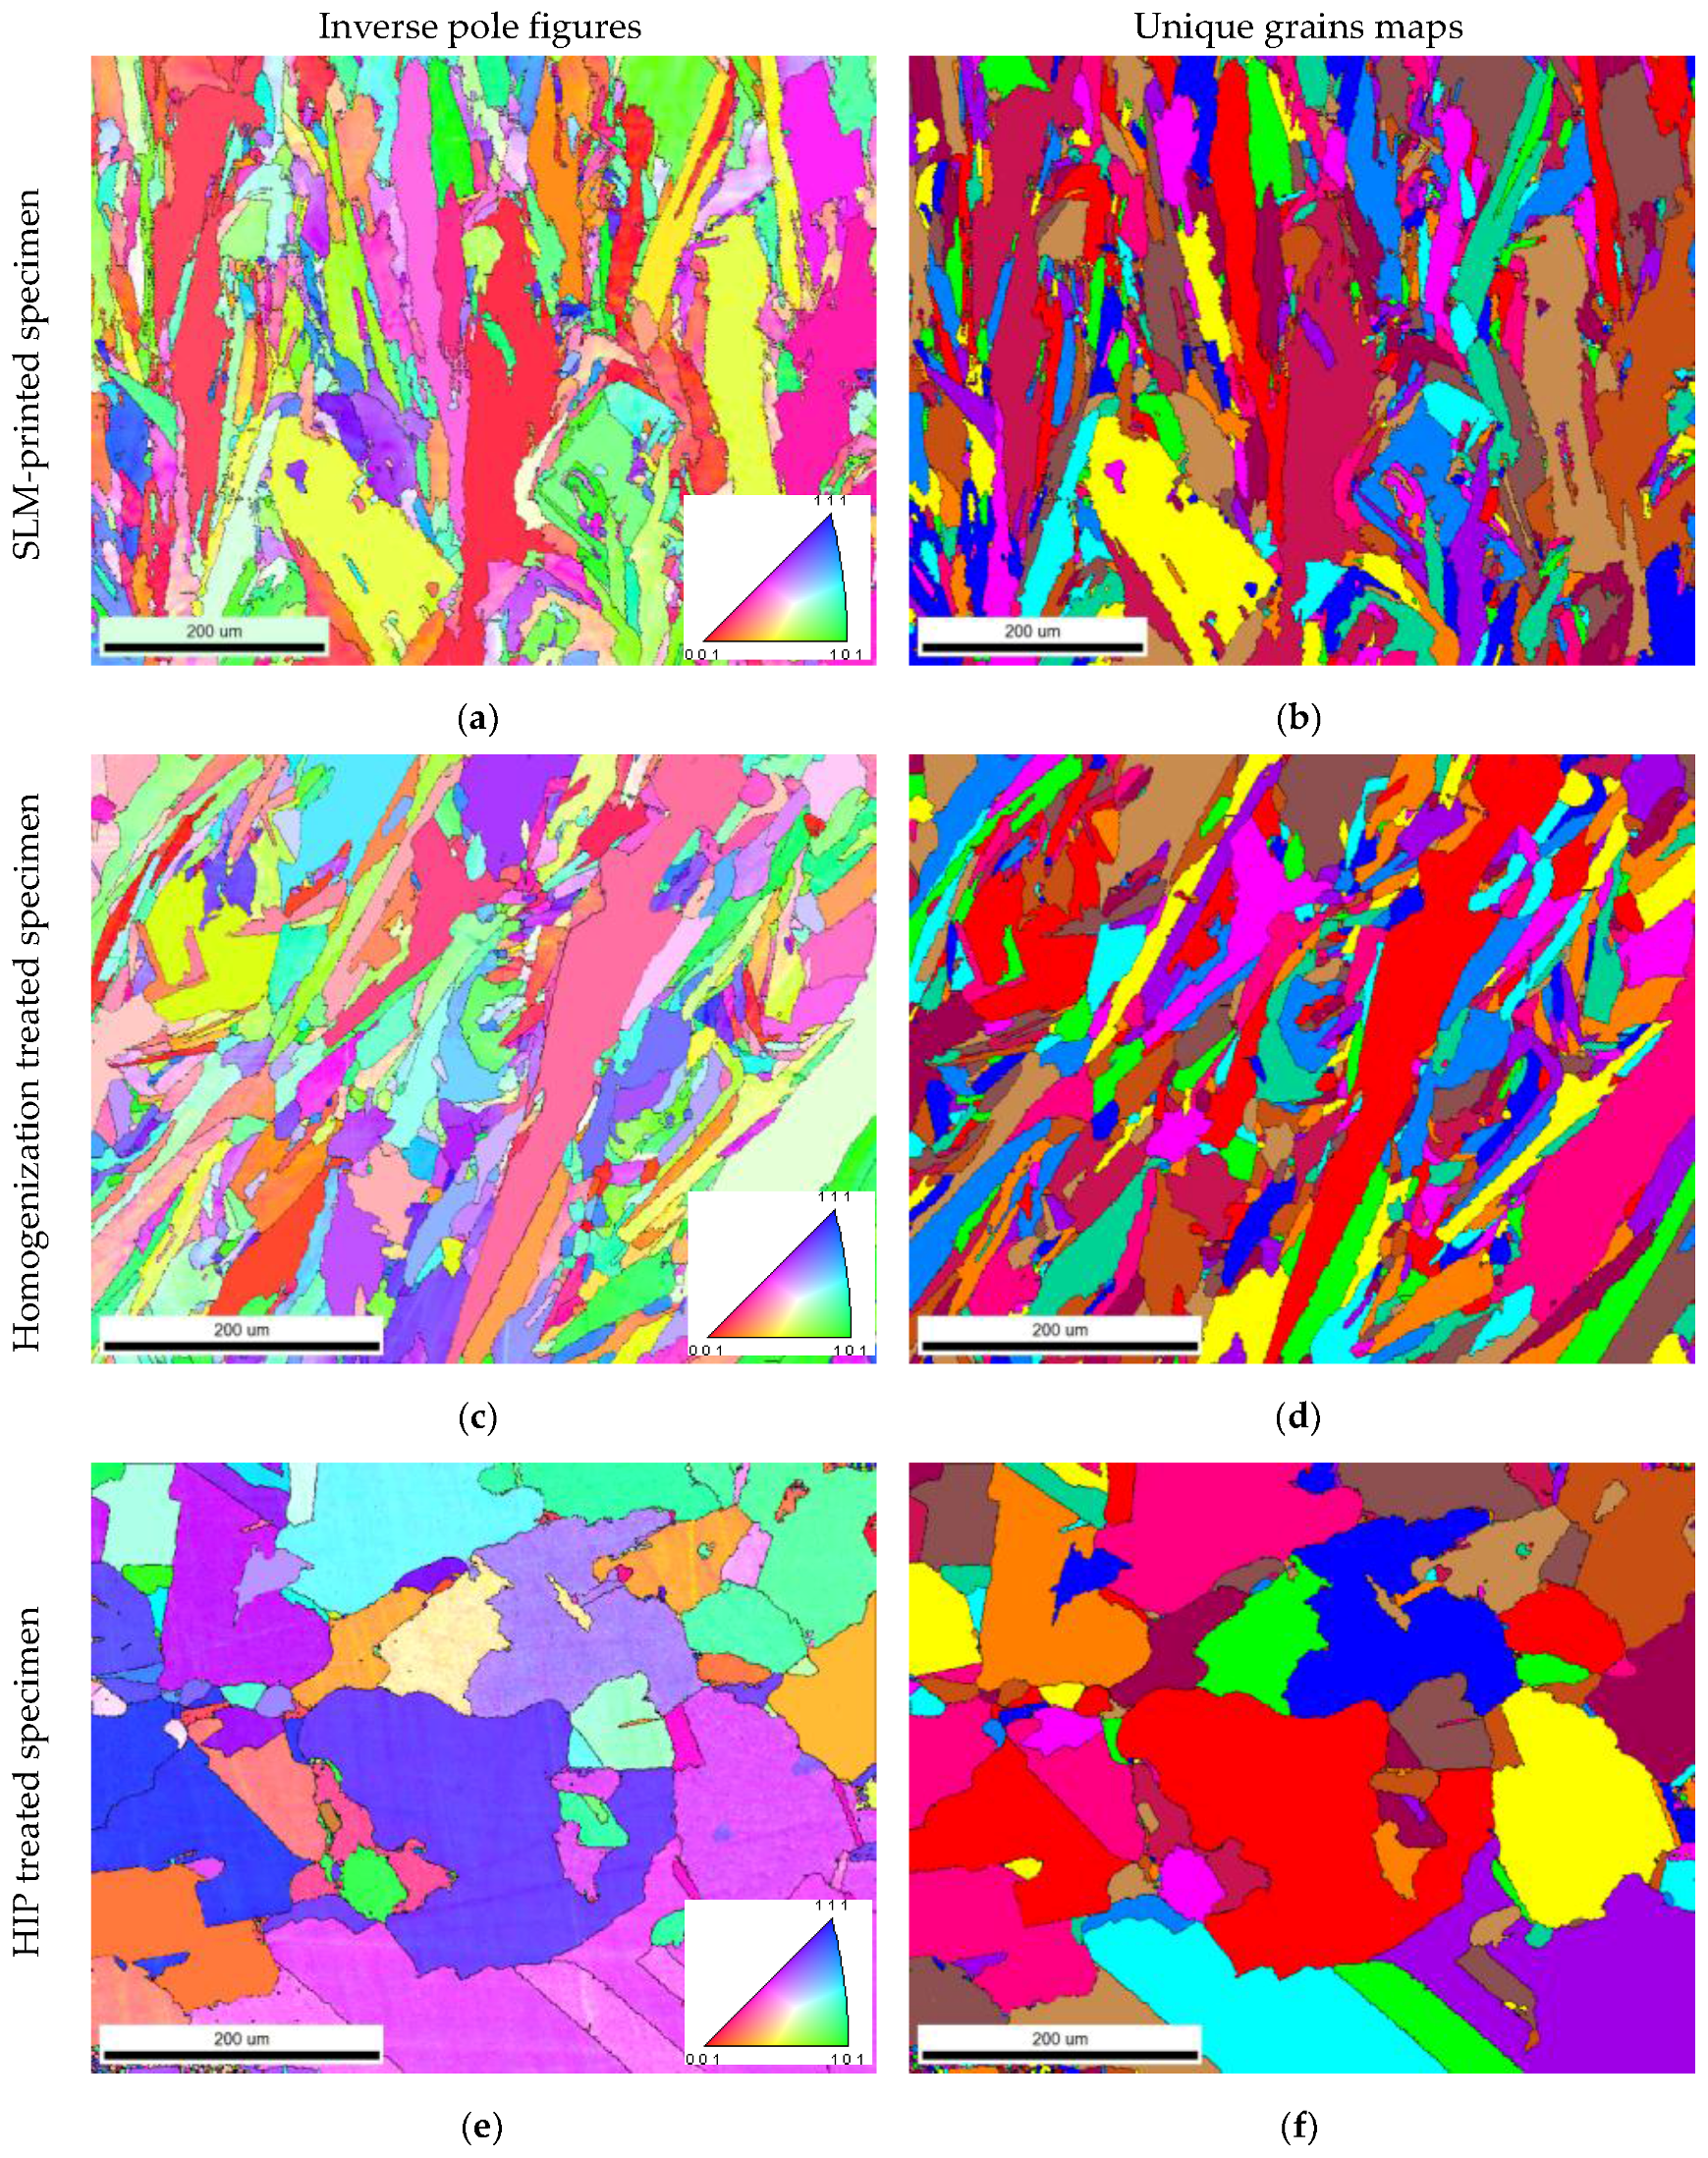
3.3.2. Texture Evolution through 3D Printing and Heat Treatments
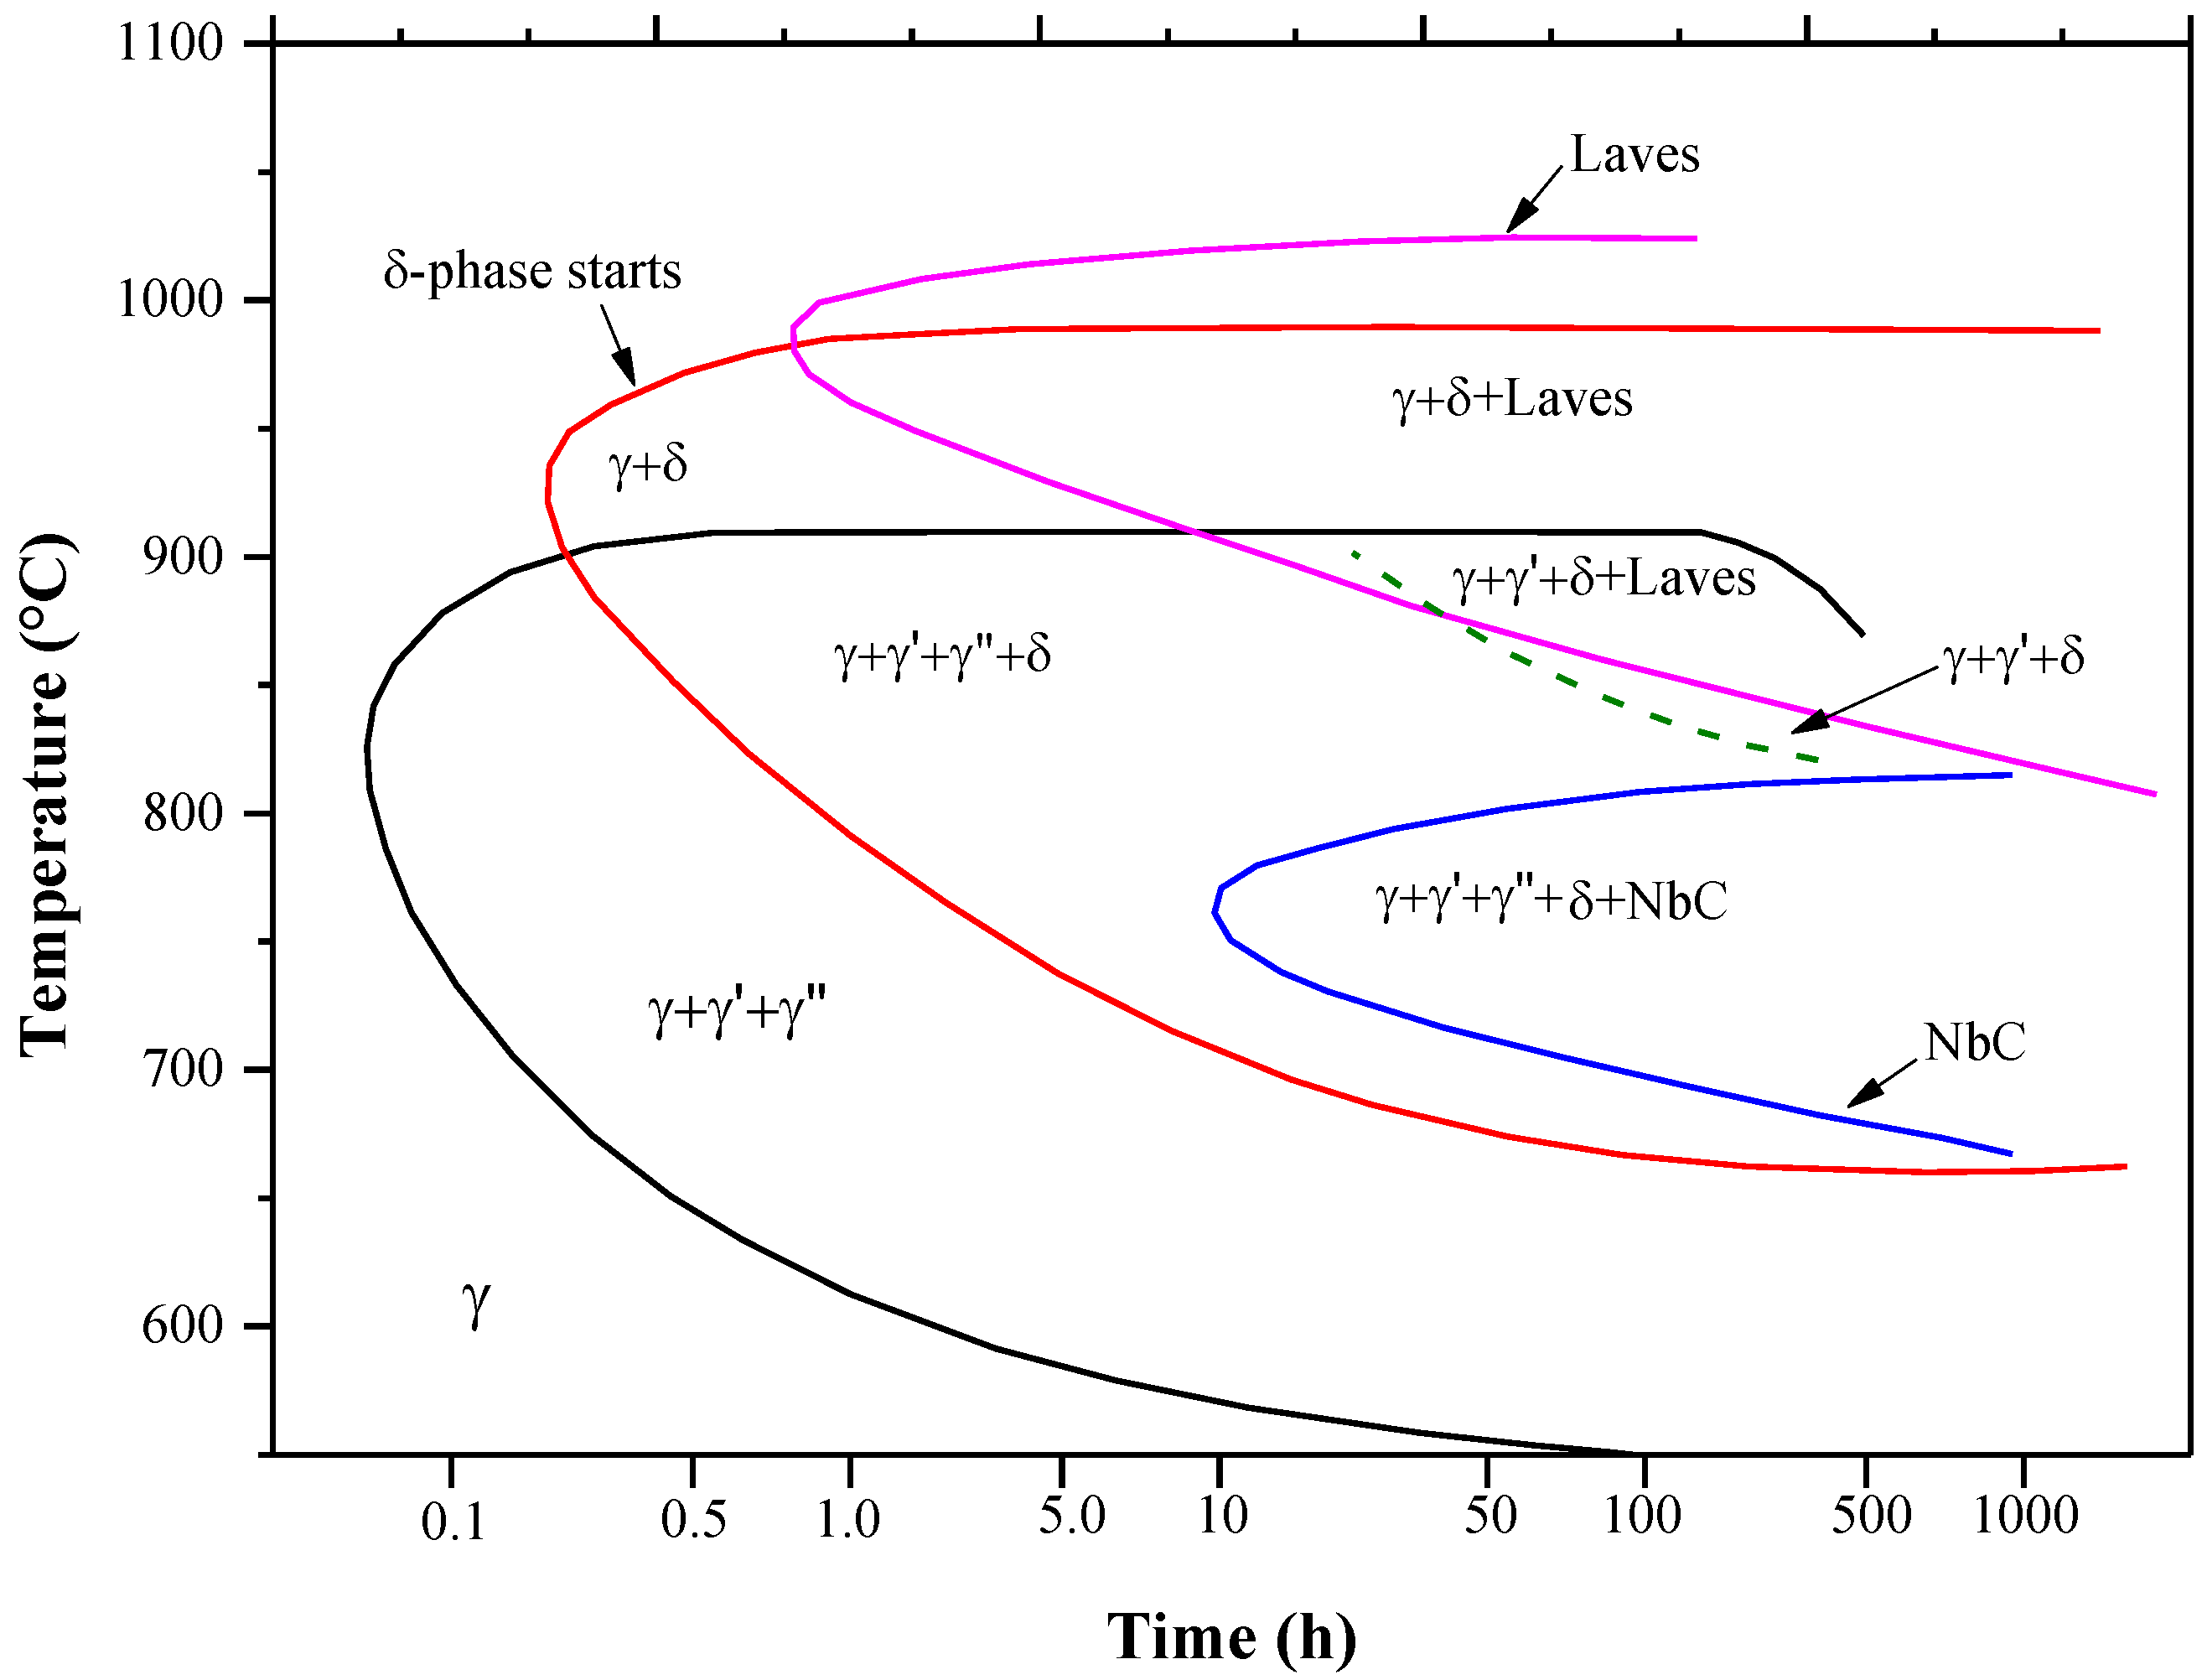
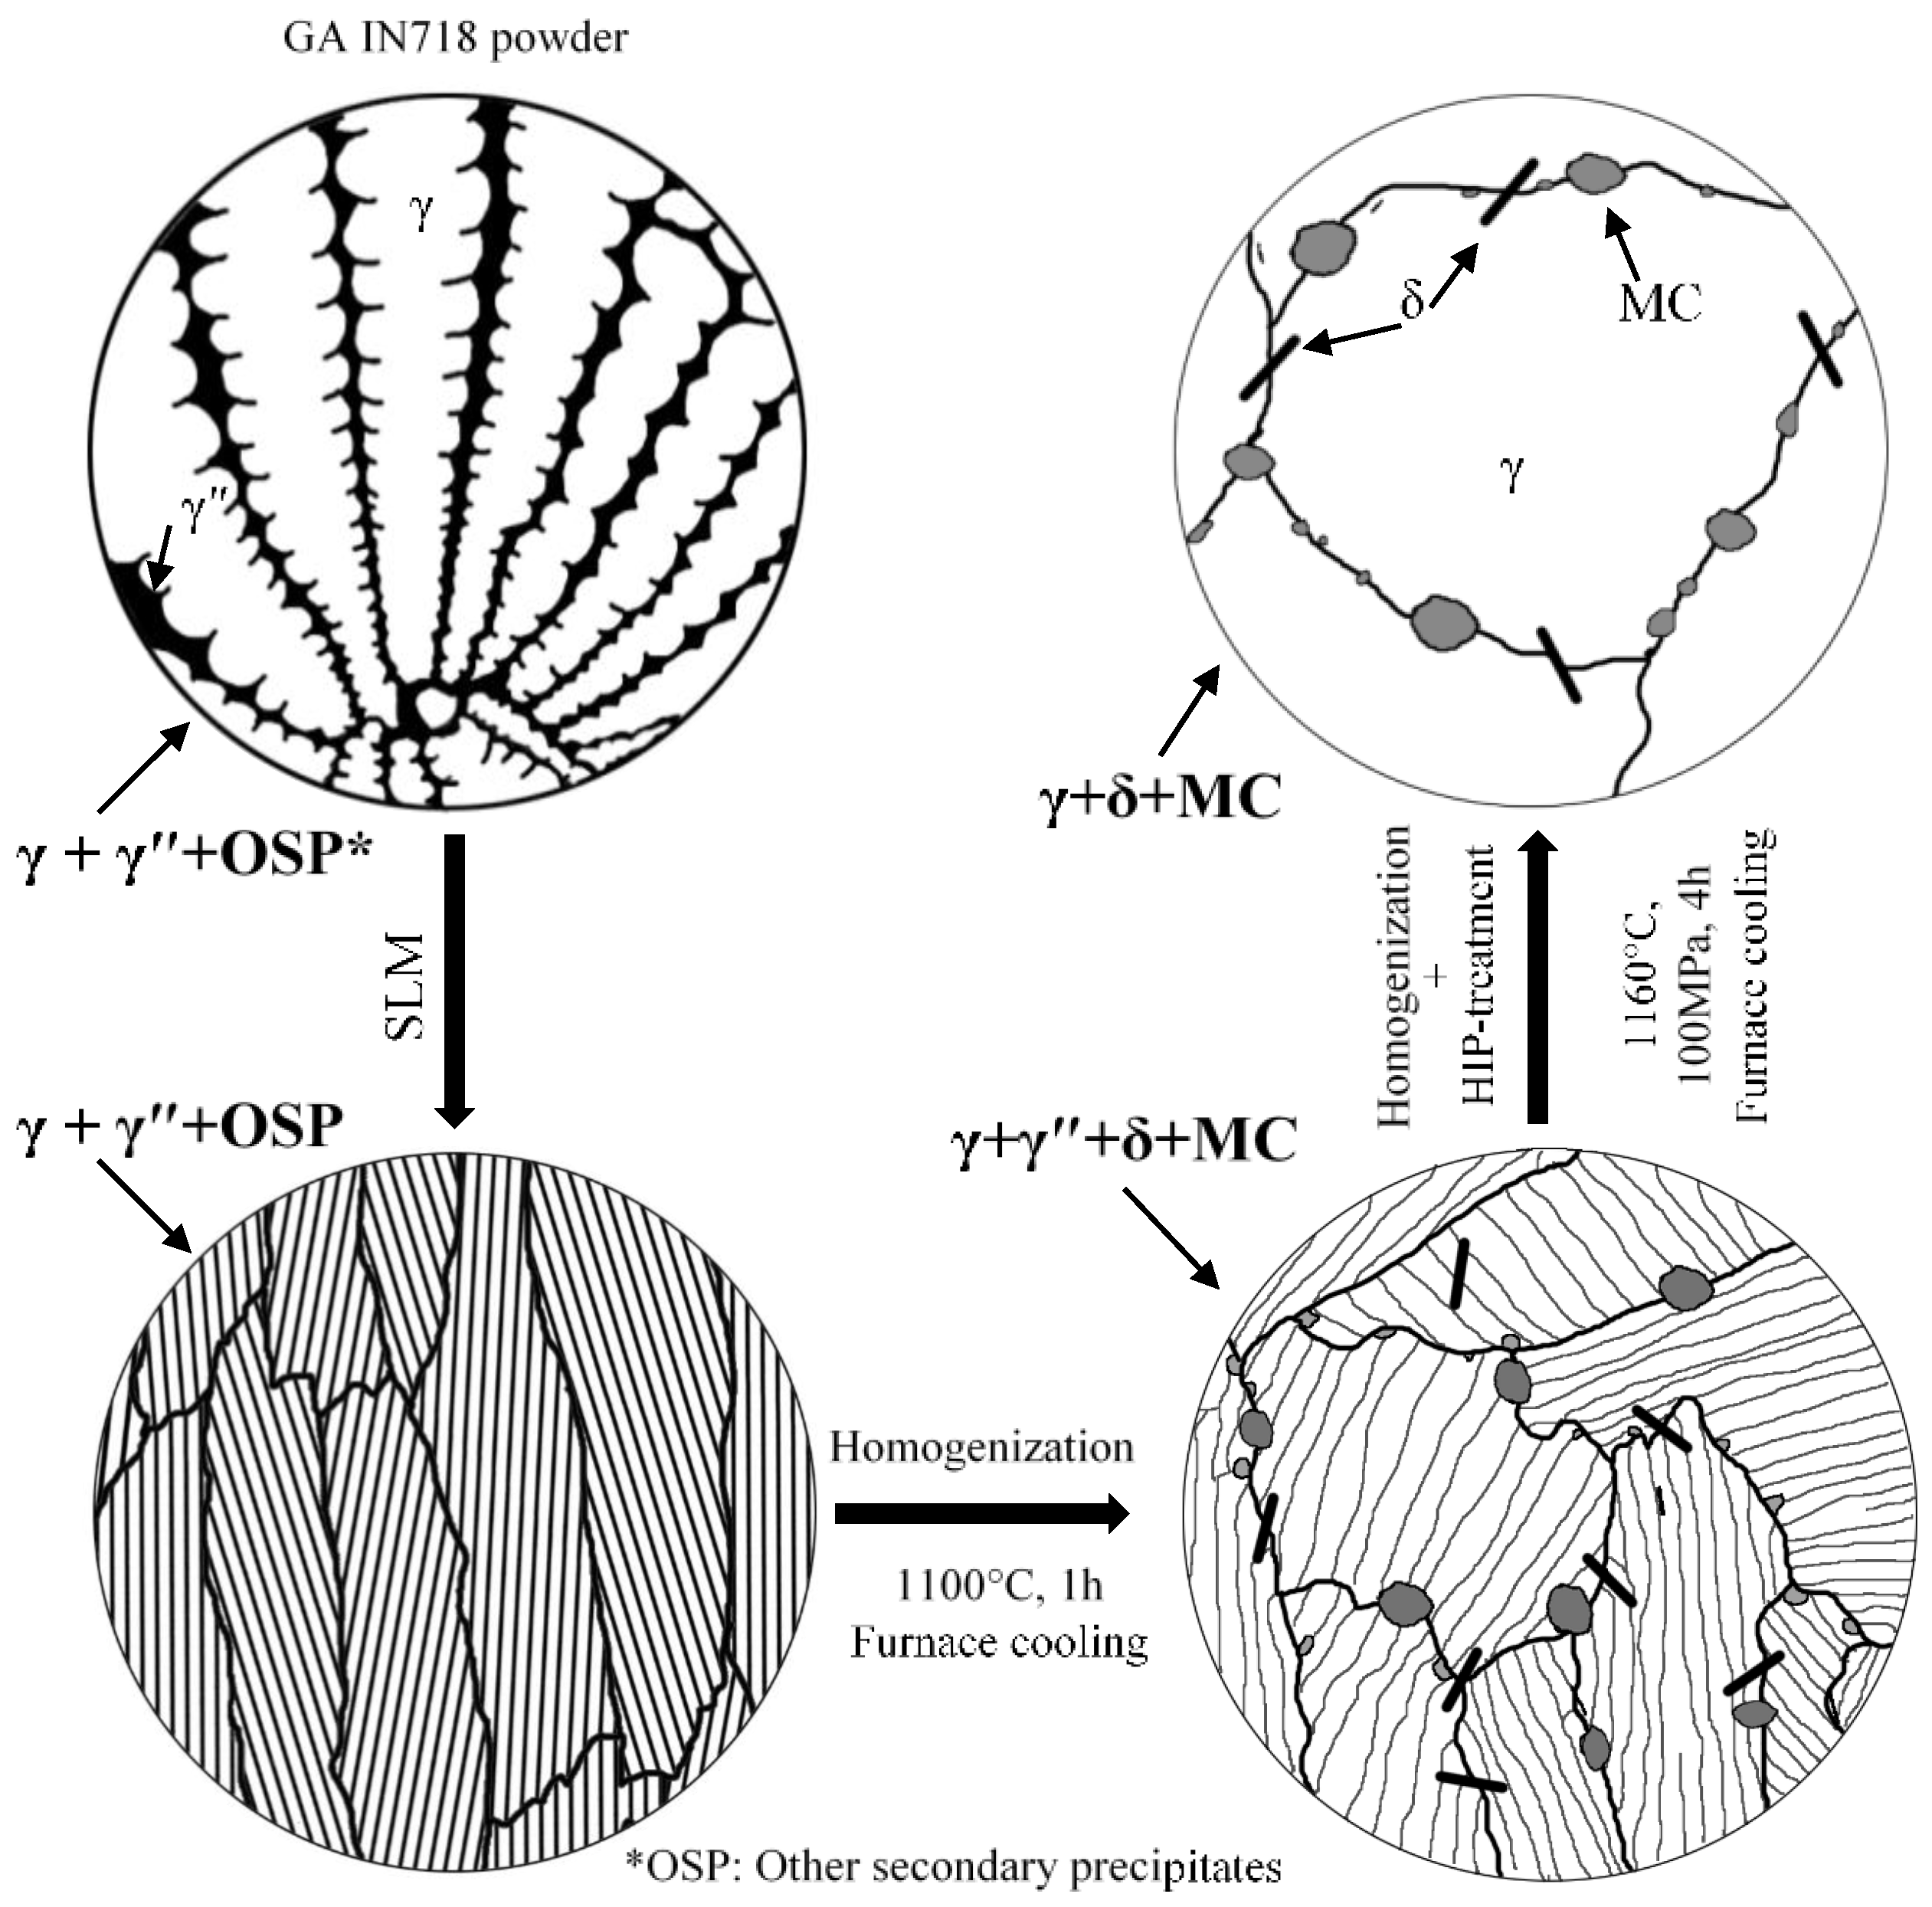
3.3.3. Phase Evolution in SLM 3D Printed IN718 Alloys
4. Conclusions
Acknowledgments
Author Contributions
Conflicts of Interest
References
- Pacurar, R.; Pacurar, A. Applications of the selective laser melting technology in the industrial and medical fields. In New Trends in 3D Printing; Shishkovsky, I.V., Ed.; INTECH: Rijeka, Croatia, 2016. [Google Scholar] [CrossRef]
- Wang, X.; Gong, X.; Chou, K. Review on powder-bed laser additive manufacturing of Inconel 718 parts. In Proceedings of the ASME 2015 International Manufacturing Science and Engineering Conference, Charlotte, NC, USA, 8–12 June 2015. [Google Scholar] [CrossRef]
- Eisenhut, M.; Langefeld, B. Additive Manufacturing: A Game Changer for the Manufacturing Industry; Roland Berger Strategy Consultants GmbH: Munich, Germany, 2013. [Google Scholar]
- Murr, L.E.; Martinez, E.; Gaytan, S.M.; Ramirez, D.A.; Machado, B.I.; Shindo, P.W.; Martinez, J.L.; Medina, F.; Wooten, J.; Ciscel, D.; et al. Microstructural architecture, microstructures, and mechanical properties for a nickel-base superalloy fabricated by electron beam melting. Metall. Mater. Trans. A 2011, 42, 3491–3508. [Google Scholar] [CrossRef]
- Kistler, N.A. Characterization of Inconel 718 Fabricated through Powder Bed Fusion Additive Manufacturing. Bachelor’s Thesis, The Pennsylvania State University, University Park, PA, USA, 2015. [Google Scholar]
- Prasad, K.; Sarkar, R.; Ghosal, P.; Kumar, V. Tensile deformation behavior of forged disc of IN718 superalloy at 650 °C. Mater. Des. 2010, 31, 4502–4507. [Google Scholar] [CrossRef]
- Paul, C.P.; Ganesh, P.; Mishra, S.K.; Bhargava, P.; Negi, J.; Nath, A.K. Investigating laser rapid manufacturing for Inconel-625 components. Opt. Laser Technol. 2007, 39, 800–805. [Google Scholar] [CrossRef]
- Ganesh, P.; Kaul, R.; Paul, C.P.; Tiwari, P.; Rai, S.K.; Prasad, R.C.; Kukreja, L.M. Fatigue and fracture toughness characteristics of laser rapid manufactured Inconel 625 structures. Mater. Sci. Eng. A 2010, 527, 7490–7497. [Google Scholar] [CrossRef]
- Zhang, Y.N.; Cao, X.; Wanjara, P.; Medraj, M. Fiber laser deposition of Inconel 718 using powders. In Proceedings of the Materials Science and Technology (MS&T) 2013 Conference, Montreal, QC, Canada, 27–31 October 2013. [Google Scholar]
- Mumtaz, K.; Hopkinson, N. Selective laser melting of Inconel 625 using pulse shaping. Rapid Prototyp. J. 2010, 16, 248–257. [Google Scholar] [CrossRef]
- Abioye, T.E.; Folkes, J.; Clare, A.T. A parametric study of Inconel 625 wire laser deposition. J. Mater. Process. Technol. 2013, 213, 2145–2151. [Google Scholar] [CrossRef]
- Dinda, G.P.; Dasgupta, A.K.; Mazumder, J. Laser aided direct metal deposition of Inconel 625 superalloy: Microstructural evolution and thermal stability. Mater. Sci. Eng. A 2009, 509, 98–104. [Google Scholar] [CrossRef]
- Jia, Q.; Gu, D. Selective laser melting additive manufacturing of Inconel 718 superalloy parts: Densification, microstructure and properties. J. Alloys Compd. 2014, 585, 713–721. [Google Scholar] [CrossRef]
- Trosch, T.; Strößner, J.; Völkl, R.; Glatzel, U. Microstructure and mechanical properties of selective laser melted Inconel 718 compared to forging and casting. Mater. Lett. 2016, 164, 428–431. [Google Scholar] [CrossRef]
- Choi, J.-P.; Shin, G.-H.; Yang, S.; Yang, D.-Y.; Lee, J.-S.; Brochu, M.; Yu, J.-H. Densification and microstructural investigation of Inconel 718 parts fabricated by selective laser melting. Powder Technol. 2017, 310, 60–66. [Google Scholar] [CrossRef]
- Wang, Z.; Guan, K.; Gao, M.; Li, X.; Chen, X.; Zeng, X. The microstructure and mechanical properties of deposited-IN718 by selective laser melting. J. Alloys Compd. 2012, 513, 518–523. [Google Scholar] [CrossRef]
- Amato, K.N.; Gaytan, S.M.; Murr, L.E.; Martinez, E.; Shindo, P.W.; Hernandez, J.; Collins, S.; Medina, F. Microstructures and mechanical behavior of Inconel 718 fabricated by selective laser melting. Acta Mater. 2012, 60, 2229–2239. [Google Scholar] [CrossRef]
- Parimi, L.L.; Ravi, G.A.; Clark, D.; Attallah, M.M. Microstructural and texture development in direct laser fabricated IN718. Mater. Charact. 2014, 89, 102–111. [Google Scholar] [CrossRef]
- Wei, H.L.; Mazumder, J.; DebRoy, T. Evolution of solidification texture during additive manufacturing. Sci. Rep. 2015, 5, 16446. [Google Scholar] [CrossRef] [PubMed]
- Blackwell, P.L. The mechanical and microstructural characteristics of laser-deposited IN718. J. Mater. Process. Technol. 2005, 170, 240–246. [Google Scholar] [CrossRef]
- EOS Gmbh Electro Optical Systems. EOS Nickelalloy in718 Datasheet; EOS Gmbh Electro Optical Systems: Munich, Germany, 2014. [Google Scholar]
- Smith, D.H.; Bicknell, J.; Jorgensen, L.; Patterson, B.M.; Cordes, N.L.; Tsukrov, I.; Knezevic, M. Microstructure and mechanical behavior of direct metal laser sintered Inconel alloy 718. Mater. Charact. 2016, 113, 1–9. [Google Scholar] [CrossRef]
- Thompson, R.G.; Dobbs, J.; Mayo, D. The effect of heat treatment on microfissuring in alloy 718. Weld J. 1986, 65, 299–304. [Google Scholar]
- X’Pert HighScore Plus, version 3.0.2; software for phase identification from powder diffraction data; PANalytical: Almelo, The Netherlands, 2011.
- Pierre, V. Pearson’s Crystal Data, Crystal Structure Database for Inorganic Compounds (on CD-ROM); ASM International: Materials Park, OH, USA, 2010. [Google Scholar]
- Zhang, S.; Zhao, D. Aerospace Materials Handbook; CRC Press: Boca Raton, FL, USA, 2013. [Google Scholar]
- Mullis, A.M.; Farrell, L.; Cochrane, R.F.; Adkins, N.J. Estimation of cooling rates during close-coupled gas atomization using secondary dendrite arm spacing measurement. Metall. Mater. Trans. B 2013, 44, 992–999. [Google Scholar] [CrossRef]
- Murr, L.E.; Martinez, E.; Amato, K.N.; Gaytan, S.M.; Hernandez, J.; Ramirez, D.A.; Shindo, P.W.; Medina, F.; Wicker, R.B. Fabrication of metal and alloy components by additive manufacturing: Examples of 3D materials science. J. Mater. Res. Technol. 2012, 1, 42–54. [Google Scholar] [CrossRef]
- Amine, T.; Newkirk, J.W.; Liou, F. An investigation of the effect of direct metal deposition parameters on the characteristics of the deposited layers. Case Stud. Ther. Eng. 2014, 3, 21–34. [Google Scholar] [CrossRef]
- Antonsson, T.; Fredriksson, H. The effect of cooling rate on the solidification of Inconel 718. Metall. Mater. Trans. B 2005, 36, 85–96. [Google Scholar] [CrossRef]
- Vrancken, B.; Wauthlé, R.; Kruth, J.-P.; Humbeeck, J.V. Study of the influence of material properties on residual stress in selective laser melting. In Proceedings of the Solid Free Fabrication Symposium, KU Leuven, Austin, TX, USA, 2–14 August 2013; pp. 1–15. [Google Scholar]
- Saeidi, K.; Gao, X.; Zhong, Y.; Shen, Z.J. Hardened austenite steel with columnar sub-grain structure formed by laser melting. Mater. Sci. Eng. A 2015, 625, 221–229. [Google Scholar] [CrossRef]
- Zheng, L.; Liu, Y.; Sun, S.; Zhang, H. Selective laser melting of Al–8.5Fe–1.3V–1.7Si alloy: Investigation on the resultant microstructure and hardness. Chin. J. Aeronaut. 2015, 28, 564–569. [Google Scholar] [CrossRef]
- Zhou, X.; Li, K.; Zhang, D.; Liu, X.; Ma, J.; Liu, W.; Shen, Z. Textures formed in a CoCrMo alloy by selective laser melting. J. Alloys Compd. 2015, 631, 153–164. [Google Scholar] [CrossRef]
- Liu, F.; Lin, X.; Yang, G.; Song, M.; Chen, J.; Huang, W. Recrystallization and its influence on microstructures and mechanical properties of laser solid formed nickel base superalloy Inconel 718. Rare Met. 2011, 30, 433–438. [Google Scholar] [CrossRef]
- Lewandowski, M.S.; Sahai, V.; Wilcox, R.C.; Matlock, C.A.; Overfelt, R.A. High temperature deformation of Inconel 718 castings. In Superalloys 718, 625, 706 and Various. Dérivatives; Loria, E.A., Ed.; TMS-AIME: Warrendale, PA, USA, 1994; pp. 345–354. [Google Scholar] [CrossRef]
- Zhang, F.; Levine, L.E.; Allen, A.J.; Campbell, C.E.; Lass, E.A.; Cheruvathur, S.; Stoudt, M.R.; Williams, M.E.; Idell, Y. Homogenization kinetics of a nickel-based superalloy produced by powder bed fusion laser sintering. Scr. Mater. 2017, 113, 98–102. [Google Scholar] [CrossRef]
- Sochalski-Kolbus, L.M.; Payzant, E.A.; Cornwell, P.A.; Watkins, T.R.; Babu, S.S.; Dehoff, R.R.; Lorenz, M.; Ovchinnikova, M.; Duty, C. Comparison of residual stresses in Inconel 718 simple parts made by electron beam melting and direct laser metal sintering. Metall. Mater. Trans. A 2015, 46, 1419–1432. [Google Scholar] [CrossRef]
- Slama, C.; Servant, C.; Cizeron, G. Aging of the Inconel 718 alloy between 500 and 750 °C. J. Mater. Res. 2011, 12, 2298–2316. [Google Scholar] [CrossRef]
- Azadian, S.; Wei, L.-Y.; Warren, R. Delta phase precipitation in Inconel 718. Mater. Charact. 2004, 53, 7–16. [Google Scholar] [CrossRef]
- Idell, Y.; Levine, L.E.; Allen, A.J.; Zhang, F.; Campbell, C.E.; Olson, G.B.; Gong, J.; Snyder, D.R.; Deutchman, H.Z. Unexpected δ-phase formation in additive-manufactured Ni-based superalloy. JOM 2016, 68, 950–959. [Google Scholar] [CrossRef]
- Jouiad, M.; Marin, E.; Devarapalli, R.S.; Cormier, J.; Ravaux, F.; Le Gall, C.; Franchet, J.M. Microstructure and mechanical properties evolutions of alloy 718 during isothermal and thermal cycling over-aging. Mater. Des. 2016, 102, 284–296. [Google Scholar] [CrossRef]
- Rao, G.; Sankaranarayana, M.; Balasubramaniam, S. Hot isostatic pressing technology for defence and space applications. Def. Sci. J. 2012, 62, 73–80. [Google Scholar] [CrossRef]
- Clark, D.; Bache, M.R.; Whittaker, M.T. Shaped metal deposition of a nickel alloy for aero engine applications. J. Mater. Process. Technol. 2008, 203, 439–448. [Google Scholar] [CrossRef]
- Janaki Ram, G.D.; Venugopal Reddy, A.; Prasad Rao, K.; Reddy, G.M.; Sarin Sundar, J.K. Microstructure and tensile properties of Inconel 718 pulsed Nd-YAG laser welds. J. Mater. Process. Technol. 2005, 167, 73–82. [Google Scholar] [CrossRef]
- Schirra, J.J.; Caless, R.H.; Hatala, R.W. The effect of laves phase on the mechanical properties of wrought and cast + HIP Inconel 718. In Superalloys 718, 625, 706 and Various. Dérivatives; Loria, E.A., Ed.; TMS-AIME: Warrendale, PA, USA, 1991; pp. 375–388. [Google Scholar] [CrossRef]
- Qi, H.; Azer, M.; Ritter, A. Studies of standard heat treatment effects on microstructure and mechanical properties of laser net shape manufactured Inconel 718. Metall. Mater. Trans. A 2009, 40, 2410–2422. [Google Scholar] [CrossRef]
- Mitchell, A.; Schmalz, A.J.; Schvezov, C.; Cockroft, S. The precipitation of primary carbides in alloy 718. In Superalloys 718, 625 and Various Derivatives; Loria, E.A., Ed.; TMS-AIME: Warrendale, PA, USA, 1994; pp. 65–78. [Google Scholar]
- Bouse, G.K. Application of a modified phase diagram to the production of cast alloy 718 components. In Superalloy 718–Metallurgy Application; Loria, E.A., Ed.; TMS-AIME: Warrendale, PA, USA, 1989; pp. 69–79. [Google Scholar]
- Cieslak, M.J.; Knorovsky, G.A.; Headley, T.J.; Romig, A.D.J. The solidification metallurgy of alloy 718 and other Nb-containing superalloys. Superalloy 1989, 718, 59–68. [Google Scholar]
- Murata, Y.; Morinaga, M.; Yukawa, N.; Ogawa, H.; Kato, M. Solidification structures of Inconel 718 with microalloying elements. Superalloys 1994, 718, 81–88. [Google Scholar]
- Sjoberg, G.; Ingesten, N.G.; Carlson, R.G. Grain boundary δ-phase morphologies, carbides and notch rupture sensitivity of cast alloy 718. Superalloys 1991, 718, 603–620. [Google Scholar] [CrossRef]
- Lifshitz, I.M.; Slyozov, V.V. The kinetics of precipitation from supersaturated solid solutions. J. Phys. Chem. Solids 1961, 19, 35–50. [Google Scholar] [CrossRef]
- Oradei-Basile, A.; Radavich, J.F. A current TTT diagram for wrought alloy 718. Superalloys 1991, 718, 325–335. [Google Scholar]


| Element | wt % | Comments |
|---|---|---|
| Ni | 52.7 | Based on the analysis of the current work |
| Fe | 18.5 | |
| Cr | 20.0 | |
| Nb | 4.8 | |
| Mo | 2.9 | |
| Ti | 1.1 | |
| Al | 0.45 | |
| Co | ≤1.0 | Composition of trace elements as reported by [21] |
| Cu | ≤0.3 | |
| C | ≤0.08 | |
| Si, Mn | Each ≤ 0.35 | |
| P, S | Each ≤ 0.015 | |
| B | ≤0.006 |
| Element | Microdendrites | Interdendritic Spaces | EDS Error % | ||
|---|---|---|---|---|---|
| wt % | at % | wt % | at % | ||
| Nb | 4.12 | 4.73 | 8.77 | 9.82 | 6.7 |
| Mo | 2.07 | 2.20 | 2.88 | 2.99 | 8.8 |
| Ti | 0.81 | 1.20 | 1.39 | 2.08 | 9.5 |
| Cr | 18.57 | 23.04 | 18.15 | 22.60 | 3.2 |
| Fe | 18.03 | 19.00 | 15.52 | 16.36 | 4.0 |
| Ni | 54.03 | 46.21 | 50.77 | 43.16 | 3.0 |
| Trace | Balance | Balance | Balance | Balance | - |
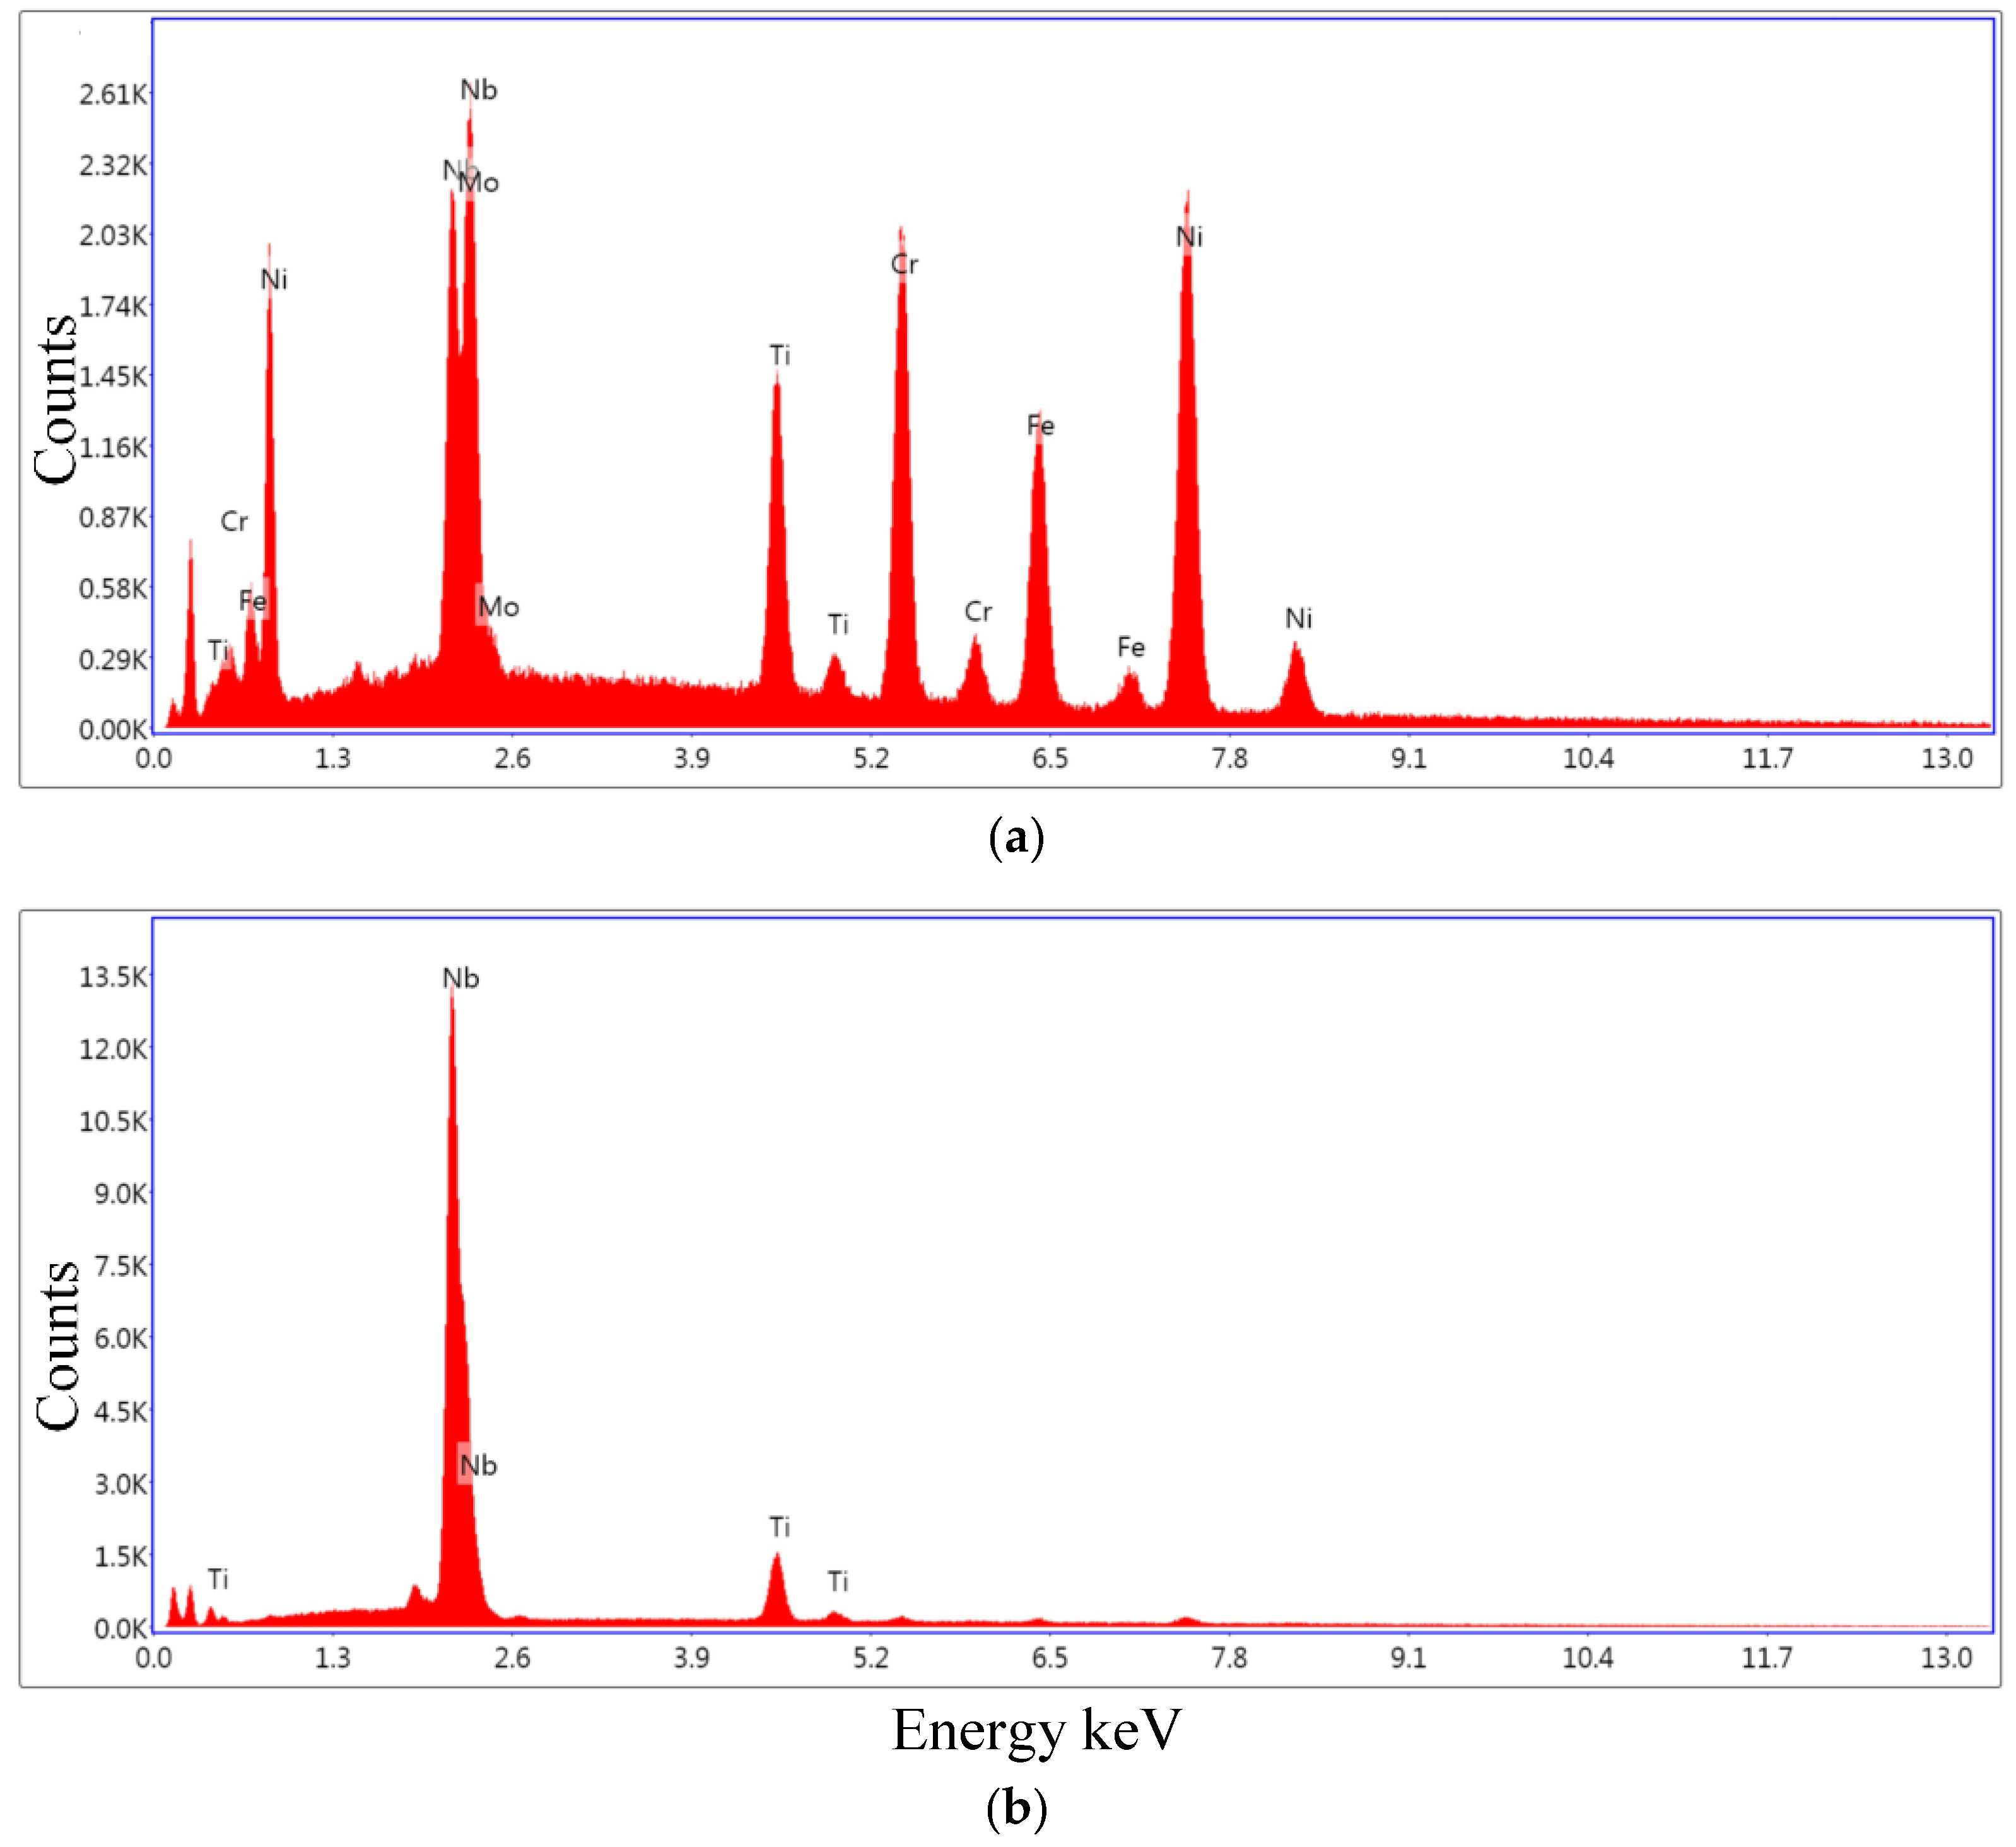
| Spot | Designation | Nb | Mo | Ti | Cr | Fe | Ni |
|---|---|---|---|---|---|---|---|
| 1 | γ-phase | 3.96 | 1.67 | 1.47 | 22.4 | 19.65 | 49.85 |
| 2 | δ-phase | 8.75 | 8.25 | 12.70 | 18.65 | 15.15 | 36.50 |
| 3 | MC-type carbide | 77.50 | - | 22.50 | - | - | - |
| 4 | γ″-phase | Below EDS detection limits 1 | |||||
| Phase | Crystal Structure | Prototype | Space Group | Lattice Parameters Å | Refs. | ||
|---|---|---|---|---|---|---|---|
| a | b | c | |||||
| γ-phase | fcc | Cu | Fm-3m | 3.60 (0) | - | - | This work |
| 3.59 | [17] | ||||||
| 3.59 | [4,28] | ||||||
| γ″-phase | bct | TiAl3 | I4/mmm | 3.60 (9) | - | 7.22 (4) | This work |
| 3.62 | 7.41 | [17] | |||||
| 3.62 | 7.41 | [4,28] | |||||
| δ-phase | orthorhombic | - | Pmmm | 5.10 | 4.20 | 4.50 | [17] |
| MC-type carbide (Nb0.78Ti0.22)C | fcc | NaCl | Fm-3m | 4.46 (7) | - | - | This work |
© 2017 by the authors. Licensee MDPI, Basel, Switzerland. This article is an open access article distributed under the terms and conditions of the Creative Commons Attribution (CC BY) license (http://creativecommons.org/licenses/by/4.0/).
Share and Cite
Mostafa, A.; Picazo Rubio, I.; Brailovski, V.; Jahazi, M.; Medraj, M. Structure, Texture and Phases in 3D Printed IN718 Alloy Subjected to Homogenization and HIP Treatments. Metals 2017, 7, 196. https://doi.org/10.3390/met7060196
Mostafa A, Picazo Rubio I, Brailovski V, Jahazi M, Medraj M. Structure, Texture and Phases in 3D Printed IN718 Alloy Subjected to Homogenization and HIP Treatments. Metals. 2017; 7(6):196. https://doi.org/10.3390/met7060196
Chicago/Turabian StyleMostafa, Ahmad, Ignacio Picazo Rubio, Vladimir Brailovski, Mohammad Jahazi, and Mamoun Medraj. 2017. "Structure, Texture and Phases in 3D Printed IN718 Alloy Subjected to Homogenization and HIP Treatments" Metals 7, no. 6: 196. https://doi.org/10.3390/met7060196