Article

Corrosion and Discharge Behaviors of Mg-Al-Zn and Mg-Al-Zn-In Alloys as Anode Materials

1
Key Laboratory of Marine Environmental Corrosion and Bio-fouling, Institute of Oceanology, Chinese Academy of Sciences, Qingdao 266071, China
2
University of Chinese Academy of Sciences, Beijing 100049, China
3
Electric Power Research Institute, Zhejiang Power Corporation, State Grid Corporation of China, Hangzhou 310000, China
*
Authors to whom correspondence should be addressed.
Metals 2016, 6(3), 65; https://doi.org/10.3390/met6030065
Submission received: 29 January 2016 / Revised: 16 February 2016 / Accepted: 4 March 2016 / Published: 17 March 2016
(This article belongs to the Special Issue Oxidation of Metals)

Abstract

:
The Mg-6%Al-3%Zn and Mg-6%Al-3%Zn-(1%, 1.5%, 2%)In alloys were prepared by melting and casting. Their microstructures were investigated via metallographic and energy-dispersive X-ray spectroscopy (EDS) analysis. Moreover, hydrogen evolution and electrochemical tests were carried out in 3.5 wt% NaCl solution aiming at identifying their corrosion mechanisms and discharge behaviors. The results suggested that indium exerts an improvement on both the corrosion rate and the discharge activity of Mg-Al-Zn alloy via the effects of grain refining, β-Mg17Al12 precipitation, dissolving-reprecipitation, and self-peeling. The Mg-6%Al-3%Zn-1.5%In alloy with the highest corrosion rate at free corrosion potential did not perform desirable discharge activity indicating that the barrier effect caused by the β-Mg17Al12 phase would have been enhanced under the conditions of anodic polarization. The Mg-6%Al-3%Zn-1.0%In alloy with a relative low corrosion rate and a high discharge activity is a promising anode material for both cathodic protection and chemical power source applications.

1. Introduction

Magnesium and its alloys are promising candidates for use in aerospace, vehicle, and electric products due to their high ratio of strength to weight, low density, and good castability [1,2,3]. Considerable investigations have been conducted to clarify the corrosion mechanism and to achieve desirable corrosion resistance by designing and developing alloys of high corrosion resistance, inhibitors, and coatings [4,5,6,7,8,9,10,11,12]. In addition, the desirable electrochemical properties of magnesium, including highly negative standard potential (−2.34 V vs. Standard Hydrogen Electrode (SHE)), high theoretical specific charge capacity (2.2 A·h/g), high theoretical energy density (3.8 A·h/cm3) [13] make it an ideal anode material for cathodic protection and power sources [14,15,16,17]. Some other particular features, such as low toxicity and the allowance for urban waste disposal in comparison to lithium, make magnesium an attractive candidate as a high-energy storage electrode in the battery field [18].
However, there are several inherent defects of magnesium as anode material. On the one hand, the magnesium surface is often covered with discharge product in the electrolyte, which hinders the further discharge process via the accumulation effect [19]. On the other hand, the high Faradic capacity of magnesium could not be thoroughly utilized for discharge due to the self-discharge activity accompanied by detachment of α-Mg grains during the discharge process [20]. The impurities and precipitates with relative positive potentials acting as cathodes also promote the dissolution of adjacent α-Mg grains, which result in a decrease of current efficiency [21]. Some approaches for promoting the discharge activity have been developed including plastic deformation, heat treatment, and alloying [22,23]. Alloying via adding other elements (such as Al, Zn, Mn, In, Ga, Hg, Ce, Y, etc.) into the Mg substrate is a promising way to promote self-peeling and minimize self-discharge [24,25,26,27,28].
AZ63 alloy is one of the most popular magnesium alloys in structural and power source applications due to its desirable mechanical and electrochemical characteristics [29,30]. As anode material, AZ63 alloy is mainly used in cathodic protection and long-term, low-power chemical power sources [22]. Indium is a popular alloying element for activation of anode materials. As reported, the 1–3 wt% constituent of indium in aluminum matrix activates the alloy significantly in natural seawater [31]. Wang [32] and Jin [2] suggested that the indium in AP65 magnesium alloy promotes electrochemical properties through decreasing the area ratio of cathode to anode. However, few works have been conducted on the influence of indium on the electrochemical behavior of AZ series magnesium alloys. In this work, the corrosion and discharge behavior of AZ63 alloys with different indium concentrations (0%, 1%, 1.5%, and 2%) were investigated to clarify the mechanism of indium on activation of AZ magnesium alloys and to find a proper anodic material with negative discharge potential, short incubation time, low self-discharge, and high current efficiency in different conditions.

2. Materials and Methods

2.1. Materials

The alloys used in this work were prepared by adding Mg, Al, Zn, Mg-30 wt% Mn, and In ingots into a graphite crucible in a resistance furnace at 760 °C. The melt covered with sulfur powder was stirred for about 5 min, held for 10 min to guarantee homogenization, and then cast into a steel model preheated to 200 °C with a dimension of Φ 300 mm × 50 mm. The actual chemical compositions of the alloys were analyzed by inductively coupled plasma mass spectrometry (ICP-MS, Agilent, California, CA, USA) and the corresponding contents are listed in Table 1. For simplicity, the indium containing alloys are denoted as AZI in this work, which is convenient to compare with the AZ63 alloy in the discussion. For example, AZ63 + 2 wt% In alloy can be abbreviated as AZI2.0.

2.2. Microstructure Characterization

For metallographic observation, the cast alloys were cut into cube-like coupons (10 × 10 × 10 mm), ground from 400 grit to 3000 grit successively, polished by diamond grinding paste, cleaned with ethanol, wiped with 2.5 wt% nital alcohol solution and blow-dried with cool air.
The surface morphology of the alloys and corroded samples were examined using a JSF-6700F scanning electron microscope (SEM) (JSM, Tokyo, Japan) equipped with energy dispersive X-ray spectroscopy (EDS) (Oxford instrument, Oxford, UK). The phases of substrate and corrosion products of the alloys were analyzed by X-ray diffraction (XRD; D/Max 2550, Rigaku, Tokyo, Japan) using Cu Kα radiation.

2.3. Hydrogen Collection

This is a common method to evaluate the corrosion rate via the volume of hydrogen evolved due to hydrogen evolution being the dominant reaction of the cathode [16,33,34]. The samples (50 × 10 × 3 mm) located within an upturned filter funnel, which channels the evolving hydrogen into an upturned burette, were ground to 1200 grit and sealed by electrical tape leaving 5 cm2 exposed in 2000 mL 3.5 wt% NaCl over 24 h.

2.4. Electrochemical Measurements

Samples for electrochemical tests were encapsulated in epoxy resin leaving an exposed surface of 10 × 10 mm, ground successively to 1200 grit with SiC paper, degreased by alcohol, washed with distilled water, and cooled by cold air. The prepared samples were stored in a desiccator prior to the electrochemical tests to ensure a uniform surface condition.
The electrochemical tests were conducted by an electrochemical workstation (GAMRY Reference 3000, Pennsylvania, PA, USA) in a three-electrode configuration (a platinum foil as counter electrode, a saturated calomel electrode as reference electrode, and a working electrode) containing 450 mL 3.5 wt% NaCl. The potentiodynamic polarization was carried out towards the noble value at a scan rate of 0.333 mV/s after a steady state of corrosion potential had been established. The electrochemical impedance spectroscopy (EIS) tests at free corrosion potential were conducted after 1 h monitoring of open circuit potentials (OCP) in solution. The AC amplitude of the perturbing signal was 5 mV with a frequency range from 100 kHz to 10 mHz.
Three samples in the as-cast state were adopted for hydrogen evolution and electrochemical tests at 25 ± 1 °C in this work. All the potential values mentioned were versus a saturated calomel electrode (SCE). Measurements mentioned above were performed at least three times to ensure reproducibility.

3. Results and Discussion
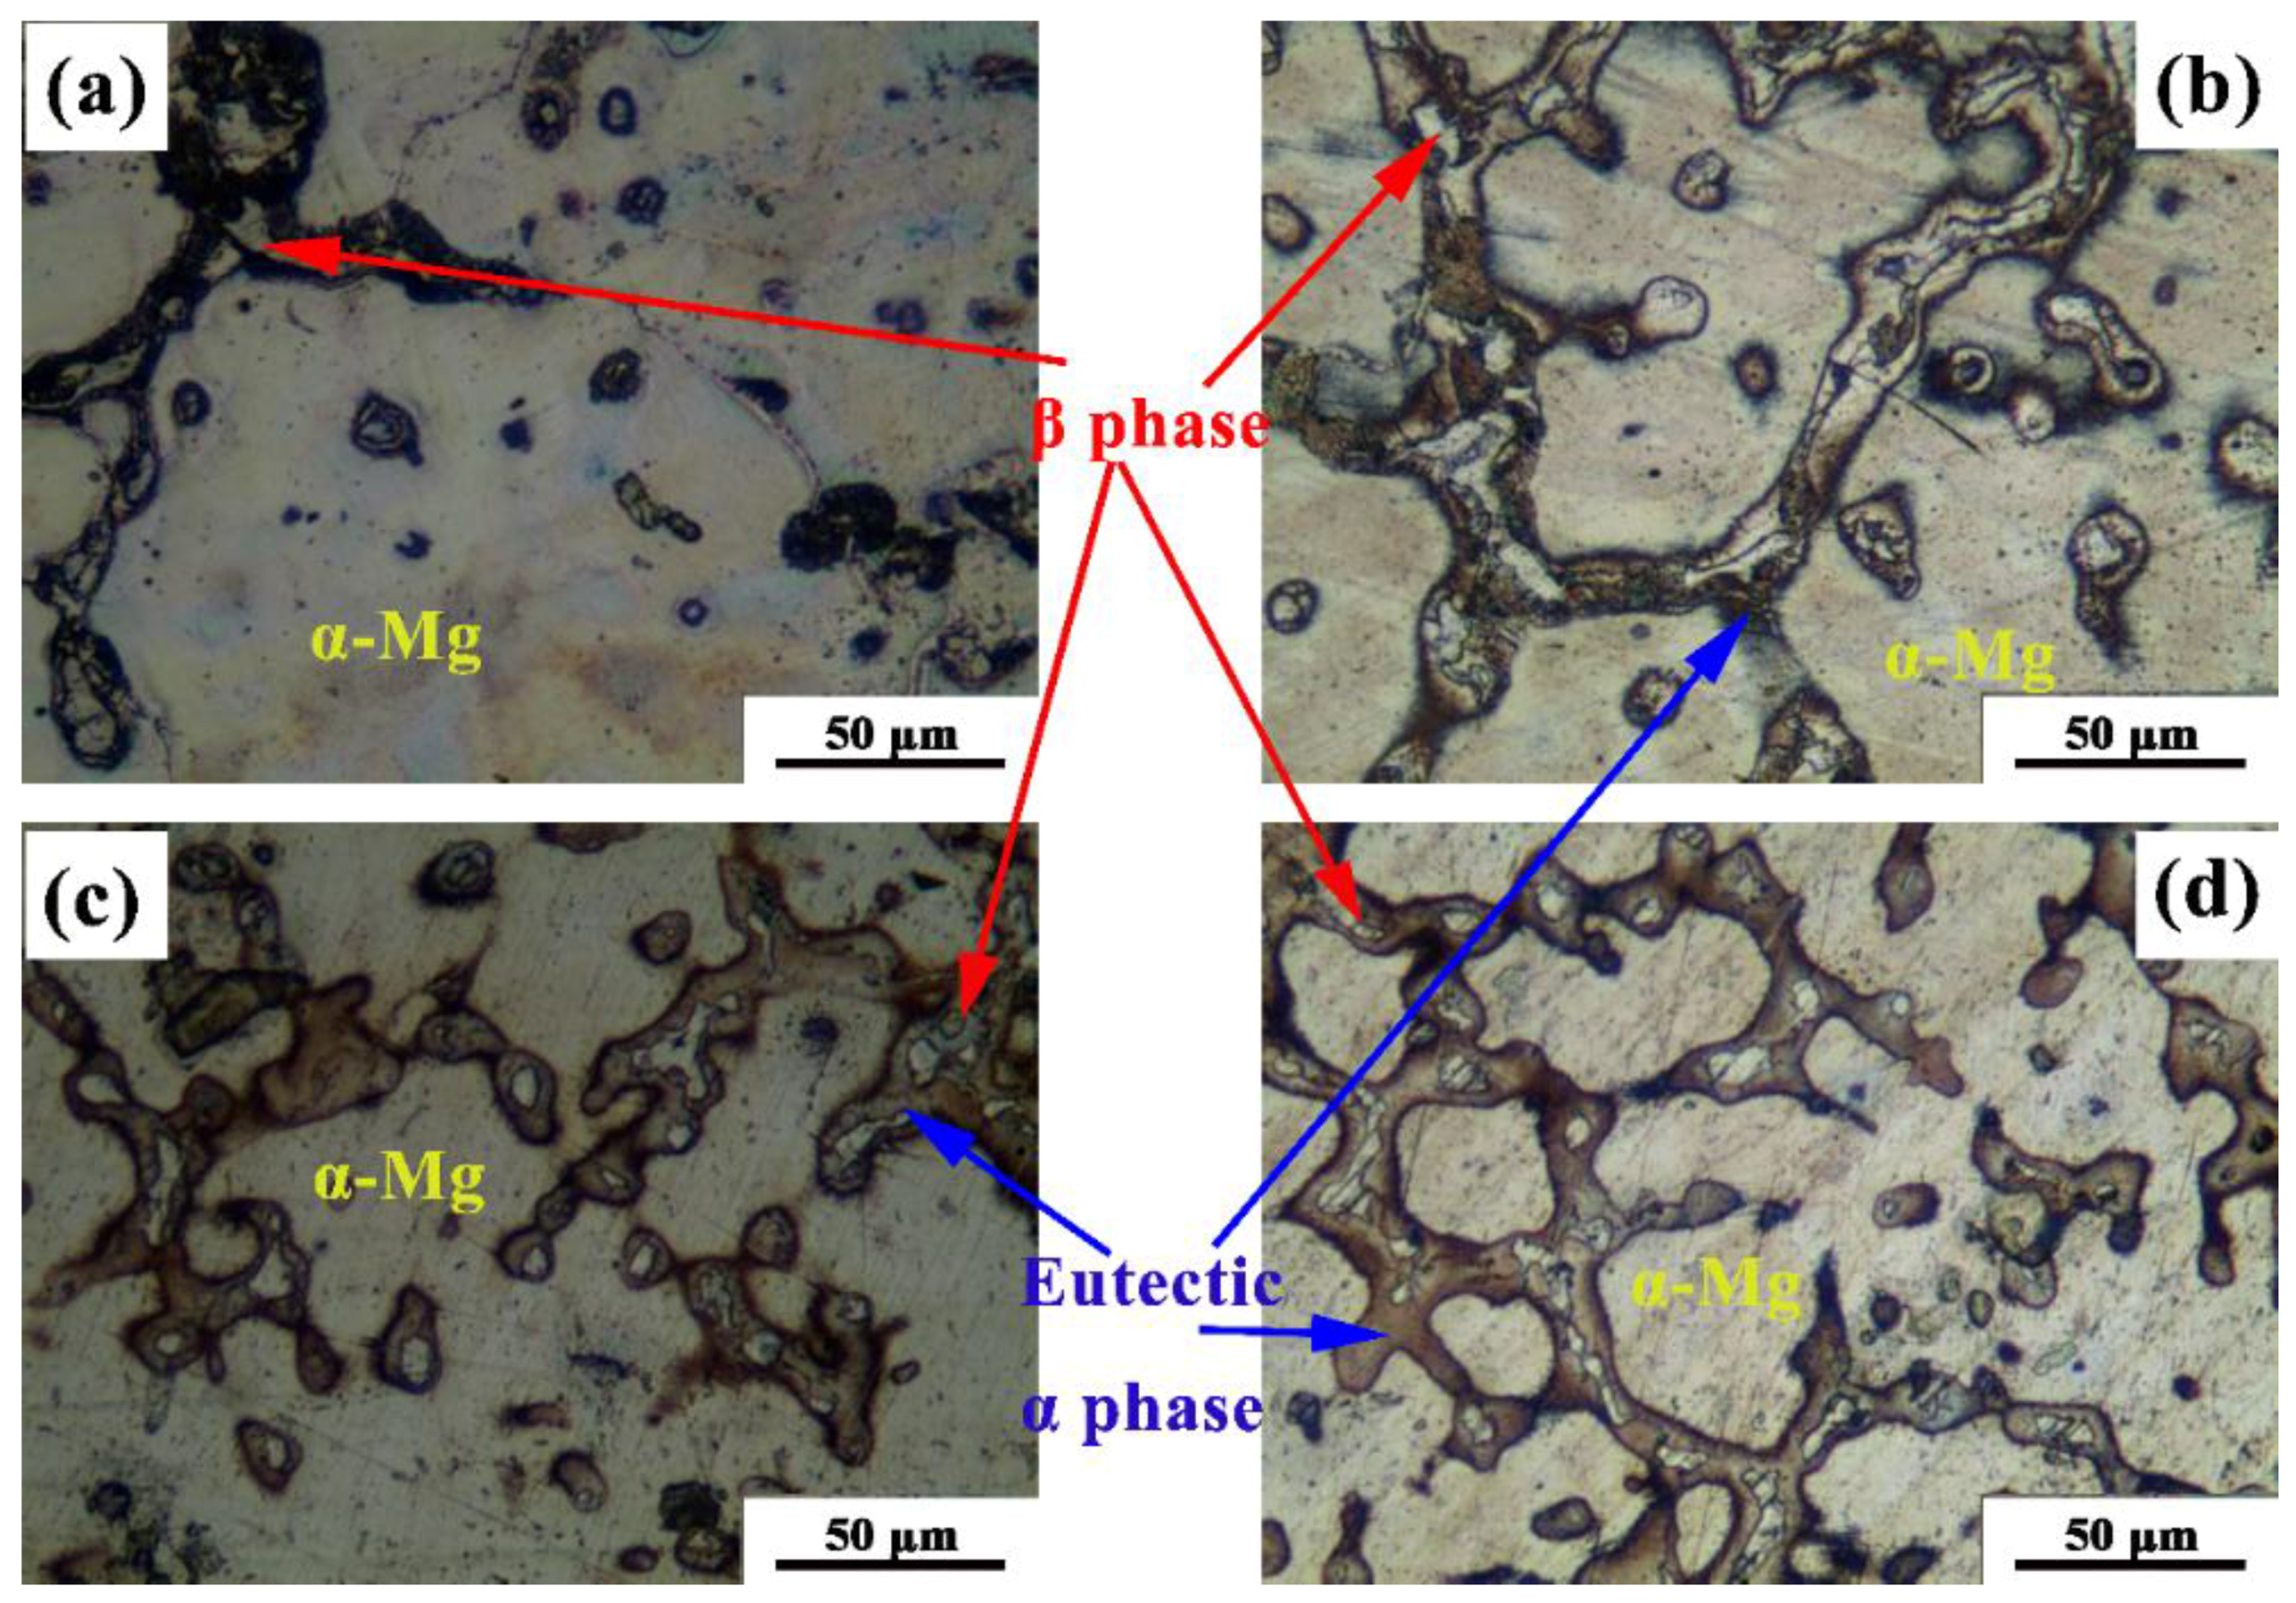
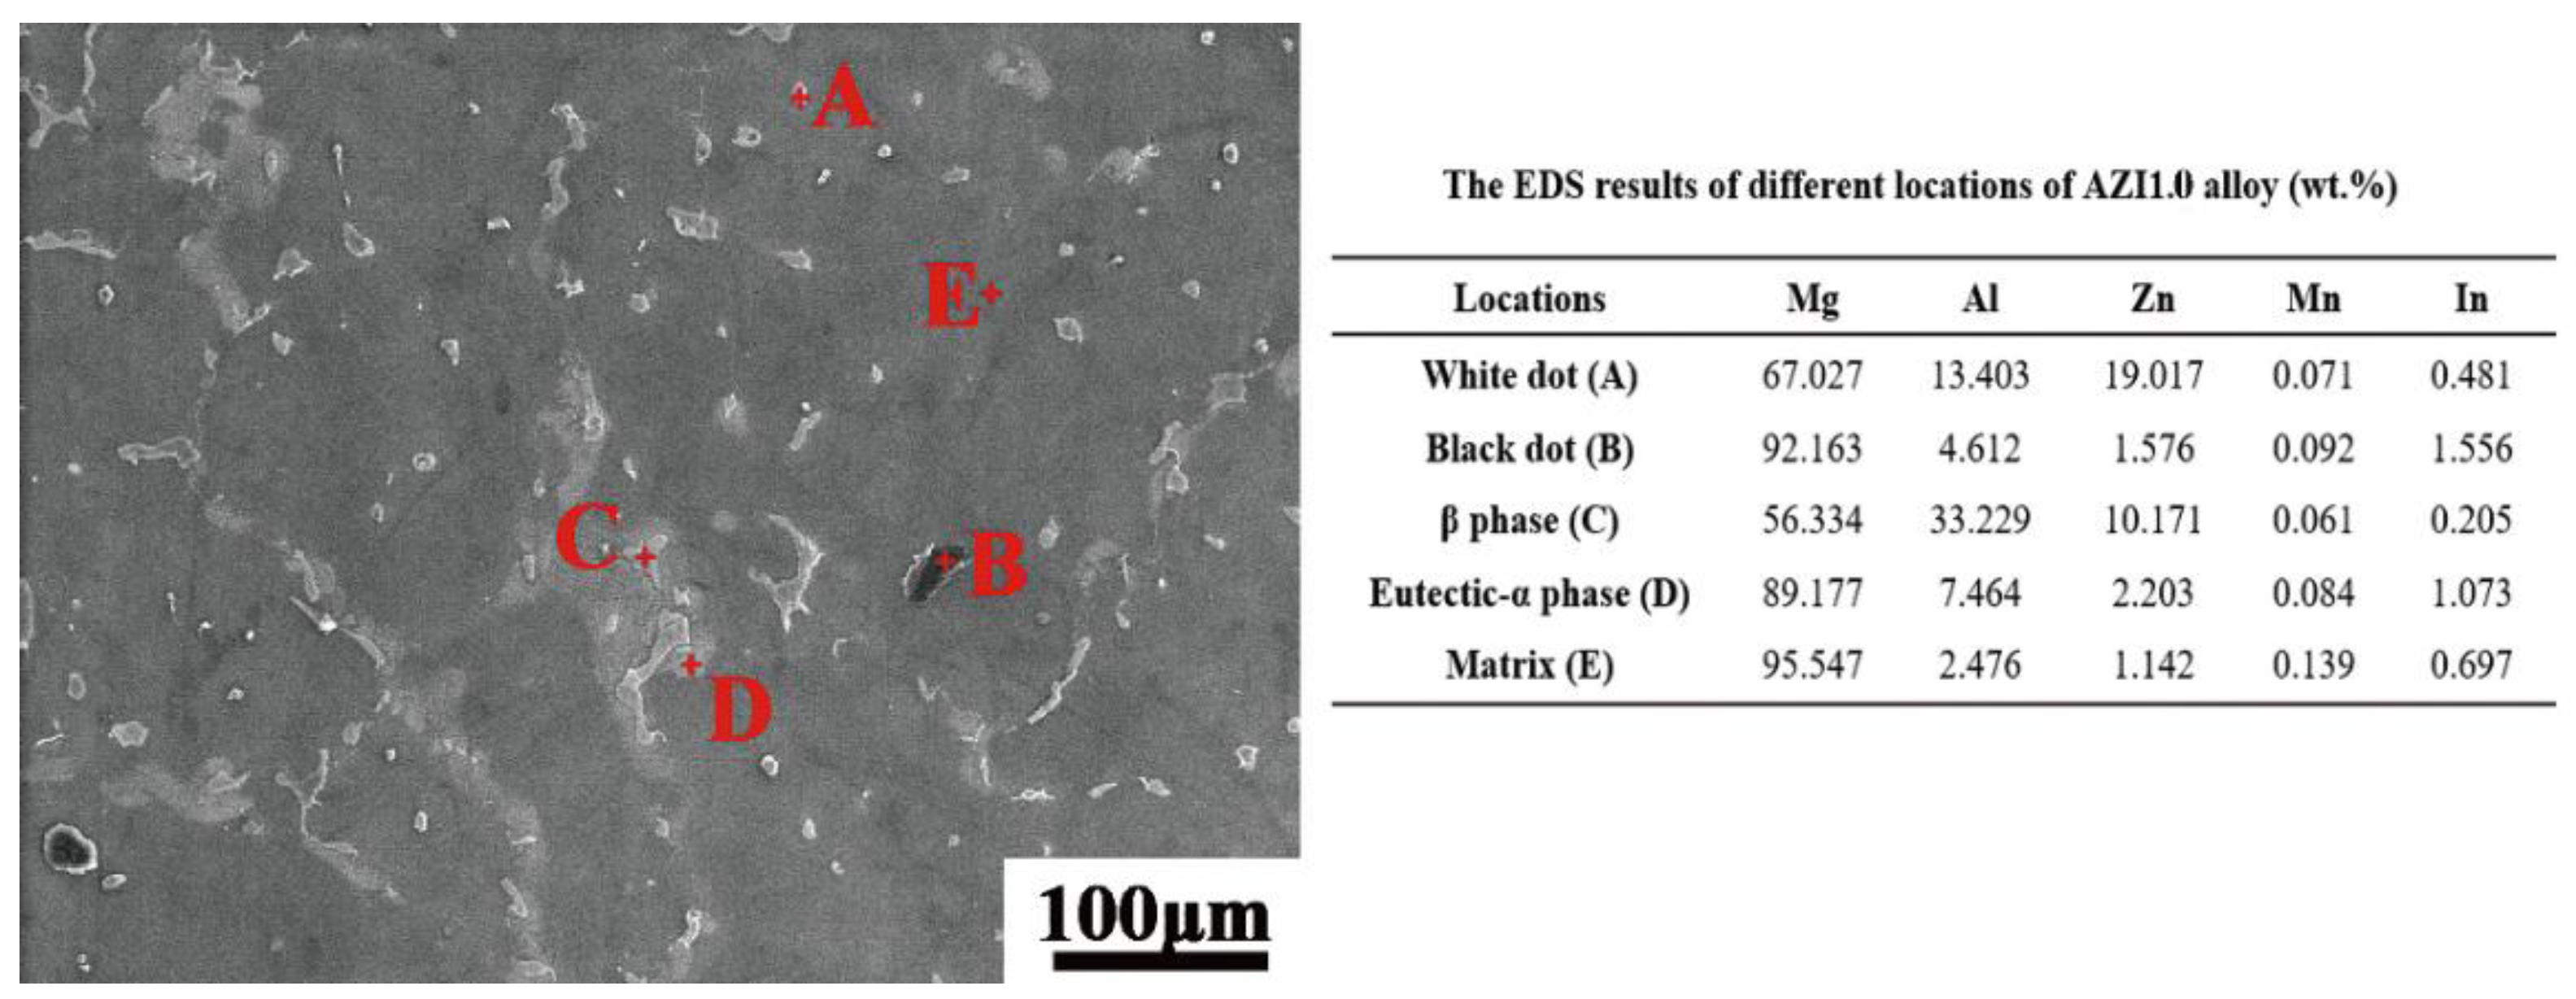
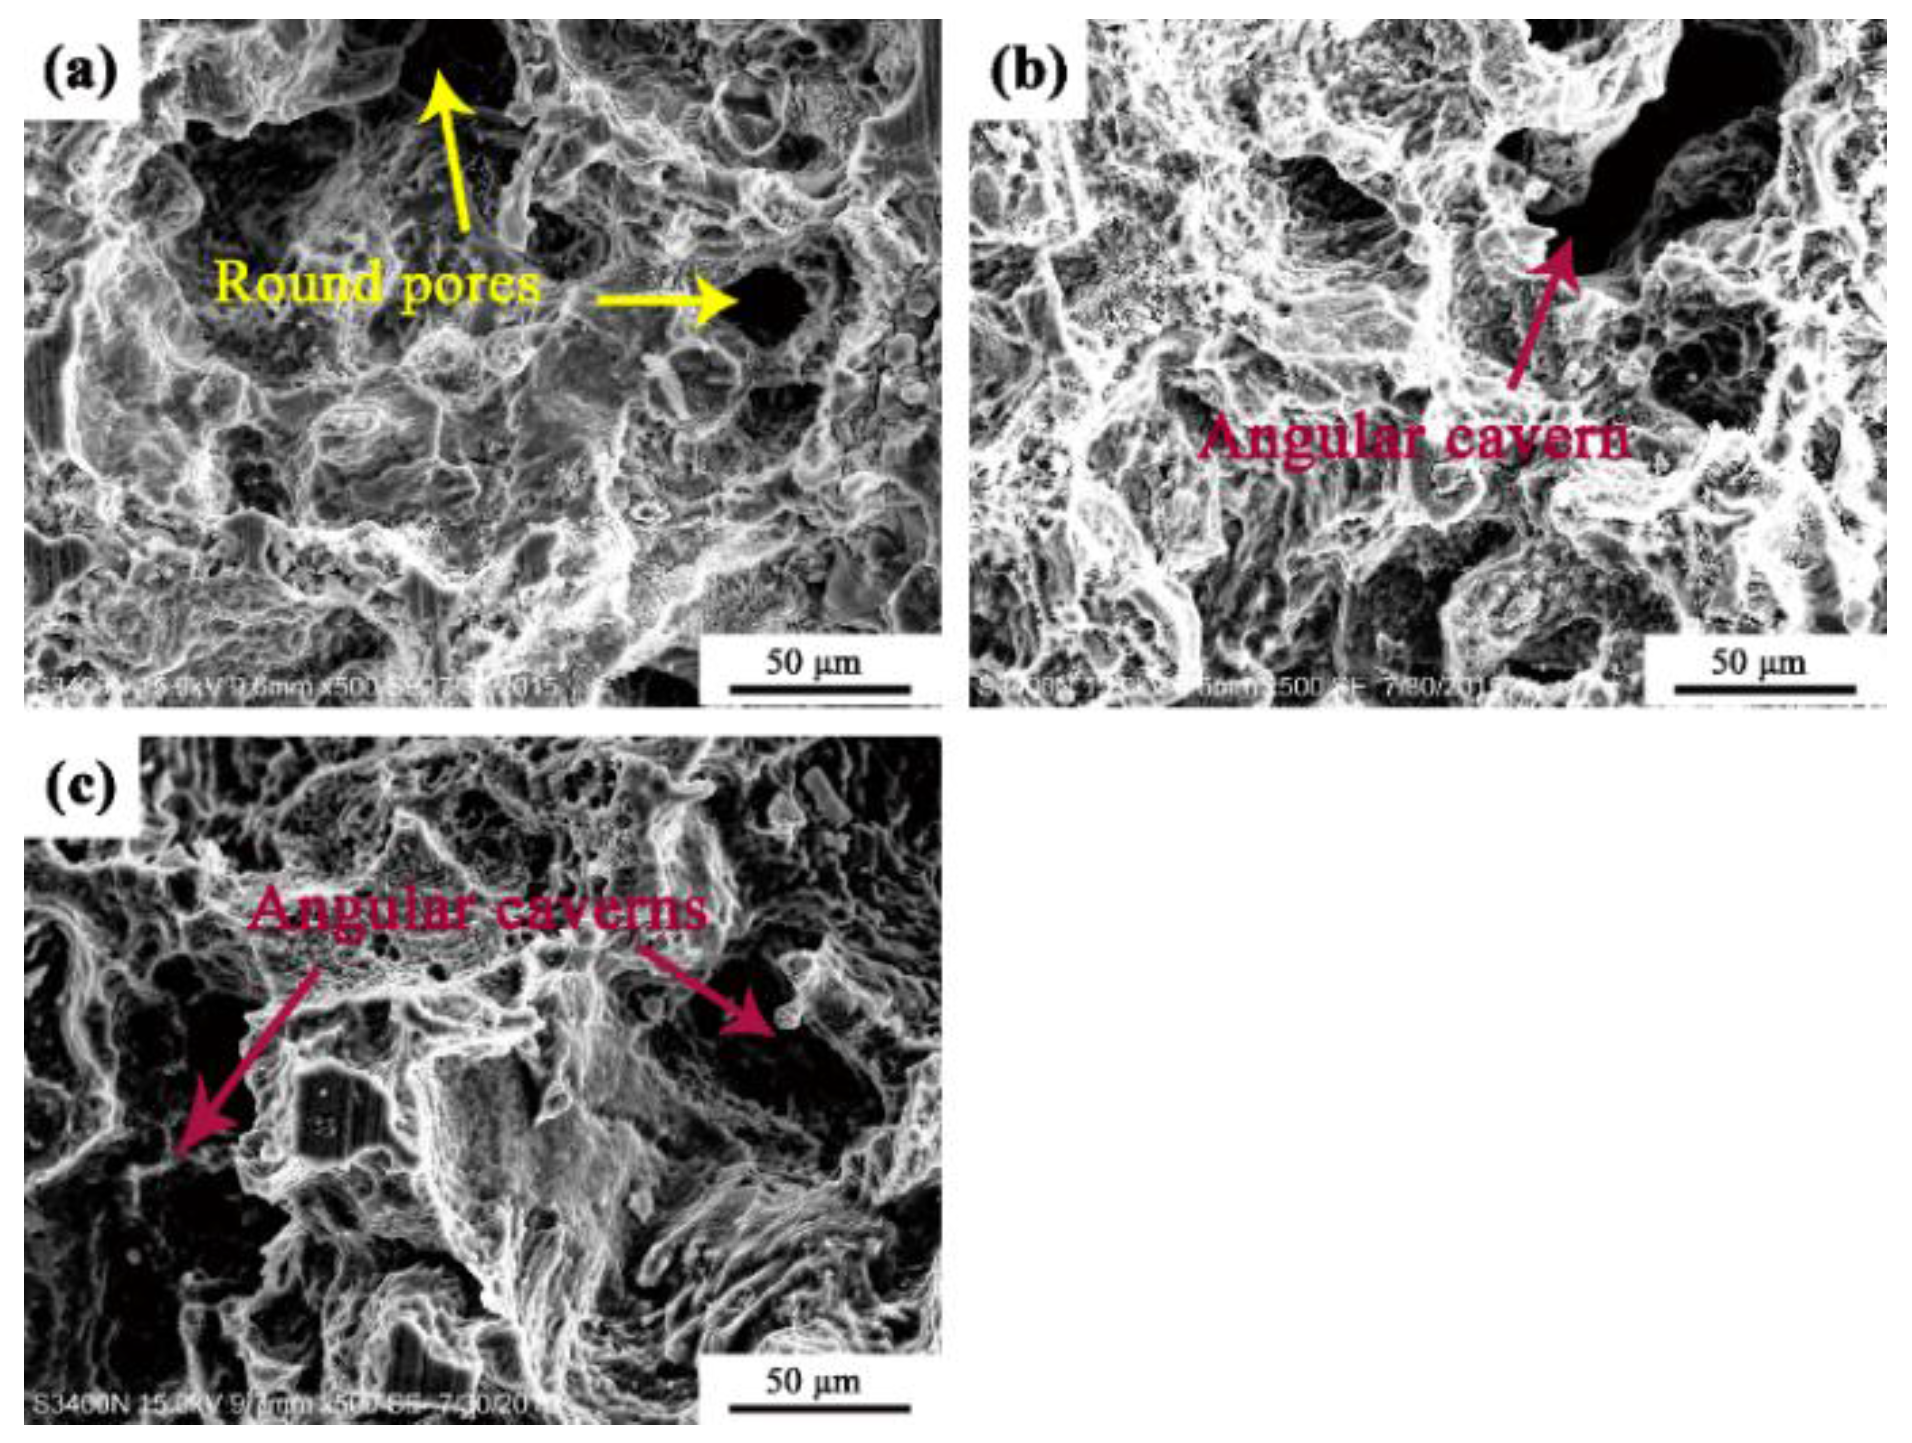
3.1. Microstructure

Figure 1 shows the XRD patterns of AZ63 and AZI alloys. The patterns indicate that AZ63 and AZI alloys mainly consist of α-Mg and β-Mg17Al12 phases. There is no zinc-containing peak detectable owing to its high solid solubility in Mg substrate. Indium related peaks not being detected is probably due to its low concentration in the substrate, which is consistent with the result reported in Wang’s work [2,32].
Figure 2 illustrates the microstructure of AZ63 and AZI alloys, which exhibit similar morphologies consisting of α-Mg surrounded with eutectic α and discontinuous β-Mg17Al12 phases along the grain boundaries. It is apparent that the α-Mg is refined and the amount of precipitate increases with the increase of indium content in the Mg substrate, which is probably due to the relative low solubility of indium in the aluminum enriched phase. This is in good agreement with Becerra’s previous work of adding indium into pure magnesium [35]. The increase of indium refines grains by promoting the precipitation of the β-Mg17Al12 phase in the α-Mg grains, resulting in a continuous distribution of precipitates in a net structure form.
An SEM image of AZI1.0 alloy and the EDS results of different locations are presented in Figure 3. The microstructure of AZI1.0 alloy consists of α-Mg, precipitates in α-Mg and on grain boundaries. The black dot (location B) locates in α-Mg and the eutectic α-Mg phase (location D) contain a higher content of indium and lower content of aluminum and zinc on comparing with the results of β-Mg17Al12 (location C) and white dot (location A). The substrate (location E) has a lower concentration of aluminum, zinc, and indium than the nominal composition of Al 6 wt%, Zn 3 wt% and In 1.0 wt% owing to the segregation effect. Therefore, it can be deduced that the indium favors segregation from the Mg substrate and separate precipitation in α-Mg or in the eutectic α phase. The poor solubility of indium in aluminum and zinc promotes the grain refinement via the segregation process, which provides an interpretation of the phenomenon shown in Figure 2.

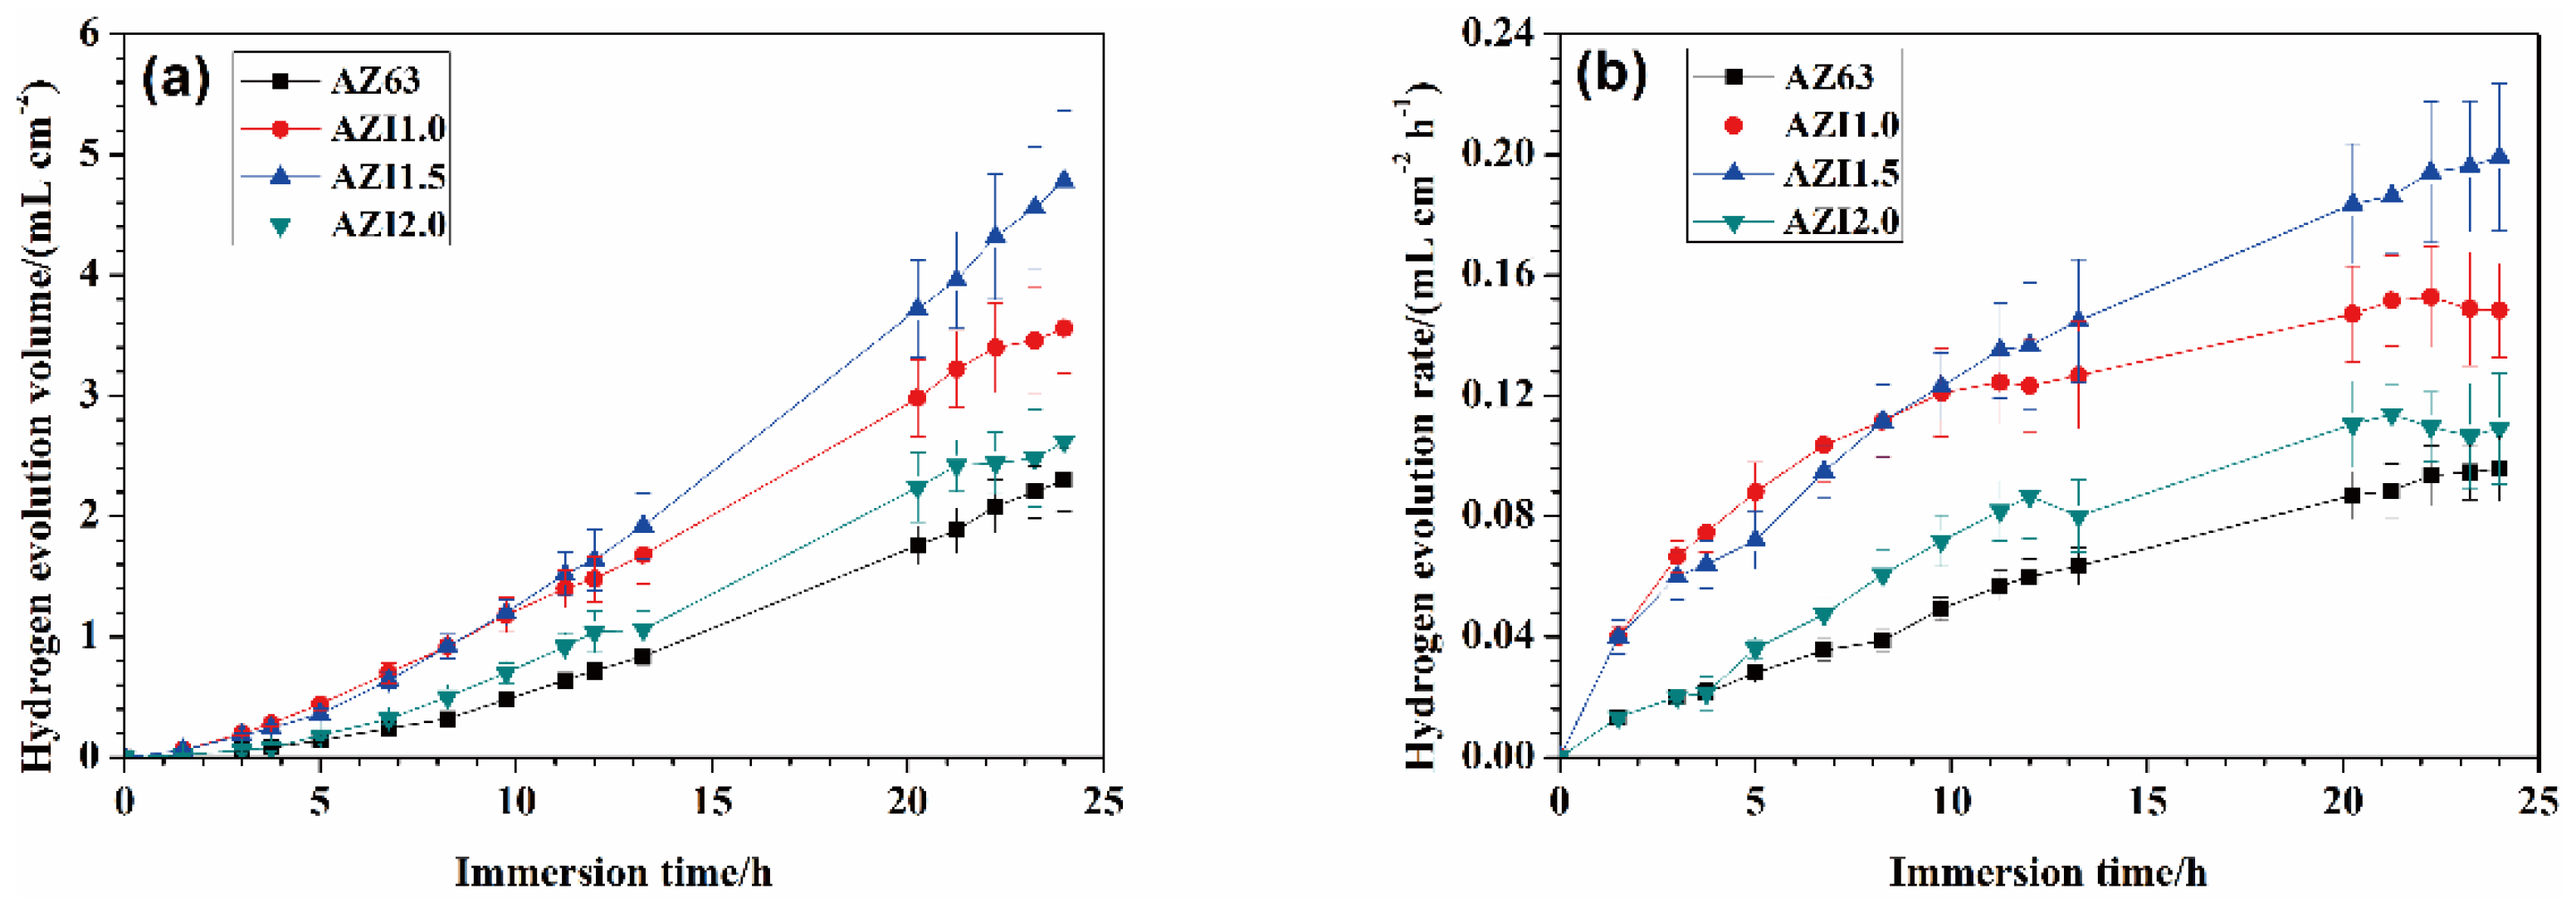
3.2. Hydrogen Collection

Hydrogen collection is more convenient than weight-loss measurement in studying the corrosion rate dependence on time due to hydrogen evolution rather than reduction of oxygen being the dominant cathodic reaction [36]. The variation of hydrogen volume over a given period can be employed in calculating the average corrosion rate in situ [37]. Figure 4 illustrates the hydrogen evolution volume and rate with immersion time over a 24 h period. The corrosion rate of the AZ63 and AZI alloys can be ranked as AZ63 < AZI2.0 < AZI1.0 < AZI1.5. The indium addition promotes the corrosion rate of the alloys; this being probably due to the increasing amount of precipitates both in α-Mg and on the grain boundaries (see Figure 2), which act as the cathode in forming a micro-cell with α-Mg during the corrosion. The presence of β-Mg17Al12 phase in Mg-Al alloys has two influences on their corrosion behavior, a galvanic cathode for promoting the corrosion and a barrier for inhibiting the corrosion [38]. The corrosion rate of AZI2.0 alloy is not consistent with the increasing tendency of the corrosion rate mentioned above and could be attributed to the barrier effect aroused by the continuous net structure of the β-Mg17Al12 phase on the grain boundaries as shown in Figure 2d, which decreases the corrosion rate by the barrier effect. This result is also consistent with Liu’s work [39], which suggested that the barrier effect would perform effectively once the β phase was distributed continuously around the α-Mg substrate.

3.3. Open Circuit Potential

Open circuit potential (OCP) variation can provide some information about the initiation and propogation of corrosion [40]. Relatively stable OCP values imply an electrochemical steady state on the electrode surface. The OCP curves of AZ63 and AZI alloys are shown in Figure 5.
As shown in Figure 5, the OCP values can be ranked as AZI1.5 < AZI 2.0 <AZI1.0 < AZ63. The indium addition into AZ63 alloy shifts the OCP towards the negative direction apparently, indicating an enhanced driving force of corrosion via alloying. The incubation period, representing the interval from the beginning of immersion to the OCP values obtaining steady values, characterizes the activity of the alloy samples. The OCP values of AZI alloys get steady values over a short period (less than 1000 s) as shown in Figure 5, implying a short activation characteristic aroused by indium and a promoted active dissolution of the alloys. The OCP curve of AZ63 alloy exhibits fluctuation characteristics throughout the test, which could be attributable to the dynamic unsteadiness between the advance of the corrosion and the deposit of corrosion products, implying an unestablished steady state due to its poor activity in comparison with AZI alloys.
The activating mechanism of indium serving as an alloying element for the sacrificial anode has been widely investigated. The dissolving-reprecipitation mechanism is widely accepted in interpreting the activation effect of indium during the corrosion process [41]. It can be expressed by Equations (1) and (2):
M ( I n ) M n + + I n 3 + + ( n + 3 ) e
M + I n 3 + M n + + I n + ( n 3 ) e
The indium exists in solid solution and in segregation states in the substrate, whereas the indium in the segregation state does not participate in the activation process. As shown in Equations (1) and (2), the indium atom in the solid solution state converts to an ion accompanied by the loss of three electrons. The dissolved indium ion precipitates back to the surface of the electrode and then reacts with the magnesium atom. The dissolving-reprecipitation process would promote the dissolution of magnesium due to this providing an extra reaction compared with the alloy without indium.

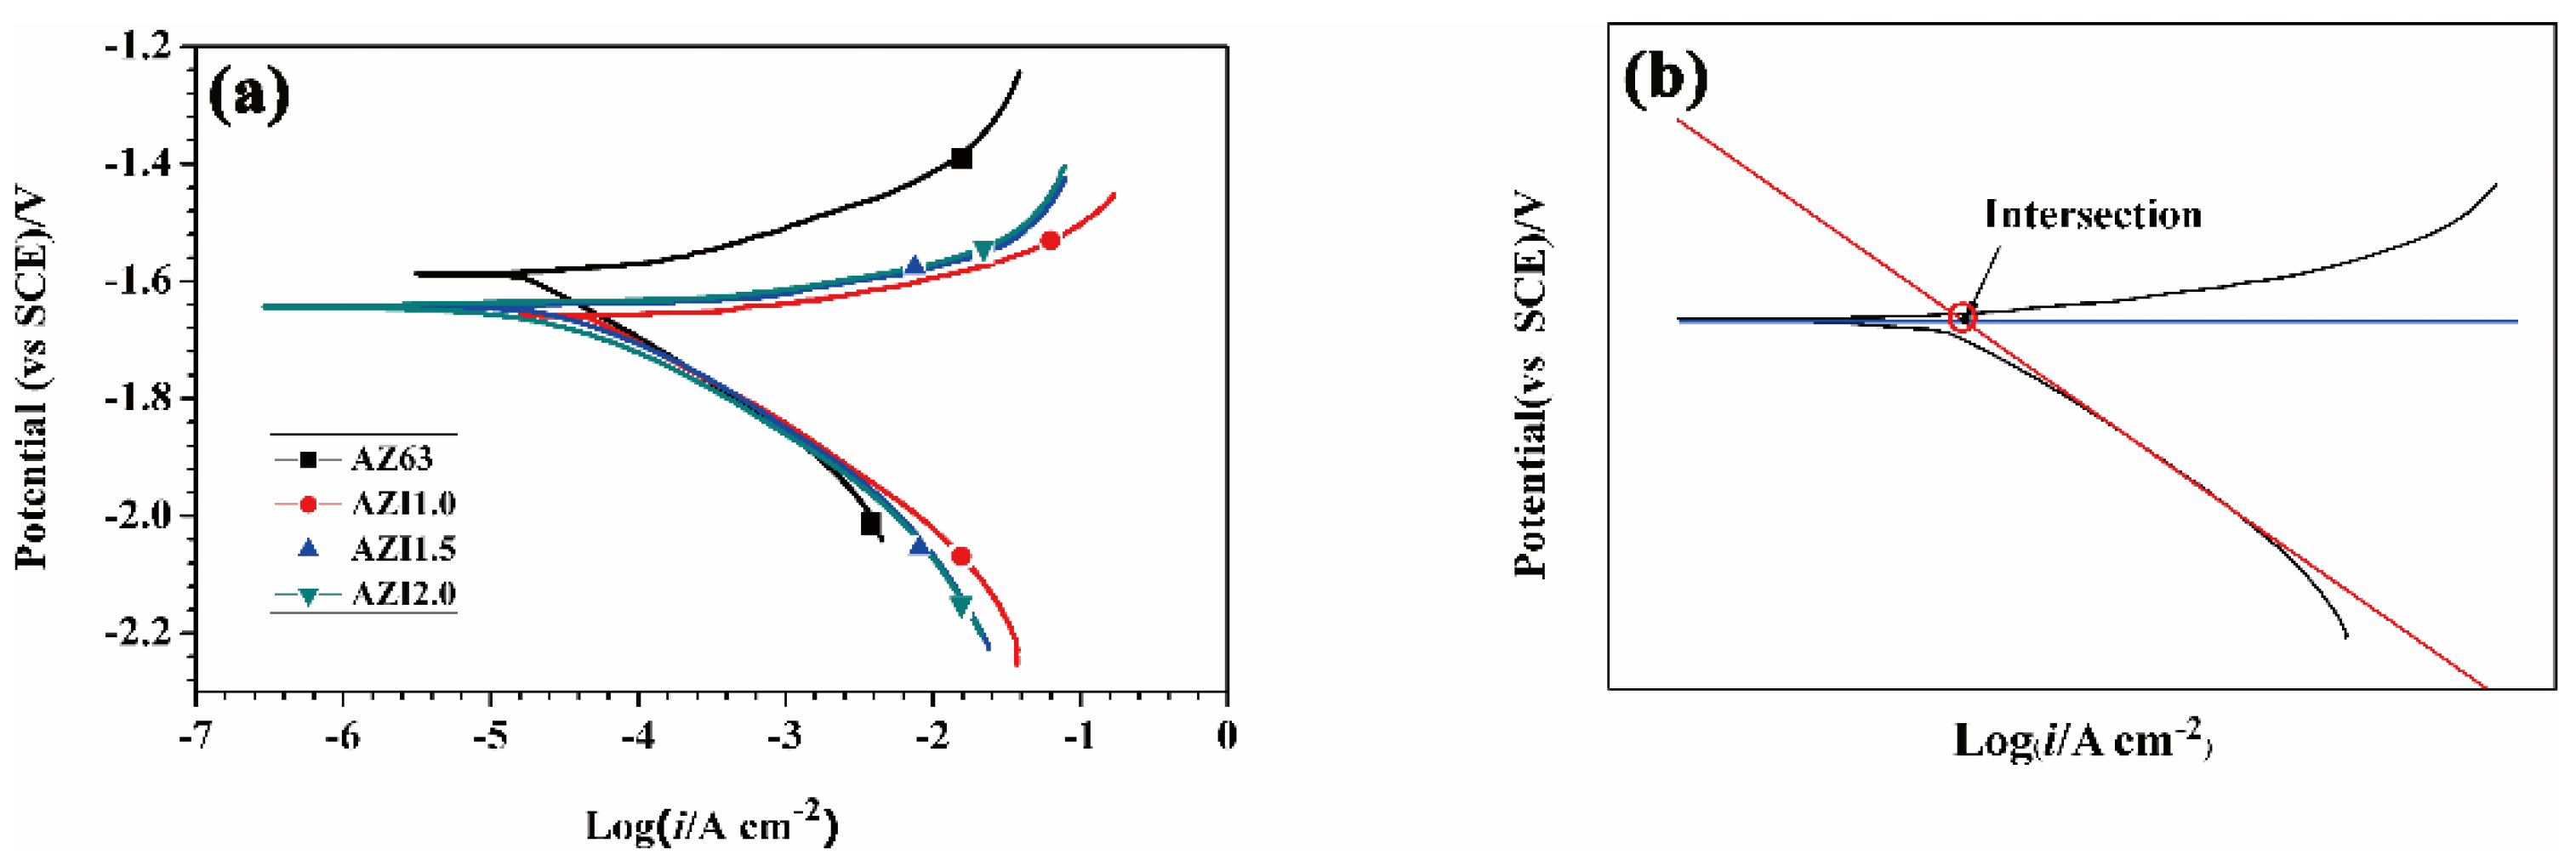
3.4. Potentiodynamic Polarization

The polarization curves presented in Figure 6a indicate similar polarization behavior among the investigated alloys in 3.5 wt% NaCl at 25 ± 1 °C. The anodic currents increase exponentially with anodic polarization indicating high activity of the investigated alloys. Thus, the cathodic reaction of hydrogen evolution dominates the electrochemical reaction at the larger slopes of the cathodic polarization branches, compared with those of the anodic branches as shown in Figure 6a. The Tafel extrapolation could be carried out as illustrated in Figure 6b, and is due to the absence of Tafel region in the anodic branch of the polarization curve; the anodic reaction may be complicated due to the effect of negative difference effect (NDE) [42]. The extrapolated parameters are listed in Table 2.
It is obvious that indium affects the cathodic process (hydrogen evolution) slightly but favors anodic dissolution (oxidation of magnesium), seen by analyzing the slope values of bc and ba in Table 2 [32]. The free corrosion potential shifts 40–80 mV negatively on comparing AZ63 with AZI alloys, implying an increasing corrosion tendency, which is consistent with the OCP results mentioned above. The extrapolated corrosion current densities of the alloys, which can be ranked as AZI 1.5 > AZI2.0 > AZI1.0 > AZ63, are shown in Table 2. The corrosion rate of AZI alloys increases with increasing indium (less than 1.5 wt%) in the substrate, this result is also consistent with the hydrogen evolution test.

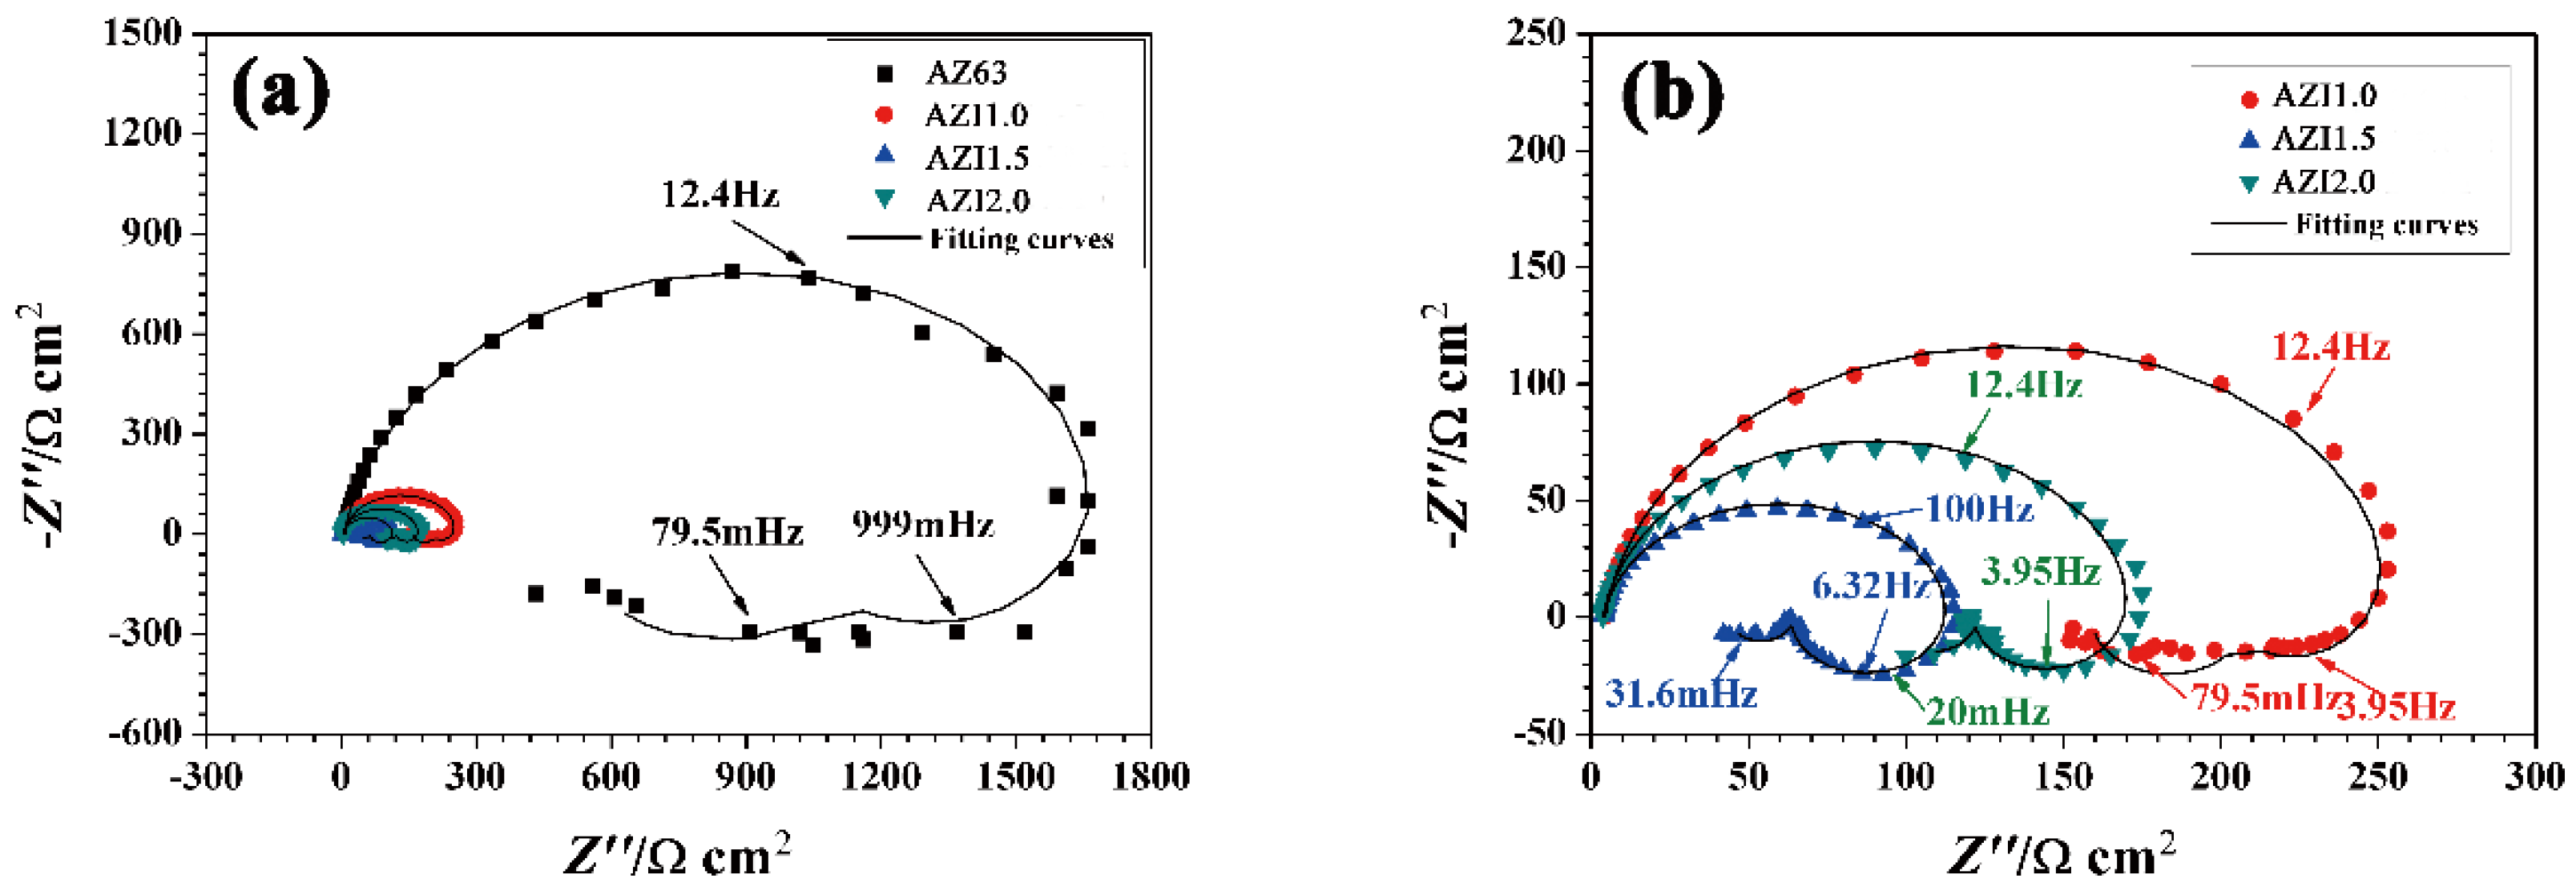
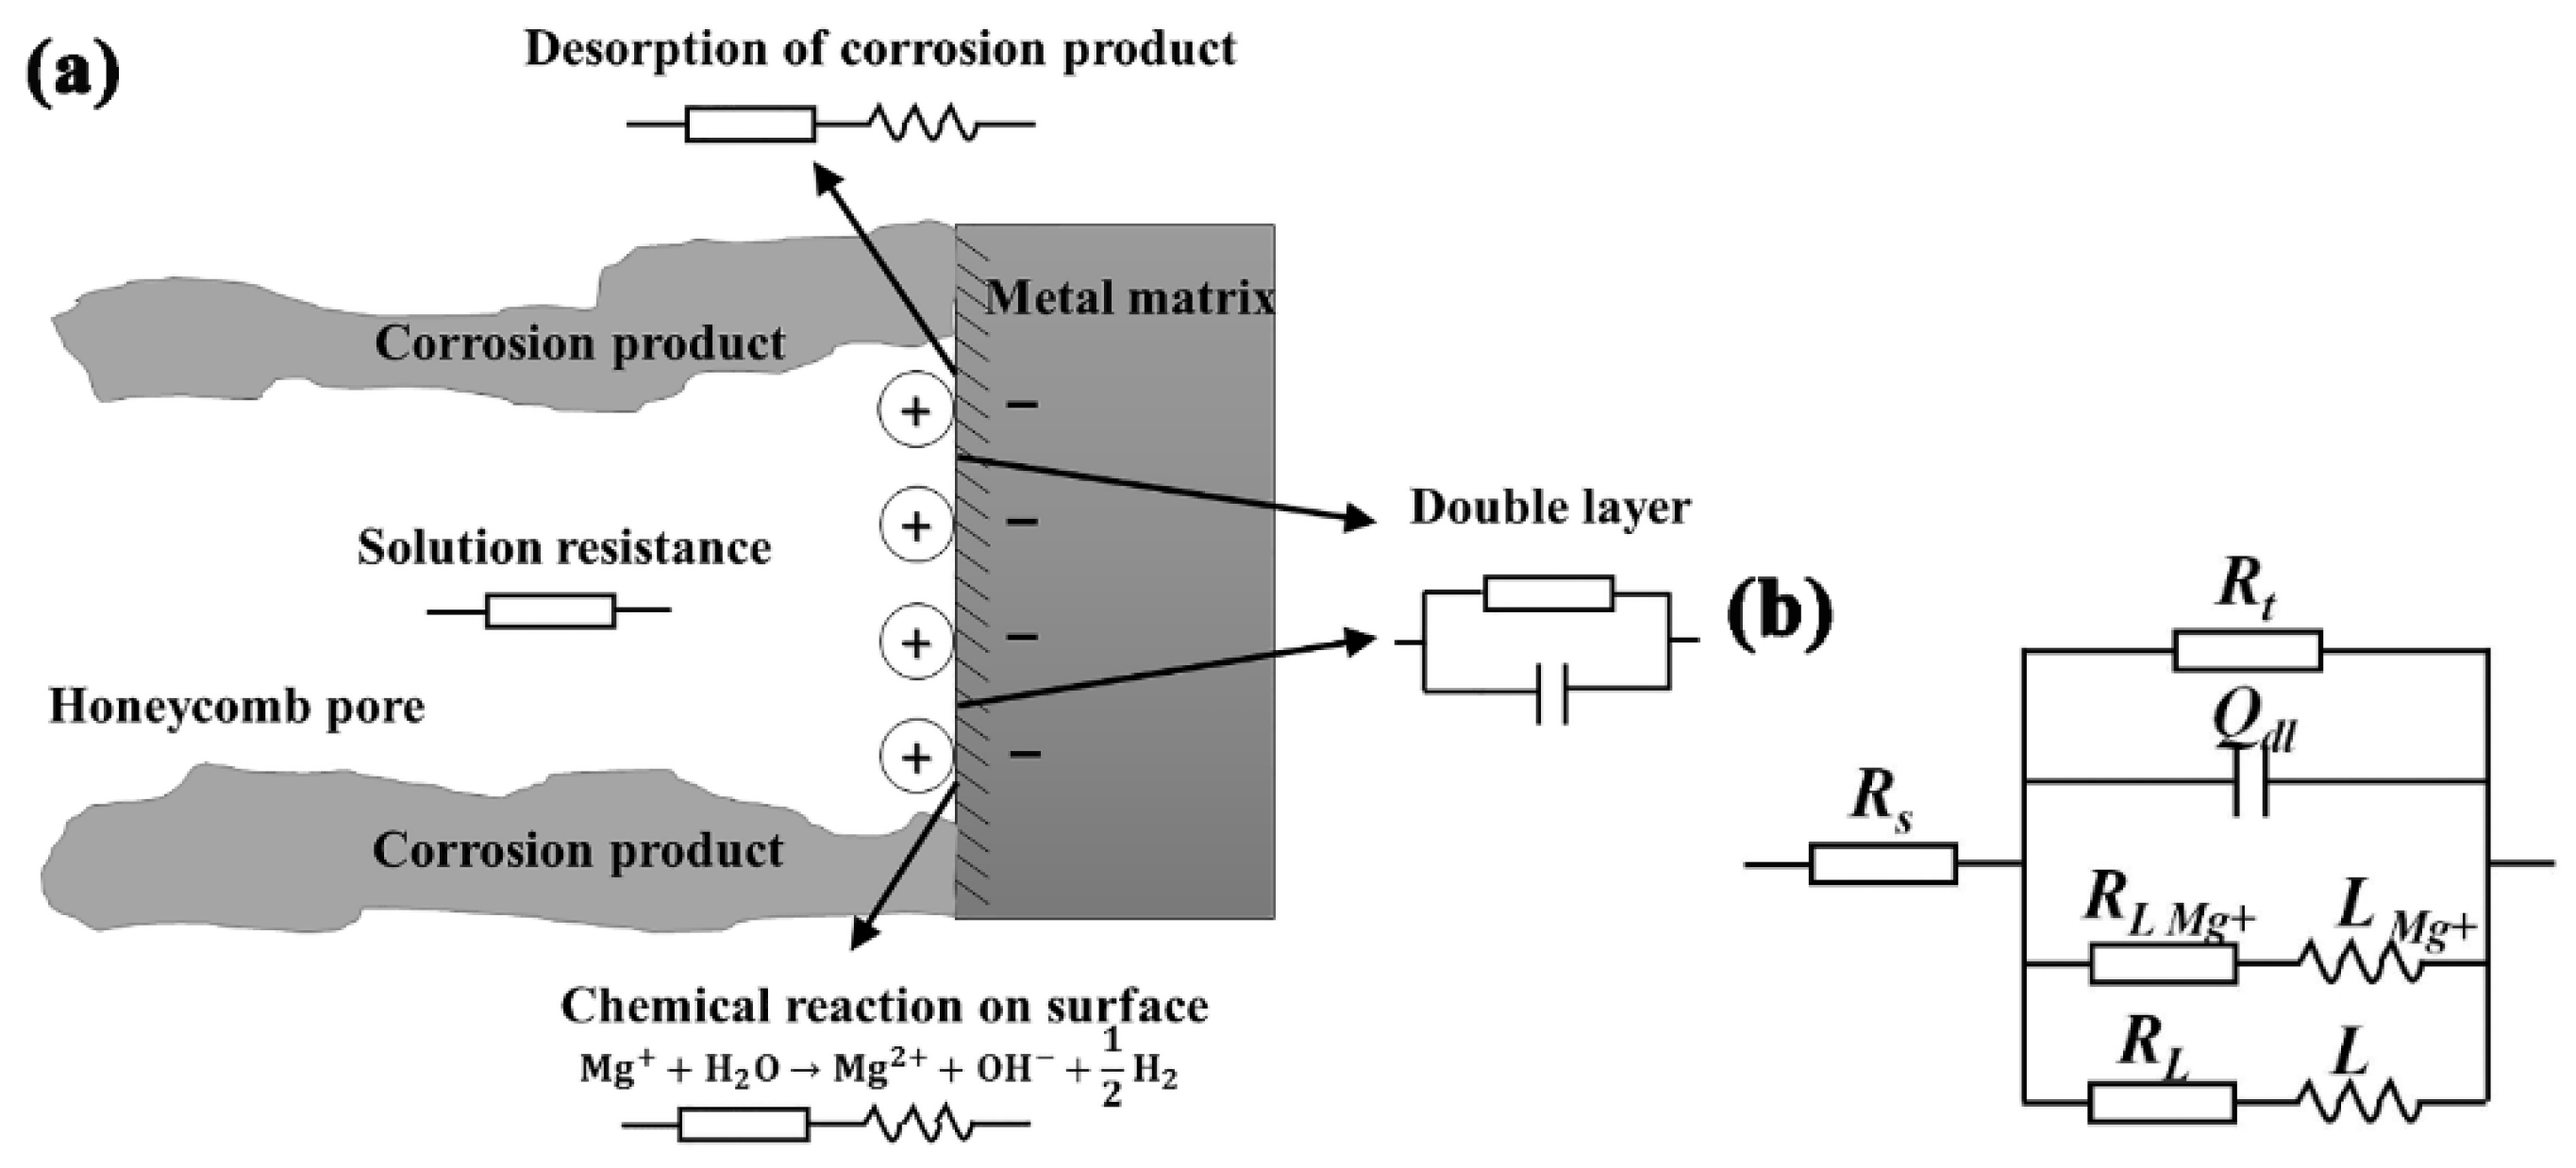
3.5. Electrochemical Impedance Spectroscopy (EIS)

The EIS spectra of AZ63 and AZI alloys obtained at open circuit potentials after 3600 s immersion are shown in Figure 7. The Nyquist diagrams of the investigated alloys are comprised of one capacitive loop at high frequency and two inductive loops at intermediate and low frequencies. The capacitive loop is related to the property of the electric double layer at the electrode/electrolyte interface [43]. Two inductive loops in the fourth quadrant are due to the chemical reaction of Mg+ with H2O on the breaking area of the corrosion products film and the desorption of corrosion products respectively [44,45].
Since the EIS plots reveal the physical and chemical dynamic processes via the analysis of spectra, a circuit model can be founded to simulate the practical variations on the electrode surface. The electronic components connected in series or in parallel in circuit should correspond to the specific dynamic processes. The dissolving surface model for describing the dynamic processes within the porous corrosion products and the equivalent circuit for fitting the EIS data are shown in Figure 8.
In Figure 8a, each of the physical/chemical reactions are endowed with equivalent components in series or in parallel connection. The fitting curves, using the equivalent circuit in Figure 8b, are presented in Figure 7. In Figure 8b, Rs is the solution resistance, Rt and Qdl are the charge transfer resistance and the constant phase element (CPE) of the electric double layer, Qdl is used to substitute the capacitor of the electric double layer on consideration of the deviation effect [46]. As illustrated in Figure 8a, the chemical reaction of Mg+ can be equivalent to RLMg+ and LMg+ in series connection [44,45], and then the desorption of corrosion products can be equivalent to RL and L in series connection [1,47]. The parallel connection of the components shown in Figure 8b is due to these physical/chemical processes taking place on the surface simultaneously.
The polarization resistance (Rp), relating to the activity of the investigated sample [48], is inversely proportional to the corrosion rate [44,49]. According to the equivalent circuit, the expression of Rp can be written as:
R p = R t R L R L M g + R t R L + R L R L M g + + R t R L M g +
Table 3 lists the calculated electrochemical parameters of AZ63 and AZI alloys obtained by fitting the Nyquist plots. Both the polarization resistance Rp and charge transfer resistance Rt can be ranked as Rp,t (AZ63) > Rp,t (AZI1.0) > Rp,t (AZI2.0) > Rp,t (AZI1.5), indicating an active effect of indium in AZ63 alloy, which is consistent with previous findings. In general, the activity of the investigated alloys increases with increasing indium in the Mg substrate (less than 1.5 wt%).

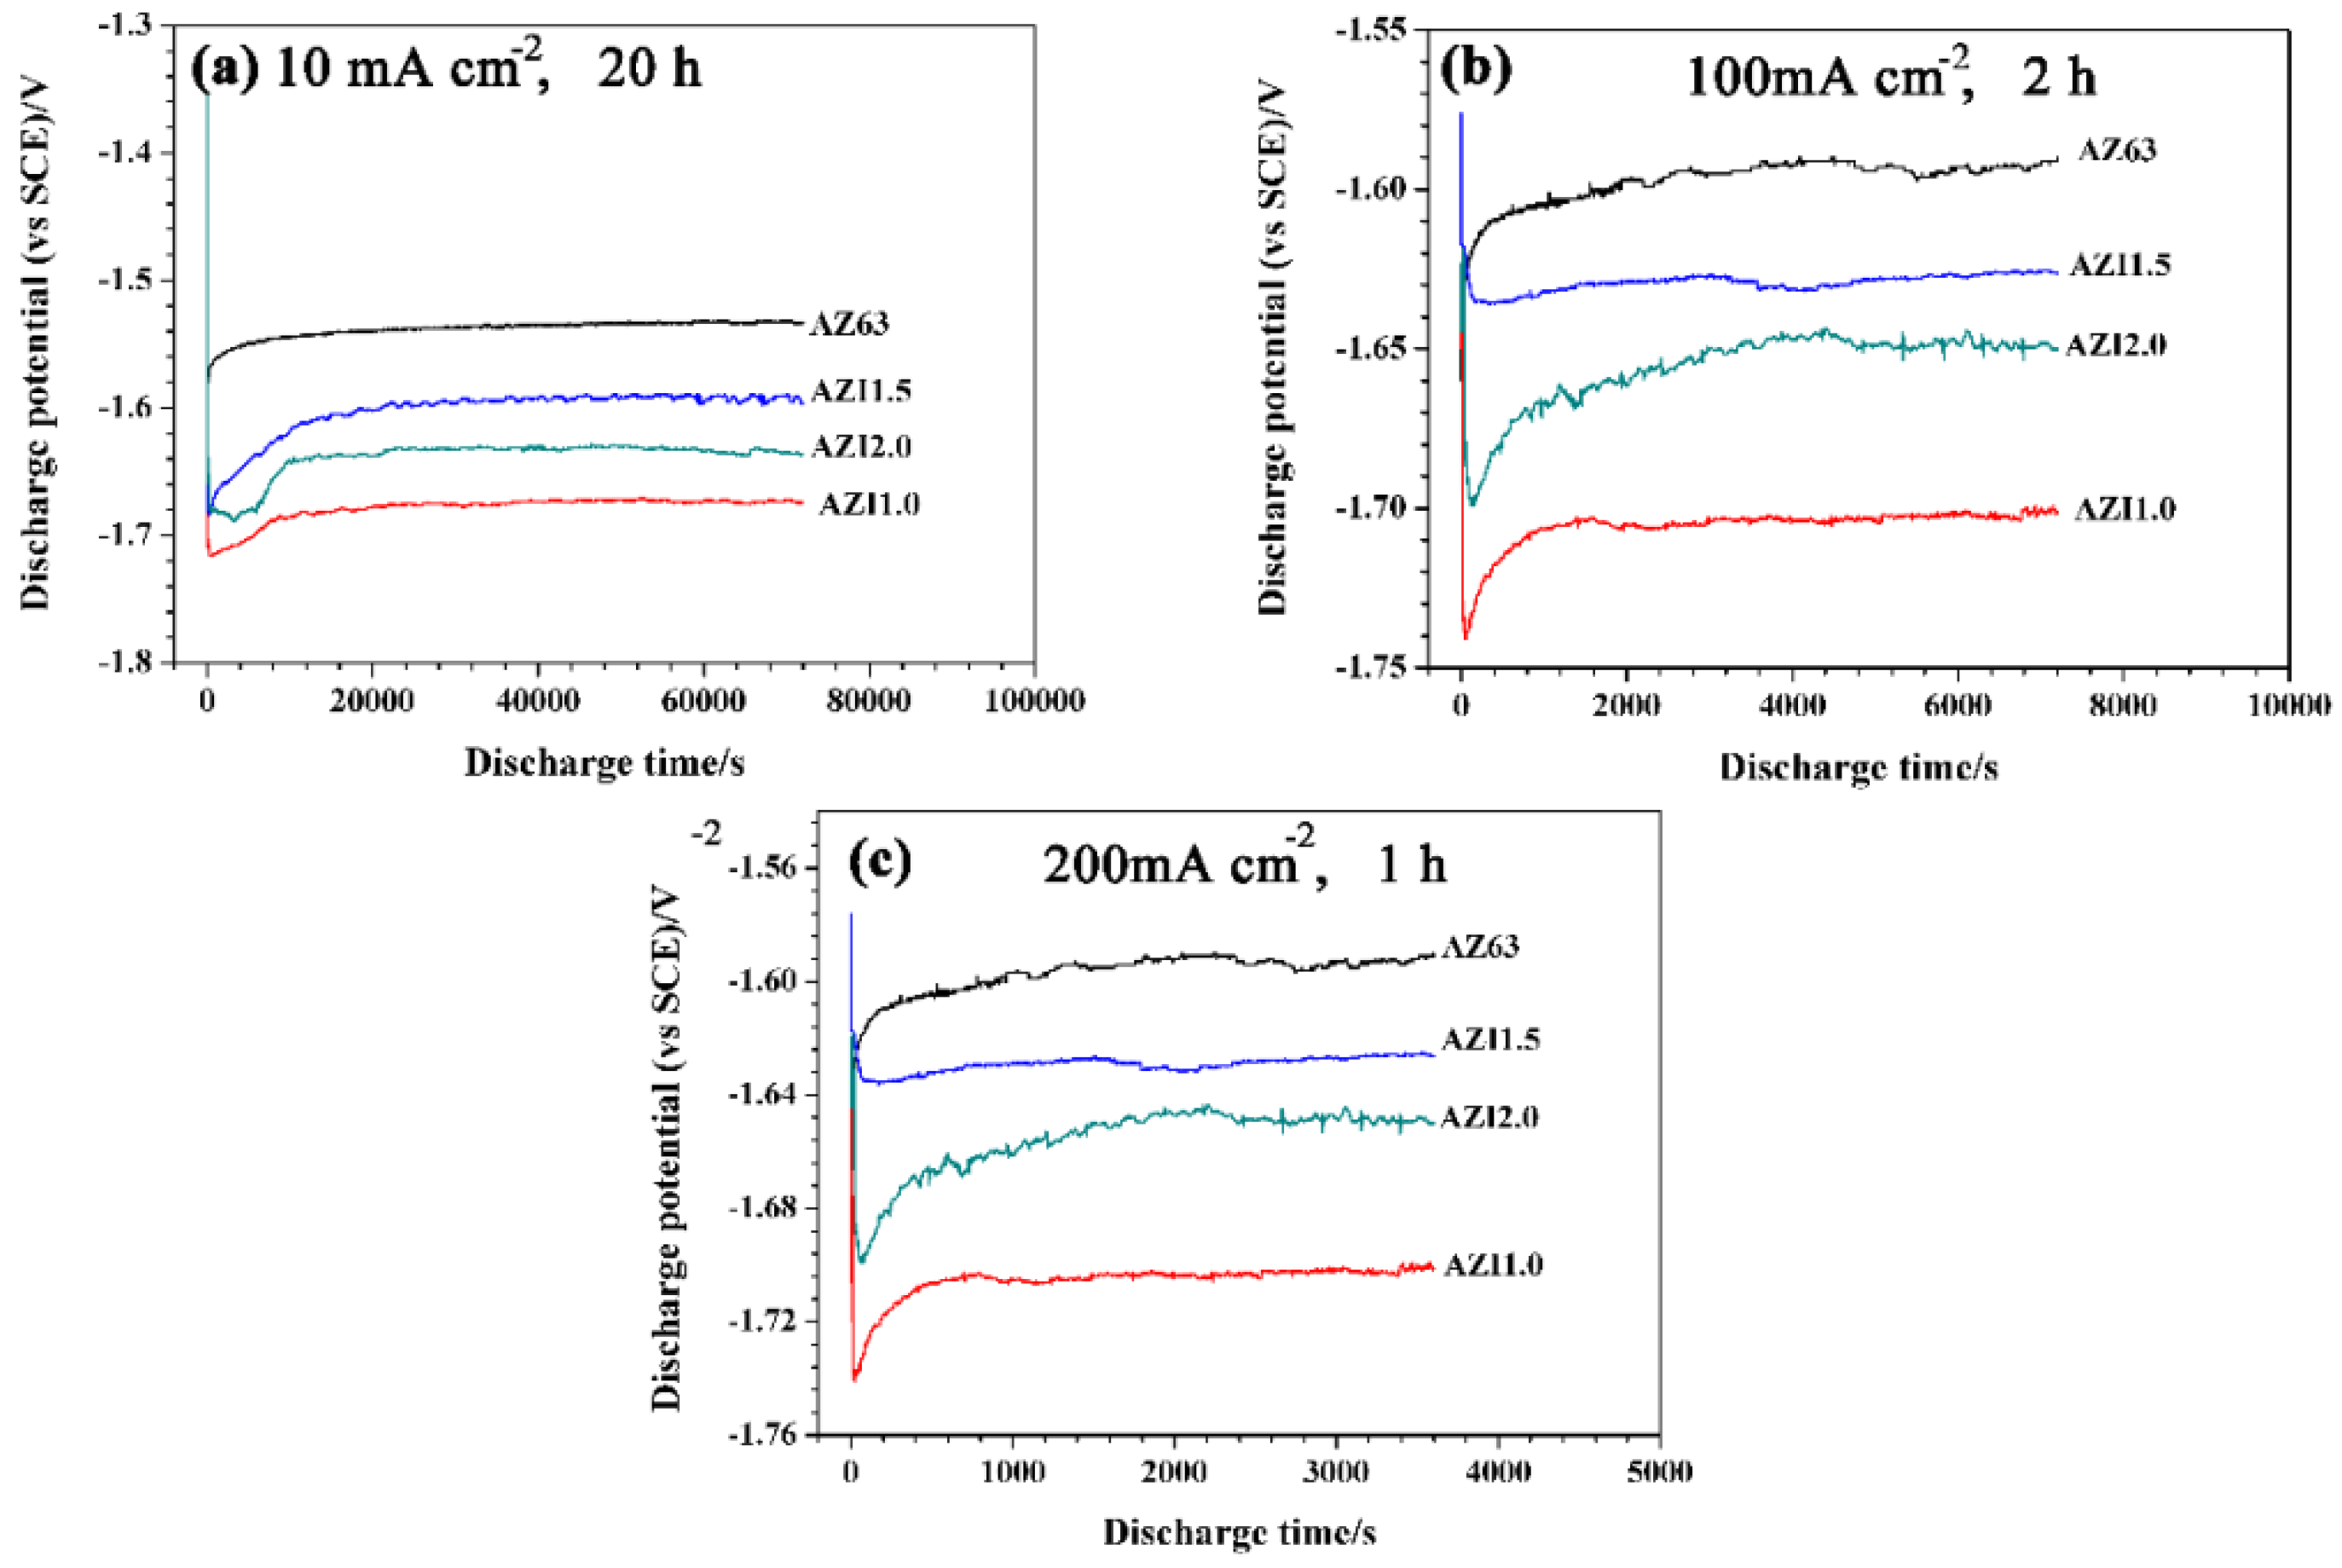
3.6. Galvanostatic Discharge

The galvanostatic discharge behaviors of the AZ63 and AZI alloys were investigated by impressing three anodic current densities at 10, 100 and 200 mA·cm−2, respectively. The different discharge times, 20 h, 2 h, and 1 h, corresponding to the current densities are designed for comparison of the current efficiencies at the equivalent discharge capacity. The increasing current densities ranging from 10–200 mA·cm−2 aim at studying the discharge behavior of magnesium anodes for different applications [25]. The current efficiency given in literature [50] is shown in Equation (4):
η = M t M a × 100 %
where Mt is the theoretical weight loss corresponding to the discharge capacity and Ma is the actual weight loss. The potential-time curves of AZ63 and AZI alloys are presented in Figure 9a–c.
The potentials of both AZ63 and AZI alloys shift negatively at the outset of the discharge process, then increase to steady values over different periods. The increase of potential over a certain period of discharge is due to the discharge products deposition on the electrode surface, which hinders the discharge process. The consequent steady potential values indicate an established dynamic equilibrium between the formation and desorption of discharge products [50]. The fluctuation of potentials becomes apparent with the increase of the discharge current by comparing Figure 9a–c within the steady discharge period. This is probably due to the initiation of localized corrosion and the desorption of α-Mg grains [32]. Figure 10 shows the product removed morphologies of AZI1.0 alloy under different discharge conditions.
As shown in Figure 10a, the morphology of the sample over 20 h discharge at 10 mA·cm−2 current density is more uniform than that of the other two samples (see Figure 10b,c). The angular caverns in Figure 10b,c indicate that the corrosion tends to develop vertically accompanied by α-Mg detachment [32]. The fallen α-Mg without discharge would cause the fluctuation of potentials and decrease the current efficiency. In contrast, the corroded pores in Figure 10a are quite small and shallow, indicating a uniform anodic dissolution process rather than localized detachment [51]. The average discharge potentials and current efficiencies of the investigated alloys are listed in Table 4 and Table 5.
As reported in [25], the more negative discharge potential an anode has, the stronger the discharge activity and the higher the power density of the material. The AZI alloys, especially for AZI1.0 alloy, process more negative potentials than that of the AZ63 alloy as in Table 4, implying that the indium does not only promote the activation discussed in Section 3.2, Section 3.3, Section 3.4 and Section 3.5 at free corrosion potential, but also increases the discharge activity of the AZ63 alloy. This result is consistent with Feng’s work [52]. The discharge potential curves of AZI1.0 alloy demonstrate the most negative values at different anodic current densities among the investigated alloys, implying desirable characteristics as anode material for different applications. In addition, the potential standard deviations of AZI1.0 alloy are relative smaller than others, suggesting a good discharging stability. In this work, the current efficiency improves almost 10 percent by indium alloying at different discharge currents, which is probably due to the refined grains as shown in Figure 2. It is also supported by Zhao’s work [53], suggesting that the fine grain promotes the discharge activity of magnesium alloy. Additionally, the enhanced discharge activity by indium alloying may alleviate the self-discharge of magnesium alloy.
The XRD patterns for discharge products of AZI1.0 alloys under different discharge conditions are presented in Figure 11. The discharge products mainly consist of magnesium hydroxide and sodium chloride. No peaks representing zinc and indium compounds are detected, probably due to the low concentration in the Mg substrate. Some peaks of Mg17Al12 can be detected in the corrosion products, probably due to the detachment of the β-Mg17Al12 phase on the grain boundaries. The peak intensity of the NaCl phase increases with the discharge current density, indicating an enhanced chloride ion absorption effect caused by indium, which is consistent with Bessone’s work [54], suggesting that the indium promotes the absorption of chloride ion in accelerating anode dissolution. This capability makes AZI alloys more suitable for serving as anode material at large discharge current density.

4. Conclusions

The corrosion and discharge behavior of Mg-Al-Zn and Mg-Al-Zn-In alloys were investigated in 3.5 wt% NaCl solution. The indium addition promotes both the corrosion rate and the discharge activity of AZ63 alloys; tentative conclusions are given as follows.
(1) The indium (less than 1.5 wt%) alloying into AZ63 alloy refines grains via precipitation of the β-Mg17Al12 phase, which acts as a micro-cathode in promoting self-discharge. AZI2.0 alloy with low corrosion rate is due to the barrier effect caused by surplus β-Mg17Al12 phase in spite of its further refined grains. The dissolving-reprecipitation action of indium also improves the activity of the investigated alloys.
(2) The discharge behavior, including discharge potential, incubation period, and current efficiency of the AZI alloys are enhanced on comparing with that of the AZ63 alloy, due to the indium addition, which refines the grains of the substrate and promotes product self-peeling by enhancing combination with chloride ions.
(3) Indium addition improves both the corrosion rate and discharge activity of the AZ63 alloys. Nevertheless, the AZI1.5 alloy with the highest corrosion rate does not perform desirable discharge activity on comparing with that of AZI1.0 alloy. It is probably due to the enhanced barrier effect caused by β-Mg17Al12 phase in a condition of anodic polarization.
(4) AZI1.0 alloy is a promising candidate for the anode material of chemical power sources due to its low corrosion rate and high discharge activity.

Acknowledgments

The authors wish to acknowledge the financial support of science and technology projects of State Grid Corporation of China (No.5211DS150016) and the National Science Foundation of China (No.41476067; No.41276074; No.51501180; No.51501181).

Author Contributions

Baorong Hou organized the funding for this research; Jiarun Li designed the experiments, carried out the experiments, analyzed the results, and prepared the manuscript; Huyuan Sun and Yantao Li directed the project; Kai Wan, Liwei Zhu and Min Liu helped in the revision of the results; all authors contributed to discussing and revising.

Conflicts of Interest

The authors declare no conflict of interest.

References

  1. Song, G.L.; Shi, Z. Corrosion mechanism and evaluation of anodized magnesium alloys. Corros. Sci. 2014, 85, 126–140. [Google Scholar] [CrossRef] [Green Version]
  2. Jin, H.X.; Wang, R.C.; Peng, C.Q.; Shi, K.; Feng, Y. Effect of indium addition on corrosion of AP65 magnesium alloy. J. Cent. South. Univ. 2012, 19, 2086–2093. [Google Scholar] [CrossRef]
  3. Mostafa, A.; Medraj, M. Experimental investigation of the Mg-Nd-Zn isothermal section at 300 °C. Metals 2015, 5, 84–101. [Google Scholar] [CrossRef]
  4. Pardo, A.; Merino, M.C.; Arrabal, R.; Casajus, P.; Mohedano, M.; Feliu, S., Jr.; Merino, S. Corrosion behavior of AZ magnesium alloys with Al and Al-11Si thermal spray coatings. Corrosion 2011, 67. [Google Scholar] [CrossRef]
  5. Grubač, Z.; Rončević, I.Š.; Metikoš-Huković, M. Corrosion properties of the Mg alloy coated with polypyrrole films. Corros. Sci. 2016, 102, 310–316. [Google Scholar] [CrossRef]
  6. Li, X.; Weng, Z.; Yuan, W.; Luo, X.; Wong, H.M.; Liu, X.; Wu, S.; Yeung, K.W.K.; Zheng, Y.; Chu, P.K. Corrosion resistance of dicalcium phosphate dihydrate/poly(lactic-co-glycolic acid) hybrid coating on AZ31 magnesium alloy. Corros. Sci. 2016, 102, 209–221. [Google Scholar] [CrossRef]
  7. Gnedenkov, A.S.; Sinebryukhov, S.L.; Mashtalyar, D.V.; Gnedenkov, S.V. Protective properties of inhibitor-containing composite coatings on a Mg alloy. Corros. Sci. 2016, 102, 348–354. [Google Scholar] [CrossRef]
  8. Ha, H.Y.; Kang, J.Y.; Yang, J.; Yim, C.D.; You, B.S. Role of Sn in corrosion and passive behavior of extruded Mg-5 wt%Sn alloy. Corros. Sci. 2016, 102, 355–362. [Google Scholar] [CrossRef]
  9. Gnedenkov, A.S.; Sinebryukhov, S.L.; Mashtalyar, D.V.; Gnedenkov, S.V. Localized corrosion of the Mg alloys with inhibitor-containing coatings: SVET and SIET studies. Corros. Sci. 2016, 102, 269–278. [Google Scholar] [CrossRef]
  10. Zhang, F.; Zhang, C.; Song, L.; Zeng, R.; Li, S.; Cui, H. Fabrication of the superhydrophobic surface on magnesium alloy and its corrosion resistance. J. Mater. Sci. Technol. 2015, 31, 1139–1143. [Google Scholar] [CrossRef]
  11. Kotoka, R.; Yarmolenko, S.; Pai, D.; Sankar, J. Corrosion behavior of reactive sputtered Al2O3 and ZrO2 thin films on Mg disk immersed in saline solution. J. Mater. Sci. Technol. 2015, 31, 873–880. [Google Scholar] [CrossRef]
  12. Tekumalla, S.; Seetharaman, S.; Almajid, A.; Gupta, M. Mechanical properties of magnesium-rare earth alloy systems: A review. Metals 2015, 5, 1–39. [Google Scholar] [CrossRef]
  13. Besenhard, J.O.; Winter, M. Advances in battery technology: Rechargeable magnesium batteries and novel negative-electrode materials for lithium ion batteries. Chemphyschem 2002, 3, 155–159. [Google Scholar] [CrossRef]
  14. Shinohara, M.; Araki, E.; Mochizuki, M.; Kanazawa, T.; Suyehiro, K. Practical application of a sea-water battery in deep-sea basin and its performance. J. Power Sources 2009, 187, 253–260. [Google Scholar] [CrossRef]
  15. Hasvold, O.; Lian, T.; Haakaas, E.; Storkersen, N.; Perelman, O.; Cordier, S. Clipper: A long-range, autonomous underwater vehicle using magnesium fuel and oxygen from the sea. J. Power Sources 2004, 136, 232–239. [Google Scholar] [CrossRef]
  16. Johnston, S.; Shi, Z.; Atrens, A. The influence of pH on the corrosion rate of high-purity Mg, AZ91 and ZE41 in bicarbonate buffered hanks’ solution. Corros. Sci. 2015, 101, 182–192. [Google Scholar] [CrossRef]
  17. Pathak, S.S.; Mendon, S.K.; Blanton, M.D.; Rawlins, J.W. Magnesium-based sacrificial anode cathodic protection coatings (Mg-rich primers) for aluminum alloys. Metals 2012, 2, 353–376. [Google Scholar] [CrossRef]
  18. Khoo, T.; Somers, A.; Torriero, A.A.J.; MacFarlane, D.R.; Howlett, P.C.; Forsyth, M. Discharge behaviour and interfacial properties of a magnesium battery incorporating trihexyl(tetradecyl)phosphonium based ionic liquid electrolytes. Electrochim. Acta 2013, 87, 701–708. [Google Scholar] [CrossRef]
  19. Cao, D.; Wu, L.; Wang, G.; Lv, Y. Electrochemical oxidation behavior of Mg-Li-Al-Ce-Zn and Mg-Li-Al-Ce-Zn-Mn in sodium chloride solution. J. Power Sources 2008, 183, 799–804. [Google Scholar] [CrossRef]
  20. Huang, D.B.; Hu, J.Y.; Song, G.L.; Guo, X.P. Self-corrosion, galvanic corrosion and inhibition of GW103 and AZ91D Mg alloys in ethylene glycol solution. Corros. Eng. Sci. Techn. 2013, 48, 155–160. [Google Scholar] [CrossRef]
  21. Andrei, M.; Di Gabriele, F.; Bonora, P.L.; Scantlebury, D. Corrosion behaviour of magnesium sacrificial anodes in tap water. Mater. Corros. 2003, 54, 5–11. [Google Scholar] [CrossRef]
  22. Wang, N.G.; Wang, R.C.; Peng, C.Q.; Hu, C.W.; Yan, F.; Bing, P. Research progress of magnesium anodes and their applications in chemical power sources. Trans. Nonferr. Met. Soc. China 2014, 24, 2427–2439. [Google Scholar] [CrossRef]
  23. Tahreen, N.; Zhang, D.F.; Pan, F.S.; Jiang, X.Q.; Li, D.Y.; Chen, D.L. Hot deformation and work hardening behavior of an extruded Mg-Zn-Mn-Y alloy. J. Mater. Sci. Technol. 2015, 31, 1161–1170. [Google Scholar] [CrossRef]
  24. Gusieva, K.; Davies, C.H.J.; Scully, J.R.; Birbilis, N. Corrosion of magnesium alloys: The role of alloying. Int. Mater. Rev. 2015, 60, 169–194. [Google Scholar] [CrossRef]
  25. Zhao, J.; Yu, K.; Hu, Y.; Li, S.; Tan, X.; Chen, F.; Yu, Z. Discharge behavior of Mg-4 wt%Ga-2 wt%Hg alloy as anode for seawater activated battery. Electrochim. Acta 2011, 56, 8224–8231. [Google Scholar] [CrossRef]
  26. Wang, P.; Li, J.; Guo, Y.; Yang, Z.; Xia, F.; Wang, J. Effect of Sn on microstructure and electrochemical properties of Mg alloy anode materials. Rare Met. Mater. Eng. 2012, 41, 2095–2099. [Google Scholar]
  27. Song, G.L.; Atrens, A. Corrosion mechanisms of magnesium alloys. Adv. Eng. Mater. 1999, 1, 11–33. [Google Scholar] [CrossRef]
  28. Wang, J.; Li, Y.; Huang, S.; Wei, Y.; Xi, X.; Cai, K.; Pan, F. Effects of Y on the microstructure, mechanical and bio-corrosion properties of Mg-Zn-Ca bulk metallic glass. J. Mater. Sci. Technol. 2014, 30, 1255–1261. [Google Scholar] [CrossRef]
  29. Anik, M.; Guneşdoğdu, I.M. Corrosion characteristics of alloy AZ63 in buffered neutral solutions. Mater. Des. 2010, 31, 3100–3105. [Google Scholar] [CrossRef]
  30. Altun, H.; Sen, S. Studies on the influence of chloride ion concentration and pH on the corrosion and electrochemical behaviour of AZ63 magnesium alloy. Mater. Des. 2004, 25, 637–643. [Google Scholar] [CrossRef]
  31. Zazoua, A.; Azzouz, N. An investigation on the use of indium to increase dissolution of AlZn anodes in sea water. Mater. Des. 2008, 29, 806–810. [Google Scholar] [CrossRef]
  32. Wang, N.; Wang, R.; Peng, C.; Peng, B.; Feng, Y.; Hu, C. Discharge behaviour of Mg-Al-Pb and Mg-Al-Pb-In alloys as anodes for Mg-air battery. Electrochim. Acta 2014, 149, 193–205. [Google Scholar] [CrossRef]
  33. Abidin, N.I.Z.; Atrens, A.D.; Martin, D.; Atrens, A. Corrosion of high purity Mg, Mg2Zn0.2Mn, ZE41 and AZ91 in Hank's solution at 37 °C. Corros. Sci. 2011, 53, 3542–3556. [Google Scholar] [CrossRef]
  34. Atrens, A.; Liu, M.; Abidin, N.I.Z. Corrosion mechanism applicable to biodegradable magnesium implants. Mater. Sci. Eng. B 2011, 176, 1609–1636. [Google Scholar] [CrossRef]
  35. Becerra, A.; Pekguleryuz, M. Effects of zinc, lithium, and indium on the grain size of magnesium. J. Mater. Res. 2009, 24, 1722–1729. [Google Scholar] [CrossRef]
  36. Song, G.L.; Atrens, A. Understanding magnesium corrosion—a framework for improved alloy performance. Adv. Eng. Mater. 2003, 5, 837–858. [Google Scholar] [CrossRef]
  37. Li, Y.; Zhang, T.; Wang, F. Effect of microcrystallization on corrosion resistance of AZ91D alloy. Electrochim. Acta 2006, 51, 2845–2850. [Google Scholar] [CrossRef]
  38. Song, G.L.; Bowles, A.L.; StJohn, D.H. Corrosion resistance of aged die cast magnesium alloy AZ91D. Mater. Sci. Eng. A 2004, 366, 74–86. [Google Scholar] [CrossRef]
  39. Liu, W.; Cao, F.; Chang, L.; Zhang, Z.; Zhang, J. Effect of rare earth element Ce and La on corrosion behavior of AM60 magnesium alloy. Corros. Sci. 2009, 51, 1334–1343. [Google Scholar] [CrossRef]
  40. Zhao, M.C.; Liu, M.; Song, G.L.; Atrens, A. Influence of pH and chloride ion concentration on the corrosion of Mg alloy ZE41. Corros. Sci. 2008, 50, 3168–3178. [Google Scholar] [CrossRef]
  41. Reboul, M.C.; Gimenez, P.; Rameau, J.J. A proposed activation mechanism for Al anodes. Corrosion 1984, 40, 366–371. [Google Scholar] [CrossRef]
  42. Song, G.L.; Atrens, A.; Dargusch, M. Influence of microstructure on the corrosion of diecast AZ91D. Corros. Sci. 1999, 41, 249–273. [Google Scholar] [CrossRef]
  43. Udhayan, R.; Bhatt, D.P. On the corrosion behaviour of magnesium and its alloys using electrochemical techniques. J. Power Sources 1996, 63, 103–107. [Google Scholar] [CrossRef]
  44. Zhang, T.; Meng, G.; Shao, Y.; Cui, Z.; Wang, F. Corrosion of hot extrusion AZ91 magnesium alloy. Part П: Effect of rare earth element neodymium (Nd) on the corrosion behavior of extruded alloy. Corros. Sci. 2011, 53, 2934–2942. [Google Scholar] [CrossRef]
  45. Chen, J.; Wang, J.; Han, E.; Dong, J.; Ke, W. AC impedance spectroscopy study of the corrosion behavior of an AZ91 magnesium alloy in 0.1 M sodium sulfate solution. Electrochim. Acta 2007, 52, 3299–3309. [Google Scholar] [CrossRef]
  46. Chavarin, J.U. Electrochemical investigations of the activation mechanism of aluminum. Corrosion 1991, 47, 472–479. [Google Scholar] [CrossRef]
  47. Liu, X.; Zhang, T.; Shao, Y.; Meng, G.; Wang, F. Effect of alternating voltage treatment on the corrosion resistance of pure magnesium. Corros. Sci. 2009, 51, 1772–1779. [Google Scholar] [CrossRef]
  48. Song, G.L. Effect of tin modification on corrosion of AM70 magnesium alloy. Corros. Sci. 2009, 51, 2063–2070. [Google Scholar] [CrossRef]
  49. Zhang, T.; Shao, Y.; Meng, G.; Cui, Z.; Wang, F. Corrosion of hot extrusion AZ91 magnesium alloy: I-relation between the microstructure and corrosion behavior. Corros. Sci. 2011, 53, 1960–1968. [Google Scholar] [CrossRef]
  50. Suresh Kannan, A.R.; Muralidharan, S.; Sarangapani, K.B.; Balaramachandran, V.; Kapali, V. Corrosion and anodic behaviour of zinc and its ternary alloys in alkaline battery electrolytes. J. Power Sources 1995, 57, 93–98. [Google Scholar] [CrossRef]
  51. Nestoridi, M.; Pletcher, D.; Wood, R.J.K.; Wang, S.; Jones, R.L.; Stokes, K.R.; Wilcock, I. The study of aluminium anodes for high power density Al/air batteries with brine electrolytes. J. Power Sources 2008, 178, 445–455. [Google Scholar] [CrossRef]
  52. Feng, Y.; Wang, R.C.; Peng, C.Q. Influence of Ga and In on microstructure and electrochemical properties of Mg anodes. Trans. Nonferr. Met. Soc. China 2013, 23, 2650–2656. [Google Scholar] [CrossRef]
  53. Zhao, H.; Bian, P.; Ju, D. Electrochemical performance of magnesium alloy and its application on the sea water battery. J. Environ. Sci. 2009, 21 (Suppl. 1), S88–S91. [Google Scholar] [CrossRef]
  54. Bessone, J.B.; Flamini, D.O.; Saidman, S.B. Comprehensive model for the activation mechanism of Al-Zn alloys produced by indium. Corros. Sci. 2005, 47, 95–105. [Google Scholar] [CrossRef]
Figure 1. X-ray diffraction (XRD) patterns for AZ63 (a), AZI1.0 (b), AZI1.5 (c) and AZI2.0 (d) alloys.
Metals 06 00065 g001
Figure 2. Optical morphologies of AZ63 (a), AZI1.0 (b), AZI1.5 (c) and AZI2.0 (d) alloys.
Metals 06 00065 g002
Figure 3. A scanning electron microscopy (SEM) image of AZI1.0 alloy and the energy-dispersive X-ray spectroscopy (EDS) results of different locations.
Metals 06 00065 g003
Figure 4. Hydrogen evolution volume (a) and hydrogen evolution rate (b) as a function of immersion time of Mg-Al-Zn and Mg-Al-Zn-In alloys in 3.5 wt% NaCl at 25 ± 1 °C.
Metals 06 00065 g004
Figure 5. The variation of open circuit potential (OCP) for AZ63 and AZI alloys in 3600 s in 3.5 wt% NaCl at 25 ± 1 °C.
Metals 06 00065 g005
Figure 6. Potentiodynamic polarization curves of AZ63 and AZI alloys after 1 h immersion in 3.5 wt% NaCl at 25 ± 1 °C (a) and sketch map of polarization curve for Tafel extrapolation (b).
Metals 06 00065 g006
Figure 7. Nyquist plots and fitting curves of (a) AZ63 and AZI alloys and (b) details of vague section in (a) after 1 h immersion in 3.5 wt% NaCl at 25 ± 1 °C.
Metals 06 00065 g007
Figure 8. The dissolving surface model for describing the physical/chemical characteristics on the surface of alloys (a) and equivalent circuit (b).
Metals 06 00065 g008
Figure 9. Potential-time curves of AZ63 and AZI alloys at different anodic current densities in 3.5 wt% NaCl at 25 ± 1 °C, 10 mA·cm−2 20 h (a), 100 mA·cm−2 2 h (b) and 200 mA·cm−2 1 h (c).
Metals 06 00065 g009
Figure 10. Corroded morphologies of AZI1.0 alloys at different discharge current densities after removing the products: 10 mA·cm−2, 20 h (a), 100 mA·cm−2, 2 h (b) and 200 mA·cm−2, 1 h (c).
Metals 06 00065 g010
Figure 11. XRD patterns for the discharge products of AZI1.0 alloy, 10 mA·cm−2, 20 h (a), 100 mA·cm−2, 2 h (b) and 200 mA·cm−2, 1 h (c).
Metals 06 00065 g011
Table 1. Actual chemical composition of the AZ63 and AZI alloys analyzed by inductively coupled plasma mass spectrometry (ICP-MS) (wt%).
AlloysAlZnMnInMg
AZ635.6832.6810.301balance
AZI1.0 (AZ63 + 1.0% In)5.4922.7840.3130.926balance
AZI1.5 (AZ63 + 1.5% In)5.7492.9010.2961.443balance
AZI2.0 (AZ63 + 2.0% In)5.6992.8240.3221.896balance
Table 2. Corrosion parameters of AZ63 and AZI alloys derived from the polarization curves.
AlloysEcorr (vs. SCE)/Vicorr/(µA·cm−2)bc/(mV·dec−1)ba/(mV·dec−1)
AZ63−1.58718.7−134.357.8
AZI1.0−1.65845.0−148.123.2
AZI1.5−1.64252.7−163.416.1
AZI2.0−1.62147.2−153.822.0
Table 3. Electrochemical parameters of AZ63 and AZ63I alloys obtained by fitting the electrochemical impedance spectra.
AlloyRs/(Ω·cm2)Rt/(Ω·cm2)Ydl/(Ω1·cm2·sn)ndlRL1/(Ω·cm2)L/(Ω cm2·s)
AZ637.018119.1 × 10−69.1 × 10−12980441.2
AZ63 + 1% In4.5261.11.0 × 10−59.3 × 10−190226.3
AZ63 + 1.5% In3.9113.51.4 × 10−59.1 × 10−1121980.6
AZ63 + 2% In3.81731.3 × 10−59.2 × 10−1360.84351
AlloyRL2/(Ω·cm2)L/(Ω·cm2·s)τc/sτL1/sτL2/sRp/(Ω·cm2)
AZ6394849121.3 × 10−21.5 × 10−15.2514.8
AZ63 + 1% In653.815702.2 × 10−32.9 × 10−22.4154.6
AZ63 + 1.5% In127.25.11.3 × 10−38.14 × 10−240.1
AZ63 + 2% In376.7181.5 × 10−312.14.8 × 10−289.2
Table 4. Average discharge potentials of AZ63 and AZI alloys under different conditions.
AlloysAverage Potentials (vs. SCE)/V
10 mA·cm2, 20 h100 mA·cm2, 2 h200 mA·cm2, 1 h
AZ63−1.538 ± 0.007−1.553 ± 0.013−1.597 ± 0.007
AZI1.0−1.679 ± 0.010−1.704 ± 0.007−1.705 ± 0.003
AZI1.5−1.602 ± 0.019−1.634 ± 0.010−1.629 ± 0.003
AZI2.0−1.639 ± 0.015−1.660 ± 0.012−1.655 ± 0.012
Table 5. Current efficiencies of AZ63 and AZI alloys under different conditions.
AlloysCurrent Efficiency (%)
10 mA·cm2, 20 h100 mA·cm2, 2 h200 mA·cm2, 1 h
AZ6359.162.959.4
AZI1.066.171.871.2
AZI1.571.570.068.6
AZI2.065.473.274.4

