Article

Effect of Synthesizing Temperature on Microstructure and Electrochemical Property of the Hydrothermal Conversion Coating on Mg-2Zn-0.5Mn-Ca-Ce Alloy

1
College of Mechanics and Materials, Hohai University, Nanjing 210098, China
2
Department of Material Science and Engineering, North Carolina State University, Raleigh, NC 27606, USA
3
School of Materials Science and Engineering, Southeast University, Nanjing 211100, China
4
Jiangsu Collaborative Innovation Center of Advanced Micro/Nano Materials & Equipment, Nanjing University of Science and Technology, Nanjing 210094, China
*
Authors to whom correspondence should be addressed.
Metals 2016, 6(3), 44; https://doi.org/10.3390/met6030044
Submission received: 14 January 2016 / Revised: 6 February 2016 / Accepted: 15 February 2016 / Published: 25 February 2016
(This article belongs to the Special Issue Oxidation of Metals)

Abstract

:
Mg(OH)2 conversion coatings were formed on an Mg-2Zn-0.5Mn-Ca-Ce alloy via hydrothermal method at three different synthesizing temperatures (160, 170 and 180 °C). The effect of synthesizing temperature on microstructure and electrochemical property of the coatings were systematically studied. With increasing synthesizing temperature, the coating became thicker due to the faster reaction and deposition of Mg(OH)2 on the α-Mg phase and secondary phases of the substrate Mg alloy. Internal micro-cracks were also generated in the higher-temperature synthesized coatings due to the increased shrinking stress, but the cross-cutting micro-cracks were suppressed. Benefiting from the improved barrier effect against penetration of corrosive medium, the higher-temperature synthesized thicker coating presented significantly enhanced electrochemical property and anti-corrosion efficiency in Hanks’ solution.

Graphical Abstract

1. Introduction

In recent years, Magnesium (Mg) alloys have been wildly reported as potential candidates for applications in biomaterials due to their bio-degradation ability, and similar densities and elastic modulus to that of human bone. The biomedical Mg alloys have been found to be applicable in numerous medical applications, such as bone screw, bone plates and vascular scaffold [1,2,3,4]. However, the main limitation of biomedical Mg alloys is the fast bio-degradation rate in human body [5]. Thus, it is of great practical significance to reduce the bio-degradation rate of the biomedical Mg alloy.
Various methods, such as alloying [6,7], heat treatment [8,9] and surface treatment [10], have been employed to improve corrosion resistance of Mg implants. Coating on the Mg alloys can effectively provide a barrier between the metal and the corrosion medium to reduce the corrosion rate [11,12]. So far, there have been lots of coating technologies reported for Mg alloys, such as micro-arc oxidation [13], electrochemical-deposited coating [14], chemical conversion coating [15], and composited coating [16]. Hydrothermal synthesis of the protective coating on Mg alloys is also one of the most potential methods [17]. This method is simple, efficient, eco-friendly and low-cost. In addition, hydrothermal crystallization occurs on a 3-dimensional structure and therefore makes it easy to be industrially scaled up [18].
In our previous study [19], a novel kind of Mg-2Zn-0.5Mn-Ca-Ce alloy was designed and fabricated considering the trade-off between influence on human health and corrosion resistance. Corrosion resistance improvement of this new bio-medical Mg alloy was obtained, but the in-vitro bio-degradation rate was still not acceptable for medical standards. To further reduce the bio-degradation rate, the hydrothermal synthesis of the protective conversion coating in de-ionized water on this Mg alloy was conducted in this study. The effects of hydrothermal-synthesizing temperature on the microstructure and electrochemical property of the conversion coatings were systematically studied.

2. Experimental Section

2.1. Synthesizing Process of Conversion Coating

The material to be coated was cut from a casting Mg-2Zn-0.5Mn-Ca-Ce alloy, which was designed and casted in our former research [19]. The chemical composition of this alloy was analyzed by inductively coupled plasma optical emission spectrometry (ICP-OES) (Iris Advantage 1000, Thermo Jarrell-Ash, Franklin, MA, USA), as listed in Table 1. The samples with a size of 10 mm × 10 mm × 5 mm were cut by an electric discharging machine, then polished with SiC papers successfully up to 1800 grades and ultrasonically cleaned in acetone and ethanol for each 5 min, following a drying process in air.
The reactor used in this experiment is a stainless steel autoclave (100 mL) with a Teflon liner. The de-ionized water was poured into the reactor to 70% volume as the reaction solution. Three parallel groups were treated in one reactor simultaneously. The reactor was heated via an electric furnace with a heating accuracy of 0.1 °C. The hydrothermal-heating temperatures (synthesizing temperature) were selected as 160, 170 and 180 °C, respectively, for the three parallel groups. And the synthesizing time for all the samples were set as 3 h. The coated samples were named as 160 °C-coated sample, 170 °C-coated sample, and 180 °C-coated sample, respectively.

2.2. Microstructure Characterization

The surface macro-morphologies of the coatings were observed by a digital microscope (Hirox, KH-7700, Hackensack, NJ, USA). The surface and cross-sectional micro-morphologies of the coatings, as well as the microstructure of the Mg alloy, were examined by scanning electron microscope (SEM, Hitachi, S3400-N, Tokyo, Japan). X-ray diffraction (XRD) analysis of the Mg alloy and coated sample was tested via a Bruker D8 Advance diffractometer (Bruker AXS, Karlsruhe, Germany) with Cu Kα1 radiation. The θ–2θ diffraction patterns were scanned from 10° to 90° with a scanning rate of 2°/min.

2.3. Corrosion Tests

The electrochemical property of the coating in in-vitro environment were tested via a Parstat 2273 (Princeton, Oak Ridge, TN, USA) advanced potentiostat in the Hanks’ solution at the temperature of 37 °C. Table 2 shows the chemical composition of the Hanks’ solution. The ion concentrations of the Hanks’ solution (Na+ = 141.84 mM, K+ = 5.77 mM, Mg2+ = 0.814 mM, Ca2+ = 1.261 mM, HCO3− = 4.17 mM, HPO42− = 0.338 mM, SO42− = 0.814 mM, H2PO4− = 0.44 mM, Cl = 144.85 mM and d-Glucose = 5.56 mM) were nearly equal to those of human blood plasma. The Hanks’ solution was renewed every single day to keep the corrosion environment consistent. In order for electrochemical tests to be carried out, all the coated samples were molded in the epoxy with a squared exposure coating of 10 mm2, while the substrate was connected by a copper wire. A three-electrodes cell was employed, which was composed of the tested sample as the working electrode, a saturated calomel electrode (SCE) as the reference electrode, and a large-area platinum sheet as the counter electrode. Three electrochemical measurements, including open circuit potential (OCP) test, electrochemical impendence spectroscopy (EIS) test, and potentiodynamic polarization (PDP) test, were systematically conducted. Since the OCP test would impact slightly negative effect on a sample, the same sample was tested continuously the OCP curve and the EIS curves while the OCP value was steady. Another new sample was used for the PDP test, which was immersed in the solution for 1 h to get stable potential before the PDP tests. The immersion time of all OCP tests was set for 3600 s. The frequency range of EIS tests were from 10 kHz to 10 mHz, and the amplitude of sinusoidal potential was 20 mV. The PDP tests were performed at a scan rate of 1 mV·s−1.

3. Results and Discussion

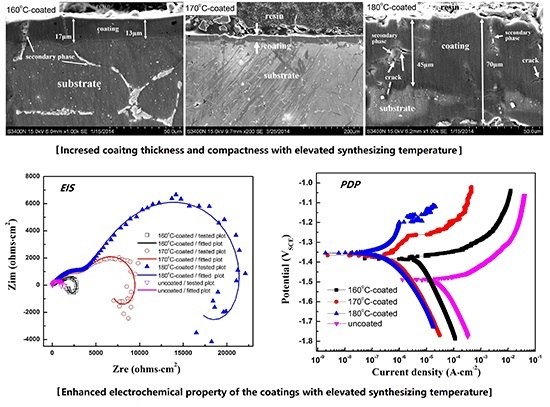
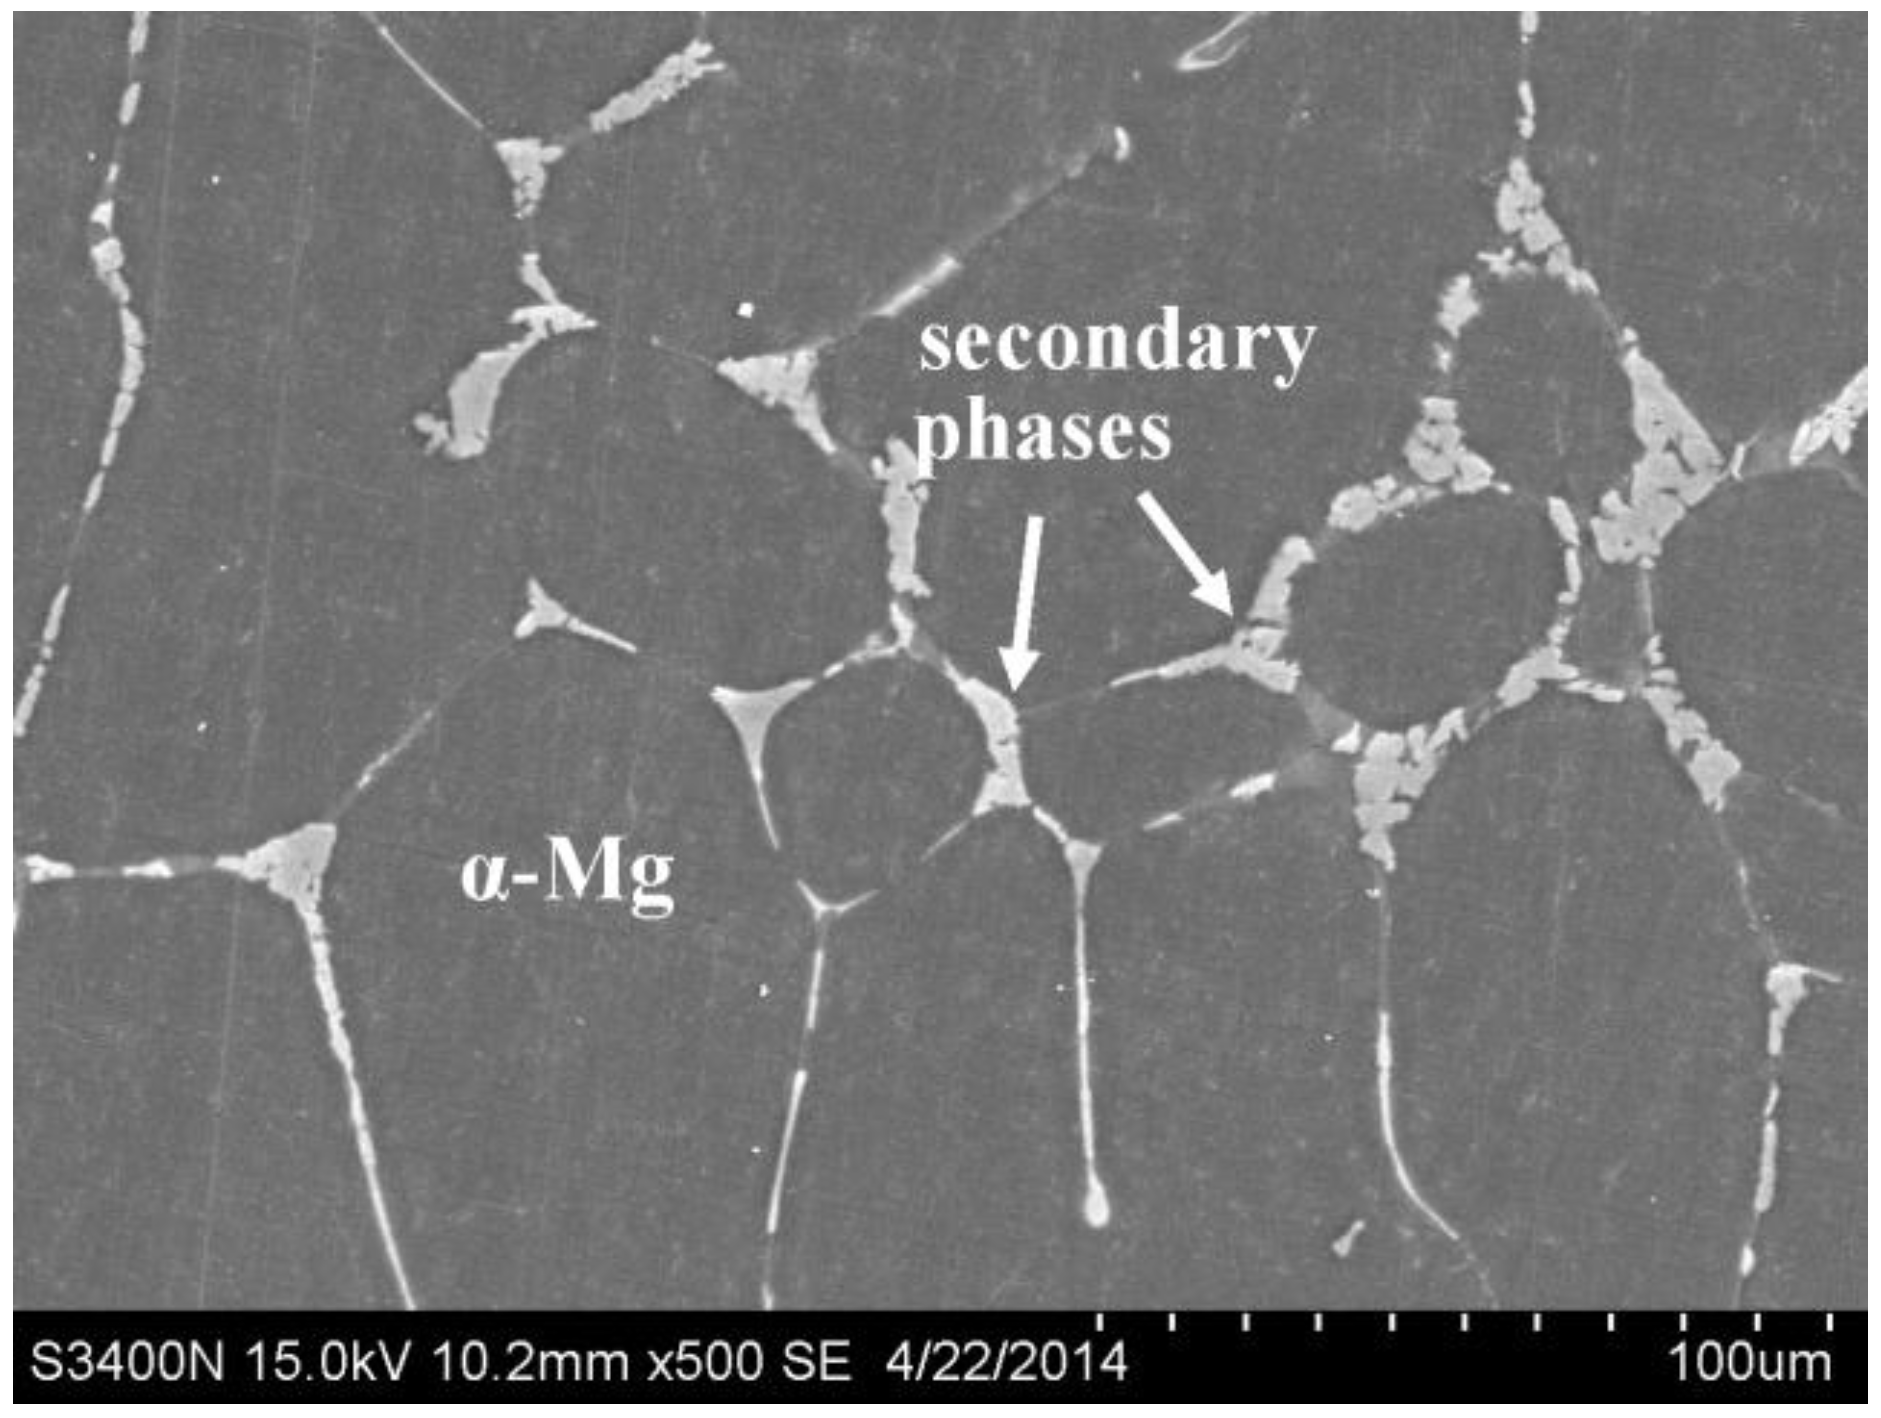
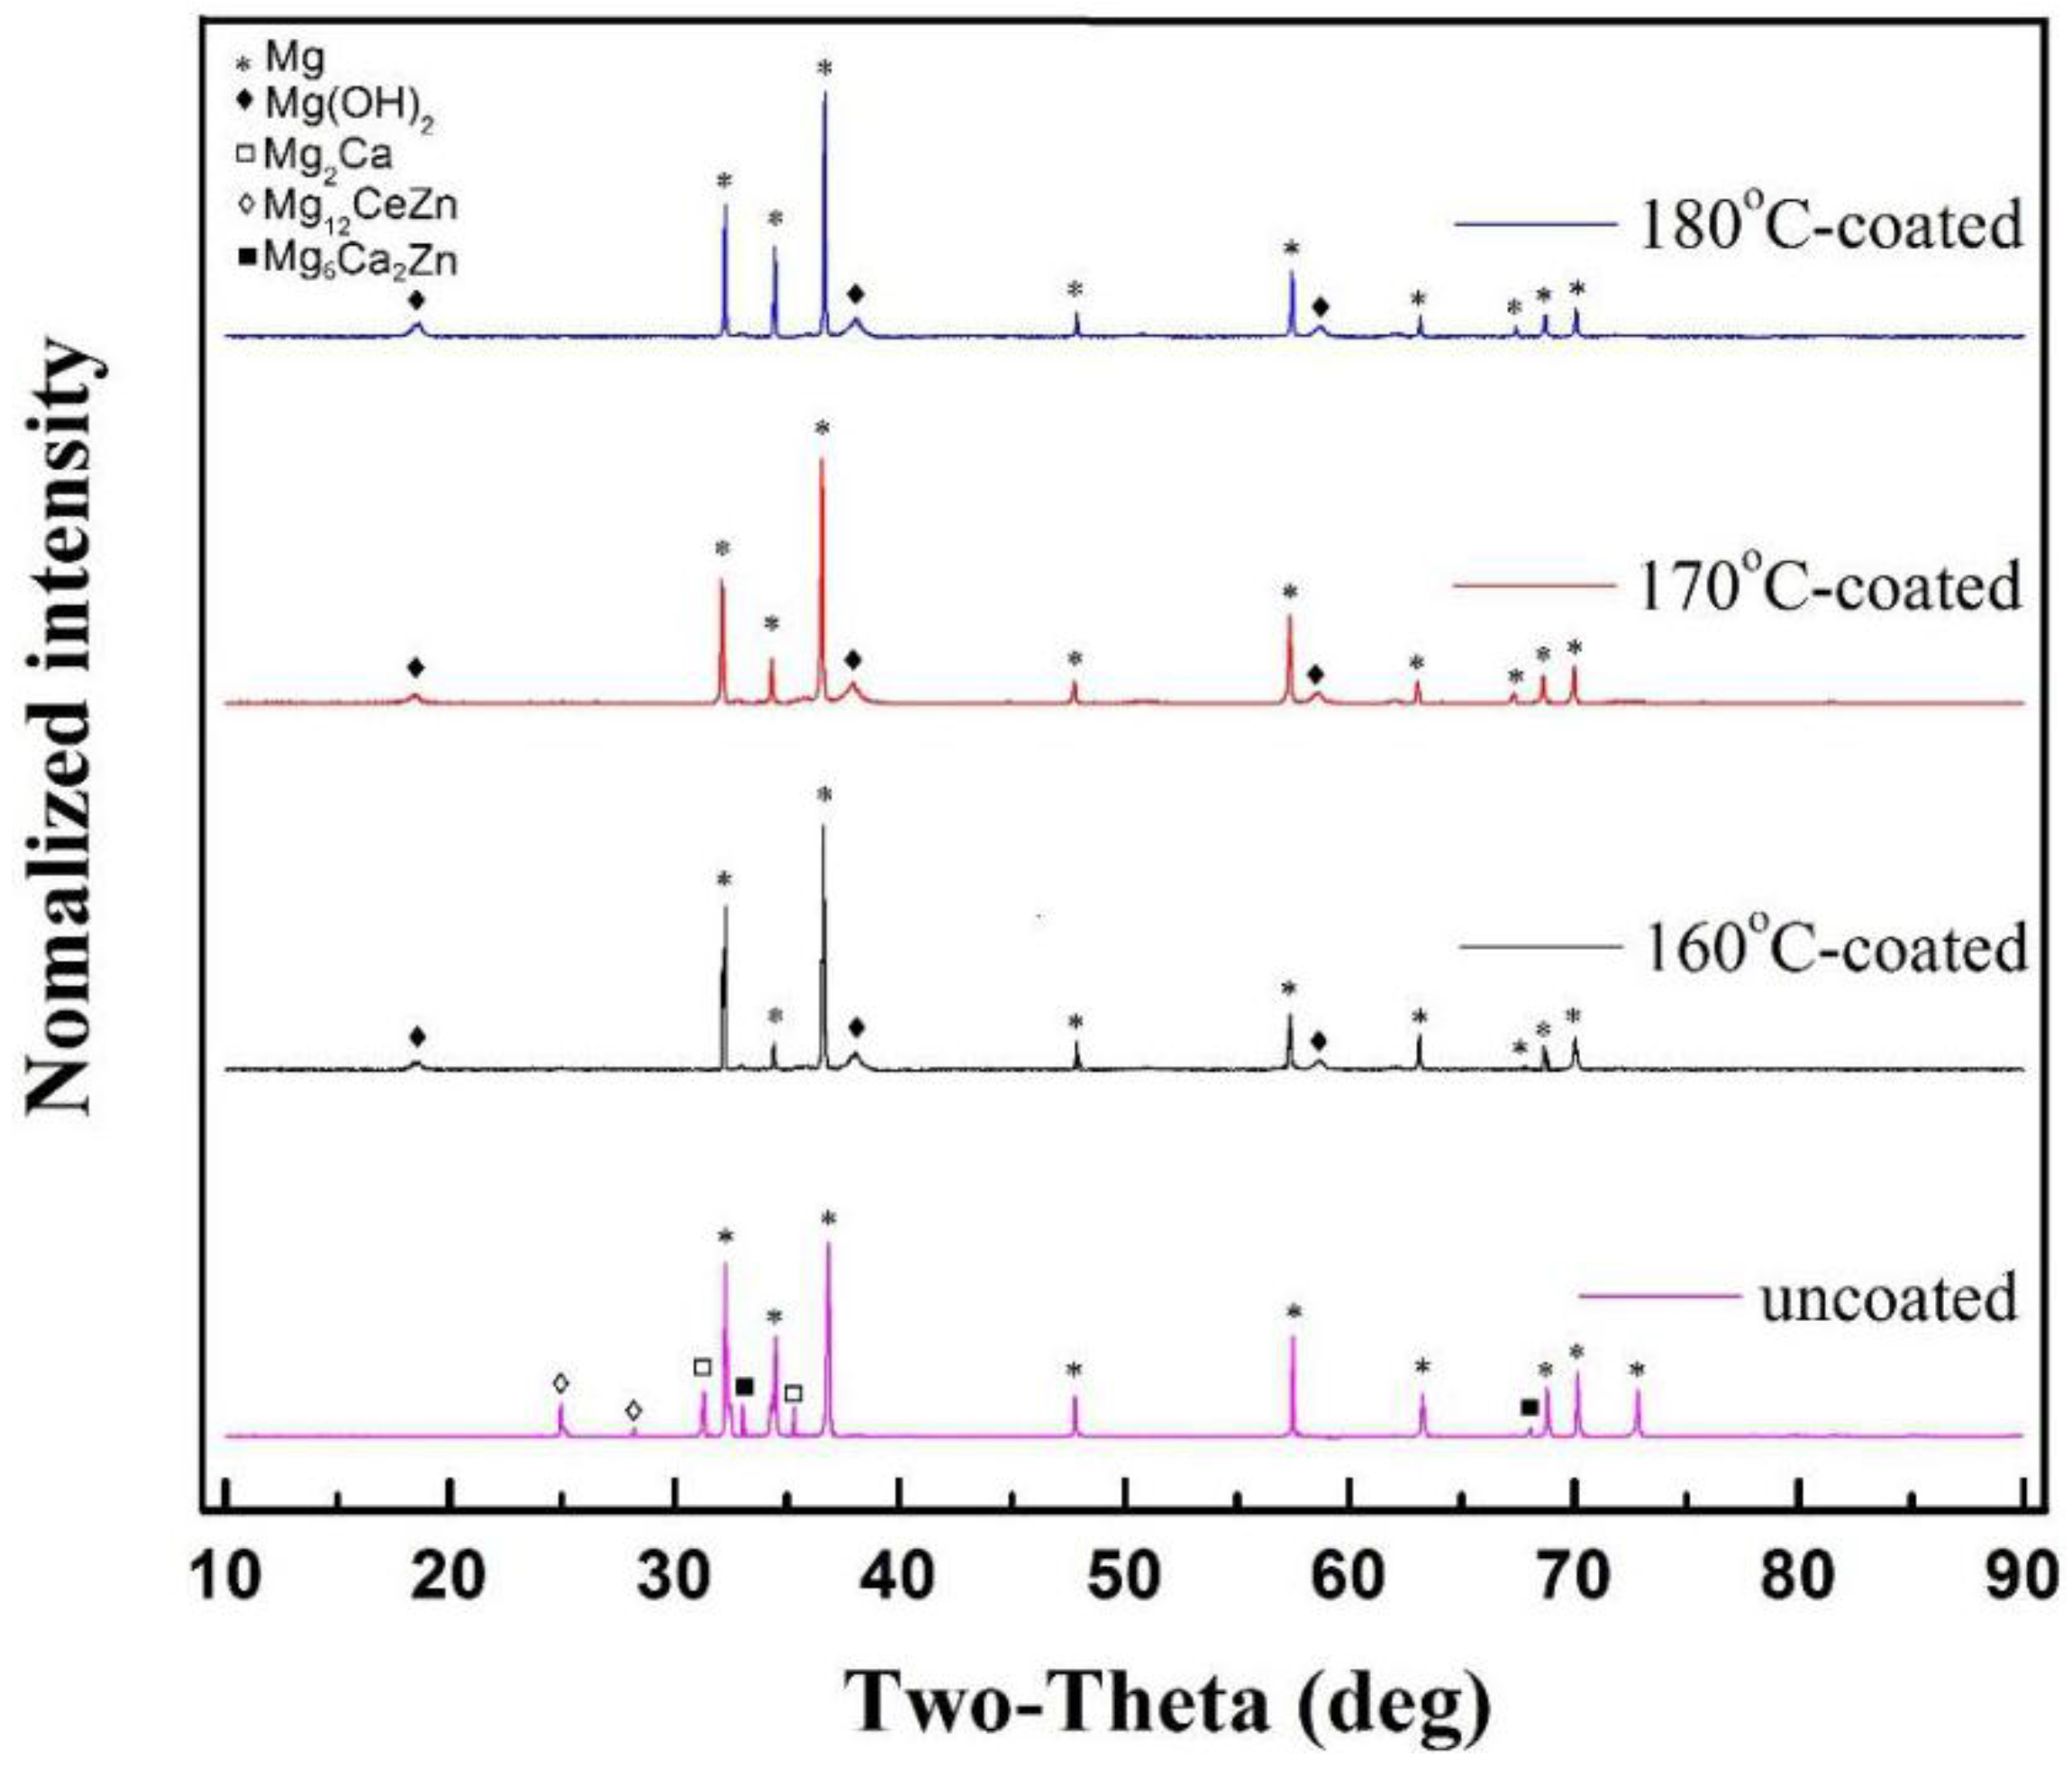
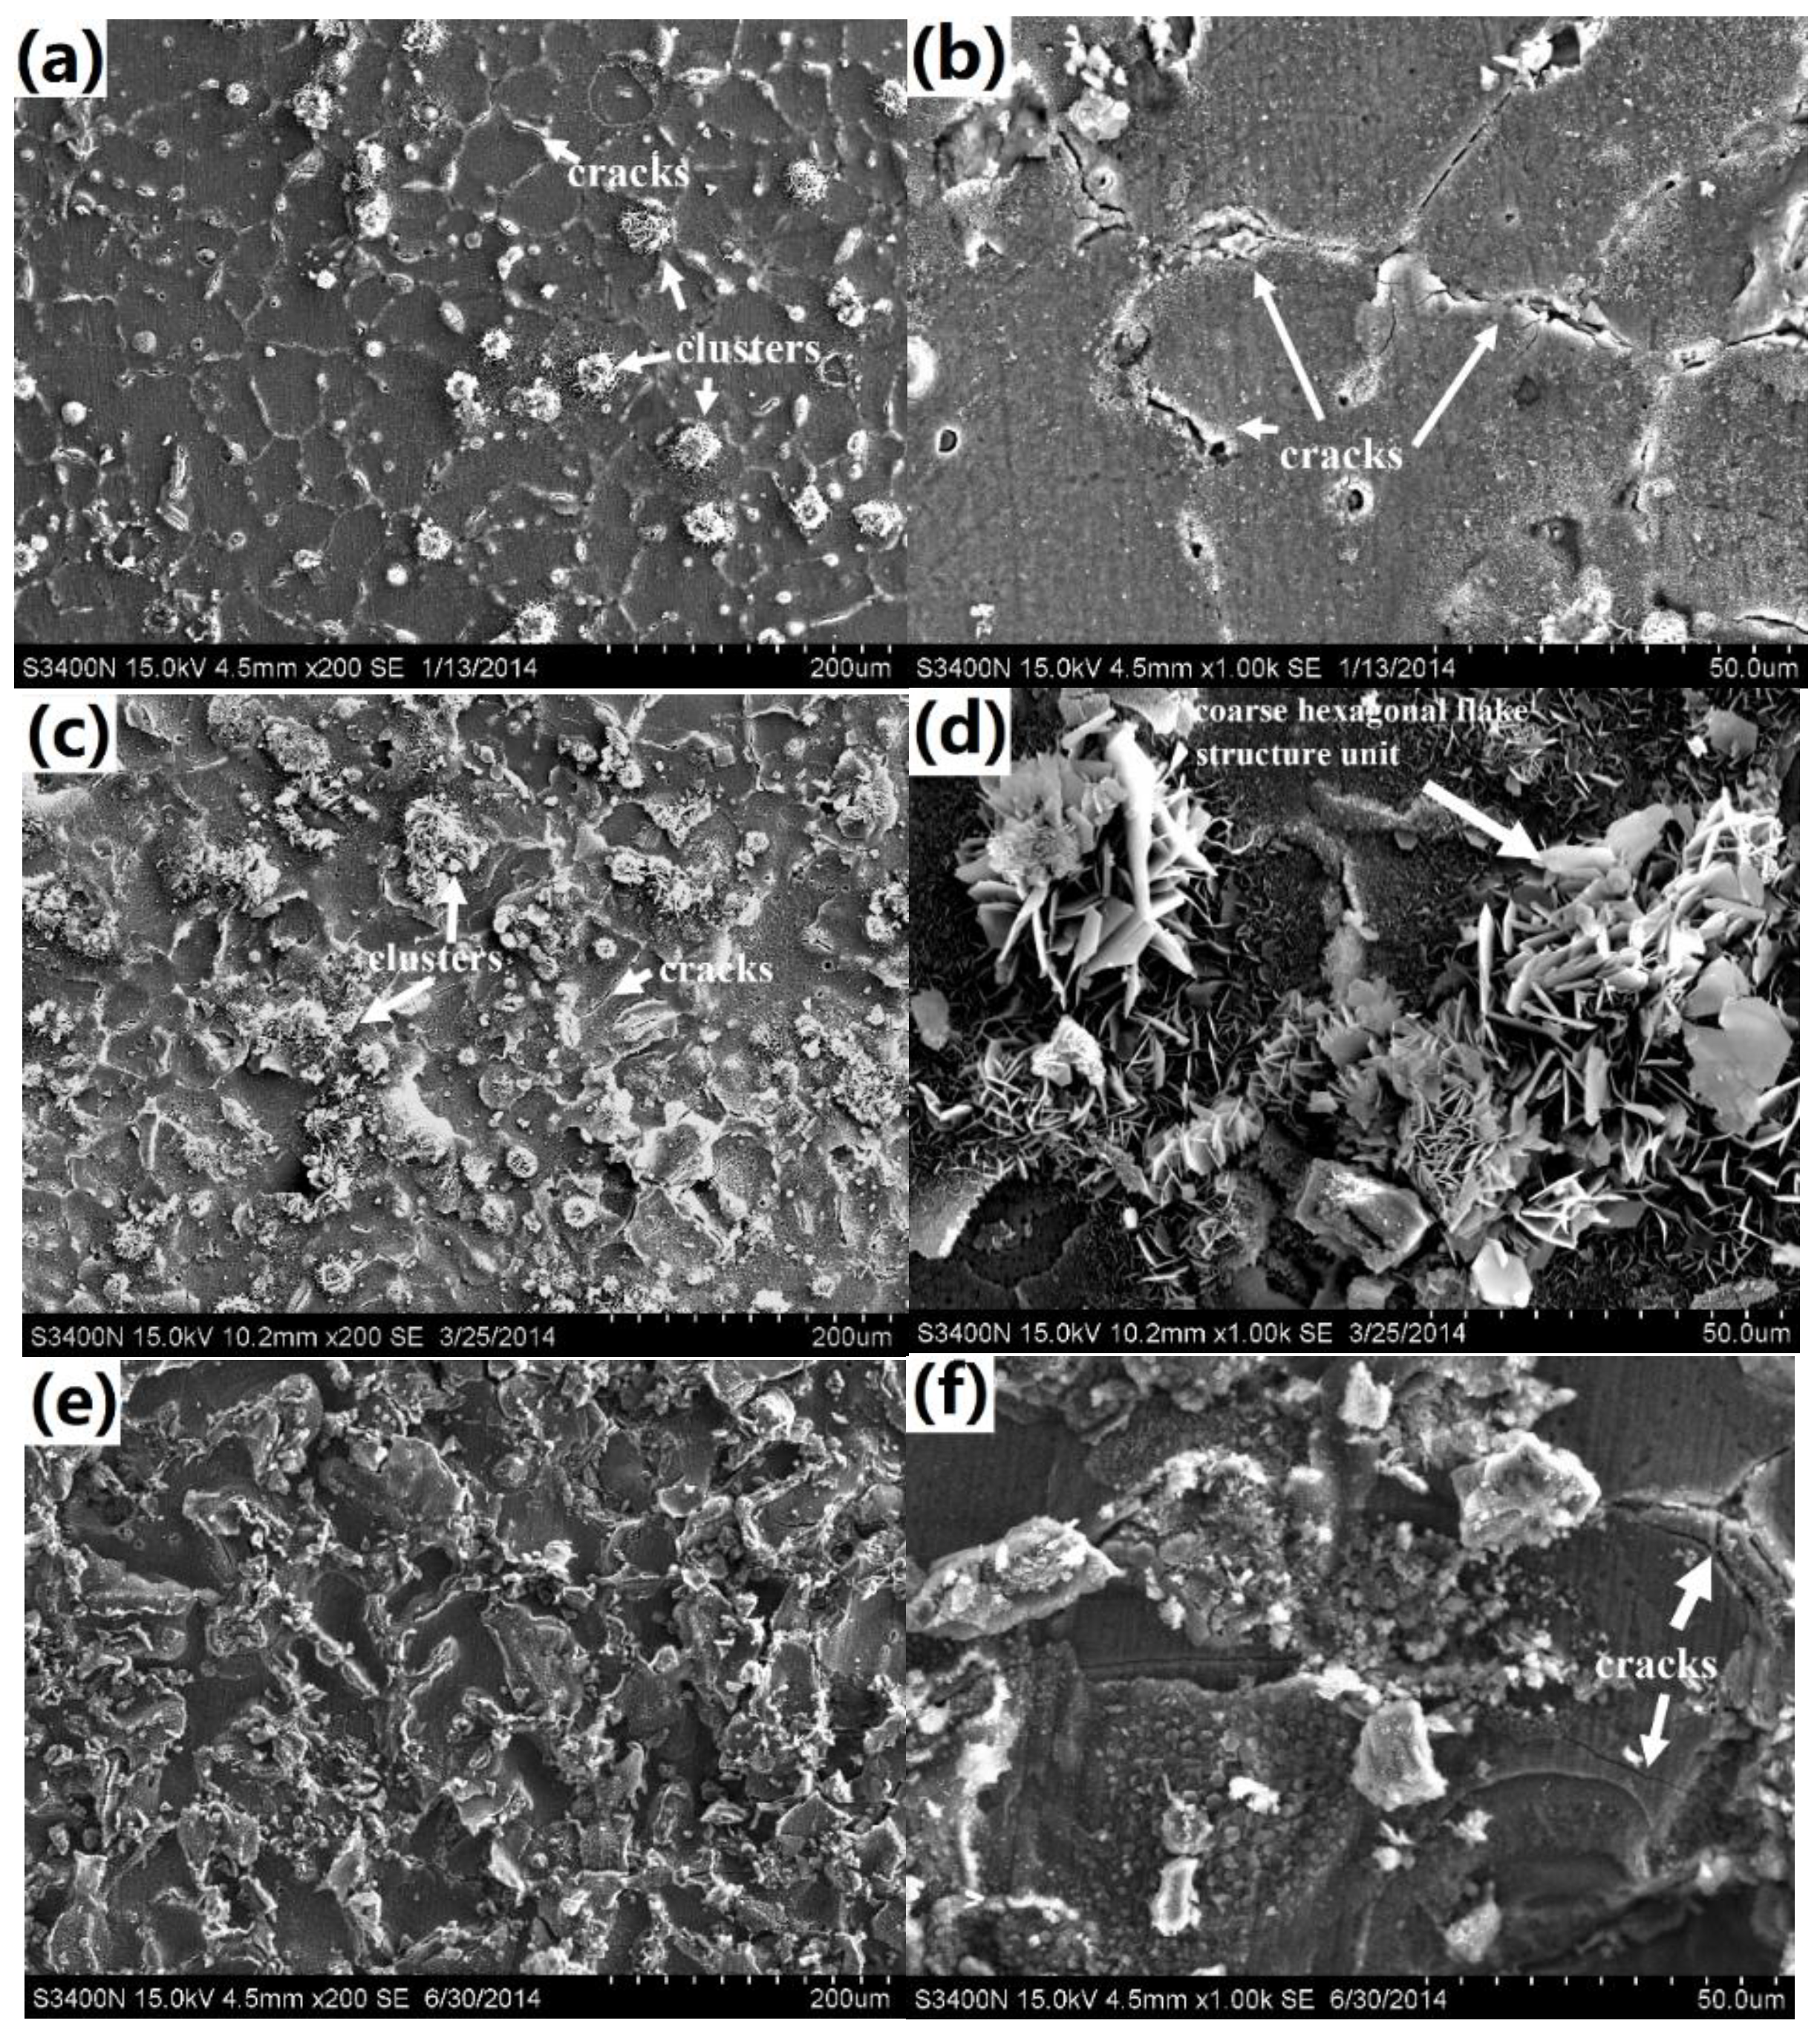
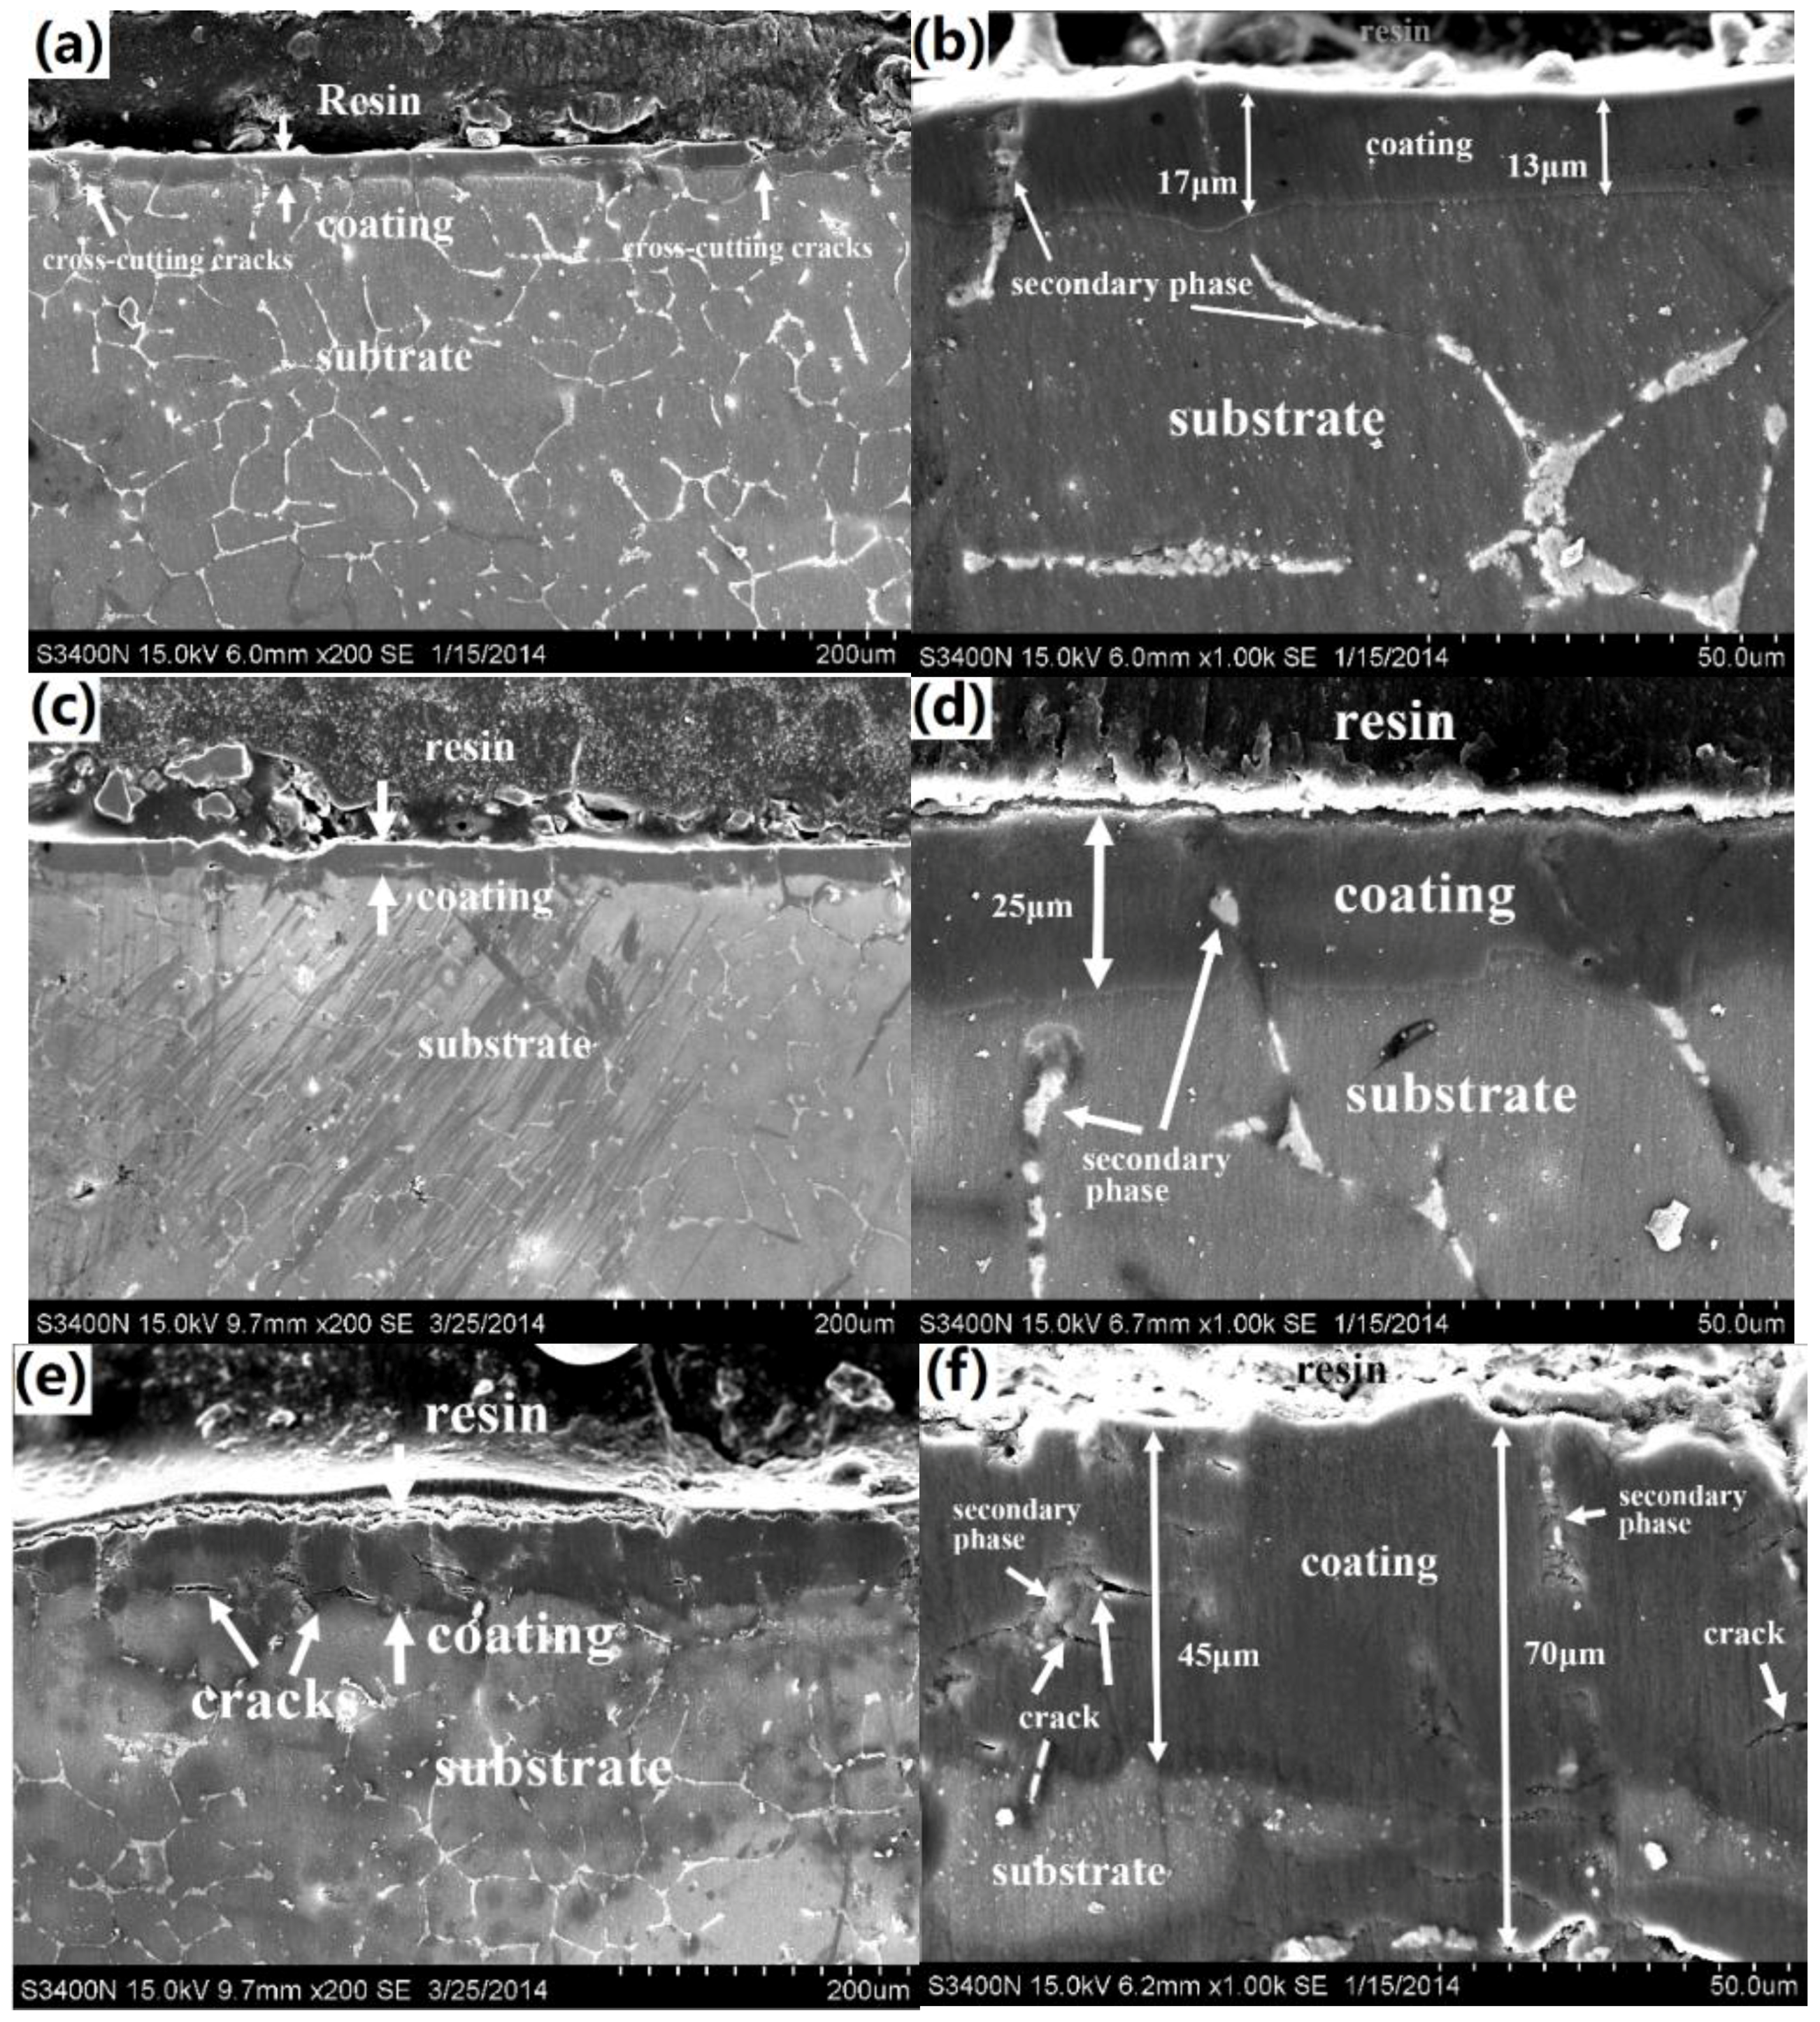
3.1. Microstructure Characteristic of the Coatings

Figure 1 shows the SEM microstructure of the substrate Mg alloy. Clearly as marked, this alloy has two kinds of microconstituents: α-Mg phase and secondary phases. Our previous study has identified the secondary phases as Mg2Ca, Mg6Ca2Zn and Mg12CeZn phases, which were strip-like and distributed along the grain boundaries of the α-Mg phase [19].
The XRD patterns of the uncoated and coated samples are shown in Figure 2. The instrument background has been subtracted from the initial XRD pattern. The XRD pattern of the uncoated alloy presents strong Mg phase peaks. Meanwhile, the weak secondary-phases (including Mg2Ca phase, Mg6Ca2Zn and Mg12CeZn) peaks can also be detected. The obtained Mg phase peaks present a little deviation from standard pure Mg peaks, which phenomenon should be caused by the solid-solution of alloying elements in the α-Mg phase. As reported in the references [20,21], the hydrothermal synthesizing reactions of the conversion coating on Mg alloy using de-ionized water can be described as follows:
H2O (l) → H+ + OH (aq)
Mg (s) → Mg2+ (aq) + 2e
2H+ (aq) + 2e → H2 (g)
Mg2+ (aq) + 2OH (aq) → Mg(OH)2 (s)
The XRD patterns of the coated samples present typical Mg(OH)2 pattern and Mg pattern. According to the coating reaction equation, the Mg(OH)2 pattern should be related to the coating layer, and Mg pattern should correspond to the α-Mg phase of the Mg alloy substrate. Due to the coating coverage, the feedback signals from the substrate are further weakened to be detected. From the XRD characterization, one can judge that the main composition of the obtained conversion coating is Mg(OH)2.
Figure 3 shows the macro surface-morphologies of the coatings synthesized at different temperatures. Macroscopically uniform and compact coatings have been formed on the Mg alloy substrate at all synthesizing temperatures. Basically, the coatings show remarkable golden color. The surface color becomes darker with the synthesizing temperature increasing, which is accompanied by the appearance of some matte textured features. Such characteristics become most noticeable in the 180 °C-coated sample, which is marked as white arrows in Figure 3c.
Figure 4 represents the SEM surface morphologies of the coatings. In Figure 4a (low magnification), the coating surface of the 160 °C-coated sample presents obvious net-like shape, which is similar to the distribution of secondary phase in the substrate Mg alloy. Meanwhile, some globular clusters with diameter about 20–40 μm are distributed on the coating surface. Careful examinations of SEM photographs with higher magnification (Figure 4b) reveal some micro defects, including micro-cracks and pores. It is also worth noting those micro defects always exist in the vicinity of the secondary phases of the Mg alloy substrate. In contrast, the coating layer on the α-Mg matrix is more compacter, and free of micro-cracks and pores under the set magnification. From the above observation, one can infer that the secondary phase is not well covered by the coating of the 160 °C-coated sample. In Figure 4b (170 °C-coated sample with low magnification), as the synthesizing temperature elevated, the net-like shape of this coating surface become less obvious. This phenomenon should be caused by the better stacking of Mg(OH)2 on the secondary phases. Meanwhile, the globular clusters also grows up remarkably, presenting diameter of about 40–60 μm. As seen in Figure 4d, the clusters are composed by many coarse hexagonal flake structural units of Mg(OH)2, presenting loose stacking structure. As reported in the references [22,23], the hexagonal flake structural unit is the basic form of Mg(OH)2 stacking crystals. This kind of structural unit can be found all over the coatings, which covers both the α-Mg phase and the secondary phase of the substrate. As the synthesizing temperature was further elevated to 180 °C, it is hard to distinguish the net-like shape of the coating surface (as seen in Figure 4e), and the globular clusters also disappear. Seen from Figure 4f, the secondary phase has been well covered by Mg(OH)2 crystals, which presents even more stacking Mg(OH)2 crystals than that on the α-Mg matrix. However, the stacking Mg(OH)2 crystals on the secondary phase is seem to be chalking, which is looser than that on the α-Mg matrix. Based on the above observation, the change in color and macro morphologies of the coating should be caused by the different quantity and stacking structure of the Mg(OH)2 crystals synthesized at different temperatures.
Figure 5 shows the cross-sectional morphologies of the coated samples, all the coatings are well bonded to substrate. There are two remarkable differences between the three coated samples. One is the coating thickness, the other is the uniformity and compactness of the coatings. As the synthesizing temperature increases, the coating thickening become more remarkable. The coating thickness of the 160 °C-coated sample is about 13–17 μm, while that of the 170 °C-coated sample is about 25 μm. When the synthesizing temperature was elevated to 180 °C, the coating thickness was increased to 45–70 μm, almost 4 times thicker than that of the 160 °C-coated sample. Besides the obvious coating thickening, the 180 °C-coated sample has large fluctuations in the coating thickness, presenting less uniformity than the other two kinds of samples. Moreover, the 180 °C-synthesized coating has less compactness than the other two kinds of coatings, existing more internal micro-cracks. Those internal micro-cracks distributed irregularly in the cross section of the coating, even at the substrate/coating interface. Fortunately, bare cross-cutting micro-cracks (cracks continuously expand from the coating surface to the substrate/coating interface) can be found. However, some cross-cutting micro-cracks can be found in the 160 °C-coated sample with low magnification (as marked in Figure 5a), and the bottom of these micro-cracks seems to be connected with the secondary phase. Via careful comparison with localized cross-section morphologies of the coatings (Figure 5b,d,f), one can find that some secondary phase are occupied in the coating. In the 160 °C-coated sample, the secondary phase seem to extend to the coating surface, which indicates that this secondary phase has not been well covered by the coating. In contrast, the secondary phases in the 170 and 180 °C synthesized coatings have been surrounded completely, which directly indicates that these secondary phases have already been well covered by the coating.

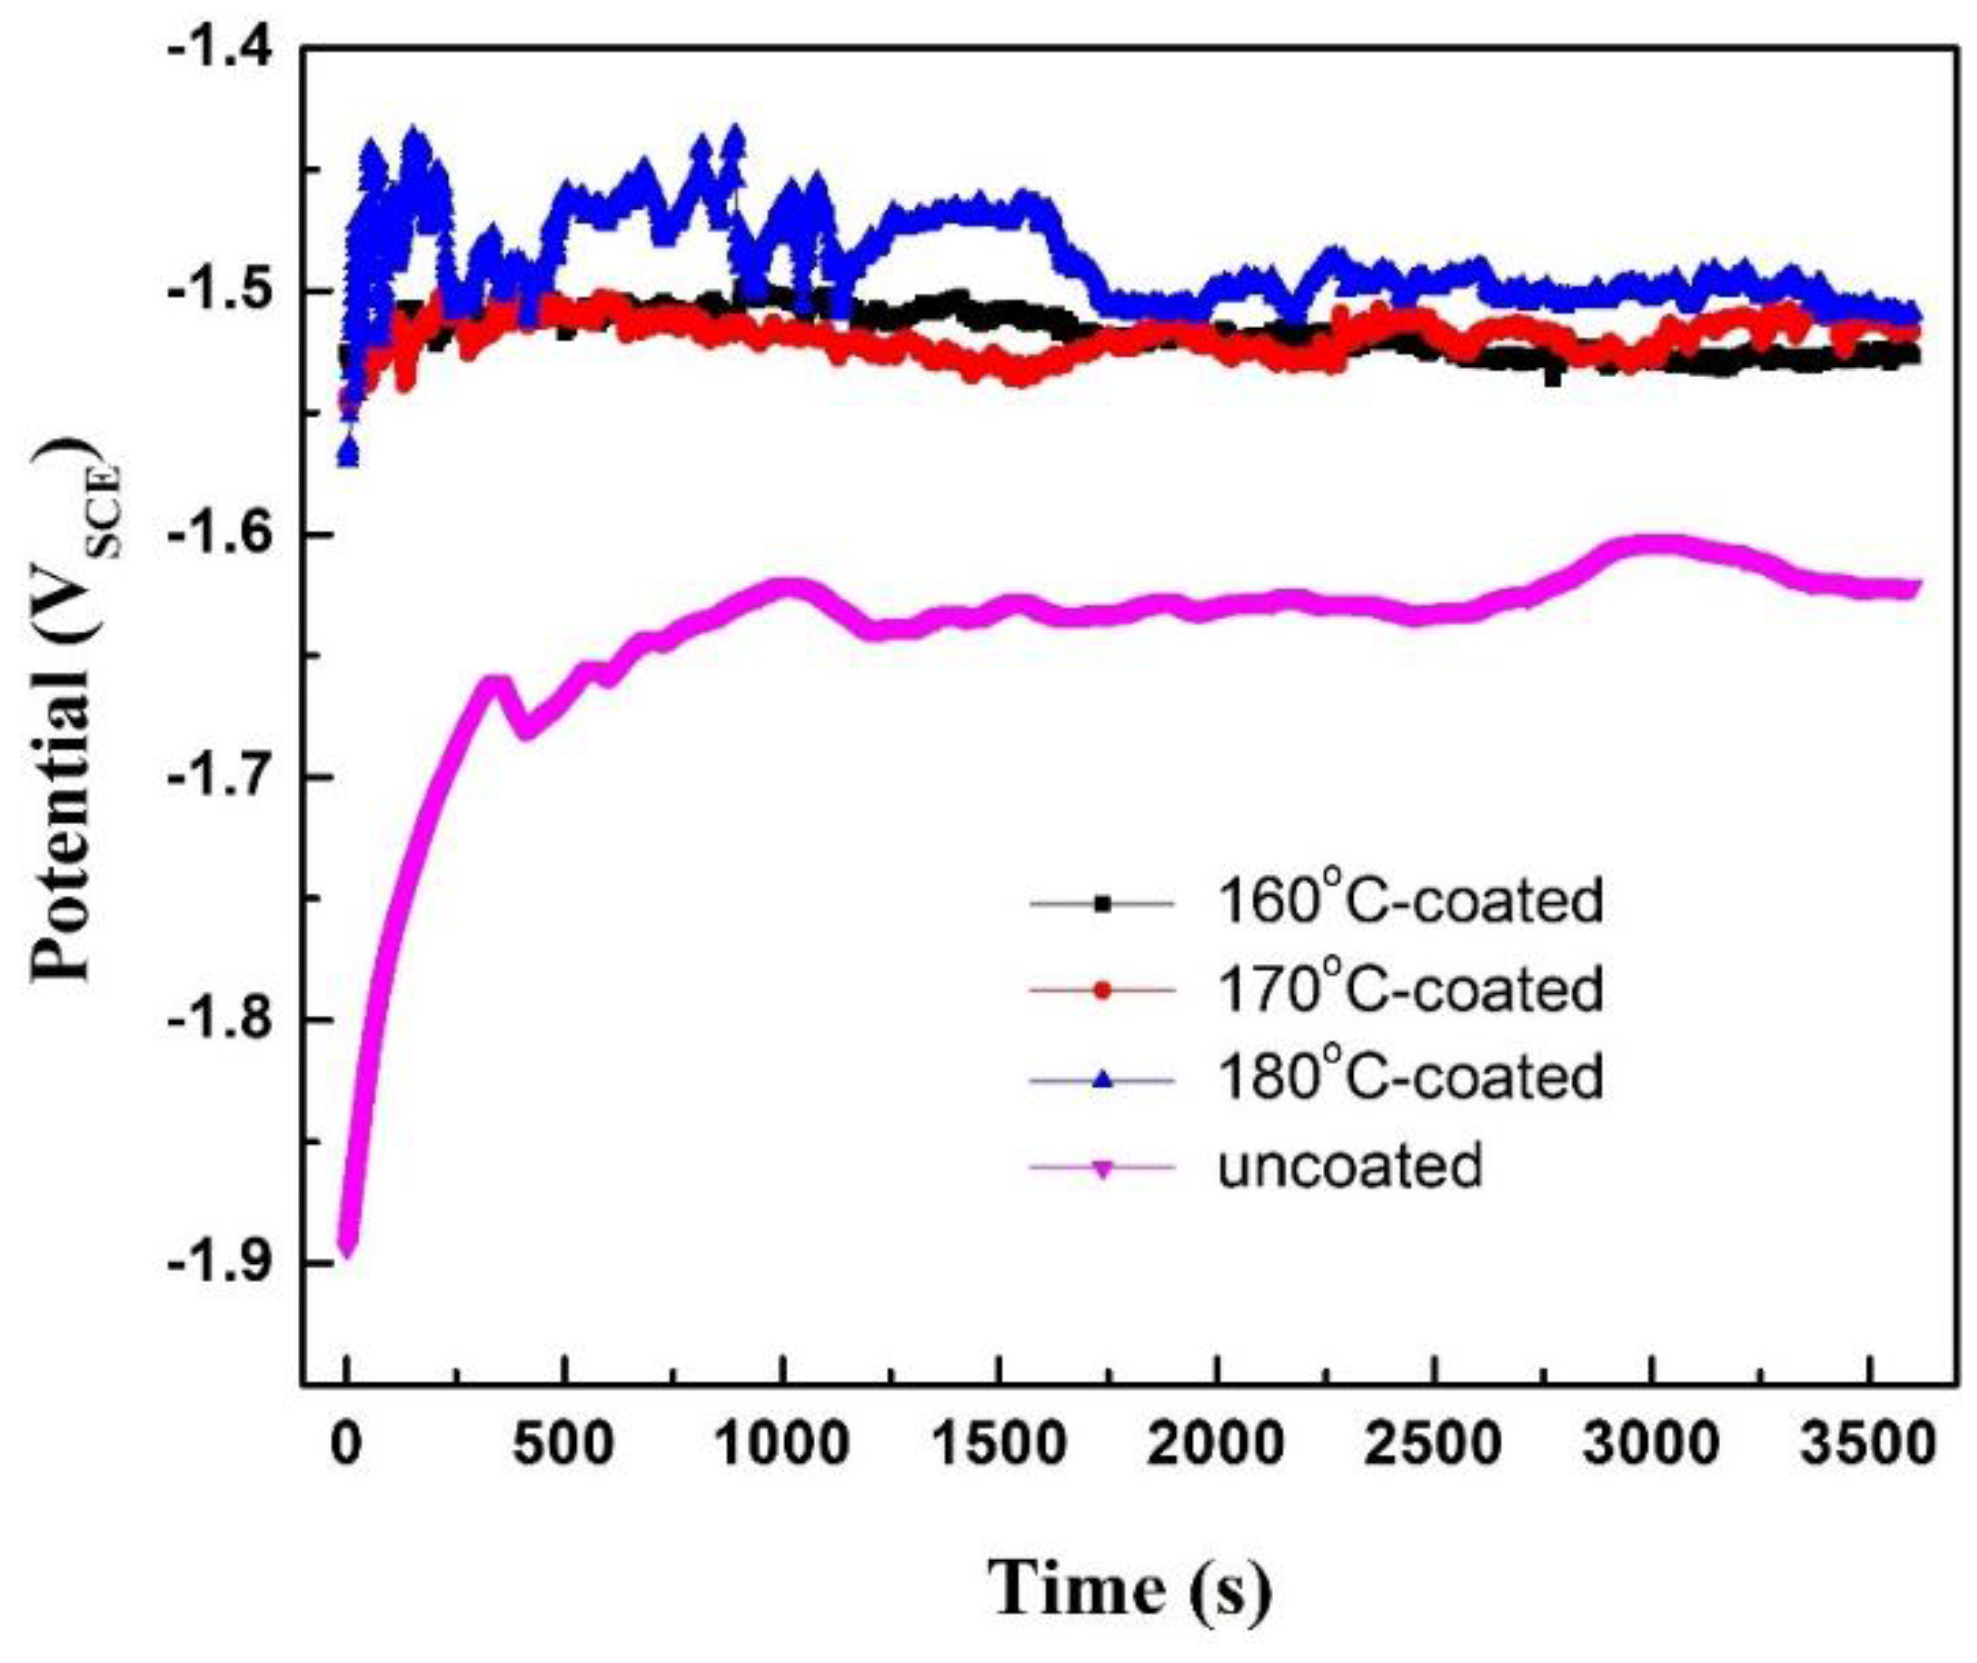
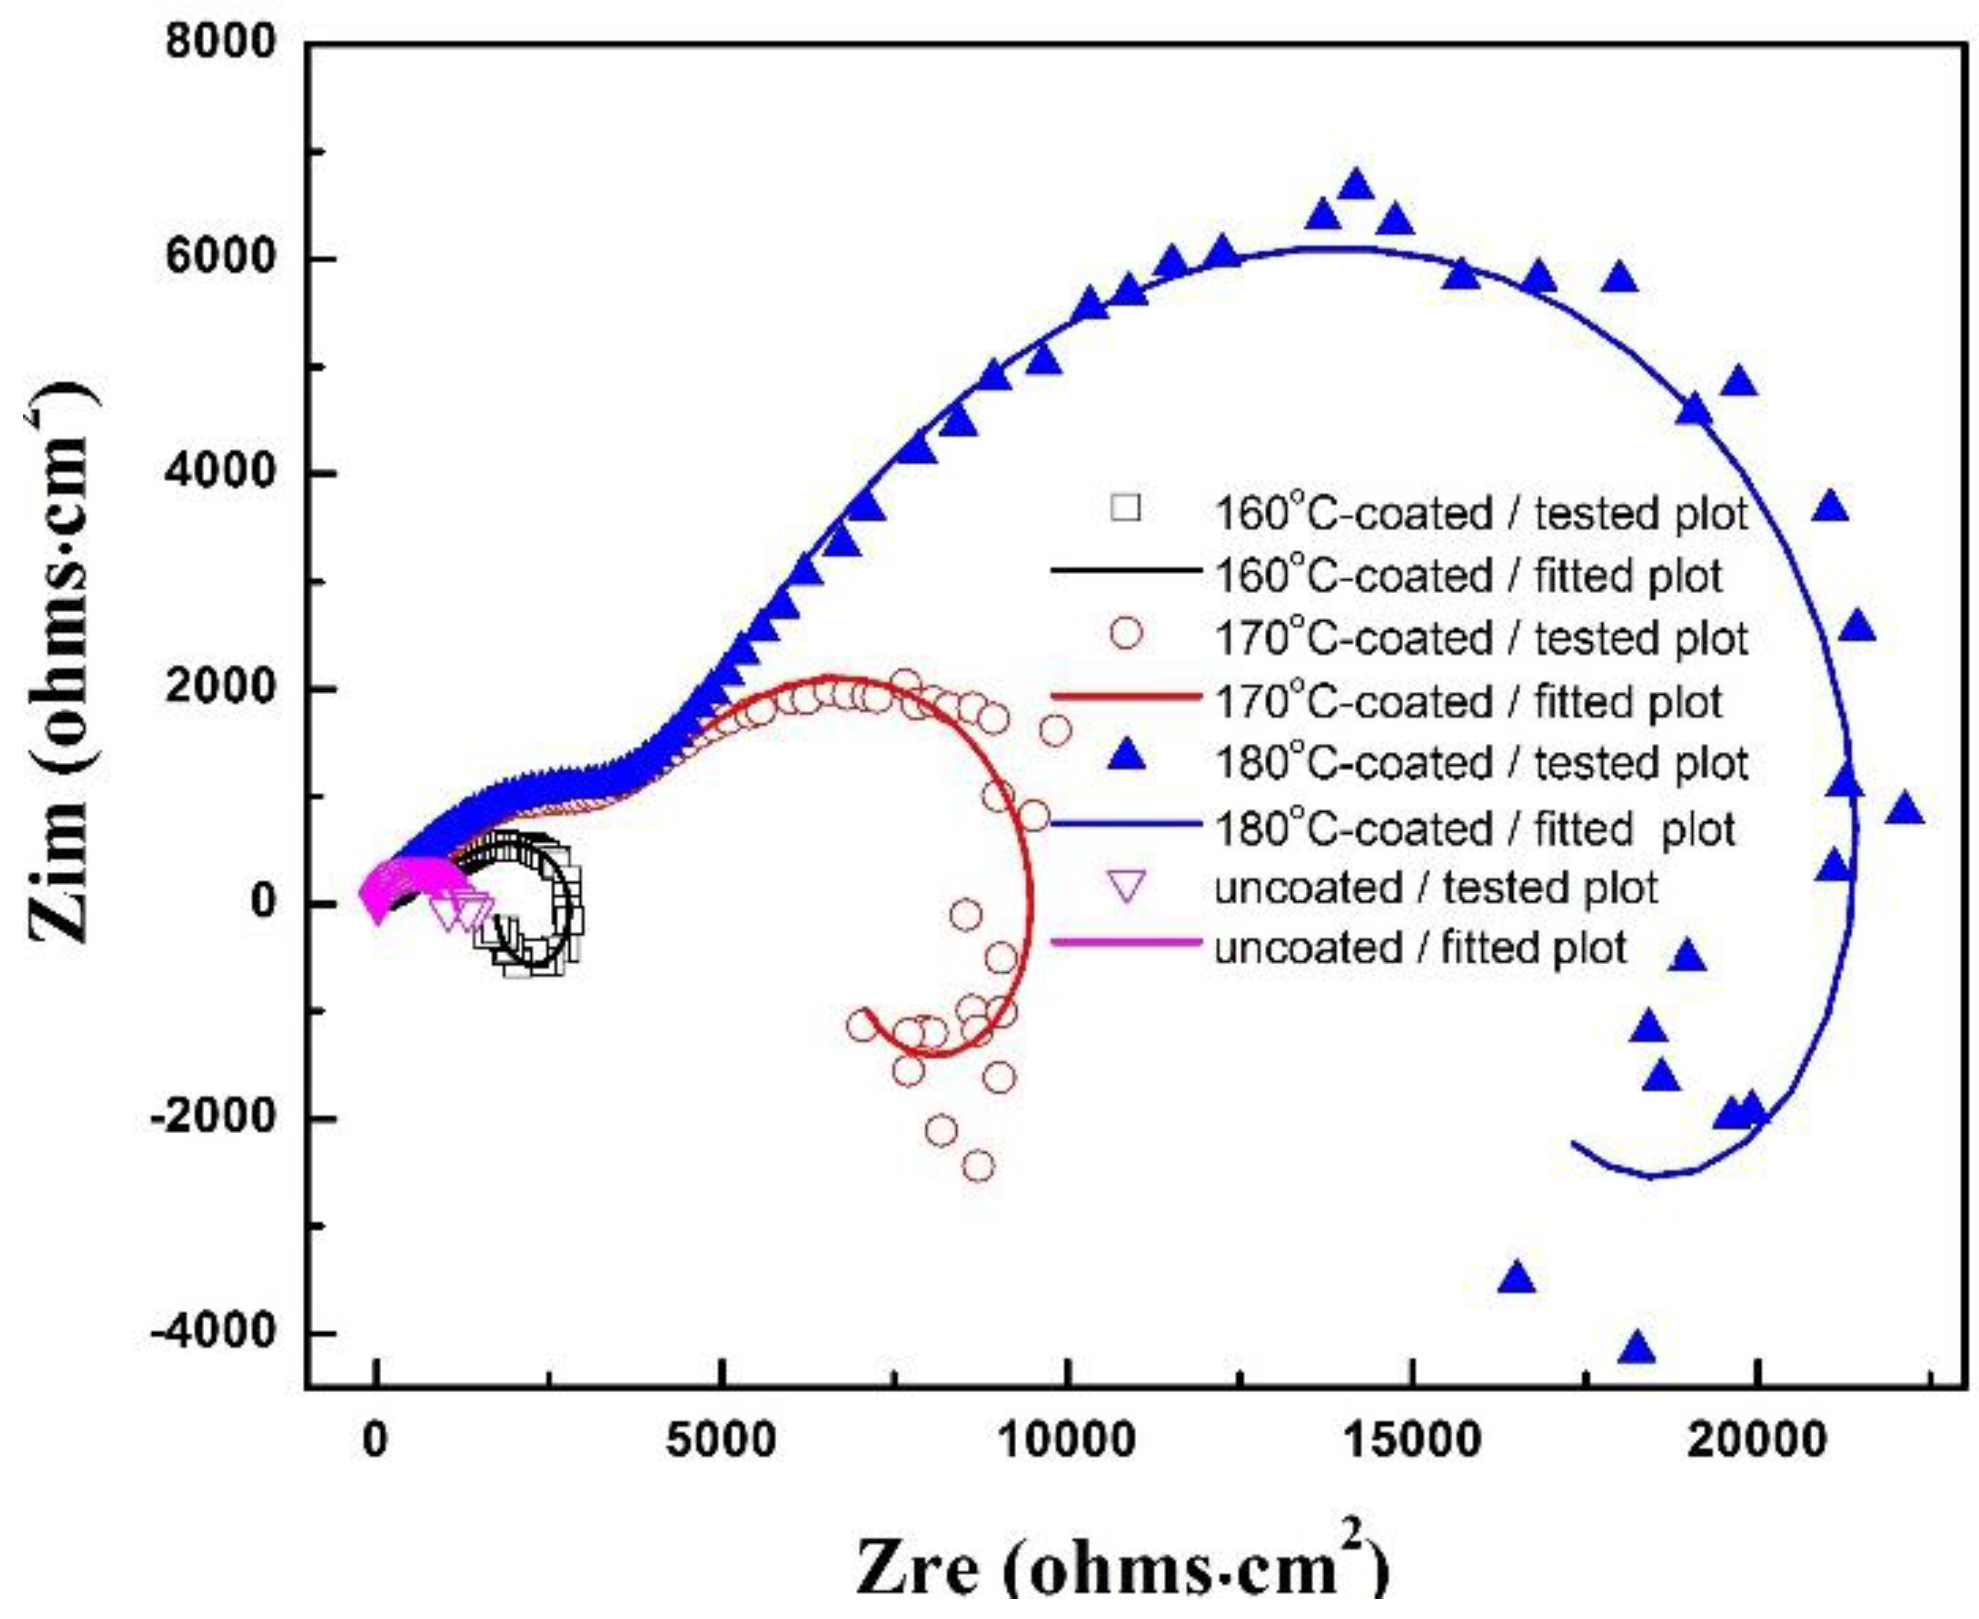
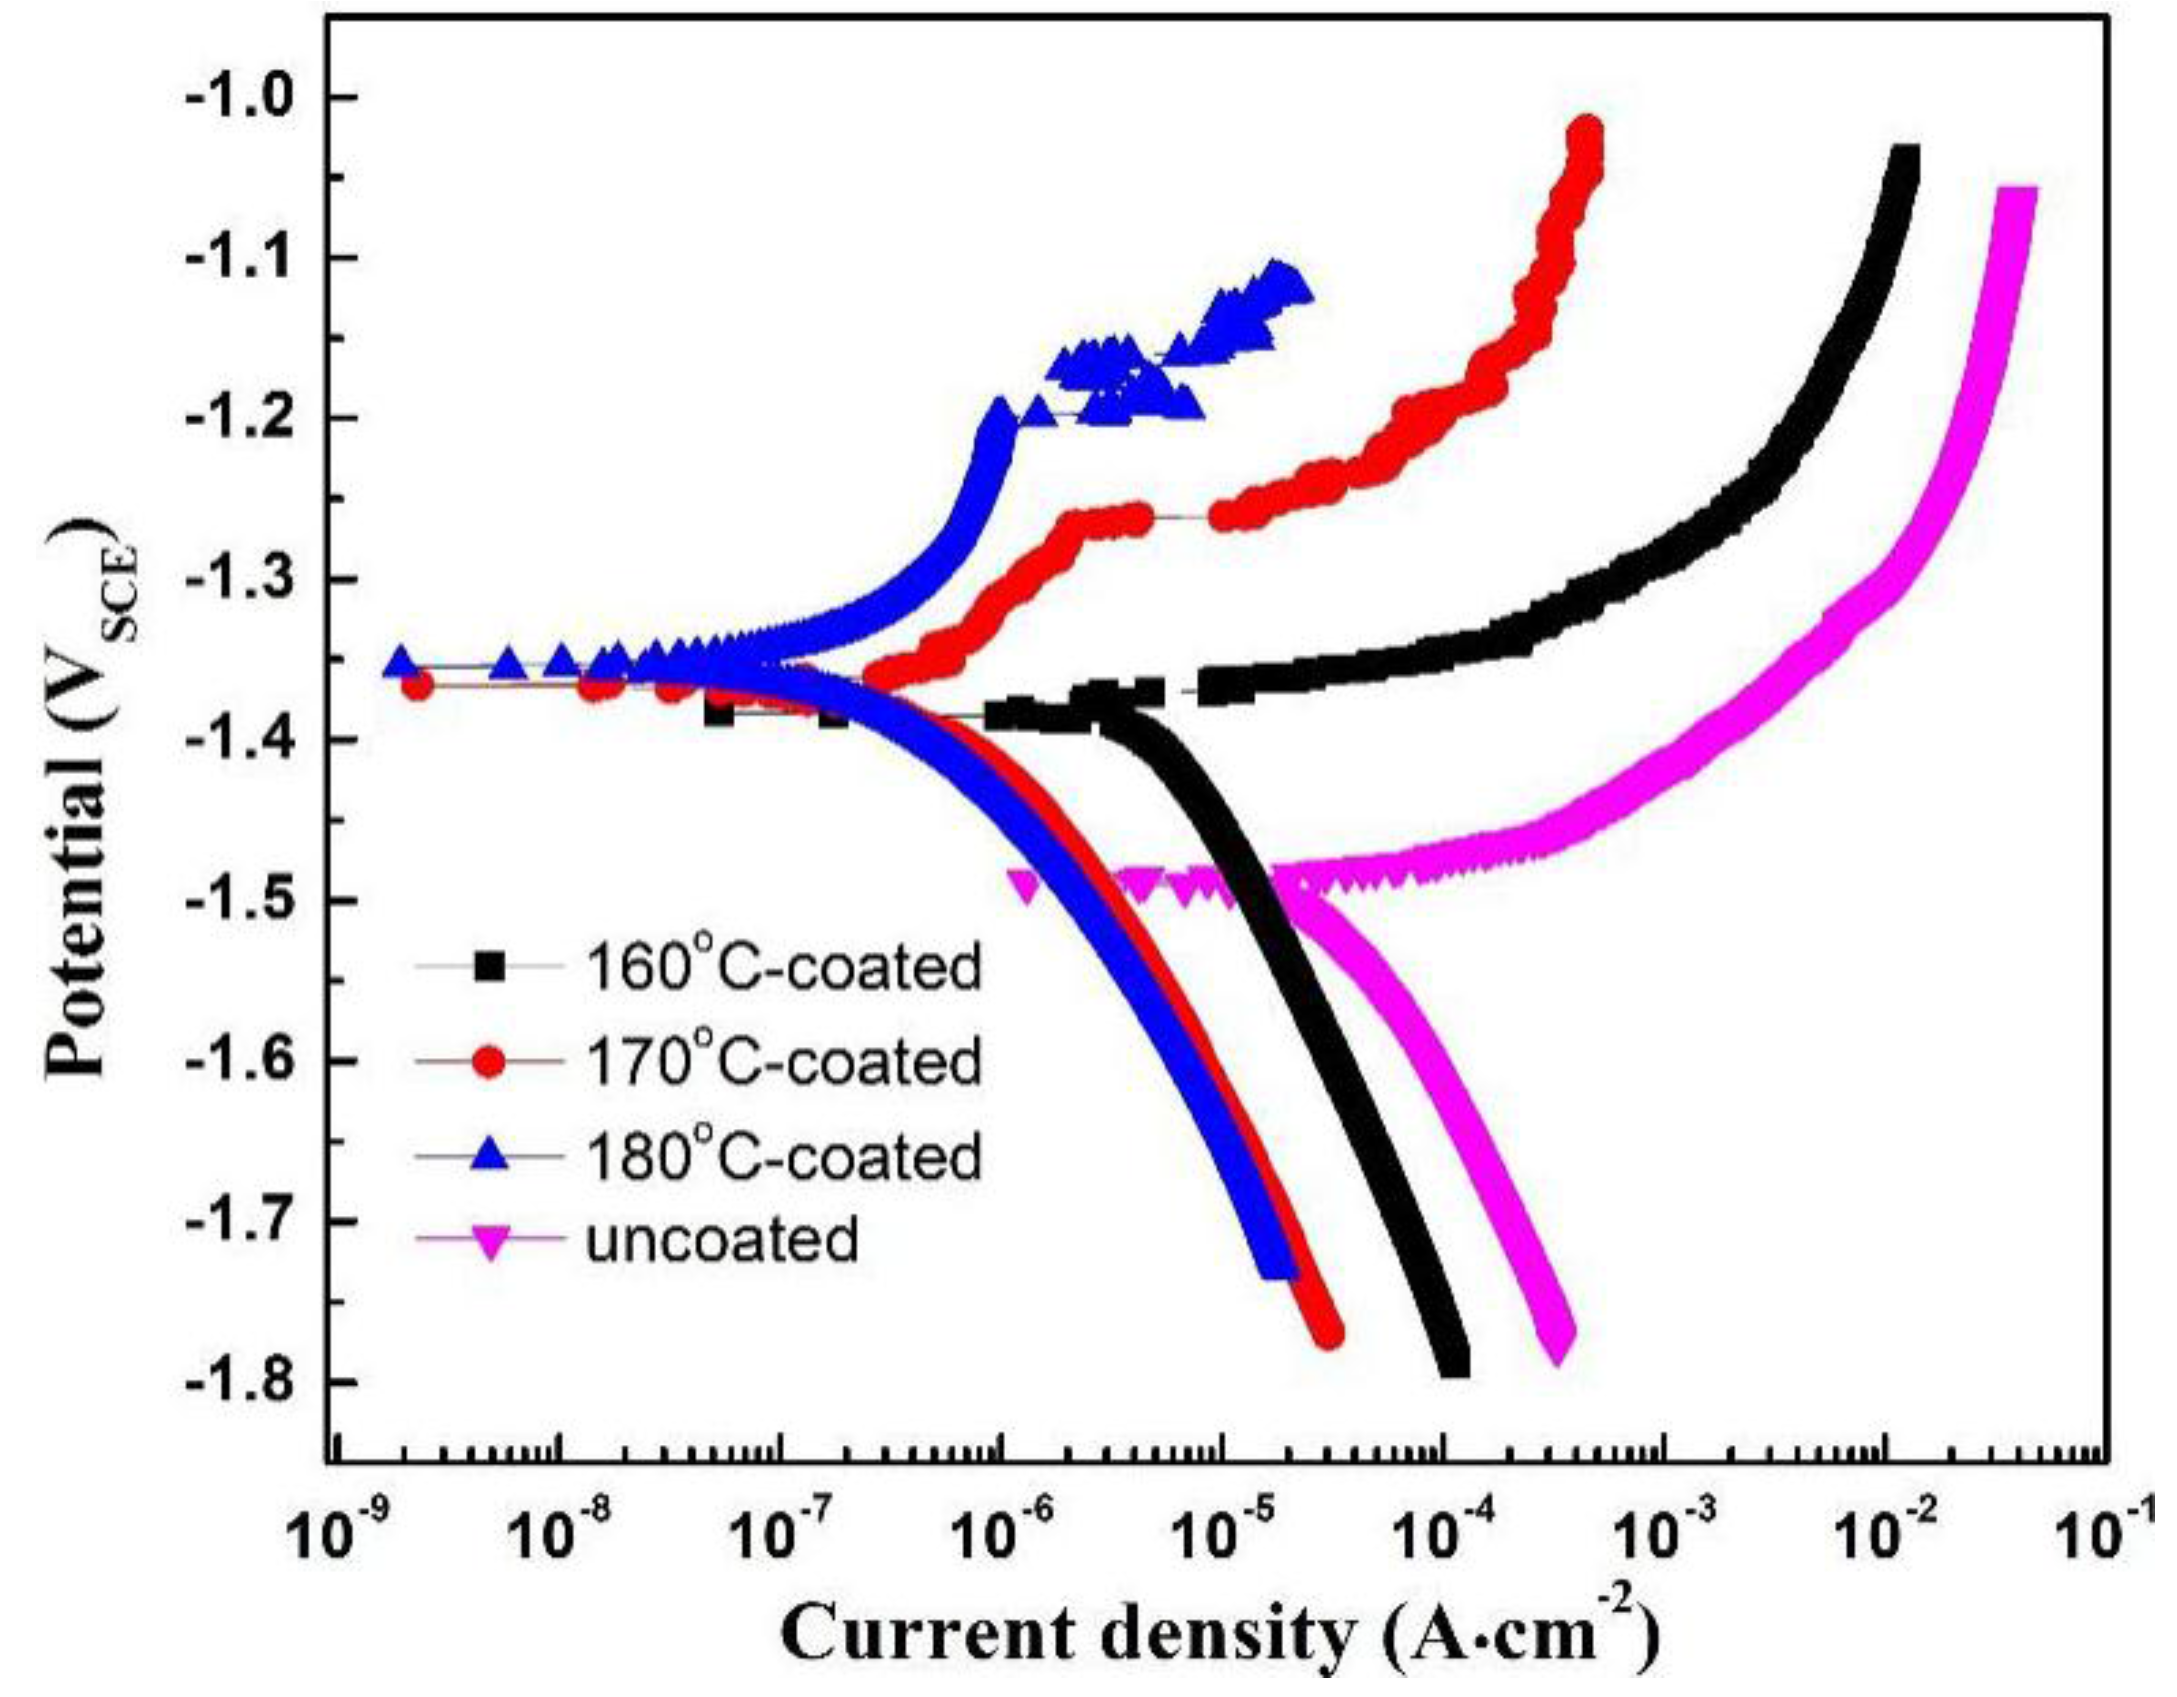
3.2. Electrochemical Properties of the Coatings

Electrochemical tests were performed to study the electrochemical properties of the coatings in the Hanks’ solution. Figure 6 presents the OCP curves of the samples immersed in Hanks’ solution during the initial 3600 s. Generally, the coated samples have nobler OCP values compared with the uncoated Mg alloy substrate. Note that the OCP values of the coated samples were actually determined by the mixed electrode potential of both the substrate and the coating layer. Therefore, one can infer that the coating layer of Mg(OH)2 would have much nobler potential in the Hanks’ solution. The 180 °C-coated samples has nobler OCP values compared with the 160 °C-coated and 170 °C-coated samples. Therefore, the nobler OCP value of the 180 °C-coated sample should be attributed to the thicker Mg(OH)2 coating layer. In contrast with the other two samples, the 180 °C-coated sample presents obvious fluctuation in OCP values in the initial immersion period for 1800 s. This phenomenon should be caused by the exchange of the aggressive medium across the coating and the corrosion reaction in the substrate. Because of the larger coating thickness and less compactness of the 180 °C-synthesized coating, it needs more time to get relatively stable OCP values.
EIS was further conducted to study the electrochemical characteristics of the coatings in the Hanks’ solution. As shown in Figure 7, all Nyquist plots of the coated samples are composed of two capacitive loops and one inductive loops. Moreover, the uncoated sample is composed of one capacitive loop and one inductive loop. The inductive loop demonstrates that all the samples have been corroded to some extent. As reported by Mosiałek [24], two capacitive loops are the typical Nyqusit plot of many coated samples, the high/low-frequency loop are related to EIS signal responded from the substrate/coating, respectively. It is noteworthy that both capacitive loops of the coating and substrate increased with the synthesizing temperature, and this phenomenon is most obvious in the 180 °C-coated sample. The capacitive loop diameter is associated with charge-transfer resistance, the larger diameter the better corrosion resistance the experimental sample has. The increased capacitive loop can be presented as the enhanced corrosion resistance of the coating and the less corrosion damage in the substrate. The Rs(Cf(Rp(CdlRt(RLL)))) equivalent circuit was used to simulate the EIS plots of the coated samples. This equivalent circuit was also used in Razavi’s research on biomedical coating of Mg alloys [25]. The Rs(CdlRt(RLL)) equivalent circuit was used to simulate the EIS plot of the uncoated sample. In the above models, Rs is the electrolyte solution resistance, Rp and Cf represent the microporous resistance and capacitance of the Mg(OH)2 coating, Cdl and Rt represent the double layer capacitance and the charge transfer resistance of the substrate, RL and L represent the inductive arc. The fitted parameters were listed in Table 3. The Rp value of the 180 °C-coated sample is about 14,800 ohms·cm2, which is 10 and 2.47 times larger than those of the 160 °C-coated sample (1480 ohms·cm2) and 170 °C-coated sample (6000 ohms·cm2), respectively.
PDP test was conducted to study the coatings’ positive effect against the corrosion propagation in the substrate under the situation of strong polarization, and the PDP curves are shown in the Figure 8. The corrosion potentials (Ecorr) and the corrosion current densities (Icorr) were derived directly from the PDP curves by the Tafel extrapolation method, and the results were summarized in Table 4. It can be noticed that the Ecorr values of the coated samples are much nobler than that of the uncoated sample, and their values also slightly increase with the elevating synthesizing temperature. The nobler Ecorr values should has direct relationship with the obtained coatings. Great difference can be found in the anodic polarization curves that the 170 °C-coated and 180 °C-coated samples present obvious anodic passivity in the voltage range of 150 mV above Ecorr, and the passivity of the 180 °C-coated sample is particularly evident. In contrast, the uncoated sample and the 160 °C-coated sample exhibits typical active dissolution behavior in the anodic polarization. In addition, the Icorr of the coated samples are extremely smaller than that of the uncoated sample, and drastically decrease as the synthesizing temperature increases. The Icorr value of the 180 °C-coated sample (2.78 × 10⁻⁷ A·cm−2) is decreased by nearly 20 and 200 times compared with those of the 160 °C-coated (5.42 × 10⁻⁶ A·cm−2) and uncoated sample (5.85 × 10⁻⁵ A·cm−2), respectively. As known, Icorr presents a kinetic characteristic of a given metal-electrolyte system, which can character the corrosion rate directly. The lower Icorr is, the less corrosion rate can be obtained. In our study, the corrosion current was created from the corrosion damage in Mg alloy substrate. Lower Icorr means less corrosion damage in the substrate of the 180 °C-coated sample, which also supports the better protection of its coating.

3.3. Effect of Synthesizing Temperaturse on the Coating Formation

It is generally believed that a hydrophobic surface can reduce the penetration of electrolyte and enhance the corrosion resistance of the coating system [26]. As a corrosion barrier, the microstructure of the conversion coating, such as thickness, compactness and uniformity, should play great role in the protective efficiency. In this research, thicker coatings with better electrochemical property were synthesized on the Mg-2Zn-0.5Mn-Ca-Ce alloy at higher temperatures. The increased synthesizing temperature lead to not only the significant coating thickening but also the great change in coating microstructures. The thinner coating and cross-cutting micro-cracks have been found in the lower-temperature synthesized sample (160 °C-coated sample). It is easier for the penetration of aggressive medium through a thin coating layer, and the penetration will also be accelerated via cross-cutting micro-cracks. As descripted in SEM observation, the cracks on the 160 °C-synthesized coating are mainly over the secondary phase. Due to the lower coating formation reaction and coating deposition on the secondary phase, less Mg(OH)2 crystals will be stacked on the secondary phase, the coating on this part will be much thinner than that on the α-Mg phase. During the drying process, the thinner coating layer over the secondary phase will crack as a result of the shrinking stress, leading to cross-cutting micro-cracks. As synthesizing temperature increased, thicker coatings were obtained on the substrate Mg alloy, and this phenomenon was particularly obvious in the 180 °C-coated sample. According to Y.Y. Zhu’s research [22], the ionization of water, the dissolution of Mg, and the formation of Mg(OH)2 coating during the hydrothermal synthesis processing can be accelerated by the elevated synthesizing temperature. Benefiting from the faster reaction and deposition of Mg(OH)2, more Mg(OH)2 crystals will be created and deposited, leading to obvious coating thickening on the α-Mg phase and the secondary phases. Due to the enhanced coverage on the secondary phase, the cracks on it will be reduced, and the cross-cutting micro-cracks will be gradually suppressed. Also, because of the more stacked Mg(OH)2, more internal micro-cracks were created of the 180 °C-synthesized coating due to the increased shrinking stress. The presence of internal micro-cracks will play negative role to against the penetration of corrosive medium. However, those internal micro-cracks are not connected continuously, which cannot provide a shortcut for the penetration of aggressive medium. Considering the positive effect of thicker coating and the negative effect of internal micro-cracks, the enhanced barrier effect of the 180 °C-synthesized coating should be attributed to the dominant effect of the thicker coating.

4. Conclusions

Mg(OH)2 conversion coatings were fabricated on an Mg-2Zn-Mn-Ca-Ce biomedical Mg alloy through the hydrothermal synthesizing method at three different temperatures (including 160, 170 and 180 °C). The obtained coatings were macroscopically uniform and compact, and provided an effective protection against corrosion in substrate Mg alloy.
With increased synthesizing temperatures, the coating thickening became more remarkable due to the faster formation reaction and deposition of Mg(OH)2 on both α-Mg phase and secondary phases of the substrate Mg alloy. Internal micro-cracks were also created in the higher-temperature synthesized coatings due to the increased shrinking stress, but the cross-cutting micro-cracks were suppressed.
Benefiting from the improved barrier effect against penetration of corrosive medium, the higher-temperature synthesized thicker coatings presented significantly enhanced electrochemical property and anti-corrosion efficiency in Hanks’ solution.

Acknowledgments

This work was supported by Natural Science Foundation of China (Grant No. 51308111), Joint innovation fund project of Jiangsu province of China (Grant No. 20155017912), the fundamental research funds for the central universities (Grant No. 2015B18614) and Qing Lan Project of Jiangsu Province of China.

Author Contributions

The work presented here was carried out in collaboration between all authors. Dan Song, Jinghua Jiang and Aibin Ma defined the research theme. Guanghui Guo, Liwen Zhang and Cheng Li designed methods and experiments, carried out the laboratory experiments, analyzed the data, interpreted the results and wrote the paper. All authors have contributed to, seen and approved the manuscript. The author hopes that this paper can make its due contribution to the successful application of the high-performance Mg alloy implant.

Conflicts of Interest

The authors declare no conflict of interest.

References

  1. Mani, G.; Feldman, M.D.; Patel, D.; Agrawal, C.M. Coronary stents: A materials perspective. Biomaterials 2007, 28, 1689–1710. [Google Scholar] [CrossRef] [PubMed]
  2. Witte, F.; Hort, N.; Vogt, C.; Cohen, S.; Kainer, K.U.; Willumeit, R.; Feyerabend, F. Degradable biomaterials based on magnesium corrosion. Curr. Opin. Solid State Mater. Sci. 2008, 12, 63–72. [Google Scholar] [CrossRef]
  3. Witte, F. The history of biodegradable magnesium implants: A review. Acta Biomater. 2010, 6, 1680–1692. [Google Scholar] [CrossRef] [PubMed]
  4. Mordike, B.L.; Ebert, T. Magnesium: Properties—applications—potential. Mater. Sci. Eng. A 2001, 302, 37–45. [Google Scholar] [CrossRef]
  5. Xin, Y.; Hu, T.; Chu, P.K. In vitro studies of biomedical magnesium alloys in a simulated physiological environment: A review. Acta Biomater. 2011, 7, 1452–1459. [Google Scholar] [CrossRef] [PubMed]
  6. Sun, Y.; Zhang, B.P.; Wang, Y.; Geng, L.; Jiao, X.H. Preparation and characterization of a new biomedical Mg-Zn-Ca alloy. Mater. Des. 2012, 34, 58–64. [Google Scholar] [CrossRef]
  7. Gu, X.; Zheng, Y.; Cheng, Y.; Zhong, S.; Xi, T. In vitro corrosion and biocompatibility of binary magnesium alloys. Biomaterials 2009, 30, 484–498. [Google Scholar] [CrossRef] [PubMed]
  8. Zhou, W.; Shen, T.; Aung, N.N. Effect of heat treatment on corrosion behaviour of magnesium alloy AZ91D in simulated body fluid. Corros. Sci. 2010, 52, 1035–1041. [Google Scholar] [CrossRef]
  9. Tsai, M.H.; Chen, M.S.; Lin, L.H.; Lin, M.H.; Wu, C.Z.; Ou, K.L.; Yu, C.H. Effect of heat treatment on the microstructures and damping properties of biomedical Mg-Zr alloy. J. Alloy. Compd. 2011, 509, 813–819. [Google Scholar] [CrossRef]
  10. Cui, X.J.; Lin, X.Z.; Liu, C.H.; Yang, R.S.; Zheng, X.W.; Gong, M. Fabrication and corrosion resistance of a hydrophobic micro-arc oxidation coatingon AZ31 Mg alloy. Corros. Sci. 2015, 90, 402–412. [Google Scholar] [CrossRef]
  11. Atrens, A.; Cao, F.; Shi, Z.; Dargusch, M.S. 3-Corrosion of Mg for Biomedical Applications. In Surface Coating Modification of Metallic Biomaterials; Woodhead Publishing: Cambridge, UK, 2015; pp. 1–102. [Google Scholar]
  12. Hornberger, H.; Virtanen, S.; Boccaccini, A.R. Biomedical coatings on magnesium alloys—A review. Acta Biomater. 2012, 8, 2442–2455. [Google Scholar] [CrossRef] [PubMed]
  13. Zhang, R.F.; Zhang, Y.Q.; Zhang, S.F.; Qu, B.; Guo, S.B.; Xiang, J.H. Formation process of micro arc oxidation coatings obtained in a sodium phytate containing solution with and without CaCO3 on binary Mg-1.0Ca alloy. Appl. Surf. Sci. 2015, 325, 79–85. [Google Scholar] [CrossRef]
  14. Razavi, M.; Fathi, M.; Savabi, O.; Beni, B.H.; Vashaee, D.; Tayebi, L. Nanostructured merwinite bioceramic coating on Mg alloy deposited by electrophoretic deposition. Ceram. Int. 2014, 40, 9473–9484. [Google Scholar] [CrossRef]
  15. Jiang, X.J.; Guo, R.G.; Jiang, S.Q. Microstructure and corrosion resistance of Ce-V conversion coating on AZ31 magnesium alloy. Appl. Surf. Sci. 2015, 341, 166–174. [Google Scholar] [CrossRef]
  16. Lu, Y.J.; Wan, P.; Tan, L.L.; Zhang, B.C.; Yang, K.; Lin, J.X. Preliminary study on a bioactive Sr containing Ca-P coating on pure magnesium by a two-step procedure. Surf. Coat. Technol. 2014, 252, 79–86. [Google Scholar] [CrossRef]
  17. Jeong, H.; Yoo, Y. Synthesis and characterization of thin films on magnesium alloy using a hydrothermal method. Surf. Coat. Technol. 2015, 284, 26–30. [Google Scholar] [CrossRef]
  18. Tomozawa, M.; Hiromoto, S. Growth mechanism of hydroxyapatite-coatings formed on pure magnesium and corrosion behavior of the coated magnesium. Appl. Surf. Sci. 2011, 257, 8253–8257. [Google Scholar] [CrossRef]
  19. Zhang, F.; Ma, A.B.; Song, D.; Jiang, J.H.; Lu, F.M.; Zhang, L.Y.; Yang, D.H.; Chen, J.Q. Improving in-vitro biocorrosion resistance of Mg-Zn-Mn-Ca alloy in Hanks’ solution through addition of cerium. J. Rare Earth 2015, 33, 93–101. [Google Scholar] [CrossRef]
  20. Zhu, Y.Y.; Wu, G.; Zhang, Y.H.; Zhao, Q. Growth and characterization of Mg(OH)2 film on magnesium alloy AZ31. Appl. Surf. Sci. 2011, 257, 6129–6137. [Google Scholar] [CrossRef]
  21. Gupta, R.K.; Mensah-Darkwa, K.; Kumar, D. Corrosion protective conversion coatings on magnesium disks using a hydrothermal technique. J. Mater. Sci. Technol. 2014, 30, 47–53. [Google Scholar] [CrossRef]
  22. Zhu, Y.Y.; Zhao, Q.; Zhang, Y.H.; Wu, G.M. Hydrothermal synthesis of protective coating on magnesium alloy using de-ionized water. Surf. Coat. Technol. 2012, 206, 2961–2966. [Google Scholar] [CrossRef]
  23. Zhou, W.; Shan, D.; Han, E.H.; Ke, W. Structure and formation mechanism of phosphate conversion coating on die-cast AZ91D magnesium alloy. Corros. Sci. 2008, 50, 329–337. [Google Scholar] [CrossRef]
  24. Mosiałek, M.; Mordarski, G.; Nowak, P.; Simka, W.; Nawrat, G.; Hanke, M.; Socha, R.P. Phosphate-permanganate conversion coatings on the AZ81 magnesium alloy: SEM, EIS and XPS studies. Surf. Coat. Technol. 2011, 206, 51–62. [Google Scholar] [CrossRef]
  25. Rzazvi, M.; Fathi, M.; Savabi, O.; Vashaee, D.; Tayebi, L. In vitro study of nanostructured diopside coating on Mg alloy orthopedic implants. Mater. Sci. Eng. C 2014, 41, 168–177. [Google Scholar] [CrossRef] [PubMed]
  26. Chiu, K.Y.; Wong, M.H.; Cheng, F.T.; Man, H.C. Characterization and corrosion studies of fluoride conversion coating on degradable Mg implants. Surf. Coat. Technol. 2007, 202, 590–598. [Google Scholar] [CrossRef]
Figure 1. Microstructure of the Mg alloy.
Metals 06 00044 g001
Figure 2. XRD patterns of the samples.
Metals 06 00044 g002
Figure 3. Macro morphologies of the coated samples. (a) 160 °C-coated; (b) 170 °C-coated; (c) 180 °C-coated.
Metals 06 00044 g003
Figure 4. SEM surface morphologies of the coated samples at low and high magnification. (a) and (b) are 160 °C-coated sample; (c) and (d) are 170 °C-coated sample; (e) and (f) are 180 °C-coated sample.
Metals 06 00044 g004
Figure 5. SEM cross-sectional morphologies of the coated samples at low and high magnification. (a) and (b) are 160 °C-coated sample; (c) and (d) are 170 °C-coated sample; (e) and (f) are 180 °C-coated sample.
Metals 06 00044 g005
Figure 6. Open circuit potential (OCP) curves of the samples.
Metals 06 00044 g006
Figure 7. Electrochemical impendence spectroscopy (EIS) Nyquist plots of the samples.
Metals 06 00044 g007
Figure 8. Potentiodynamic polarization (PDP) curves of the samples.
Metals 06 00044 g008
Table 1. Chemical composition of Mg-2Zn-0.5Mn-Ca-Ce alloy (wt.%).
ZnMnCaCeMg
2.000.501.021.35balance
Table 2. Chemical composition of Hanks’ solution.
SolutionChemical Composition (mM)
NaClCaCl2MgSO4KClKH2PO4Na2HPO4d-GlucoseNaHCO3
Hanks’1371.2610.8145.330.440.3385.564.17
Table 3. Fitted EIS parameters of the samples.
SampleRs (Ω·cm2)Cf (10−6 F·cm−2)Rp (Ω·cm2)Cdl (10−6 F·cm−2)Rt (Ω·cm2)
uncoated24.67//128.4847
160 °C-coated14.9631.1148071.81204
170 °C-coated13.1919.2600037.52148
180 °C-coated10.3612.81480026.14830
Table 4. Ecorr and Icorr values obtained from the PDP curves.
SamplesEcorr (V)Icorr (A·cm−2)
uncoated−1.4865.85 × 10−5
160 °C-coated−1.3835.42 × 10−6
170 °C-coated−1.3664.59 × 10−7
180 °C-coated−1.3542.78 × 10−7

