Article

Investigation of Tantalum Recycling by Electron Beam Melting

1
Institute of electronics, Bulgarian Academy of Sciences, 72 Tzarigradsko shosse, Sofia 1784, Bulgaria
2
Centre for Materials for Electronics Technology, Panchawati, Off Pashan Road, Pune 411 008, India
3
School of Mechanical Engineering, Sungkyunkwan University, Gyeonggi-Do, Suwon 16419, South Korea
4
Hiroshima Institute of Technology, 2-1-1, Miyake, Saeki-ku, Hiroshima 731-5193, Japan
*
Author to whom correspondence should be addressed.
Metals 2016, 6(11), 287; https://doi.org/10.3390/met6110287
Submission received: 5 October 2016 / Revised: 6 November 2016 / Accepted: 10 November 2016 / Published: 21 November 2016

Abstract

:
Investigations are carried out and obtained experimental and theoretical data for tantalum scrap recycling by electron beam melting (EBM) is presented in this paper. Different thermal treatment process conditions are realized and results are discussed. A chemical analysis is performed and refining mechanisms for electron beam (EB) refining of Ta are discussed. For the performed experiments the best purification of Ta (99.96) is obtained at 21.6 kW beam power for a melting time of 3 min. A statistical approach is applied for estimation of the material losses and the liquid pool characteristics based on experimentally-obtained data. The aim is to improve the EBM and choosing optimal process conditions, depending on the concrete characteristic requirements. Model-based quality optimization of electron beam melting and refining (EBMR) processes of Ta is considered related to the optimization of the molten pool parameters, connected to the occurring refining processes, and to minimal material losses. Optimization of the process of EBM of Ta is based on overall criteria, giving compromised solutions, depending on the requirements concerning the quality of the performed products. The accumulated data, the obtained results, and the optimization statistical approach allow us to formulate requirements on the process parameters.

1. Introduction

Electron beam melting (EBM) has been widely used as an established physical method for melting and refining of materials [1,2,3,4,5,6,7,8]. It assures a superior level of refining and a high level of flexibility of the e-beam heat source (high energy density). This technology is mainly used for melting and refining of refractory and reactive metals, such as tantalum [9,10], niobium [6,11], ruthenium [12], molybdenum [13], iridium [14], vanadium, titanium [7,15,16,17], etc., and their alloys. This method plays an important role in the production of ultrapure sputtering target materials and electronic alloys [9,12], in metal regeneration from waste products [3,18], in the metallurgical-grade silicon purification for the photovoltaic industry [8,19,20,21], etc.
Each one of these materials (including the refractory metals) is made in a unique way. In previous applications or processing the metals were enriched with impurities, so the selective removal of the contaminants from the used metals is crucial [22]. The aim of the e-beam refining process is the superior refining level of gases, metals, and non-metal inclusions. As a result of this, there is a need to look for specific technological schemes for e-beam refining for different initial resources and for each particular furnace.
A thorough knowledge of the heat transfer and refining processes is needed for the successful application of EBM, for the optimization of the technology, and for the improvement of the quality of the obtained pure metal. The researchers, developing certain technologies, constantly deal with the problem of in-depth knowledge and understanding of the limiting processes and factors, which define the geometry of the molten pool, the temperature field distributions in the material, and the behaviour of the metals and their alloys during the refining process. Real-time information and measurements, especially in the liquid metal pool are difficult to acquire and the complexity of e-beam melting and refining makes the process control particularly challenging [23]. Therefore, theoretical investigation and application of different approaches—numerical, statistical, heuristic, etc. [4,18,24,25,26,27,28,29,30,31,32,33,34,35,36,37,38]—are essential for the understanding and optimization of e-beam melting and refining technology. Consequently, modeling and mathematical optimization of the process parameters are important and key to improving the quality of the obtained pure metal, depending on the concrete characteristic requirements.
Stationary, quasi-stationary, or non-stationary heat transfer models and the numerical study of complex processes at the interaction of intensive electron beams with materials have been reported for different e-beam melting techniques developed to meet some specific requirements [25,26,27,28,29,31,33]. Investigation aided by an e-beam button furnace and a numerical model for studying the electron beam melting of Al (rich)–Ti solids in liquid titanium are presented in [34]. A numerical method concerning the investigation of the removal of volatile impurities in molten silicon by e-beam melting is presented in [35]. For e-beam melting, optimization criteria related to the geometry of the molten pool for improvement of the quality of the obtained pure metals and optimization problems are proposed [25,30,32], while a heuristic approach is used for the investigation of the flatness of the crystallization front in [37]. For the optimization of EBM process parameters for titanium a statistical approach is applied [18] and, in [38], optimum process parameters, obtained from thermal equilibrium calculation and evaporation loss control of e-beam melting of tungsten, are shown.
Investigations are carried out and experimental and theoretical data dealing with the relation of process parameters and the removal of impurities in tantalum recycling by e-beam melting in a vacuum is presented in this paper. Different technological regimes (different power inputs and heating times) are realized and results are discussed. Process conditions for electron beam (EB) melting of tantalum are investigated, applying a statistical approach and the data and dependencies concerning the liquid pool variation, material losses, etc., are, thus, obtained. Model-based quality optimization of the electron beam melting and refining process (EBMR) of tantalum is considered related to the optimization of the molten pool characteristics, connected to the occurring refining processes and to minimal material losses.

2. Experimental Investigation of EBMR of Tantalum

The experiments were performed in the ELIT-60 electron beam furnace (Leybold GmbH, Cologne, Germany, Institute of electronics at the Bulgarian Academy of Sciences (IE-BAS), Sofia, Bulgaria) with capacity 60 kW and accelerating voltage of 24 kV in the laboratory “Physical problems of electron beam technologies”, IE-BAS. The e-beam installation ELIT-60 is composed of the melting chamber, one electron gun (the heating source), vacuum system, and feeding and extraction system (the molten material solidified in the water-cooled copper crucible)—Figure 1. The vacuum system is made of double sets of a rotary pump, an oil-diffusion pump for maintaining an operation pressure in the melting chamber about 5–8 × 10⁻³ Pa, and one turbo-molecular pump, set for the electron gun.
Experiments for tantalum regeneration from waste products were conducted using the ELIT 60 installation. Discarded capacitors from electronic circuits, anodes, grids, and other elements after compacting in the form of disks with a diameter of 50 mm and a height of 20 mm were the source (initial) material for e-beam melting of Ta. Chemical analysis of the samples was conducted before and after EBMR was performed by using emission spectral analysis. The purity of the initial material was Ta 99.8% and the concentration of each of the controlled metal impurities (W, Mn, Nb, Cr, Ce, K, Na, Al, Mo, Fe, As) was less than 650 ppm.
The EBMR experiments of the “disk melting method” type (the sample is situated in the crucible and the central part of disk top surface is heated by the electron beam) were performed for Ta and different technological regimes (conditions) were realized (Figure 1a). The investigation is carried out and attention is paid to the influence of the EBM process parameters of the electron beam power (Pb) and melting time (τ) on the refining processes. The experiments were conducted for the following values of the e-beam power and the refining time: Pb = 18, 20, and 21.6 kW and τ = 2, 3, 7, and 20 min (Table 1). Data for the overall concentration of all of the impurities of the sample after e-beam melting for each technological regime of refining is presented in Table 2. The results show that, for the performed experiments, the best purification of Ta (99.96) is obtained during prolonged melting with low electron beam power (τ = 20 min and Pb = 18 kW) or during short refining with higher beam power (τ = 3 min and Pb = 21.6 kW). For these regimes the overall removal efficiency η = 80% (removal efficiency of all the impurities of the sample) was achieved.
The reaction of the base metal and of its impurities with oxygen can be presented by equations shown in Table 3. The conditions for the reactions’ execution and for thermodynamic equilibrium of the system are defined by the laws of the chemical thermodynamics. According to the thermodynamics laws each of the reactions takes place simultaneously if, at the EBMR conditions (high temperature and vacuum), the requirement ΔF < 0, concerning the value of free energy ΔF, is satisfied. Table 3 shows the values of free energy (ΔF) at a vacuum pressure of 10−3 Pa, and taking into consideration the working temperatures and atmospheric pressure (ΔF°). From the thermodynamics point of view the chemical interactions for the studied metals will be executed in the vacuum conditions in the direction of the dissociation of the metal oxides (Table 3).
Depending on the thermodynamic melting conditions and on the removed components, the metal refining could be realized through one of the following two purification methods: (i) degassing—removal of components with vapor pressure pi, which is higher than the vapor pressure of the re-melted base metal pTa, i.e., pi > pTa; (ii) distillation—evaporation of more volatile compounds of the metallic components. In Figure 2 values of the partial pressures of tantalum and the controlled metal components, at EBMR conditions, are shown. At the conditions of e-beam melting the inequality pi > pTa is satisfied for all controlled components (the vapor pressure values for the impurities are significantly greater—more than two orders than the pressure of the re-melted base metal) and their refining is realized through the evaporation of these impurities from the reaction surface.
Refining processes take place mainly at the molten metal/vacuum interface where heterogeneous reactions simultaneously occur. Multiple phenomena, such as the removal rate from the surface, the matter velocity towards the interface surface, the chemical reactions, the conditions concerning the heat transfer, etc., taking place at this interface influence the overall rate of reactions. The rate of some processes, such as degassing, evaporation of volatile components, reduction, etc., at given conditions can become so low that it limits the overall refining process. Actual liquid surface-to-liquid volume ratio controls the limitations of the removal of impurities by (i) evaporation from the liquid metal surface and (ii) mass-transport processes through the liquid pool to the top of the ingot, crystallizing in the water-cooled crucible. In order to define the process which limits the refining process, the criterion [40,41]: CS,i/CV,i = kdiff,i/(kdiff,i + kev,i) for the controlled impurities is used, where CS,i is the concentration of a specific impurity at the liquid metal pool/vacuum interface, CV,i is the concentration of a specific impurity in the molten metal volume, kdiff,i and kev,i are the kinetic coefficients of diffusion and evaporation, respectively.
The controlled impurities form two groups based on the used criterion for defining the process, which limits the refining of each of the controlled impurities. The detailed analysis shows that for some of the impurities, such as W (Table 4), Mn, Nb, Cr, Ce, K, and Na, their concentration in the molten metal volume (CV,i), measured after EBMR, is approximately equal to their concentration (CS,i) at the liquid metal pool/vacuum reactive interface (the difference between CV,i and CS,i is in the range of the chemical analysis error concerning the concentration of the metal impurities. i.e., 10 ppm). This means that kdiff,i >> kev,i, i.e., the process is kinetics-limited and the refining depends on the evaporation of the impurity. For these impurities the defining reaction for the refining is the evaporation of the metal impurity from the molten metal/vacuum reactive interface. The refining strongly depends on the temperature of overheating of the liquid pool (respectively, the e-beam power). The influence of the refining time is greater when it comes to the lower e-beam powers (Pb = 18 kW), when the temperature at the top surface of the liquid metal pool is lower and the evaporation is not as intense. When heating with beam power Pb ≥ 20 kW the refining takes place mainly during the first three minutes, after which the refining processes slow down and even a relative concentration increase in the final chemical composition is possible for some of those impurities (such as Mn, Nb).
The results presented in Table 4 show that the concentrations of W in the volume (CV,W) and at the liquid metal pool/vacuum interface (CS,W) are approximately the same under every one of the regimes, i.e., the rate of evaporation of W from this interface, which depends on the temperature, is defining the refining process rate. When increasing the e-beam power (and, respectively, the temperature), the concentration of W in the refined metal decreases 10 times, reaching up to 10 ppm at 21.6 kW beam power and 20 min melting time. The residence times in the liquid metal pool also influences the tungsten removal. For these impurities (W, Mn, Nb, Cr, Ce, K, Na), for which the evaporation from the interface liquid metal pool/vacuum is a limiting process, the temperature and the area of the evaporation surface are very important. Maximal removal of tungsten (as a representative of these impurities with highest initial concentration C0,W = 100 ppm) is obtained for the prolonged heating time (τ = 20 min) and at high beam power (Pb = 21.6 kW).
For the other investigated metal impurities, such as Al (Table 5), Mo, Fe, and As, the measured concentrations (after refining) in the liquid pool volume (CV,i) and those on the reaction interface (CS,i) are very different. The concentration measured in the volume of the molten metal is higher CV,i >> CS,i and the difference between them is approximately one order (Table 5), i.e., kdiff,i << kev,i, the process is diffusion-limited and the refining depends on the mass transfer from the volume to the surface of the pool. This shows that the slower process is the mass transfer from the volume to the surface of the pool, which makes it defining for the refining of those impurities. Their rate of refining depends to a large extent on the liquid pool geometry. Table 6 shows the dependencies between the height of the molten pool hmelt (evaluated after metallographic analysis of the samples) and the melting time and the beam power. The value of the pool height hmelt increases with increasing the e-beam power. One can see stable values of hmelt between the third and the seventh minute of refining when using lower beam powers, after which hmelt increases rapidly with time until the 20th minute. These changes in the liquid pool make it harder for the movement of these impurities (Al, Mo, Fe, and As) from the volume to the liquid metal pool/vacuum interface. Due to this, with the increase of the beam power and with the increase of the molten pool height, the refining process and the removal of these metal impurities (Al, Mo, Fe, and As) become harder. The removal of impurities, such as Al, Mo, Fe, and As, the refining of which is limited by the mass transfer from the volume to the liquid metal pool/vacuum interface, depends most of all on the geometry of the liquid pool and on the melting time. For Al (as a representative of these impurities with highest initial concentration C0,Al = 700 ppm), maximal removal efficiency of Al is seen at Pb = 20 kW and τ = 20 min.

3. Results of the Statistical Approach for the Optimization of the EBMR of Ta

A statistical approach is applied for the estimation of the material losses and parameters characterizing the molten pool (molten volume, area of the liquid pool/vacuum reaction interface, height of the pool) based on experimentally-obtained data.
Data for the weight of the initial and the obtained samples are used for estimation of the material losses Wloss (g), which are mainly due to evaporation (of contaminants and of the base metal), and they also occur due to splashes during the e-beam melting. A regression model is estimated by the following relation:
Wloss = 25.234 + 3.6436x1 + 4.1807x1x2 + 2.818x12 − 8.426x22 + 12.2508x12x2
where x1 and x2 are the coded values of parameters zi (Pb and τ). The relation between the coded (xi) and the natural values (zi) is given by:
xi = (2zizi,maxzi,min)/(zi,maxzi,min)
where zi,min and zi,max are the corresponding minimal and maximal values of the process parameters concerning the conducted experiments (Table 1).
The values of the determination coefficients R2 and adjusted R2(adj)—the square of the multiple correlation coefficients, which are measures for the model accuracy (the closer these values are to 100% , the better the model is)—are: R2 = 97.7% and R2(adj) = 95.8%. The estimated model is good for prognostication and can be used for process parameter optimization. 
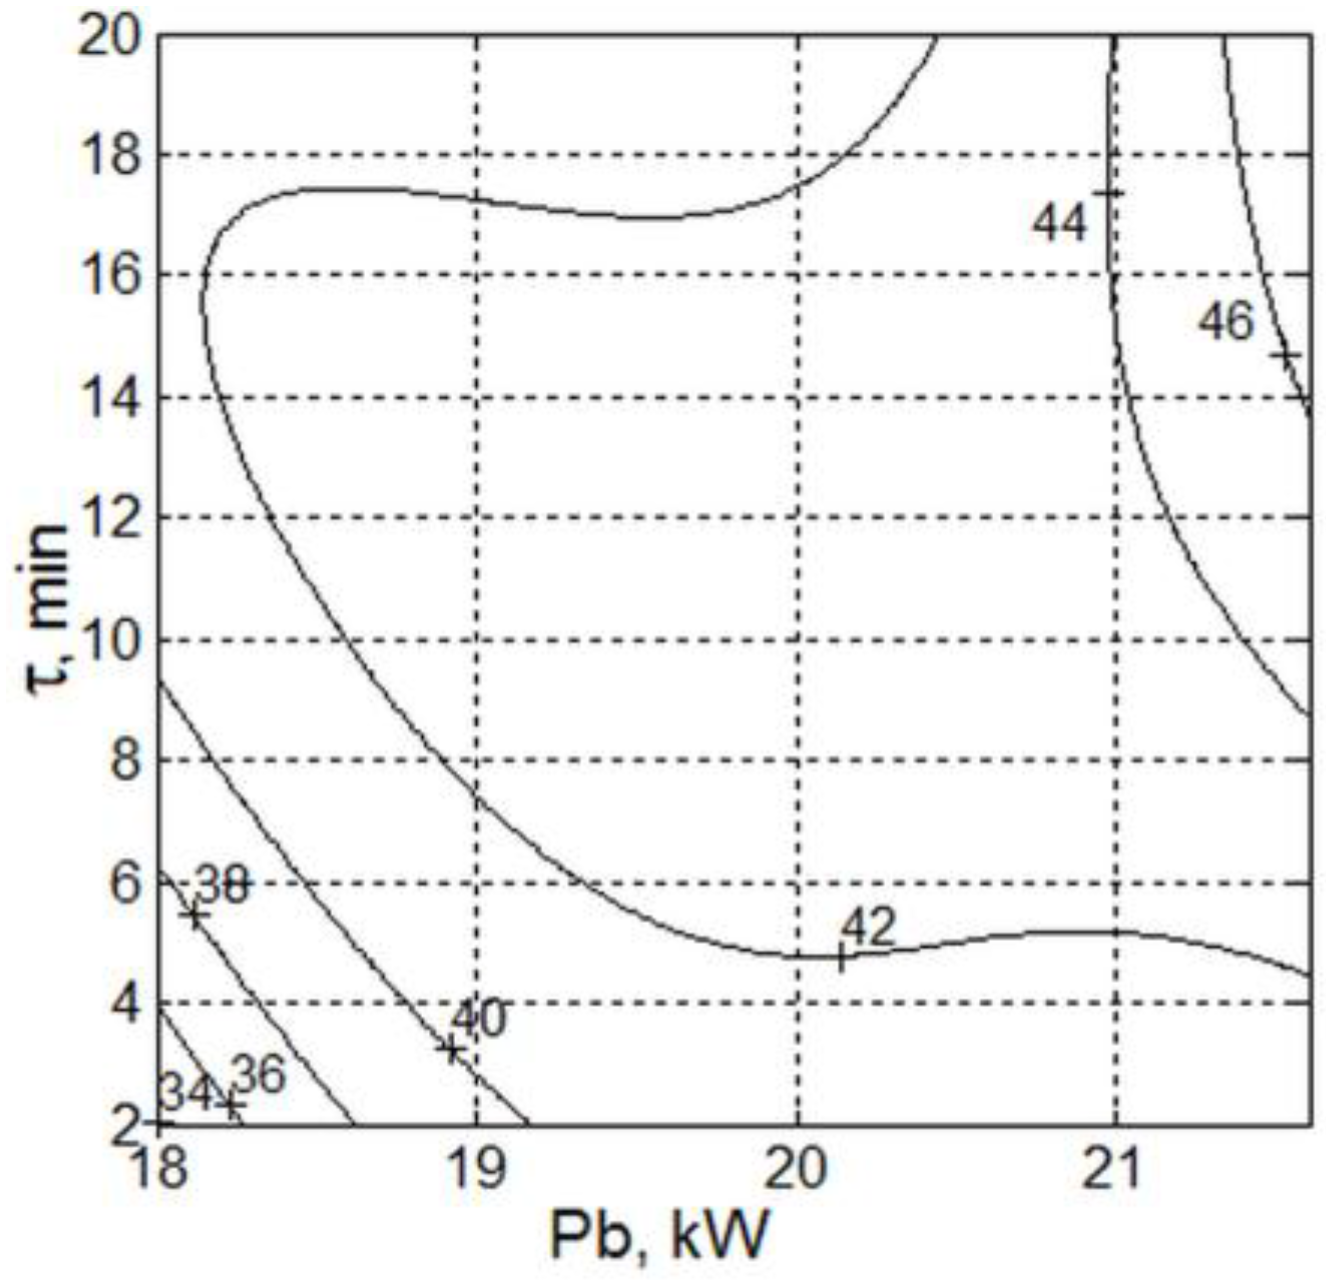
Figure 3 shows the contour plot of material losses, depending on both the process parameters: the beam power Pb and the refining time τ. Areas with minimal material losses are seen at: τ < 4 min and Pb < 19 kW or Pb > 21 kW for the investigated regions of the process parameters (Table 1).
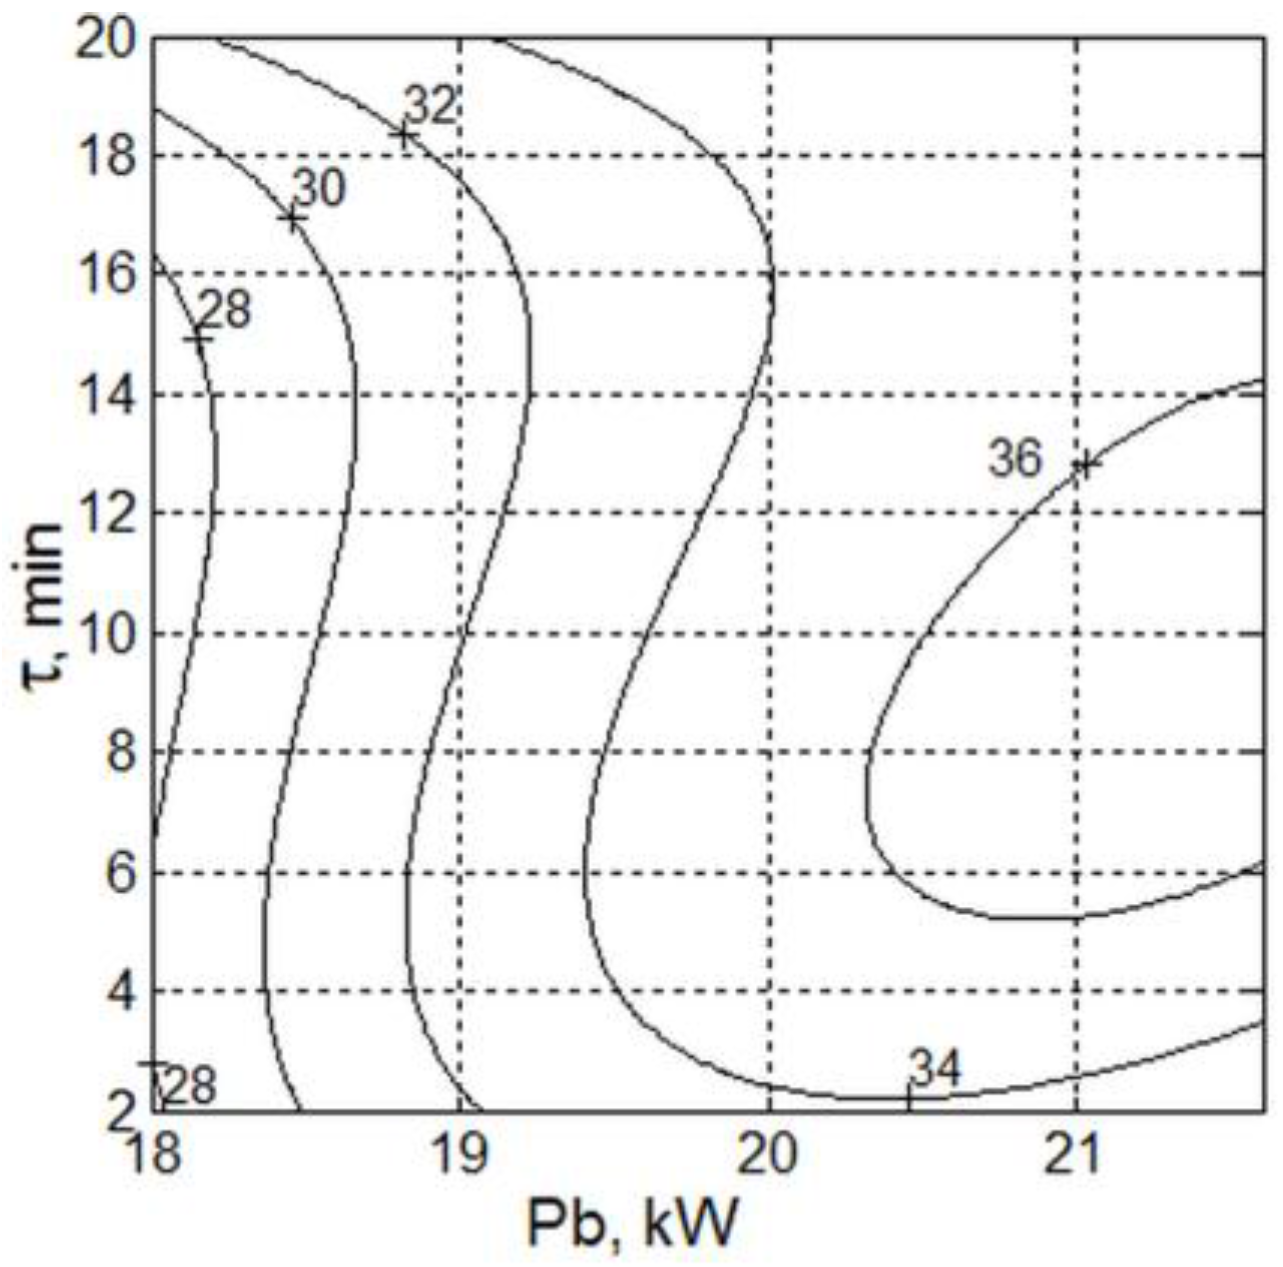
Regression models are also estimated for the following parameters concerning the molten pool and connected to the refining efficiency: the molten pool height hmelt (mm), the molten pool volume V (cm3), and the diameters d1 (mm) and d2 (mm) of the molten pool ellipse on the top ingot surface. The models and the values of the determination coefficients R2 and adjusted R2(adj) are shown in Table 7. The estimated dependencies of the pool parameters hmelt, V, d1, and d2 on the EBM process parameters Pb and τ are presented in Figure 4, Figure 5, Figure 6 and Figure 7. It can be seen that the area with maximal liquid pool volume and the corresponding ranges for the beam power and melting time coincide with the ones with maximal material losses. Optimal solutions that compromise for the chosen criteria of maximal molten volume, maximal area of the liquid pool/vacuum reactive interface and minimal material losses at the same time for Ta refining should be found.
The first optimization task was formulated to simultaneously support the following conditions concerning the refining process efficiency: minimal material losses, maximal molten volume, minimal pool height, and the maximal liquid pool/vacuum reaction interface (maximal values of d1 and d2). Such compromising Pareto-optimal solutions can be found at different parameter values. Table 8 shows some of the possible estimated solutions. One can make a choice among them by taking some other criteria into consideration, such as the minimal refining time, choosing more important parameters characterizing the molten pool, or another additional criterion.
If the optimization requirements deal with only two of the characteristics, e.g., minimal material losses (Wloss) and maximal pool volume (V), a group of Pareto-optimal solutions, forming the so called Pareto-front, are obtained and are shown in Figure 8. Some of the obtained Pareto-optimal solutions and the corresponding EBM process conditions are presented in Table 9. The obtained results show that, for the investigated regimes, the estimated models and relations can be utilized for improvement of EBMR in different ways by specifying characteristic requirements that support the process of refining of tantalum. One can see that the minimal material losses are observed for the following regime conditions: Pb = 18.10 kW, τ = 2.16 min (regime 1, Table 8), which are also energy-saving (low e-beam power and short refining time) and the purity of Ta is 99.93%. If this purification is enough for some applications, these process parameters can be chosen as optimal conditions according to the additional criteria. In addition, these regime conditions (regime 1, Table 8) are also optimal taking into consideration the criterion concerning minimal liquid pool depth (hmelt), which is connected with obtaining dendrite structure without defects after electron beam melting.

4. Conclusions

Experimental and theoretical investigations concerning the technological process parameters of the EBMR of tantalum, aiming at improving the quality of the obtained ingots, are presented in this paper. Experiments for Ta e-beam melting from waste products for different thermal treatment conditions (beam power and heating time) are performed and the obtained results are discussed. It is shown that, depending on the thermodynamic limits for the conduction of the refining process for impurities, such as W, Mn, Nb, Cr, Ce, K, Na, the limiting process is the evaporation from the molten metal/vacuum reaction interface while, for impurities such as Al, Mo, Fe, As, the mass transfer from the molten volume to the reaction interface limits their removal. Appropriate technological schemes for refining and for obtaining the refractory metal Ta with high purity are shown. For the performed experiments the best purification for Ta (99.96) is obtained with the short-term influence of the higher power electron beam on the treated material (heating time 3 min and 21.6 kW power). Modeling concerning the dependences of the investigated characteristics (molten pool parameters, material losses) on the process parameters (beam power, refining time) is conducted, applying a statistical approach based on experimentally-obtained data. Multi-criterion optimizations, concerning fulfilling, simultaneously, requirements for several characteristics of the liquid pool connected to the refining efficiency (molten volume, pool height, area of the interface liquid pool/vacuum), and material losses from the e-beam melting and refining of Ta are performed. Pareto-optimal compromise solutions depending on requirements concerning the quality and purity of the produced metal are found. The results show that, for the investigated regimes, the estimated models and relations can be utilized for improvement of EBMR in different ways by specifying characteristic requirements that support the process of the refining of tantalum. The accumulated data, the obtained results, and the statistical optimization approach allow us to formulate requirements for the process parameters.

Acknowledgments

This research was supported by the Bulgarian National Fund for Scientific Research under grant number DO 02-127 (BIn-5/2009) and by JSPS International Fellowships for Research in Japan.

Author Contributions

K.V. and V.V. conceived and designed the experiments; V.V. performed the experiments; E.K. performed the modeling; K.V., N.M., D.A. and T.T. contributed to the design of the study, interpretation of data and supervised the work; K.V., V.V. and E.K. wrote the manuscript.

Conflicts of Interest

The authors declare no conflict of interest.

References

  1. Choudhury, A.; Hengsberger, E. Electron beam melting and refining of metals and alloys. ISIJ Int. 1992, 32, 673–681. [Google Scholar] [CrossRef]
  2. Bakish, R. The substance of a technology: Electron-beam melting and refining. JOM 1998, 50, 28–30. [Google Scholar] [CrossRef]
  3. Vassileva, V.; Mladenov, G.; Vutova, K.; Nikolov, T.; Georgieva, E. Oxygen removal during electron beam drip melting and refining. Vacuum 2005, 77, 429–436. [Google Scholar] [CrossRef]
  4. Mladenov, G.; Koleva, E.; Vutova, K.; Vassileva, V. Experimental and Theoretical Studies of Electron Beam Melting and Refining. In Practical Aspects and Applications of Electron Beam Irradiation; Nemtanu, M., Brasoveanu, M., Eds.; Transword Research Network: Trivandrum, India, 2011; pp. 43–93. [Google Scholar]
  5. Tan, Y.; Shi, S. Progress in research and development of electron beam technology in metallurgy refining field. J. Mater. Eng. 2013, 8, 92–100. [Google Scholar]
  6. Sankar, M.; Mirji, K.V.; Prasad, V.V.; Baligidad, R.G.; Gokhale, A.A. Purification of Niobium by Electron Beam Melting. High Temp. Mater. Process. 2016, 35, 621–627. [Google Scholar] [CrossRef]
  7. Wang, Z.; Li, J.; Hua, Y.; Zhang, Z.; Zhang, Y.; Ke, P. Research progress in production technology of titanium. Chin. J. Rare Met. 2014, 38, 915–927. [Google Scholar]
  8. Choi, S.H.; Jang, B.Y.; Lee, J.S.; Ahn, Y.S.; Yoon, W.Y.; Joo, J.H. Effects of electron beam patterns on melting and refining of silicon for photovoltaic applications. Renew. Energy 2013, 54, 40–45. [Google Scholar] [CrossRef]
  9. Choi, G.S.; Lim, J.W.; Munirathnam, N.R.; Kim, I.H.; Kim, J.S. Preparation of 5N grade tantalum by electron beam melting. J. Alloy. Compd. 2009, 469, 298–303. [Google Scholar] [CrossRef]
  10. Oh, J.-M.; Lee, B.-K.; Choi, G.-S.; Kim, H.-S.; Lim, J.-W. Preparation of ultrahigh purity cylindrical tantalum ingot by electron beam drip melting without sintering process. Mater. Sci. Technol. 2013, 29, 542–546. [Google Scholar] [CrossRef]
  11. Choi, G.S.; Lim, J.W.; Munirathnam, N.R.; Kim, I.H. Purification of niobium by multiple electron beam melting for superconducting RF cavities. Metall. Mater. Int. 2009, 15, 385–390. [Google Scholar] [CrossRef]
  12. Oh, J.M.; Lee, B.K.; Park, H.K.; Lim, J.W. Preparation and purity evaluation of 5N-grade ruthenium by electron beam melting. Mater. Trans. Metall. Trans. 2012, 53, 1680–1684. [Google Scholar] [CrossRef]
  13. Mushegyan, V.O. Electron-beam melting with an intermediate container as an efficient way for the improvement of the mechanical properties of molybdenum. Russ. Metall. 2011, 2011, 522–525. [Google Scholar] [CrossRef]
  14. Ohriner, E.K. Purification of iridium by electron beam melting. J. Alloy. Compd. 2008, 461, 633–640. [Google Scholar] [CrossRef]
  15. Mitchell, A. The electron beam melting and refining of titanium alloys. Mater. Sci. Eng. A 1999, 263, 217–223. [Google Scholar] [CrossRef]
  16. Karlsson, J.; Snis, A.; Engqvist, H.; Lausmaa, J. Characterization and comparison of materials produced by Electron Beam Melting (EBM®) of two different Ti-6Al-4V powder fractions. J. Mater. Process. Technol. 2013, 213, 2109–2118. [Google Scholar] [CrossRef]
  17. Oh, J.M.; Lee, B.K.; Suh, C.Y.; Cho, S.W.; Lim, J.W. Deoxidation of Ti Powder and Preparation of Ti Ingot with Low Oxygen Concentration. Mater. Trans. 2012, 53, 1075–1077. [Google Scholar] [CrossRef]
  18. Vutova, K.; Vassileva, V.; Koleva, E.; Georgieva, E.; Mladenov, G.; Mollov, D.; Kardjiev, M. Investigation of electron beam melting and refining of titanium and tantalum scrap. J. Mater. Process. Tech. 2010, 210, 1089–1094. [Google Scholar] [CrossRef]
  19. Ikeda, T.; Maeda, M. Purification of Metallurgical Silicon for Solar-grade Silicon by Electron Beam Button Melting. ISIJ Int. 1992, 32, 635–642. [Google Scholar] [CrossRef]
  20. Jiang, D.C.; Tan, Y.; Shi, S.; Dong, W.; Gu, Z.; Guo, X.L. Evaporated metal aluminium and calcium removal from directionally solidified silicon for solar cell by electron beam candle melting. Vacuum 2012, 86, 1417–1422. [Google Scholar] [CrossRef]
  21. Lee, J.-K.; Lee, J.-S.; Jang, B.-Y.; Kim, J.-S.; Ahn, Y.-S.; Cho, C.-H. Directional Solidification Behaviors of Polycrystalline Silicon by Electron-Beam Melting. Jpn. J. Appl. Phys. 2013, 52, 10MB09. [Google Scholar] [CrossRef]
  22. Kekesi, T.; Isshiki, M. The Purification of Base Transition Metals. In Purification Process and Characterization of Ultra High Purity Metals; Waseda, Y., Isshiki, M., Eds.; Springer: Berlin, German, 2002; pp. 71–101. [Google Scholar]
  23. Ablitzer, D.; Allibert, M.; Avare, C.; Bellot, J.P.; Bienvenu, Y.; Fautrelle, Y.; Gillon, P.; Hess, E.; Jardy, A.; Pasturel, A. Mathematical modeling of electron beam remelting process, Application to the processing of titanium alloys. In Proceedings of the Conf. Electron Beam Melting and Refining, Reno, NV, USA, 15–17 October 1992; pp. 85–91.
  24. Koleva, E.; Vassileva, V.; Mladenov, G. Simulation of thermal and mass transfer of reactive metals. In Proceedings of the 7th Int. Symposium on Liquid Metal Processing and Casting LMPC 2007, Nancy, France, 2–5 September 2007; pp. 219–225.
  25. Vutova, K.; Donchev, V. Non-stationary heat model for electron beam melting and refining—An economic and conservative numerical method. Appl. Math. Model. 2016, 40, 1565–1575. [Google Scholar] [CrossRef]
  26. Bellot, J.P.; Floris, E.; Jardy, A.; Ablitzer, D. Numerical simulation of the E.B.C.H.R. process. In Proceedings of the International Conference Electron Beam Melting and Refining—State of the Art 1993, Reno, NV, USA, 3–5 November 1993; Bakish, R., Ed.; Bakish Materials Corporation: Englewood, NJ, USA, 1993; pp. 139–152. [Google Scholar]
  27. Ou, J.; Chatterjee, A.; Reilly, C.; Maijer, D.M.; Cockcroft, S.L. Computational modeling of the dissolution of alloying elements. In Supplemental Proceedings: Materials Processing and Interfaces, Volume 1, Proceedings of the TMS (The Minerals, Metals & Materials Society) 2012, Orlando, FL, USA, 11–15 March 2012; John Wiley & Sons, Inc.: Hoboken, NJ, USA, 2012; pp. 871–878. [Google Scholar]
  28. Vutova, K.; Vassileva, V.; Mladenov, G. Simulation of the Heat Transfer Process through Treated Metal, Melted in a Water-Cooled Crucible by an Electron Beam. Vacuum 1997, 48, 143–148. [Google Scholar] [CrossRef]
  29. Zhao, X.; Reilly, C.; Yao, L.; Maijer, D.M.; Cockcroft, S.L.; Zhu, J. A three-dimensional steady state thermal fluid model of jumbo ingot casting during electron beam re-melting of Ti–6Al–4V. Appl. Math. Model. 2014, 38, 3607–3623. [Google Scholar] [CrossRef]
  30. Donchev, V.; Vutova, K. Optimization method for electron beam melting and refining of metals. J. Phys. Conf. Ser. 2014, 490, 012211. [Google Scholar] [CrossRef]
  31. Vutova, K.; Donchev, V. Electron Beam Melting and Refining of Metals: Computational Modeling and Optimization. Materials 2013, 6, 4626–4640. [Google Scholar] [CrossRef]
  32. Donchev, V.; Vutova, K.; Vassileva, V. Experimental and numerical investigation of the refinement of Hf by EBM. J. Phys. Conf. Ser. 2014, 514, 012047. [Google Scholar] [CrossRef]
  33. Vutova, K.; Koleva, E.; Mladenov, G. Simulation of thermal transfer process in cast ingots at electron beam melting and refining. J. Int. Rev. Mech. Eng. 2011, 5, 257–265. [Google Scholar]
  34. Ou, J.; Cockcroft, S.L.; Maijer, D.M.; Yao, L.; Reilly, C.; Akhtar, A. An examination of the factors influencing the melting of solid titanium in liquid titanium. Int. J. Heat Mass Transf. 2015, 86, 221–233. [Google Scholar] [CrossRef]
  35. Tan, Y.; Wen, S.T.; Shi, S.; Jiang, D.C.; Dong, W.; Guo, X.L. Numerical simulation for parameter optimization of silicon purification by electron beam melting. Vacuum 2013, 95, 18–24. [Google Scholar] [CrossRef]
  36. Adebiyi, D.I.; Popoola, A.P.; Botef, I. Experimental verification of statistically optimized parameters for low-pressure cold spray coating of titanium. Metals 2016, 6, 135. [Google Scholar] [CrossRef]
  37. Vutova, K.; Mladenov, G. Computer simulation of the heat transfer during electron beam melting and refining. Vacuum 1999, 53, 87–91. [Google Scholar] [CrossRef]
  38. Long, L.; Liu, W.; Ma, Y.; Liu, Y.; Liu, S. Refining tungsten purification by electron beam melting based on the thermal equilibrium calculation and tungsten loss control. High Temp. Mater. Process. 2015, 34, 605–610. [Google Scholar] [CrossRef]
  39. Vutova, K.; Donchev, V.; Vassileva, V.; Mladenov, G. Thermal processes in electron beam treatment of metals. J. Met. Sci. Heat Treat. 2014, 55, 628–635. [Google Scholar] [CrossRef]
  40. Ward, R.G. Evaporative losses during vacuum induction melting of steel. J. Iron Steel Inst. 1963, 201, 11–15. [Google Scholar]
  41. Kurapov, Y.A. Processes of Vacuum Refining of Metals at Electron Beam Melting; Naukova Dumka: Kiev, Ukraine, 1984; pp. 1–166. (In Russian) [Google Scholar]
Figure 1. Schematic diagram of the EBMR process: (a) a scheme of the method of disk melting and (b) a scheme of the method of drip melting with a horizontal feeding of the source material: (1) electron beam; (2) scanning electron beam (formed in one or several electron optical systems EOS); (3) pool of liquid metal; (4) solidifying ingot; (5) water-cooled side walls of the copper crucible; (6) water-cooled mobile bottom (puller); (7) direction of elongation of ingot; and (8) drops of molten metal [4,39].
Metals 06 00287 g001
Figure 2. Partial pressure of studied metals in the temperature range 2900–3300 K.
Metals 06 00287 g002
Figure 3. Contour plot of the material losses of the e-beam melting of Ta, where Pb is the beam power and τ is the refining time.
Metals 06 00287 g003
Figure 4. Contour plot of the molten pool height hmelt depending on the beam power Pb and the melting time τ.
Metals 06 00287 g004
Figure 5. Contour plot of the molten pool volume V, where Pb is the e-beam power and τ is the refining time.
Metals 06 00287 g005
Figure 6. Contour plot of the molten pool diameter d1 vs. the electron beam power Pb and the refining time τ.
Metals 06 00287 g006
Figure 7. Contour plot of the molten pool diameter d2 depending on the beam power Pb and the melting time τ.
Metals 06 00287 g007
Figure 8. Pareto-optimal solutions with minimal material losses and maximal molten pool volume of electron beam melting of Ta.
Metals 06 00287 g008
Table 1. Ranges for process parameter values of the e-beam melting of Ta.
ParametersDimensionCodedzi,minzi,max
PbkWx11821.6
τminx2220
Table 2. Concentration of impurities depending on the beam power and refining time of the EBM of Ta.
Pb0 min2 min3 min7 min20 min
18 kW0.1822%0.0867%0.0547%0.0479%0.0404%
20 kW0.1822%0.0773%0.0534%0.0435%0.0433%
21.6 kW0.1822%0.0403%0.0374%0.038%0.0475%
Table 3. Free energy for oxides of Ta and metal inclusions at atmospheric pressure (ΔF°) and at vacuum pressure 10−3 Pa (ΔF).
Chemical ReactionΔF°3000 K, kJ/kgΔF3000 K, kJ/kgΔF°3100 K, kJ/kgΔF3100 K, kJ/kg
Ta2O5 = 2Ta + 5/2O21912−36081831−3873
WO3 = W + 3/2O21590−43801569−4600
Mn2O3 = 2Mn + 3/2O21008−9972852−10,494
Nb2O5 = 2Nb + 5/2O22863−58372750−6240
Cr2O3 = 2Cr + 3/2O22358−90422184−9596
CeO2 = Ce + O22780−34302654−3763
Al2O3 = 2Al + 3/2O27107−93986806−10,244
MoO3 = Mo + 3/2O2561−8889428−9337
2FeO = 2Fe + O21237−83631173−8747
Table 4. Tungsten concentration in the molten volume (CV,W) and at the top surface of the liquid pool (CS,W) depending on the beam power and refining time of the EBM of Ta.
ImpurityBeam Power PbMelting Time τCV,W, %CS,W, %
W18 kW0 min0.010.01
2 min0.0060.005
3 min0.00550.0045
7 min0.0040.0036
20 min0.0030.0025
W20 kW0 min0.010.01
2 min0.0070.006
3 min0.0040.0035
7 min0.00310.003
20 min0.0030.0025
W21.6 kW0 min0.010.01
2 min0.0050.004
3 min0.00280.0025
7 min0.00170.0016
20 min0.00120.001
Table 5. Aluminum concentration in the molten volume (CV,Al) and at the top surface of the liquid pool (CS,Al) depending on Pb and τ of the e-beam melting of Ta.
ImpurityBeam Power PbMelting Time τCV,W, %CS,W, %
Al18 kW0 min0.070.07
2 min0.070.008
3 min0.060.005
7 min0.050.005
20 min0.050.004
Al20 kW0 min0.070.07
2 min0.060.03
3 min0.050.02
7 min0.040.01
20 min0.030.004
Al21.6 kW0 min0.070.07
2 min0.070.01
3 min0.060.006
7 min0.050.003
20 min0.050.003
Table 6. Values of the height of the liquid pool in Ta at different Pb and τ.
Pb2 min3 min7 min20 min
18 kW11.45 mm12.11 mm12.14 mm17.4 mm
20 kW12 mm13.3 mm13.59 mm17.8 mm
21.6 kW13.1 mm14.51 mm15.77 mm18 mm
Table 7. Regression models for the molten pool height hmelt, the molten pool volume V, and the diameters d1 and d2 of the liquid pool ellipse at the top sample surface.
ParameterRegression EquationsR2R2(adj)
hmelt11.7278 + 1.9657x1 − 5.6908x2 − 0.29010x1x2 − 0.23344x12 + 3.4604x22 − 1.3756x1x22 + 8.4335x2399.9%99.8%
V23.0177 + 7.3745x1 + 0.7697x1x2 − 1.6282x12 − 3.3617x1x22 + 1.7235x12x2 + 4.9437x2399.5%98.9%
d142.8588 − 1.8743x22 + 1.2593x1x22 + 3.6378x12x2 + 2.1096x1398.5%97.6%
d234.2834 + 4.7544x1 − 2.252x2 − 2.4328x12 − 2.5665x1x22 + 1.088x12x2 + 3.056x2398.7%97.1%
Table 8. Pareto-optimal solutions and the corresponding process conditions.
No.Pb kWτ minWloss gV cm3hmelt mmd1 mmd2 mm
118.102.169.3712.2111.5934.9728.35
219.416.5422.6820.9813.9742.2334.01
321.353.6614.4721.9615.0341.4834.61
Table 9. Pareto-optimal solutions (Wloss, V) and the corresponding EBM conditions.
No.Pb, kWτ, minWloss, gV, cm3
119.6919.9916.4127.68
220.0619.9018.4728.53
321.533.0111.0720.54

