Article

High Cycle Fatigue Property of Carburized 20Cr Gear Steel under Axial Loading

School of Mechanical Engineering, Beijing Institute of Technology, Beijing 100081, China
*
Author to whom correspondence should be addressed.
Metals 2016, 6(10), 246; https://doi.org/10.3390/met6100246
Submission received: 31 March 2016 / Revised: 1 September 2016 / Accepted: 11 October 2016 / Published: 18 October 2016

Abstract

:
The high cycle fatigue property of carburized 20Cr gear steel was experimentally investigated under axial loading with a stress ratio of zero. The test results show that this steel exhibits gradually decreasing S-N characteristics, and the fatigue strength corresponding to 109 cycles is about 455 MPa. Based on the observation of fracture surfaces, the interior inclusion fisheye-induced fracture is the predominant fracture mode in the life regime beyond 105 cycles. The fine granular area (FGA) cannot be found clearly around the inclusion. Based on the evaluation of stress intensity factor ranges (ΔK) at the front of inclusion and fisheye, the interior crack growth rate (da/dN) equation can be characterized by da/dN = 2.39 × 10⁻²¹K)12.32. Corresponding to the tested specimen, the predicted maximum inclusion size is about 52.02 μm. The predicted fatigue strength corresponding to 109 cycles by using Wang’s model is slightly higher than the experimental result, but that by using Murakami’s model is relatively conservative.

1. Introduction

In modern industries, more and more mechanical components or parts, such as gear, axle, and blade, etc., often have to be subjected to cyclic loading, and the actual load cycles greatly exceeds 107 cycles [1,2]. Moreover, it has been reported that these components or parts made of ferrous metals that are assumed to have a traditional fatigue limit at about 107 cycles can still fracture in the long life regime beyond 107 cycles [3,4,5,6,7,8]. Thus, it can be confirmed that the traditional fatigue design concepts are no longer satisfied with the demands of safety and reliability design for the mechanical components or parts in the long life regime. As an essential prerequisite, it is very necessary to clarify the fatigue properties of structural materials in the long life regime.
The change from surface-induced fracture to interior-induced fracture is the typical fracture feature of some high-strength steels in the long life regime [3,5,6,7,8,9,10]. Some metallurgical defects, such as non-metallic inclusions [3,4,5,6,7,8] or inhomogeneous microstructures [9,10] can play a very important role in causing the interior crack initiation. A propagating fisheye-shaped crack can be observed on the fracture surface. Furthermore, a characteristic rough area indicating fine granular morphology—called “FGA” (fine granular area) by Sakai [11]—can sometimes occur around the defect. Thus, it can be concluded that the fatigue property of high-strength steel is greatly related to the characters of fisheye, FGA, and inclusion, such as their sizes and positions. However, the relevant S-N properties and failure mechanisms are not yet well understood [4,8,12]. One of the major reasons is that the interior crack cannot be observed and measured during the experiment. Furthermore, from the viewpoint of safety design, the reliability of steel components in actual service can be affected by the maximum sizes of defects contained in a certain bearing volume of steel [13,14,15,16]. How to reliably evaluate the maximum defect size, and then to predict the fatigue strength corresponding to a certain fatigue life, has been a key problem which researchers have to face.
In this study, the axial loading test of a carburized gear steel at a stress ratio of zero was performed to clarify the high cycle fatigue (HCF) property of this steel. According to the observation of fracture surfaces, the S-N property and failure mechanism were discussed. The stress intensity factor range at the front of a characteristic crack was evaluated, and the relevant interior crack growth rate equation was established. Combined with the prediction of maximum inclusion size, the fatigue strength at cycles of 109 of steel was predicted.

2. Materials and Methods

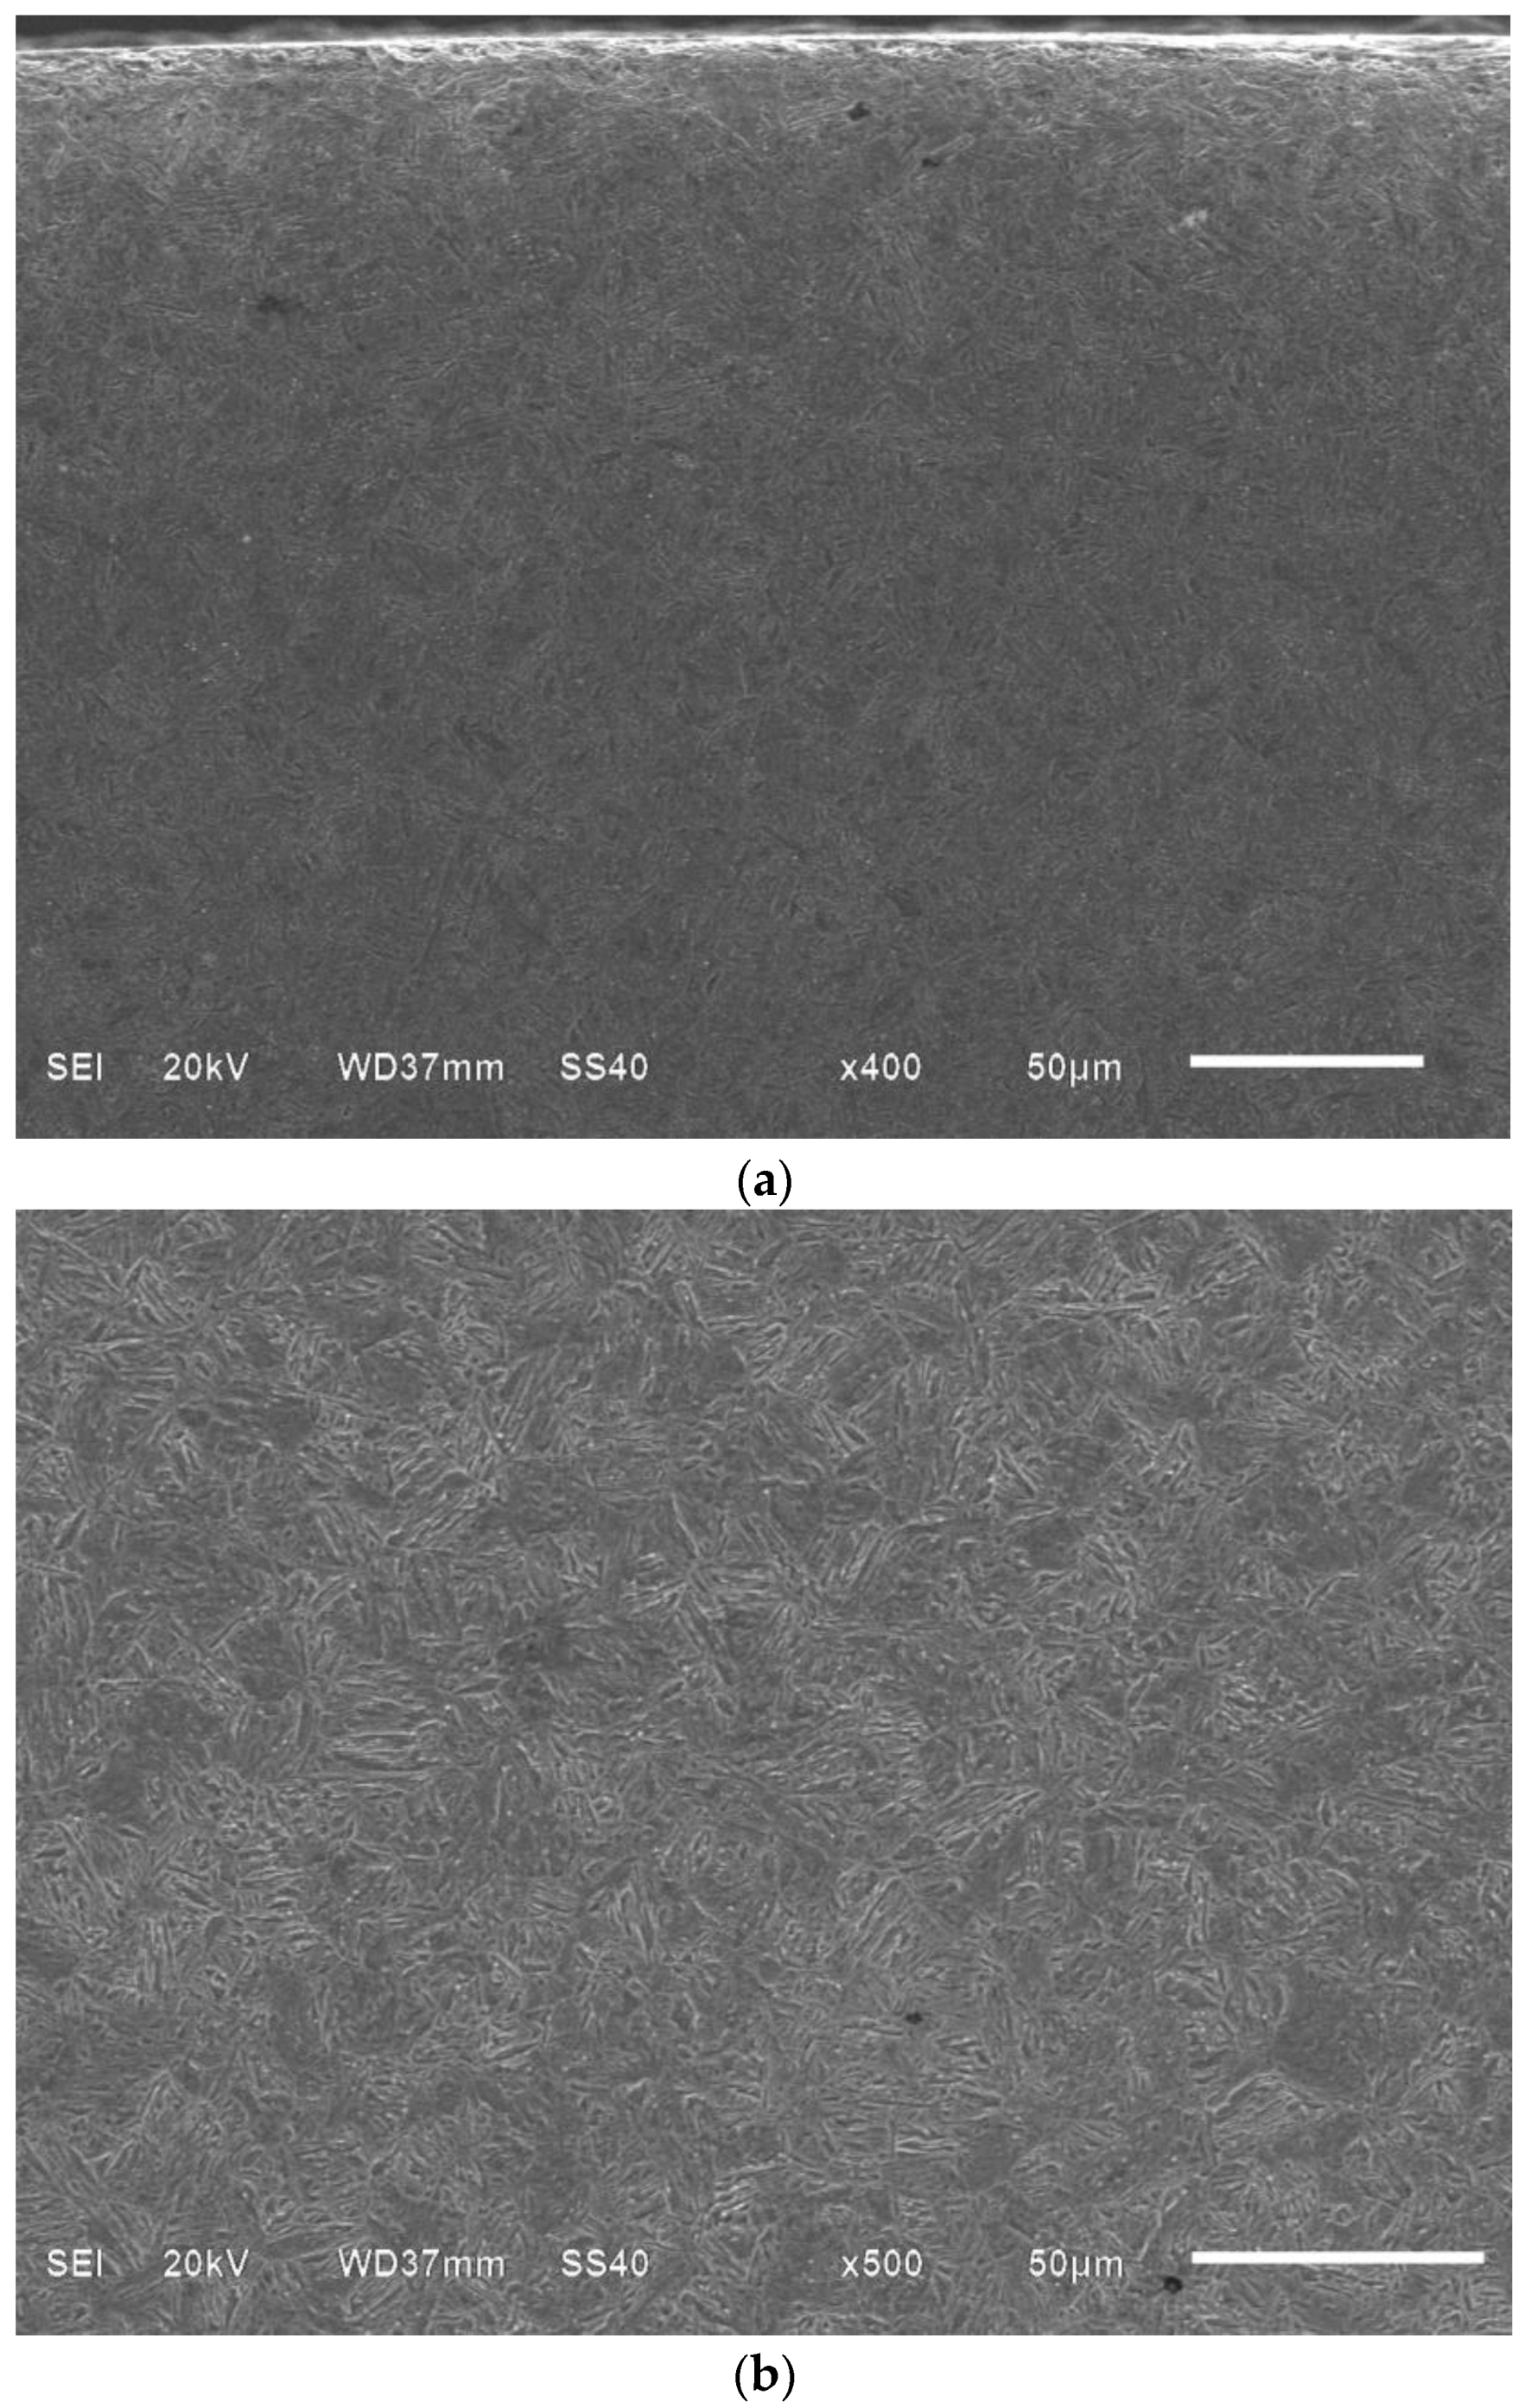
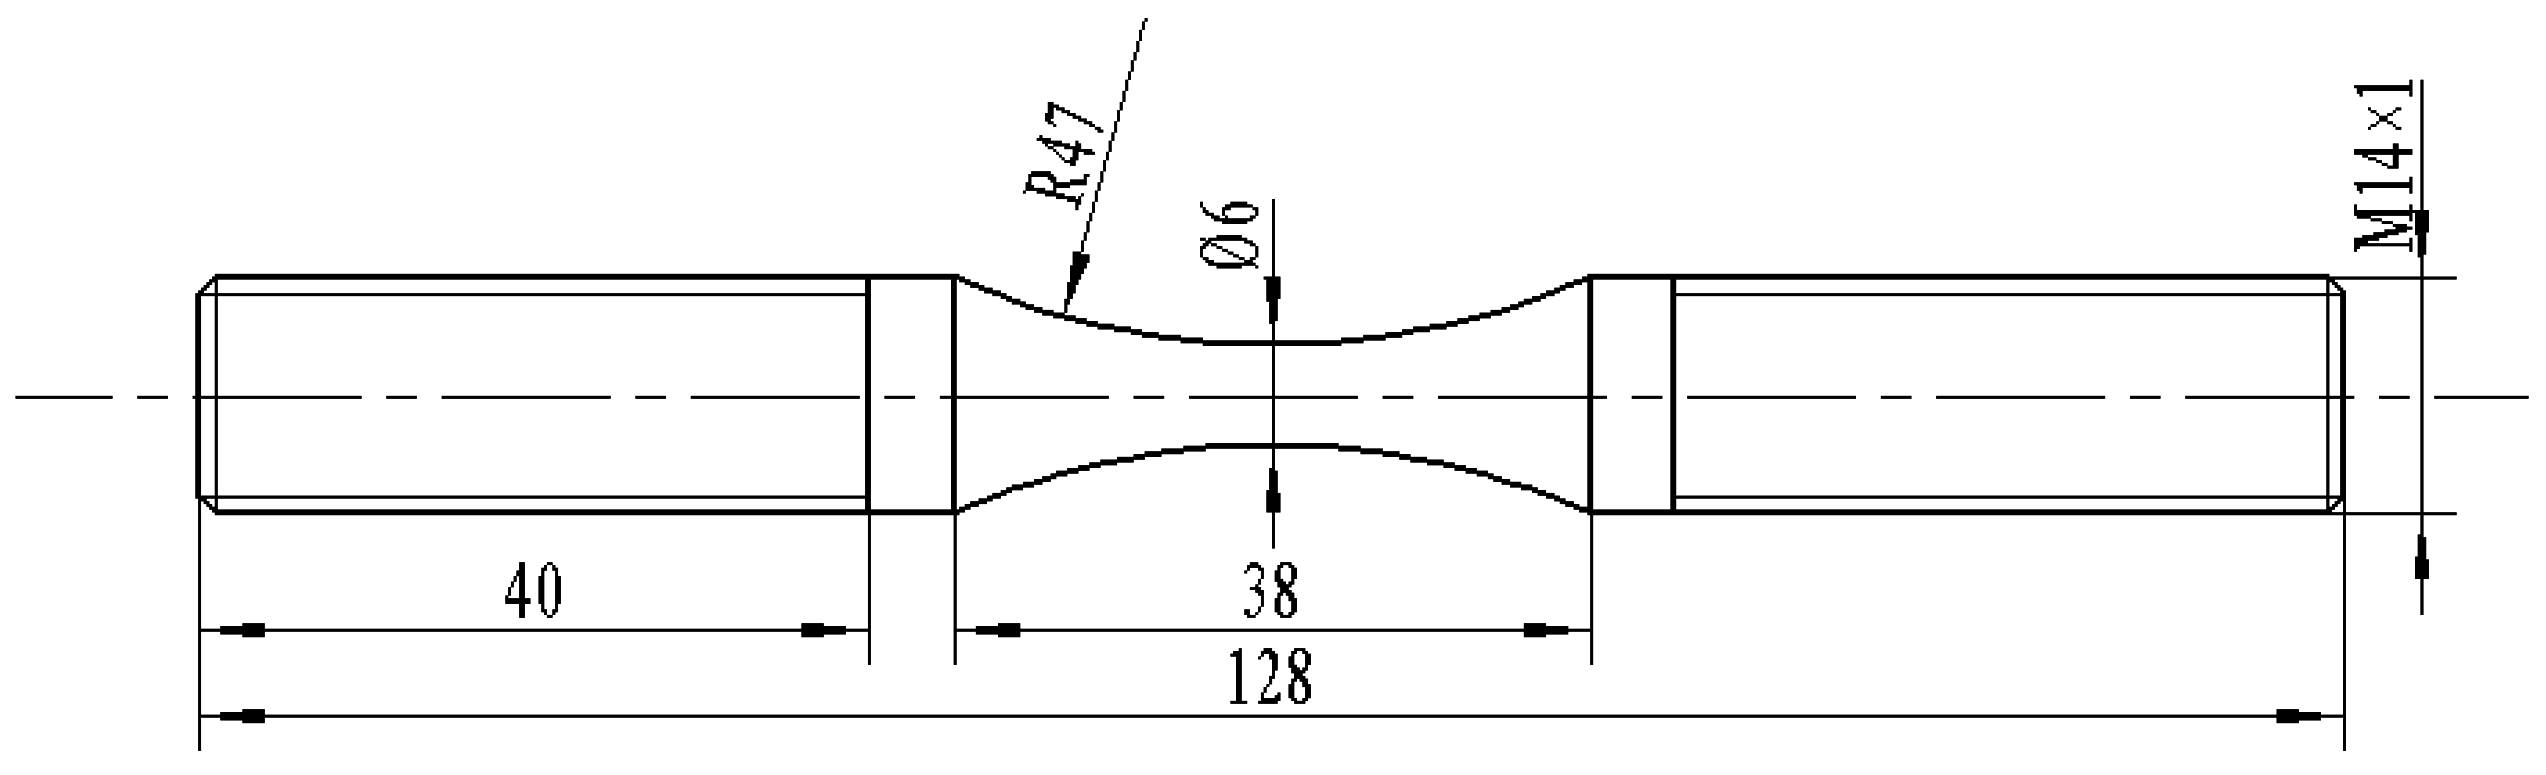
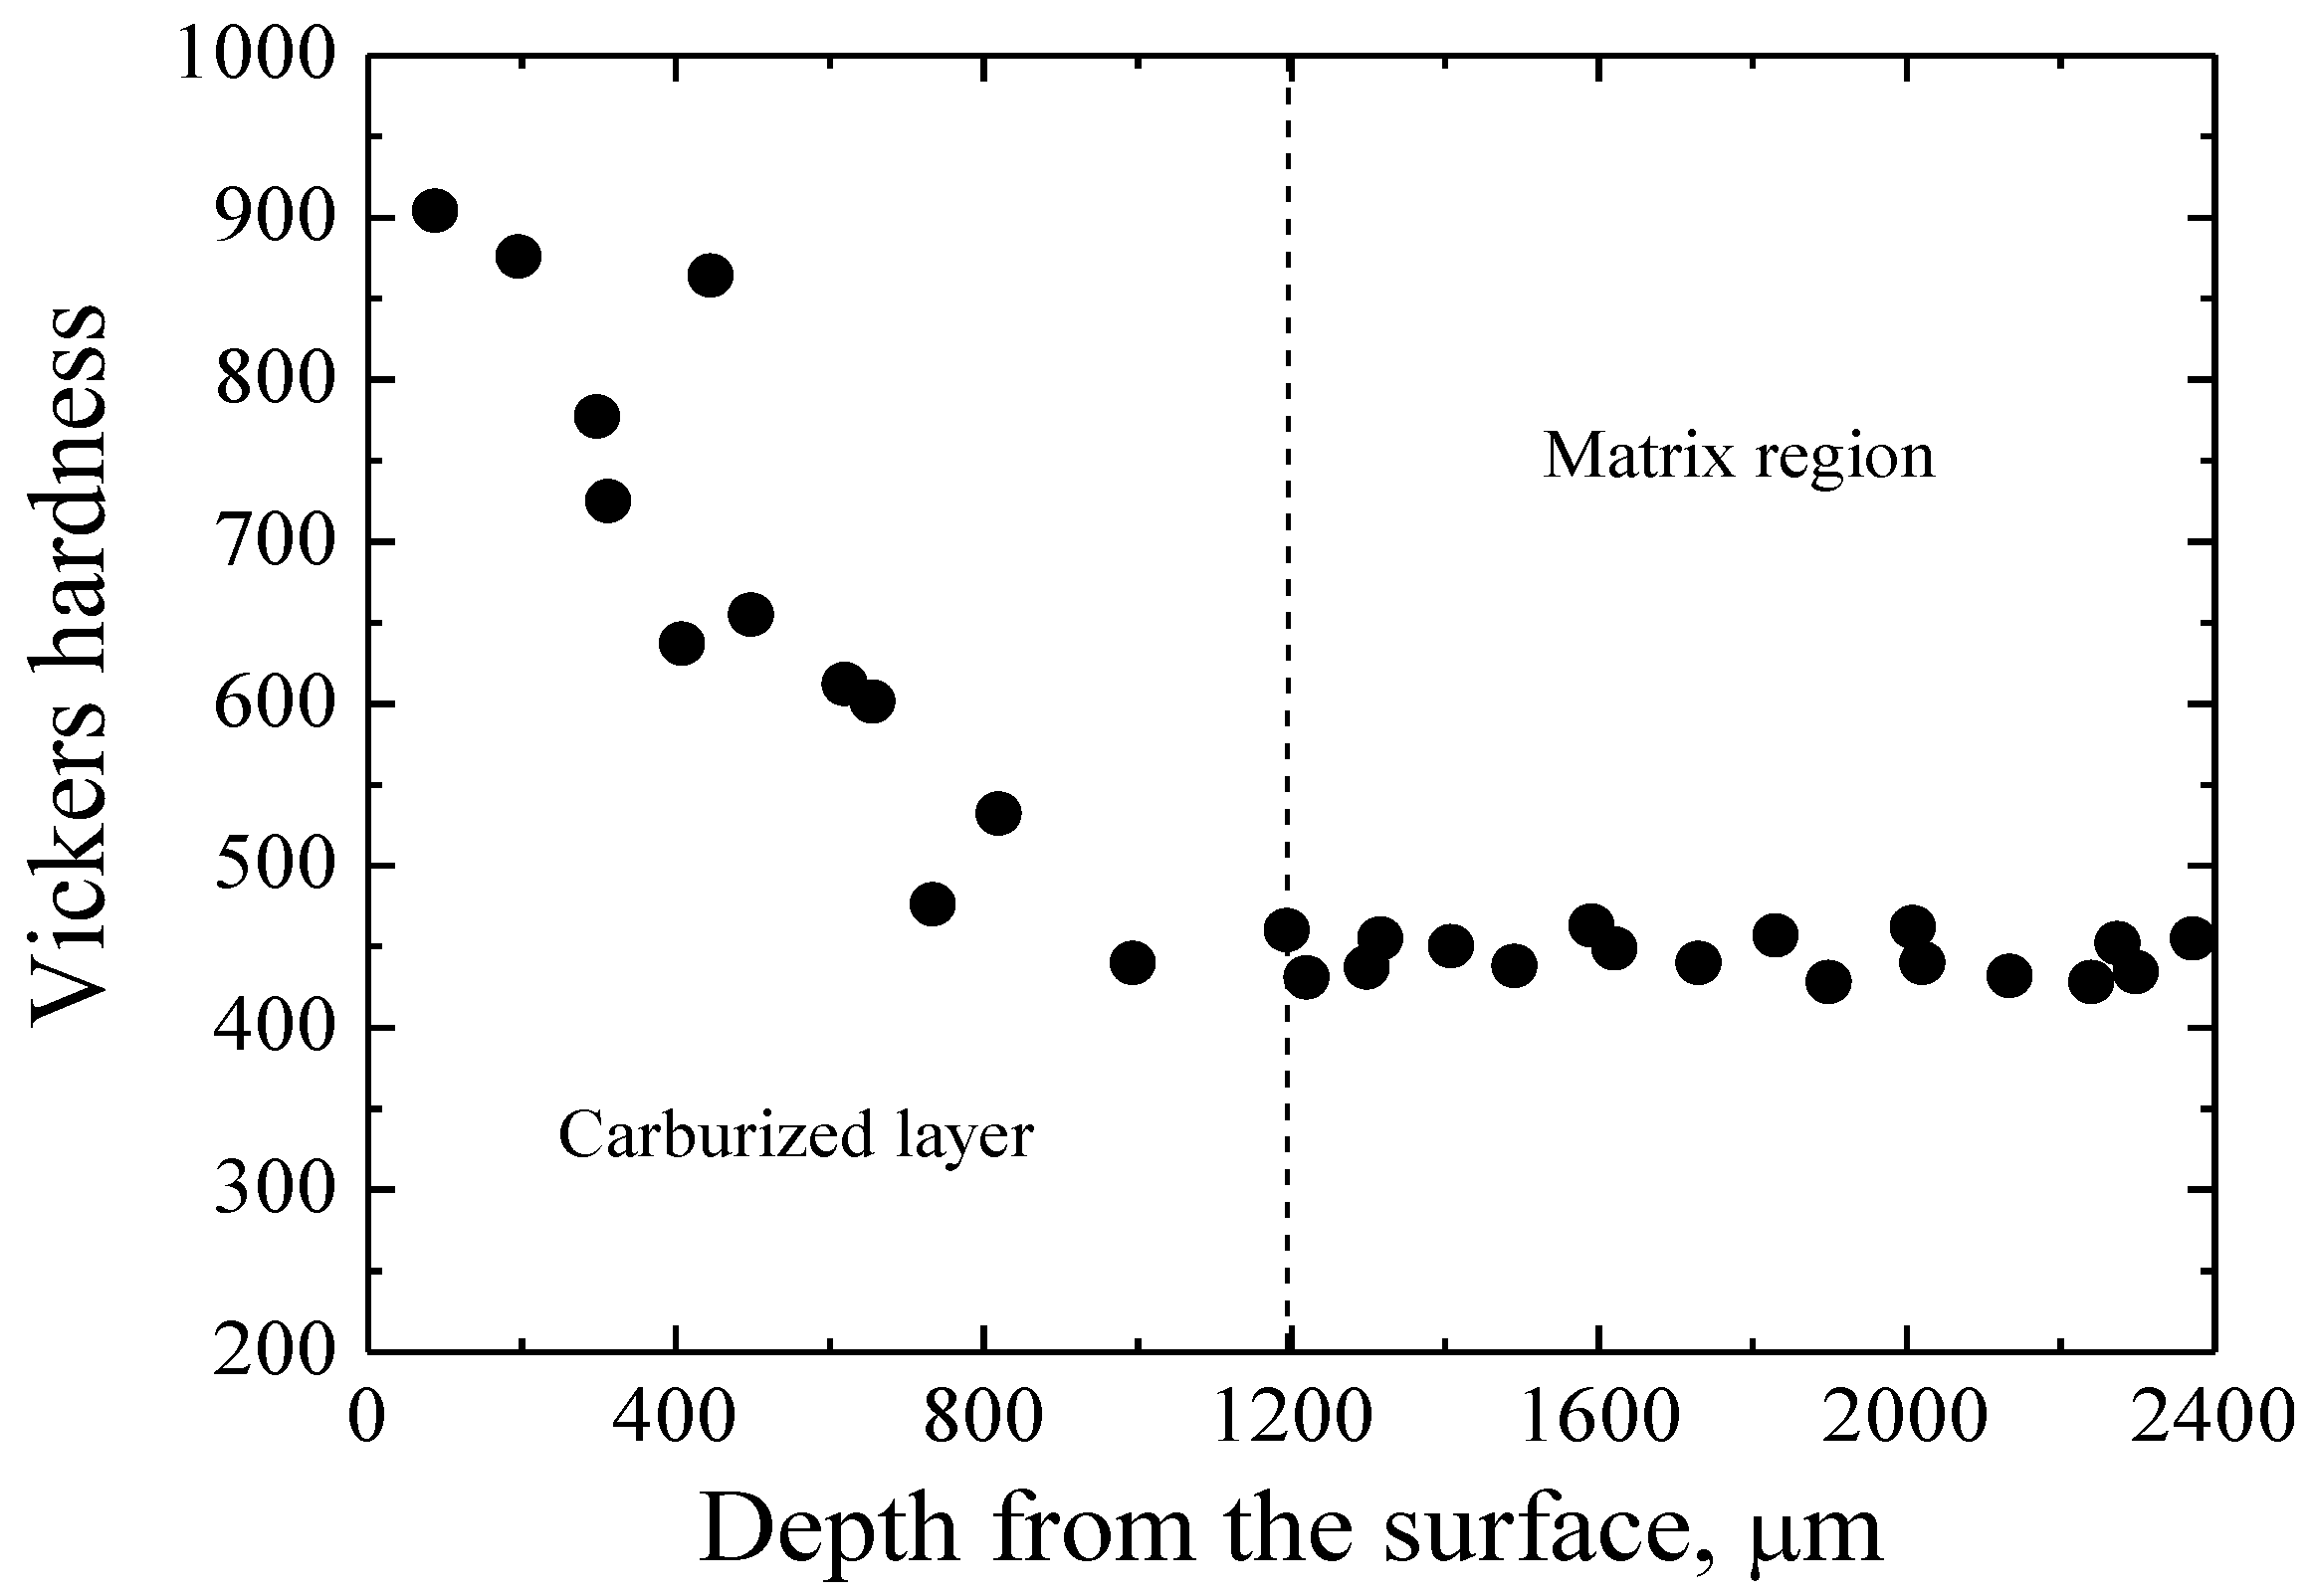
2.1. Material and Specimen

The investigated material in this study was a high-strength carburized 20Cr gear steel. Its main chemical composition (wt. %) is 0.18 C, 0.17 Si, 0.50 Mn, 0.03 S, 1.50 Cr, and 3.48 Ni. Specimens were first machined into hourglass shapes with a certain amount of finishing margin. Next, the heat treatment was carried out on the specimens. The heat treatment procedures were as follows: (a) carburizing process: carburized at 930 °C × 7 h + furnace cooling to 860 °C + air cooling; (b) normalizing process: 840 °C × 0.5 h + air cooling; and (c) tempering process: 650 °C × 6 h + air cooling. After heat treatment, the microstructure of the steel is tempered martensite, and the depth of the carburized layer is about 1.2 mm. After etching with 4% alcohol nitric acid solution, the martensites with high carbon could be observed by scanning electron microscopy (SEM) in the carburized layer (shown in Figure 1a). In the core region, the martensites with low carbon could be observed by SEM (shown in Figure 1b). Finally, specimens were ground in a direction perpendicular to the axis of the specimen by grades 600–2000 abrasive paper to final shapes, as shown in Figure 2.
The minimum diameter and round notch radius of specimens are 6 mm and 47 mm, respectively. The Vickers hardness (HV) of the carburized layer and matrix region was measured by a nano-indenter G200, and its distribution as a function of the depth from the surface is presented in Figure 3. It can be found that first the value of HV on the surface is maximum, and then tends to decrease, finally approaching a constant of 455 at the depth exceeding about 1200 μm. Therefore, it can be further confirmed that the thickness of the carburized layer is about 1200 μm, and the value of HV for the matrix is about 455. In addition, the tensile strength of steel and the yield strength of 20Cr are 1483 MPa and 1292 MPa, respectively.

2.2. Testing Method

By using an electromagnetic resonant fatigue testing machine at a frequency of 100 Hz, the fatigue test of carburized 20Cr gear steel was carried out in an open environment and at room temperature with the constant stress ratio R of 0. After the experiment, fracture surfaces of all the failed specimens were carefully observed by scanning electron microscopy (SEM), especially paying attention to the crack initiation site and crack initiation and propagation mechanisms.

3. Results

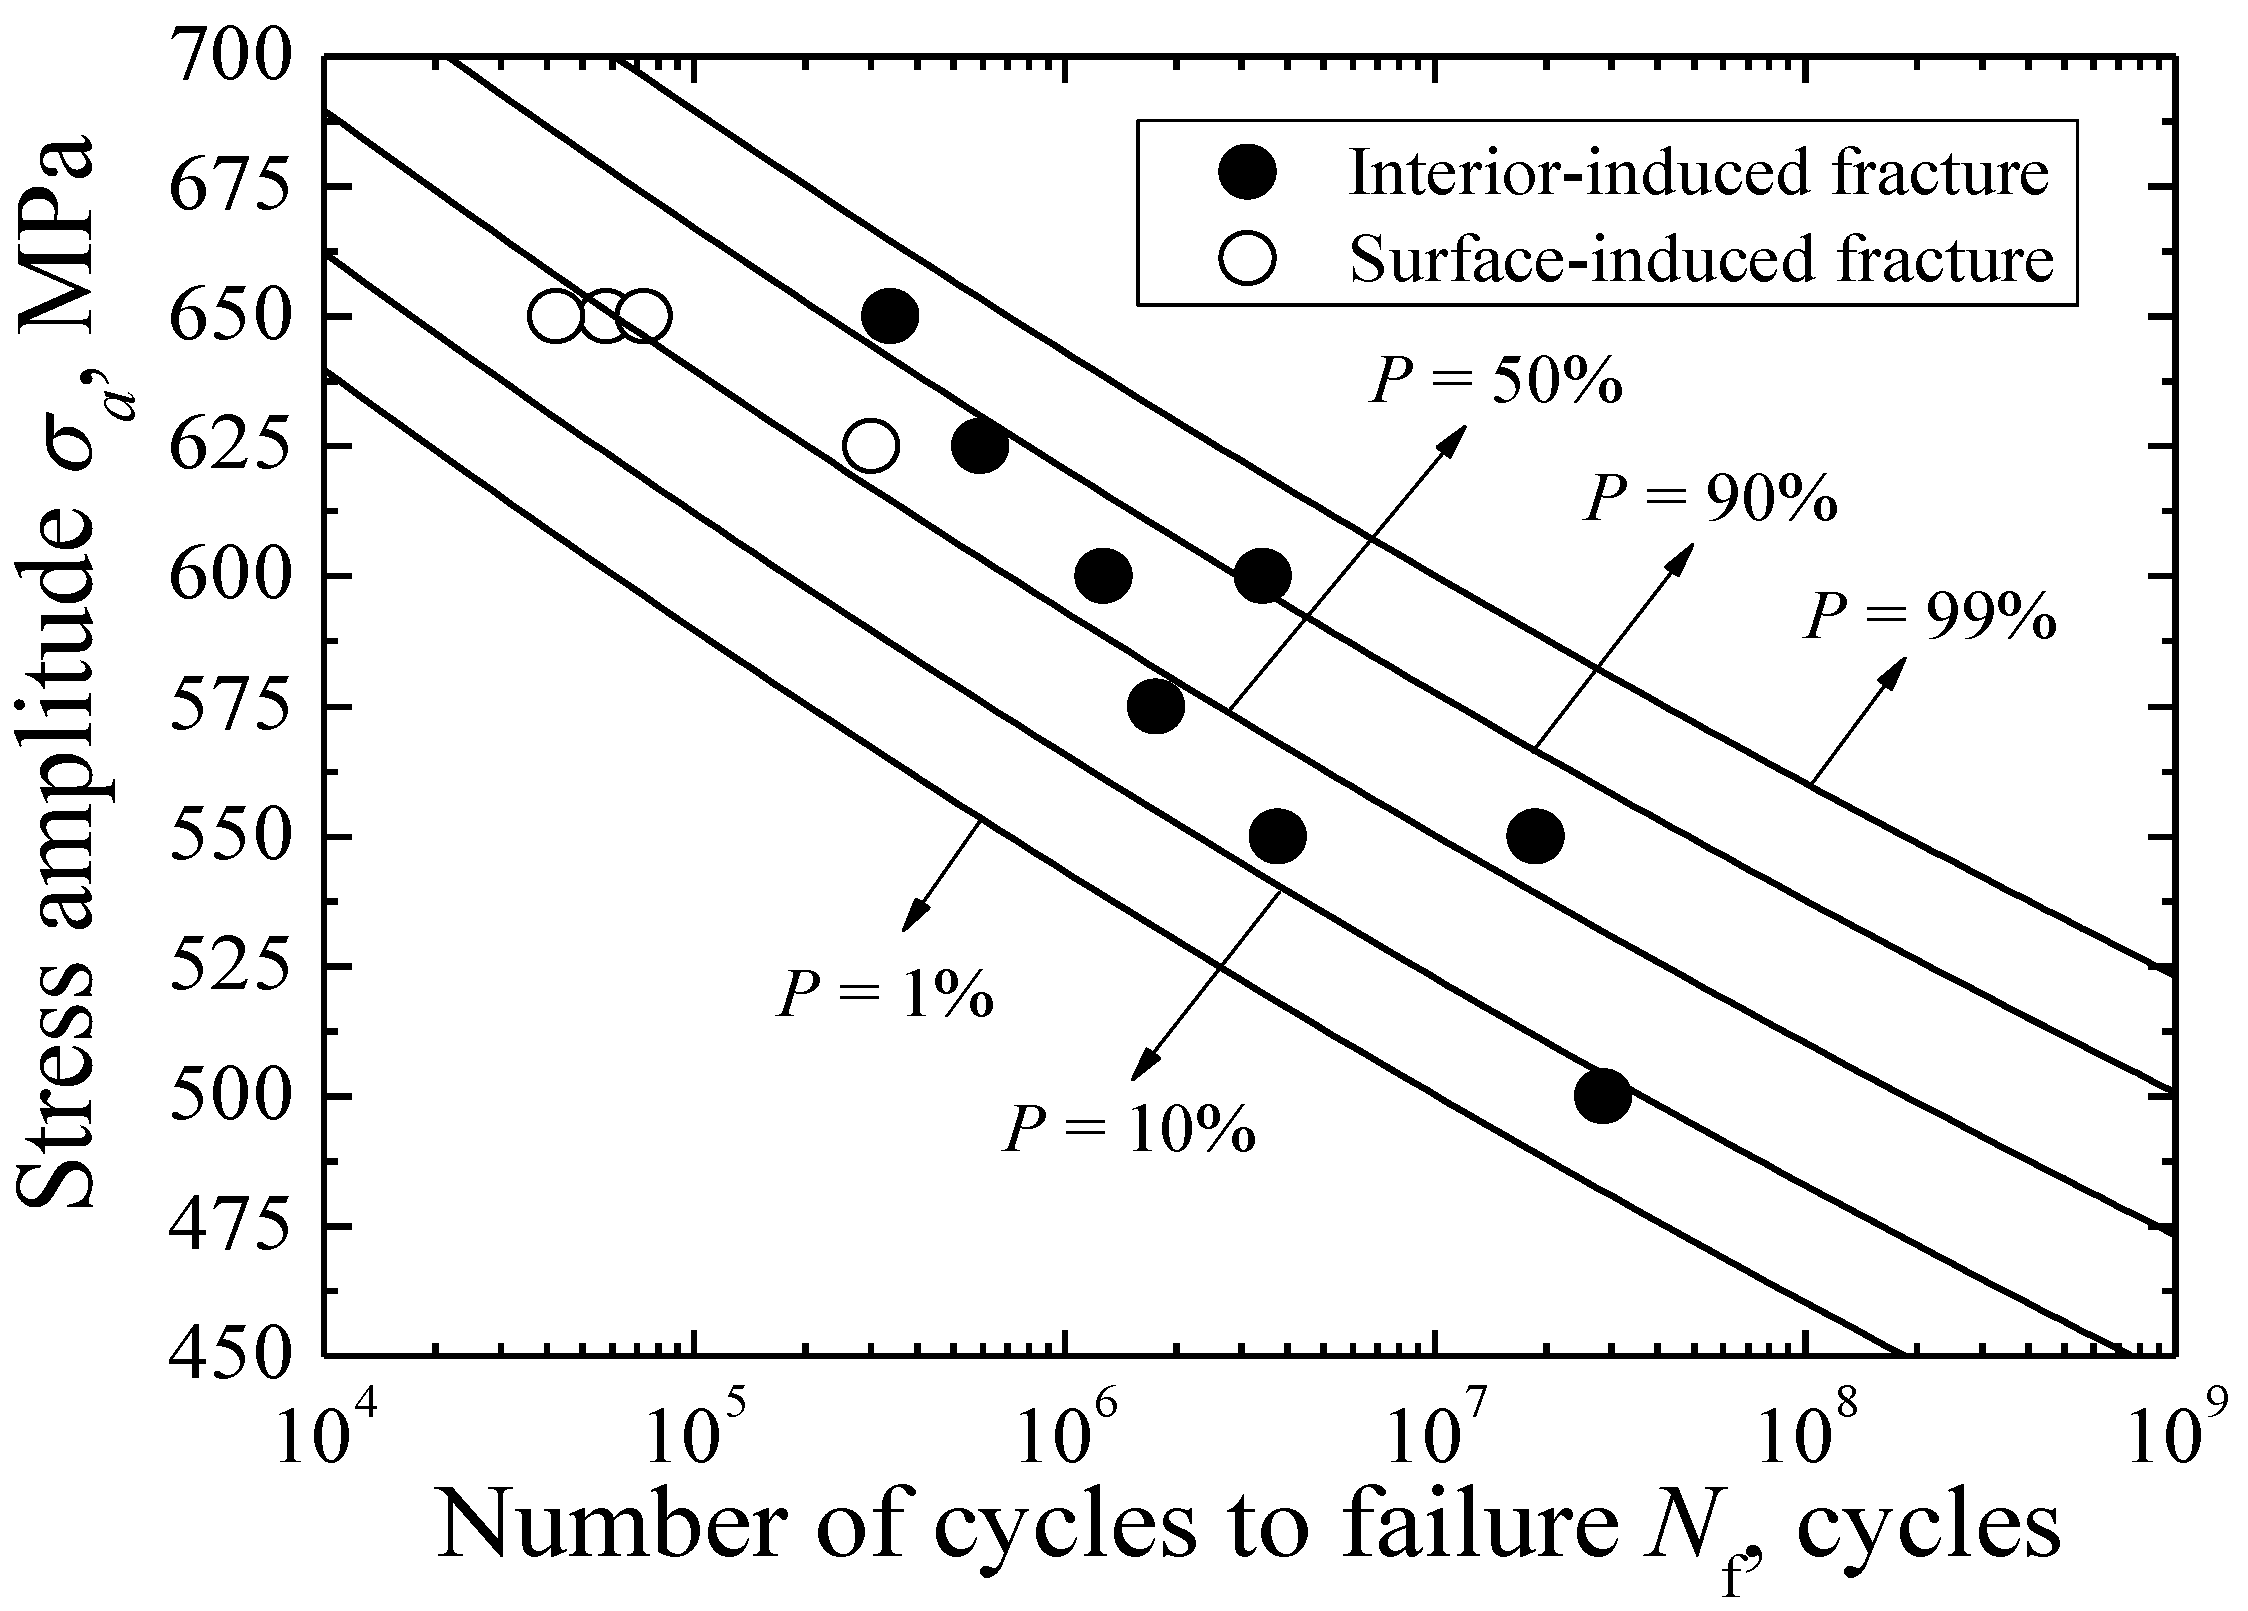
3.1. S-N and P-S-N Characteristics

The S-N diagram of carburized 20Cr gear steel under axial loading with R = 0 is shown in Figure 4. There are two data points with fatigue lives exceeding 107 cycles. Furthermore, some maximum stress data exceed the yield strength slightly, but they do not have much influence on the experimental result. According to the SEM observation of all fracture surfaces, fatigue fractures of specimens can be divided into two modes: surface-induced fracture and interior-induced fracture. The surface-induced fracture occurs in the relatively high stress level with shorter fatigue life, whereas the interior-induced fracture occurs in the relatively low stress level with longer fatigue life. It can be confirmed that the interior-induced fracture is the predominant fracture mode of carburized 20Cr gear steel under axial loading in the life regime beyond 105 cycles. It should be noted that the so-called duplex S-N characteristics [3,7,11] cannot be distinctively observed. This can to some extent be attributed to the axial loading condition with the uniform stress distribution on the cross-section of the specimen. For the interior failure, it can be obviously seen that the relevant S-N property exhibits a continuously descending tendency, which is similar to the results of other steels with interior failure [1,3]. In view of the fact that the separation of test data corresponding to these two facture modes is not so clear, a single S-N curve is plotted to represent the HCF characteristics of carburized 20Cr gear steel under axial loading with a stress ratio of zero, as shown in Figure 4. Consequently, based on the fitting S-N curve, the fatigue strength corresponding to the fatigue life of 109 cycles, σf, is evaluated to be about 455 MPa.
According to the JSMS-SD-6-04 [17], the error in the regression model is generally expressed in normal distribution of N (0, s2) where s2 is the error variance used in regression analysis. This means a model with constant variance in the error distribution showing residuals. That is, for any value of the explanatory variances, the error distribution of the objective variable in the applied model conforms to the normal distribution, with constant variance expressed in N (0, s2). Therefore, in consideration of the fact that the peculiar scatter of σa-value can be better characterized by the normal distribution, the σa-value can be taken as the objective variable, while the value of N can be taken as the explanatory variable. Combined with the S-N equation, the P-S-N curve of carburized 20Cr gear steel can be expressed as:
σ a = ( 7.35 × 10 76 N ) 1 25.53 μ p · s
where s denotes the standard deviation in σa-value distribution, and μp is the standard normal variate corresponding to a given probability. In fact, the value of σa obtained from the S-N equation is just the value of σa under P = 50%. Thus, the values of σa at five survival probabilities, including 1%, 10%, 50%, 90%, and 99%, can be calculated, and the relevant P-S-N curves are plotted in Figure 5.

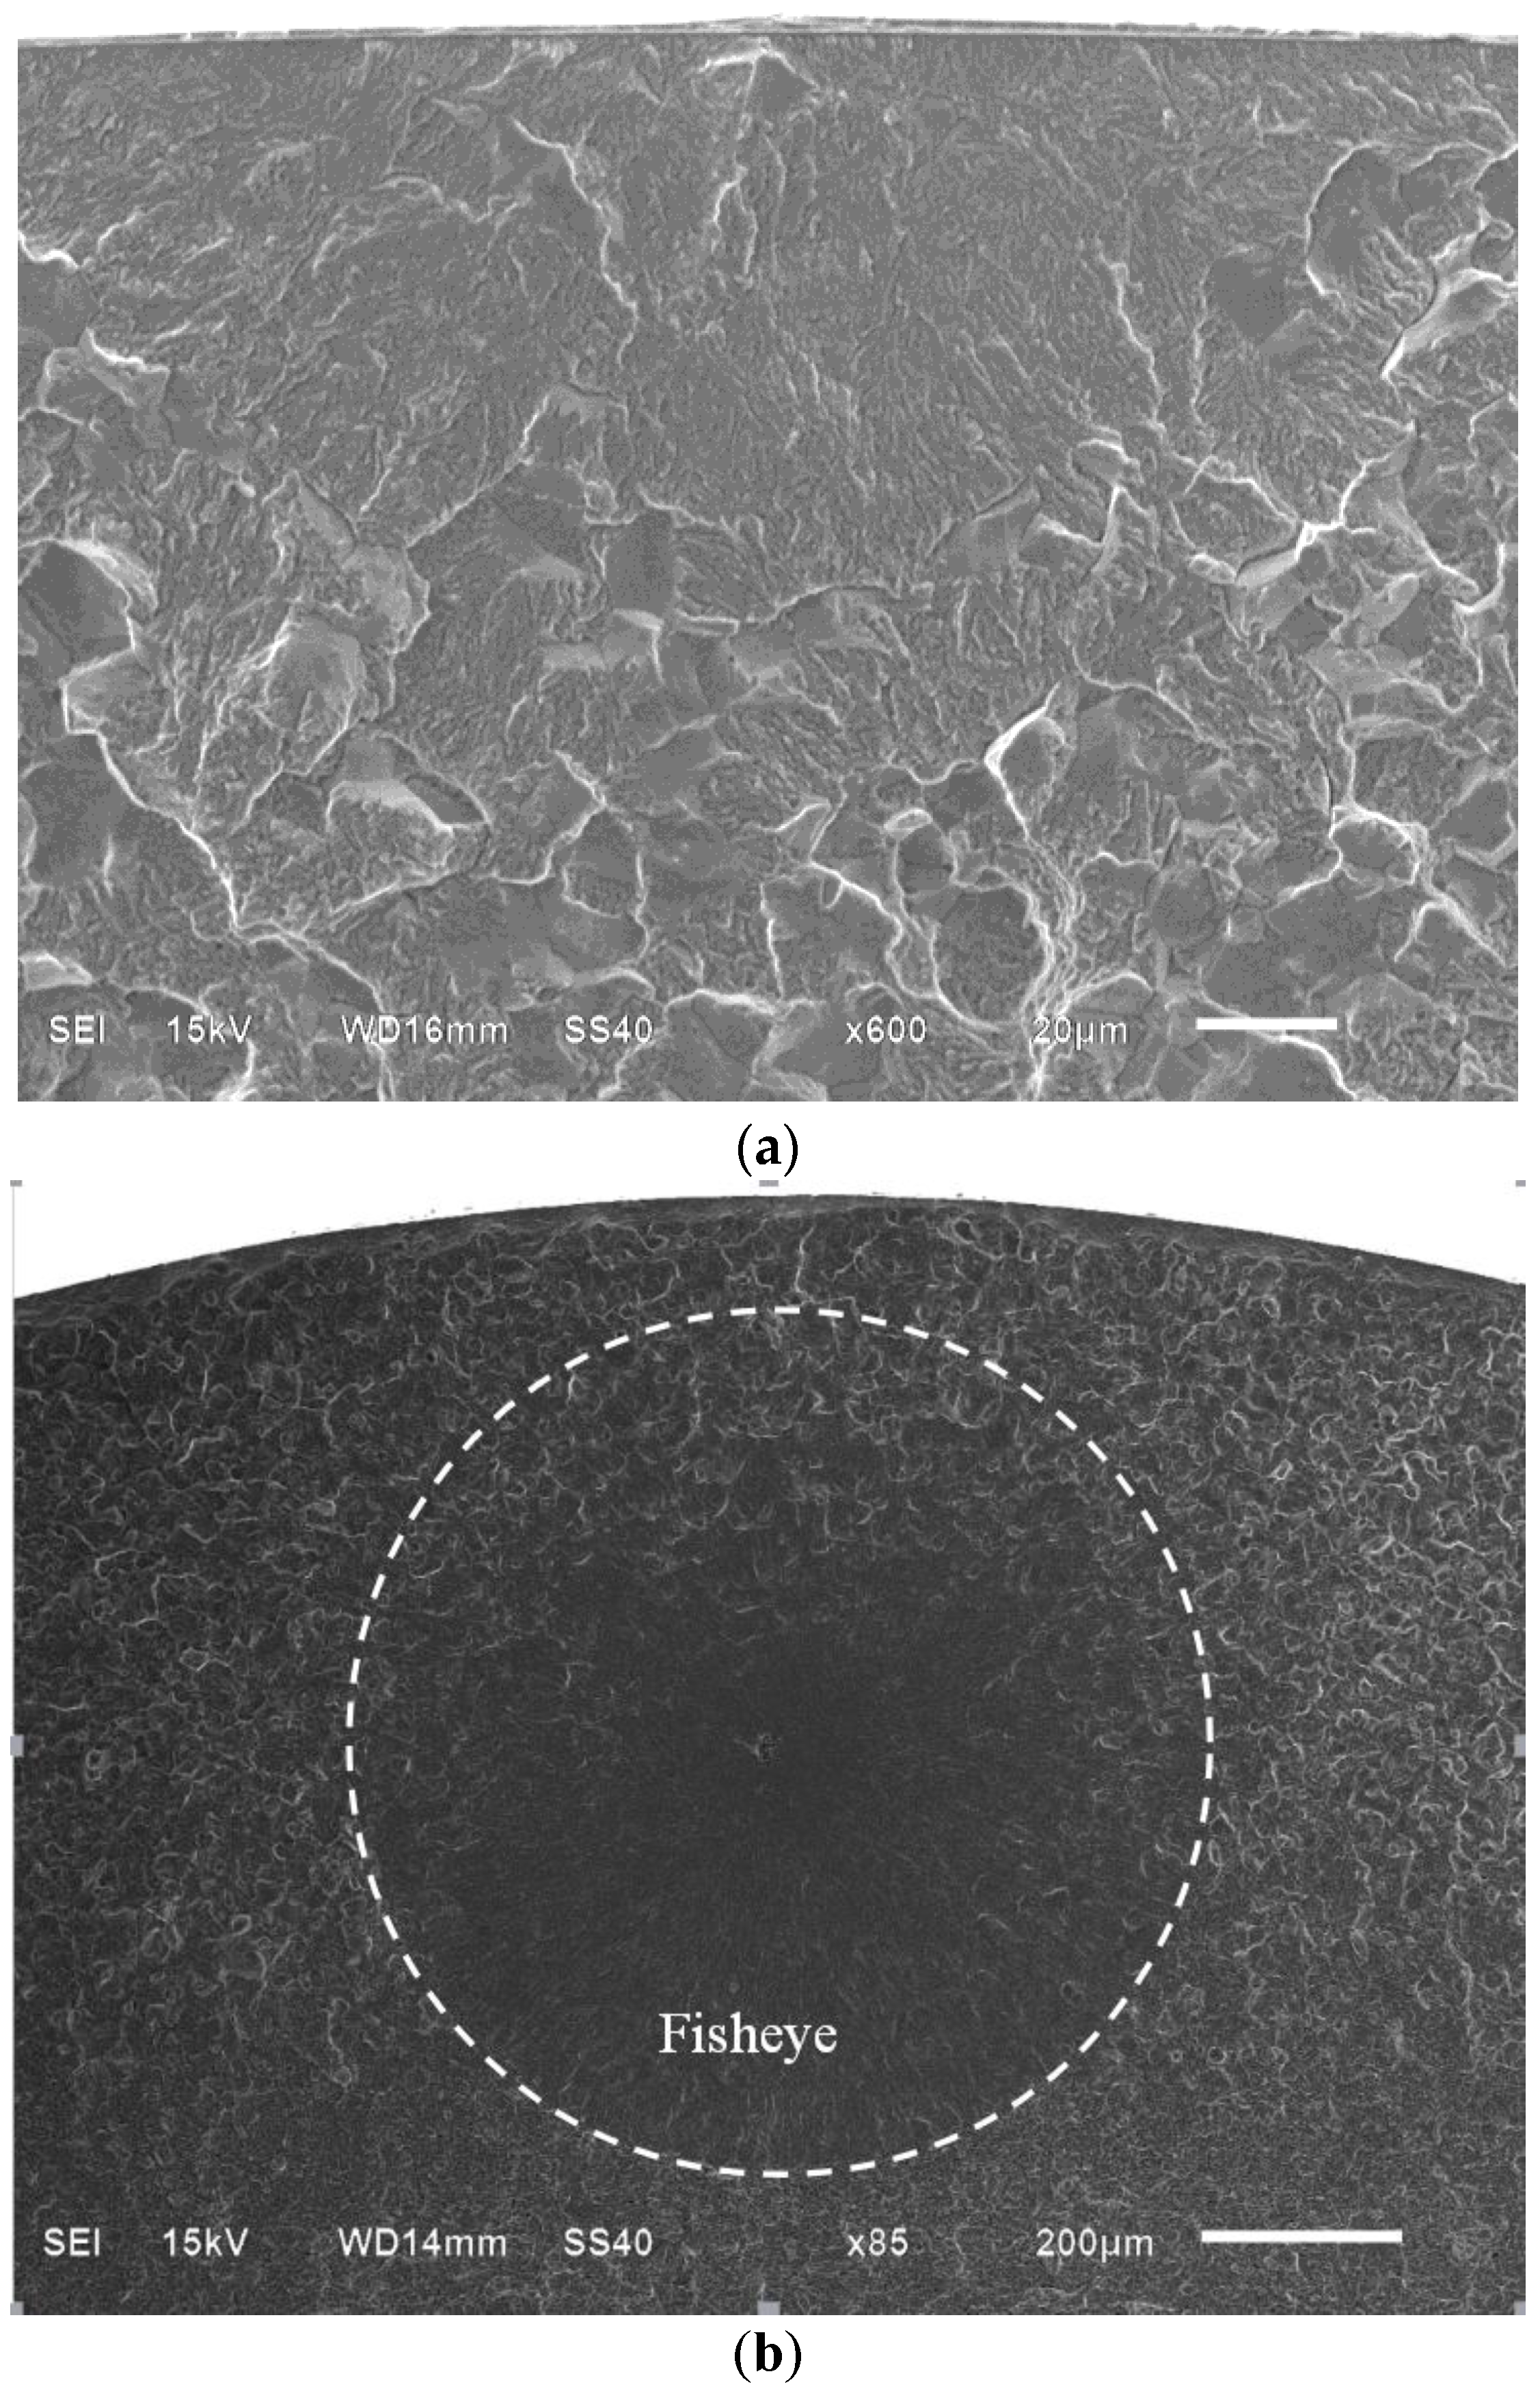
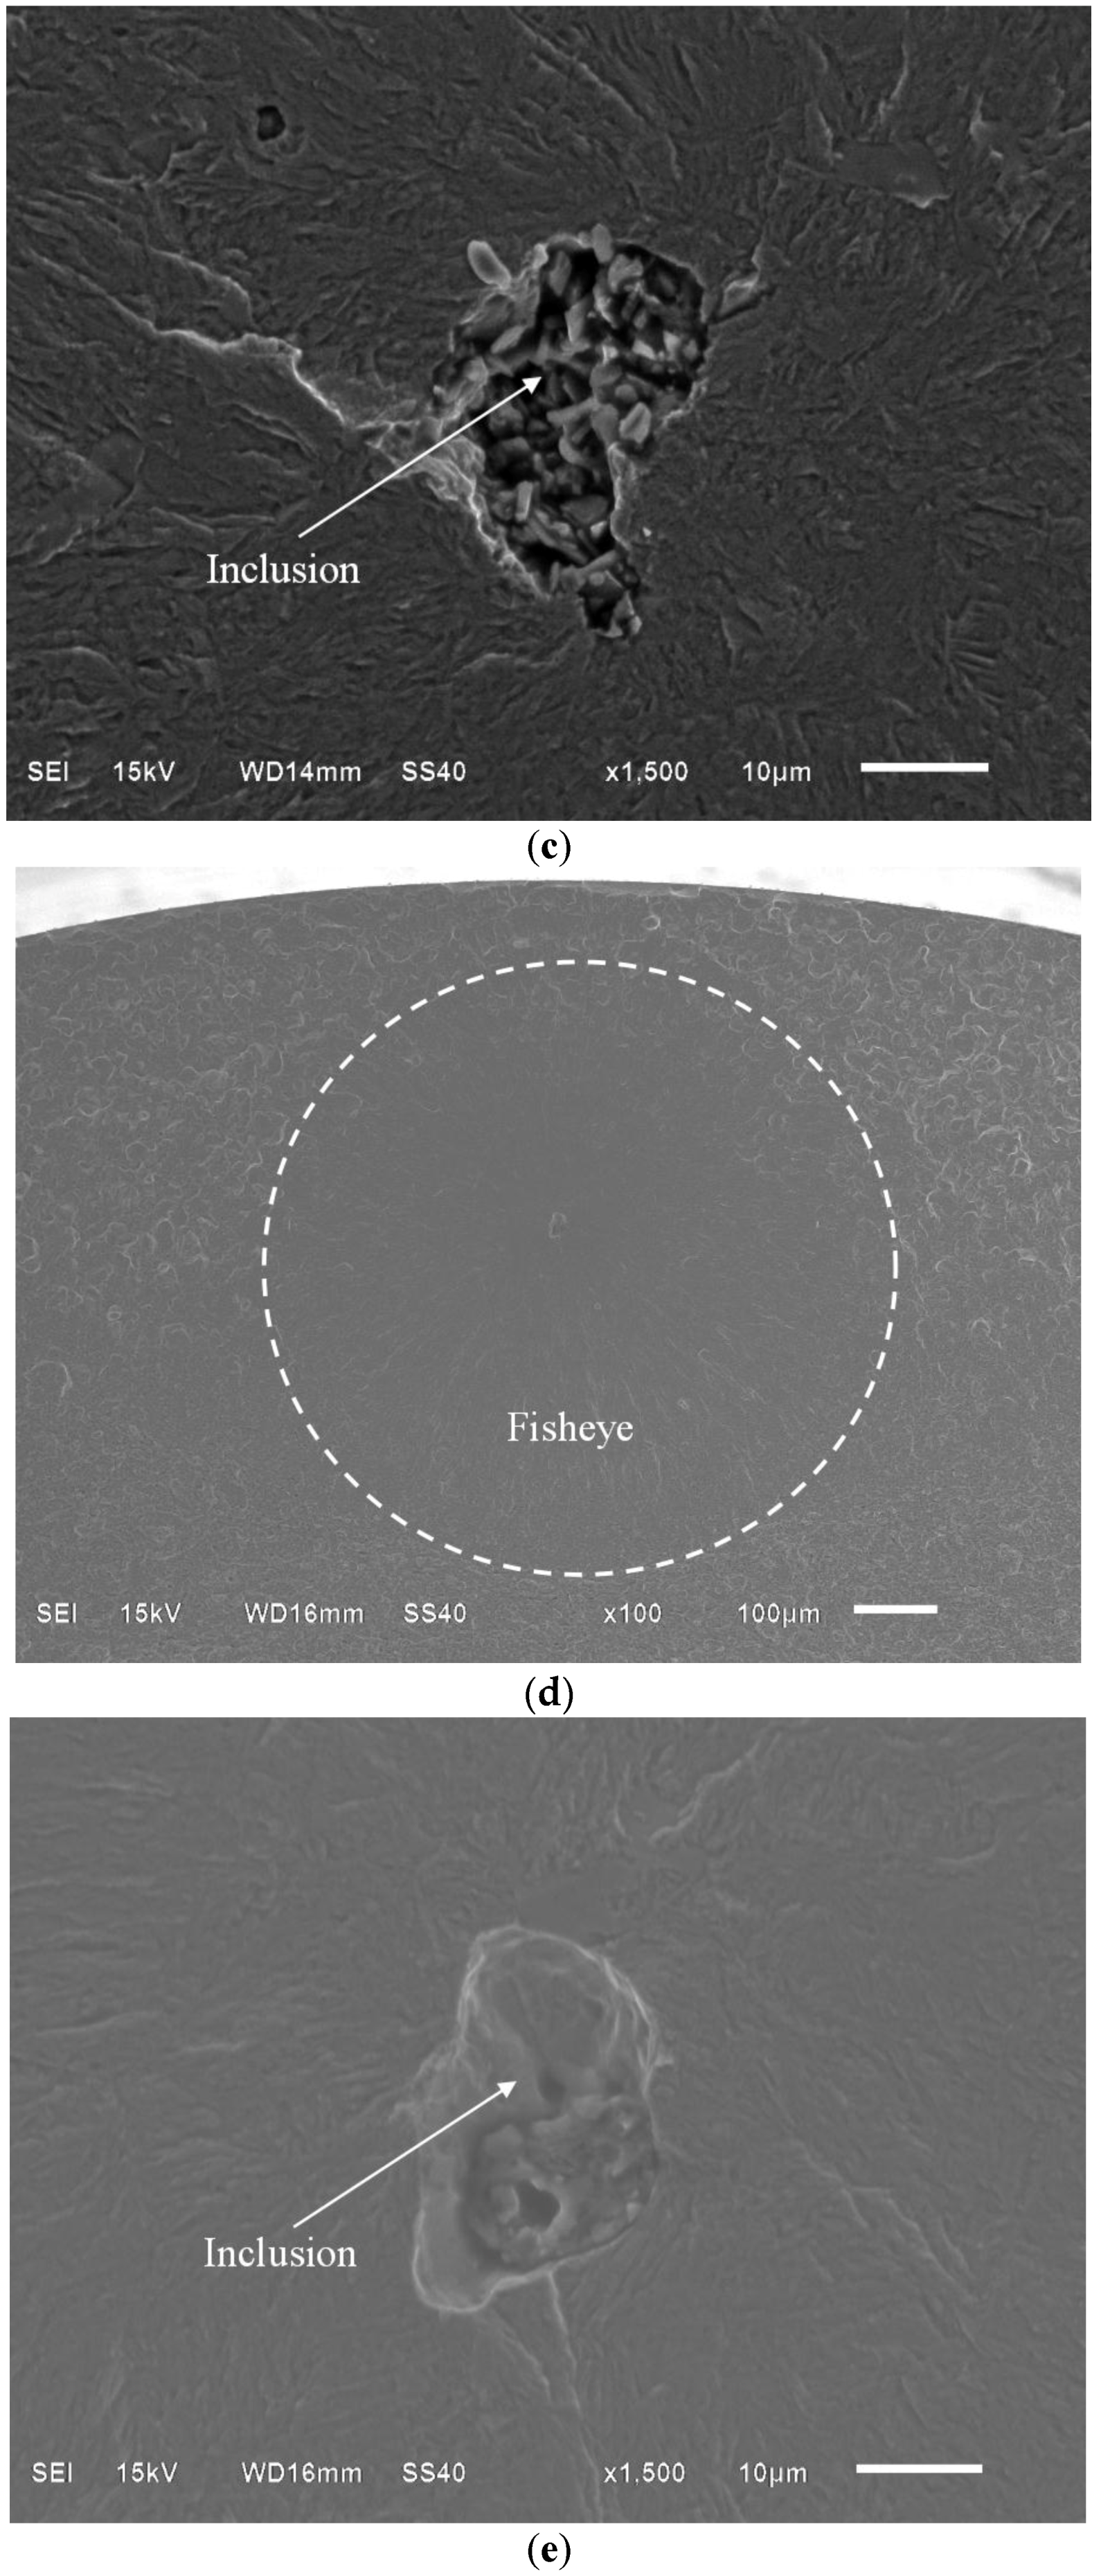
3.2. Crack Initiation Mode

As previously mentioned, fatigue fractures of specimens consist of surface-induced fracture and interior-induced fracture. For the surface-induced fracture, fatigue cracks all originate from machining defects, as shown in Figure 6a.
For interior-induced fracture, the nonmetallic inclusion plays a key role in causing the crack initiation. An isolated fisheye can be found on the fracture surface, and the inclusion is basically located at the center of the fisheye, as shown in Figure 6b. However, the FGA cannot be observed around the inclusion whether the fatigue life is beyond 107 cycles (Figure 6b,c) or the fatigue life is below 107 cycles (Figure 6d,e). Obviously, the interior crack initiation is the predominant failure mode of this carburized steel. First, it is attributed to the existence of surface compressive residual stress and surface harder layer caused by carburization. Furthermore, in order to keep the mechanical state of equilibrium, the slight tensile residual stress can also exist in the interior matrix region, especially approaching the carburized layer. Therefore, it can also promote the interior crack initiation to some extent.

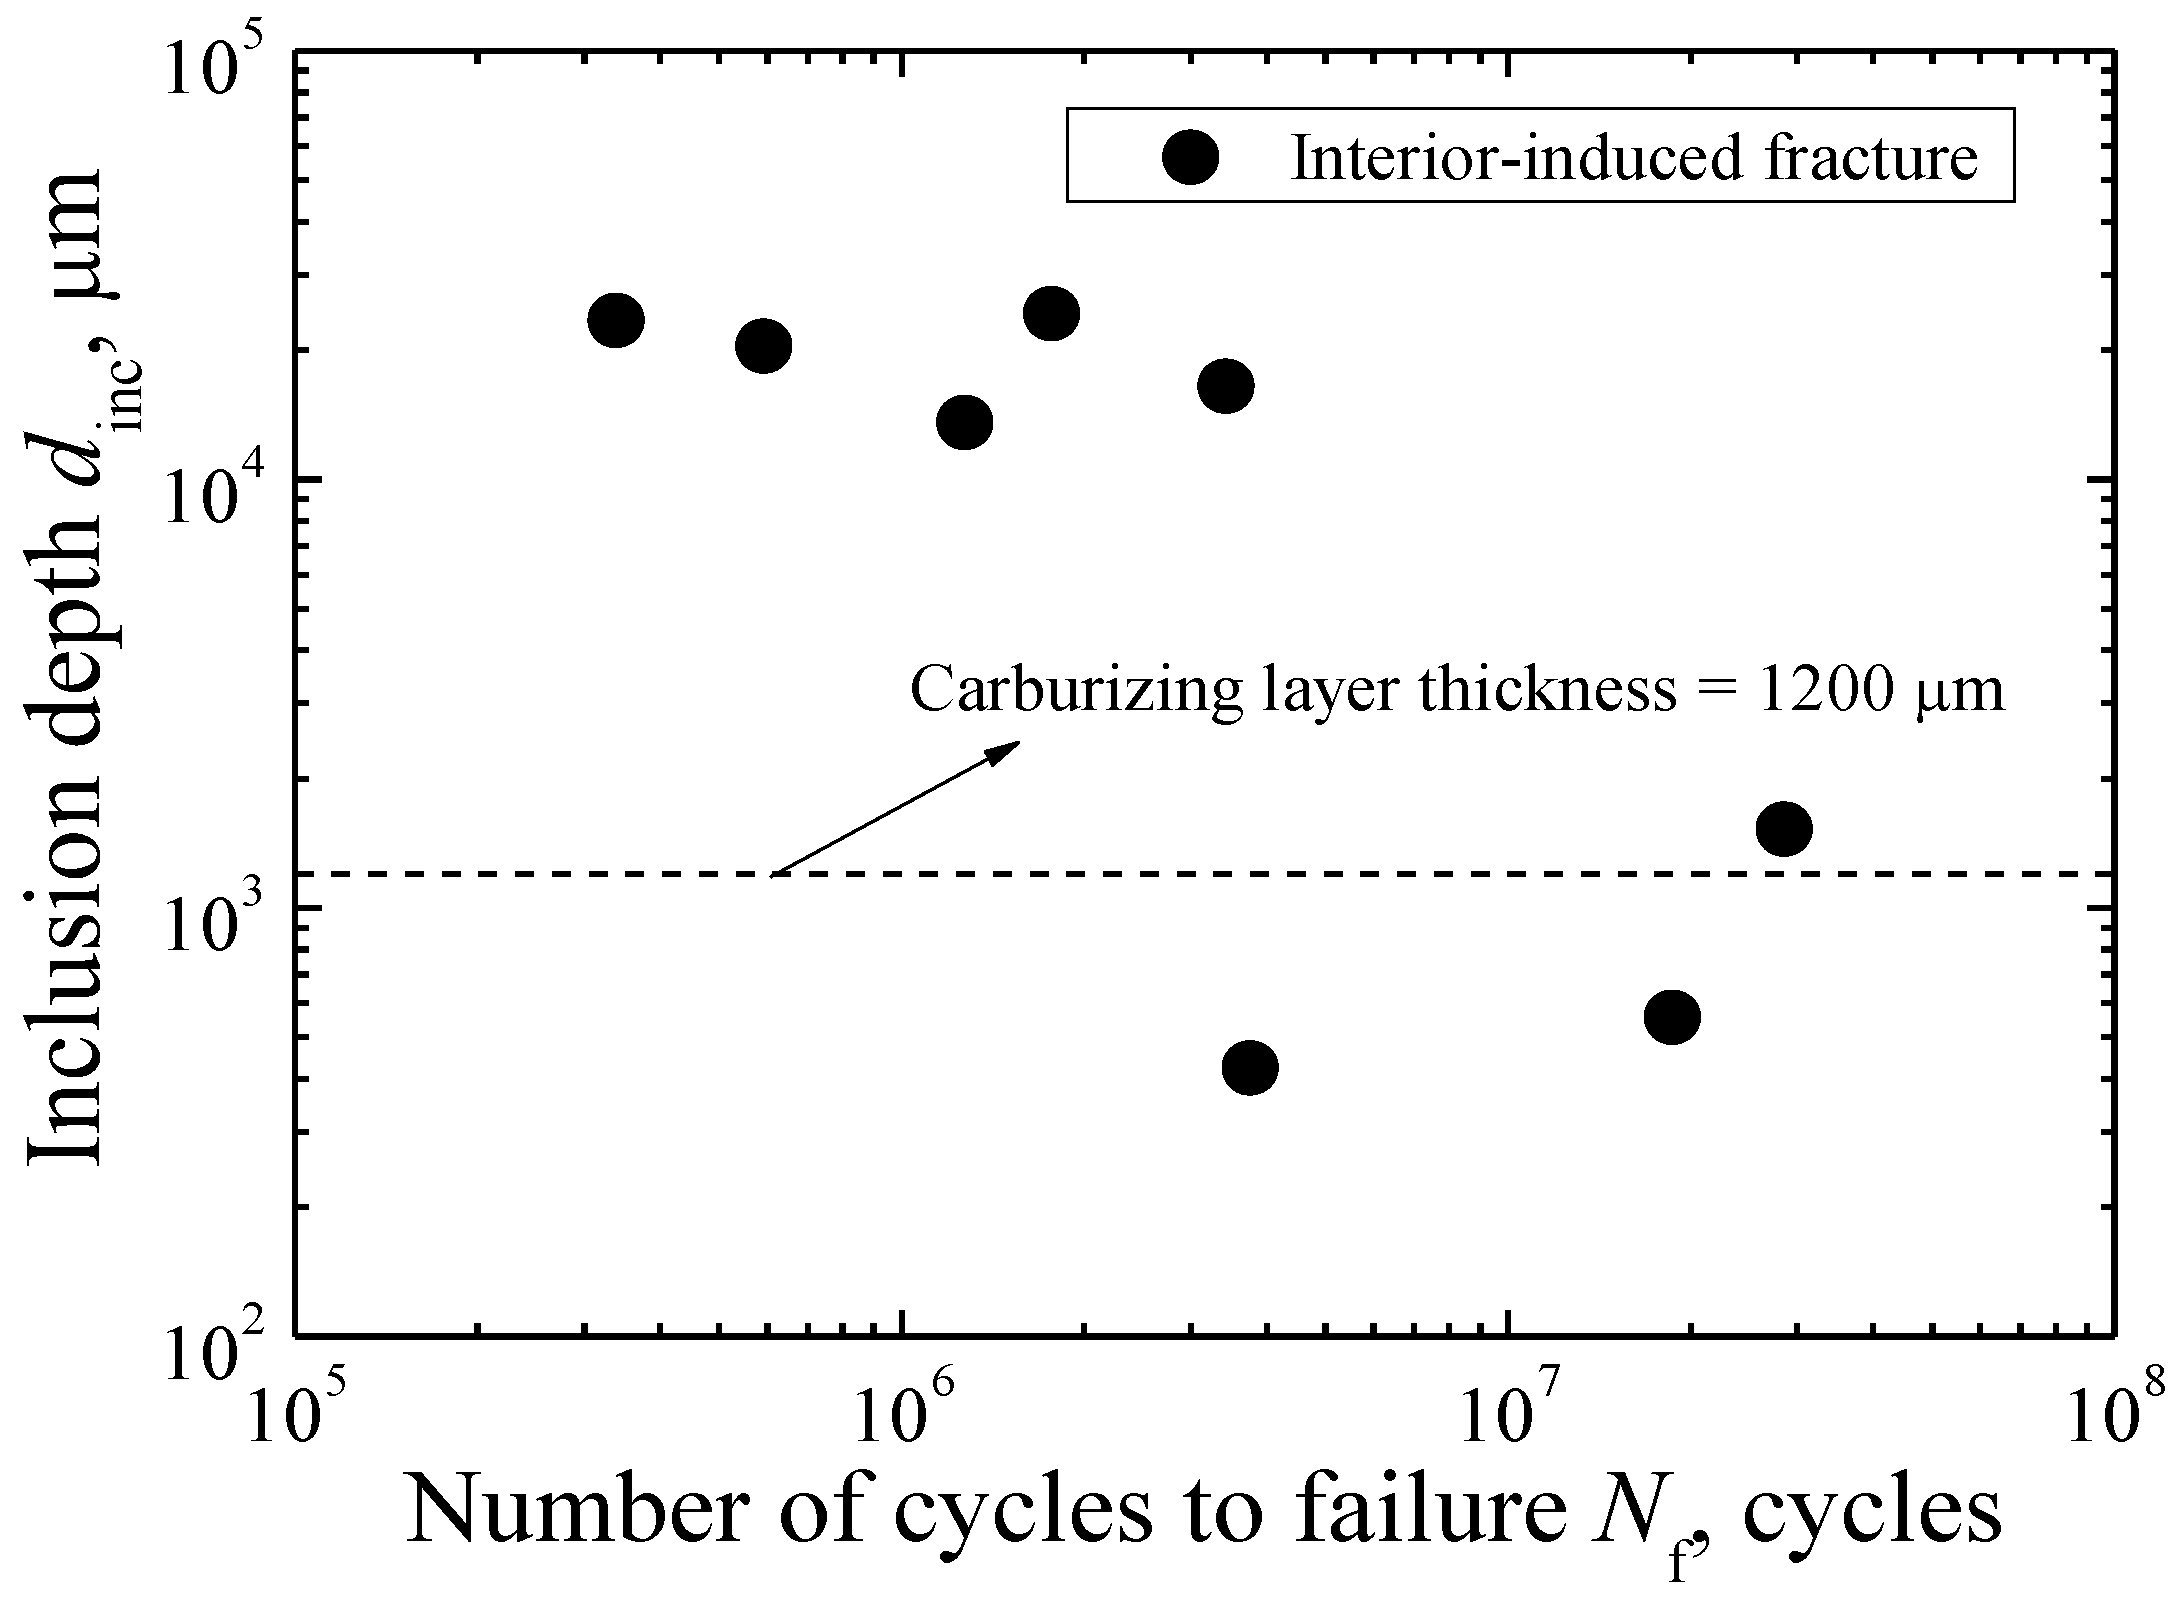
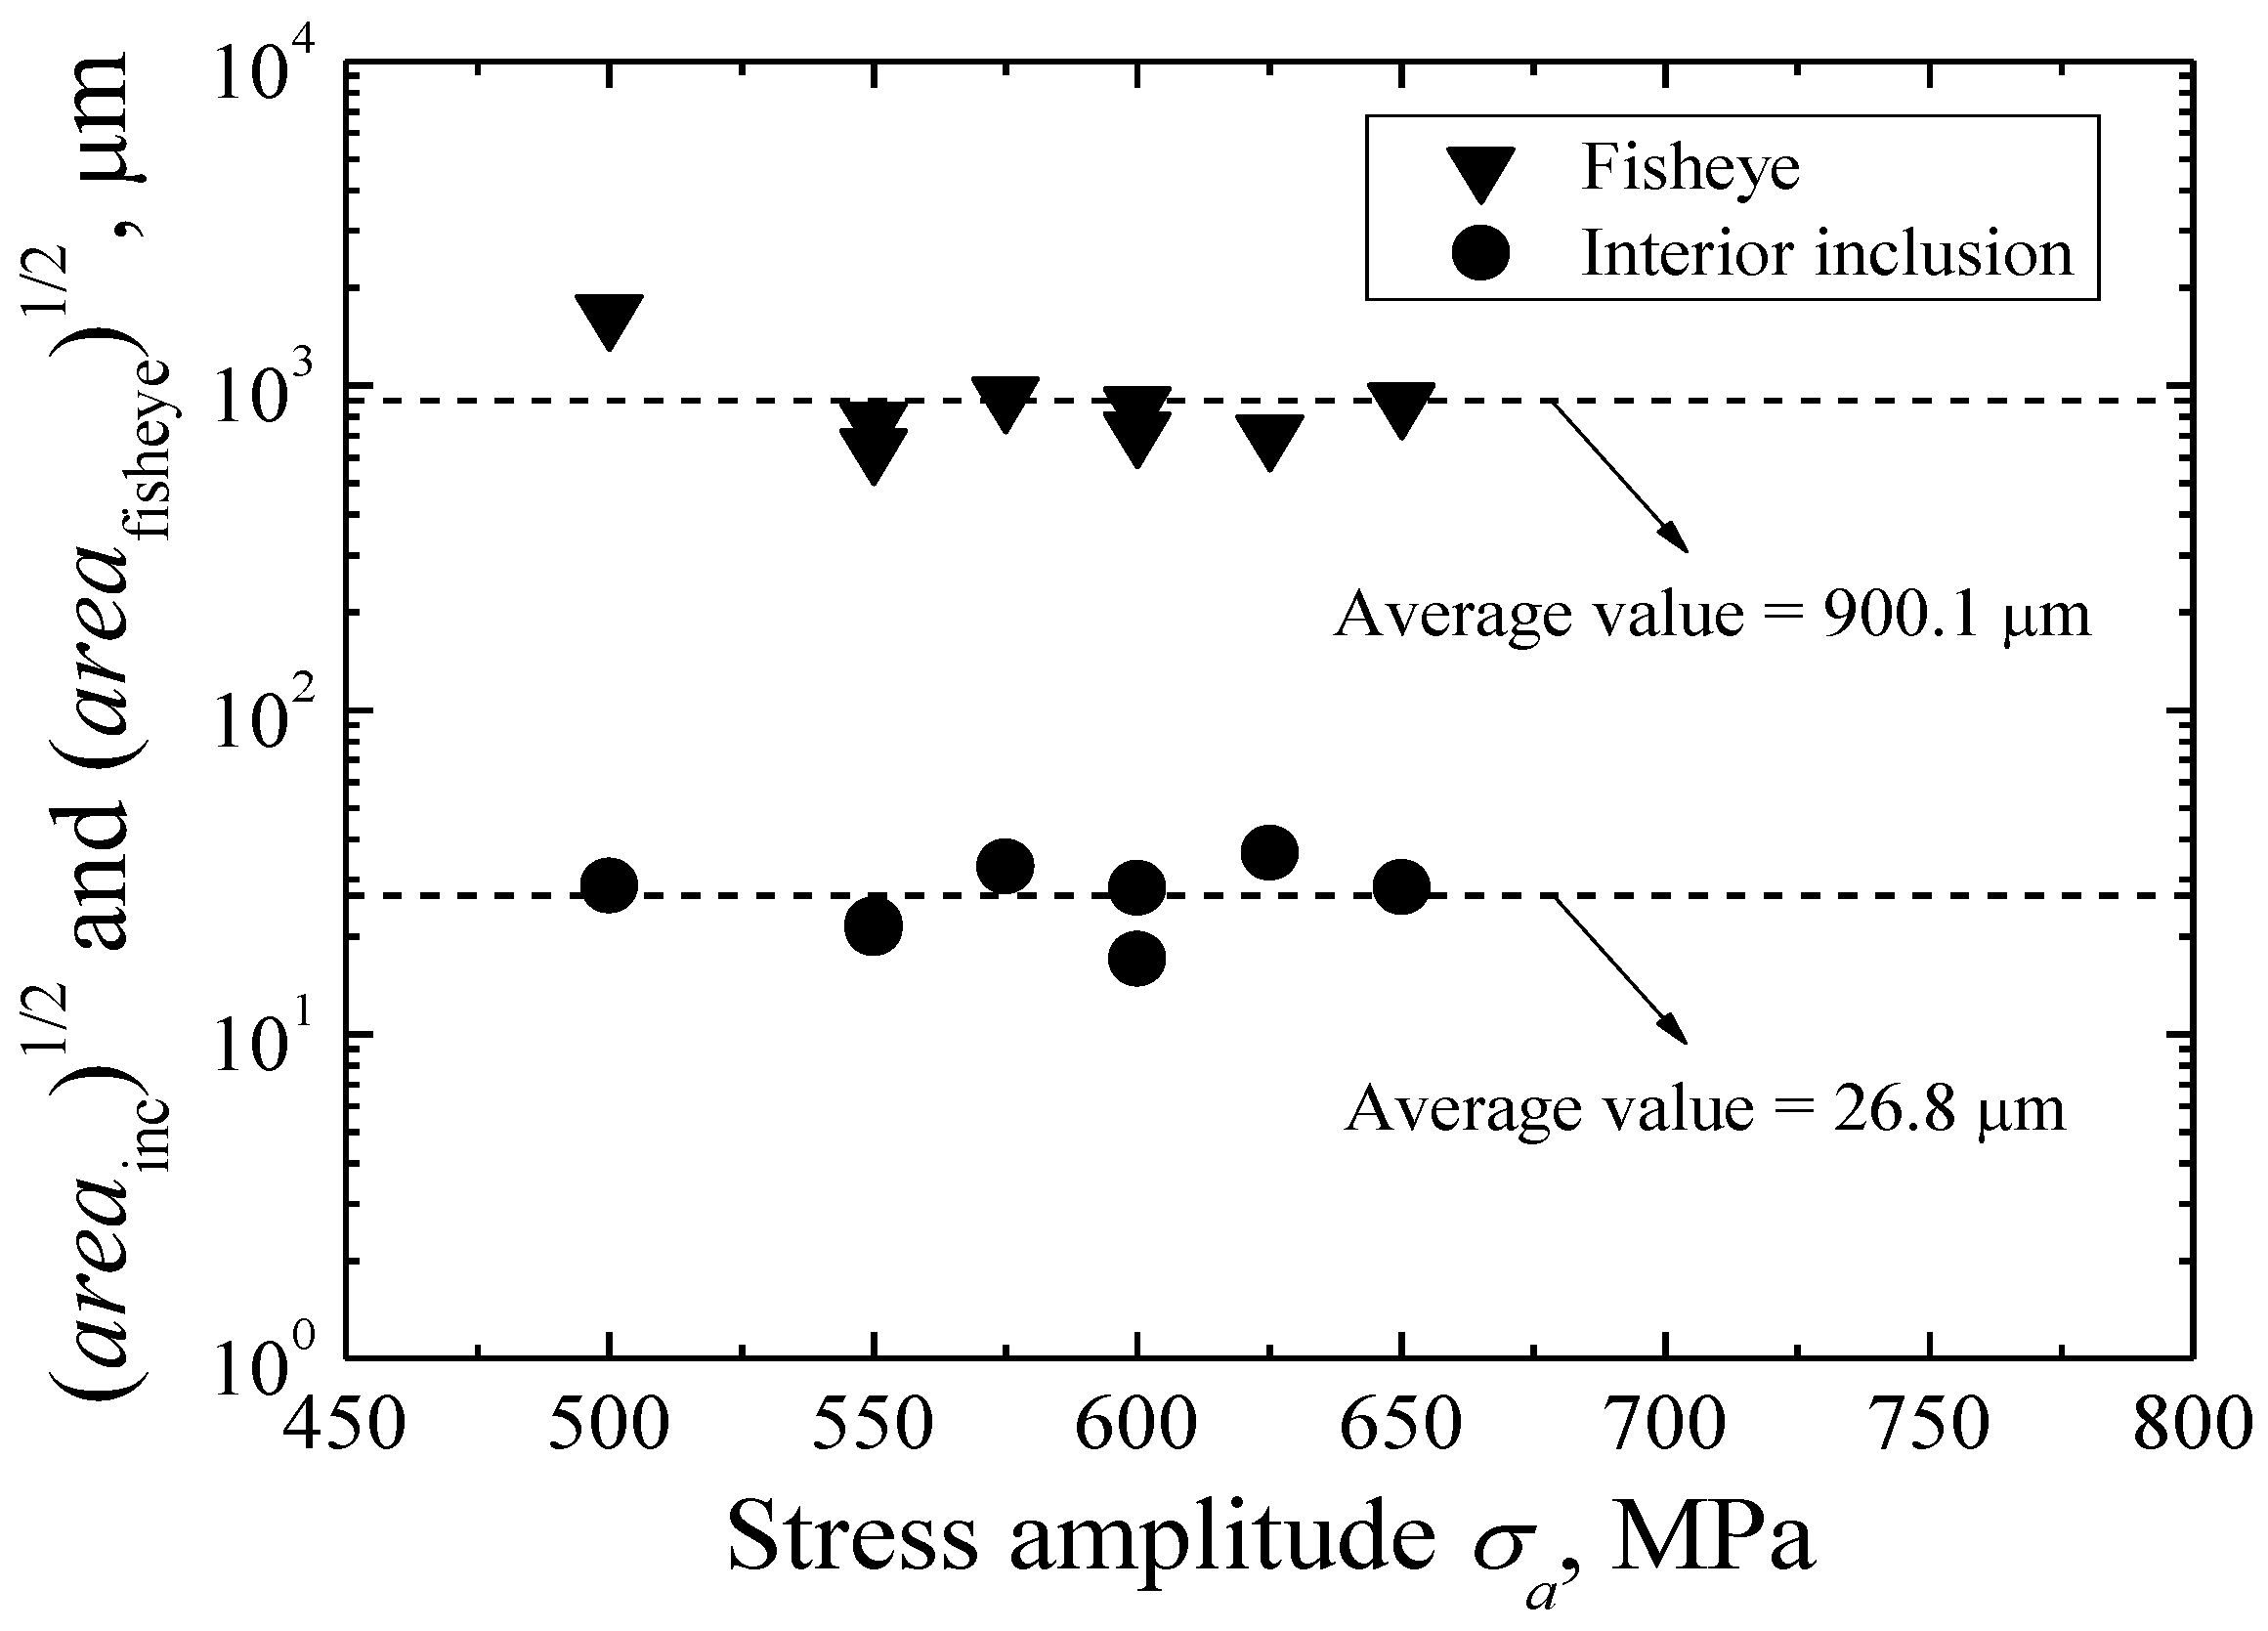
3.3. Characteristic Crack Size

Based on the fractography, several parameters were defined to discuss interior defect/crack geometrical characteristics. The parameter dinc denotes the depth of inclusion from its center to the nearest fracture surface edge. Furthermore, the parameter (area)1/2 denotes the size of the defect or crack, evaluated by the square root of its area. For the inclusion and the fisheye, their sizes are indicated by (areainc)1/2 and (areafisheye)1/2 (including (areainc)1/2), respectively.
Figure 7 shows the relationship between dinc and Nf. Most of the values of dinc are in the range of 13,546–24,338 μm, and are larger than the thickness of carburized layer, whereas only two values of dinc are less than it. This means that the carburized layer can effectively restrain the possibility of fatigue crack initiation originating from inclusions contained in the layer itself. Furthermore, it can be seen that the values of dinc are almost regardless of fatigue life.
The Figure 8 shows the relationships between (areainc)1/2 and (areafisheye)1/2, and σa. The values of (areainc)1/2 are scattered in the range of 17.1–36.3 μm with an average value of 26.8 μm, while the values of (areafisheye)1/2 are scatted in the range of 643.5–1664.1 μm with an average value of 900.1 μm.

4. Discussion

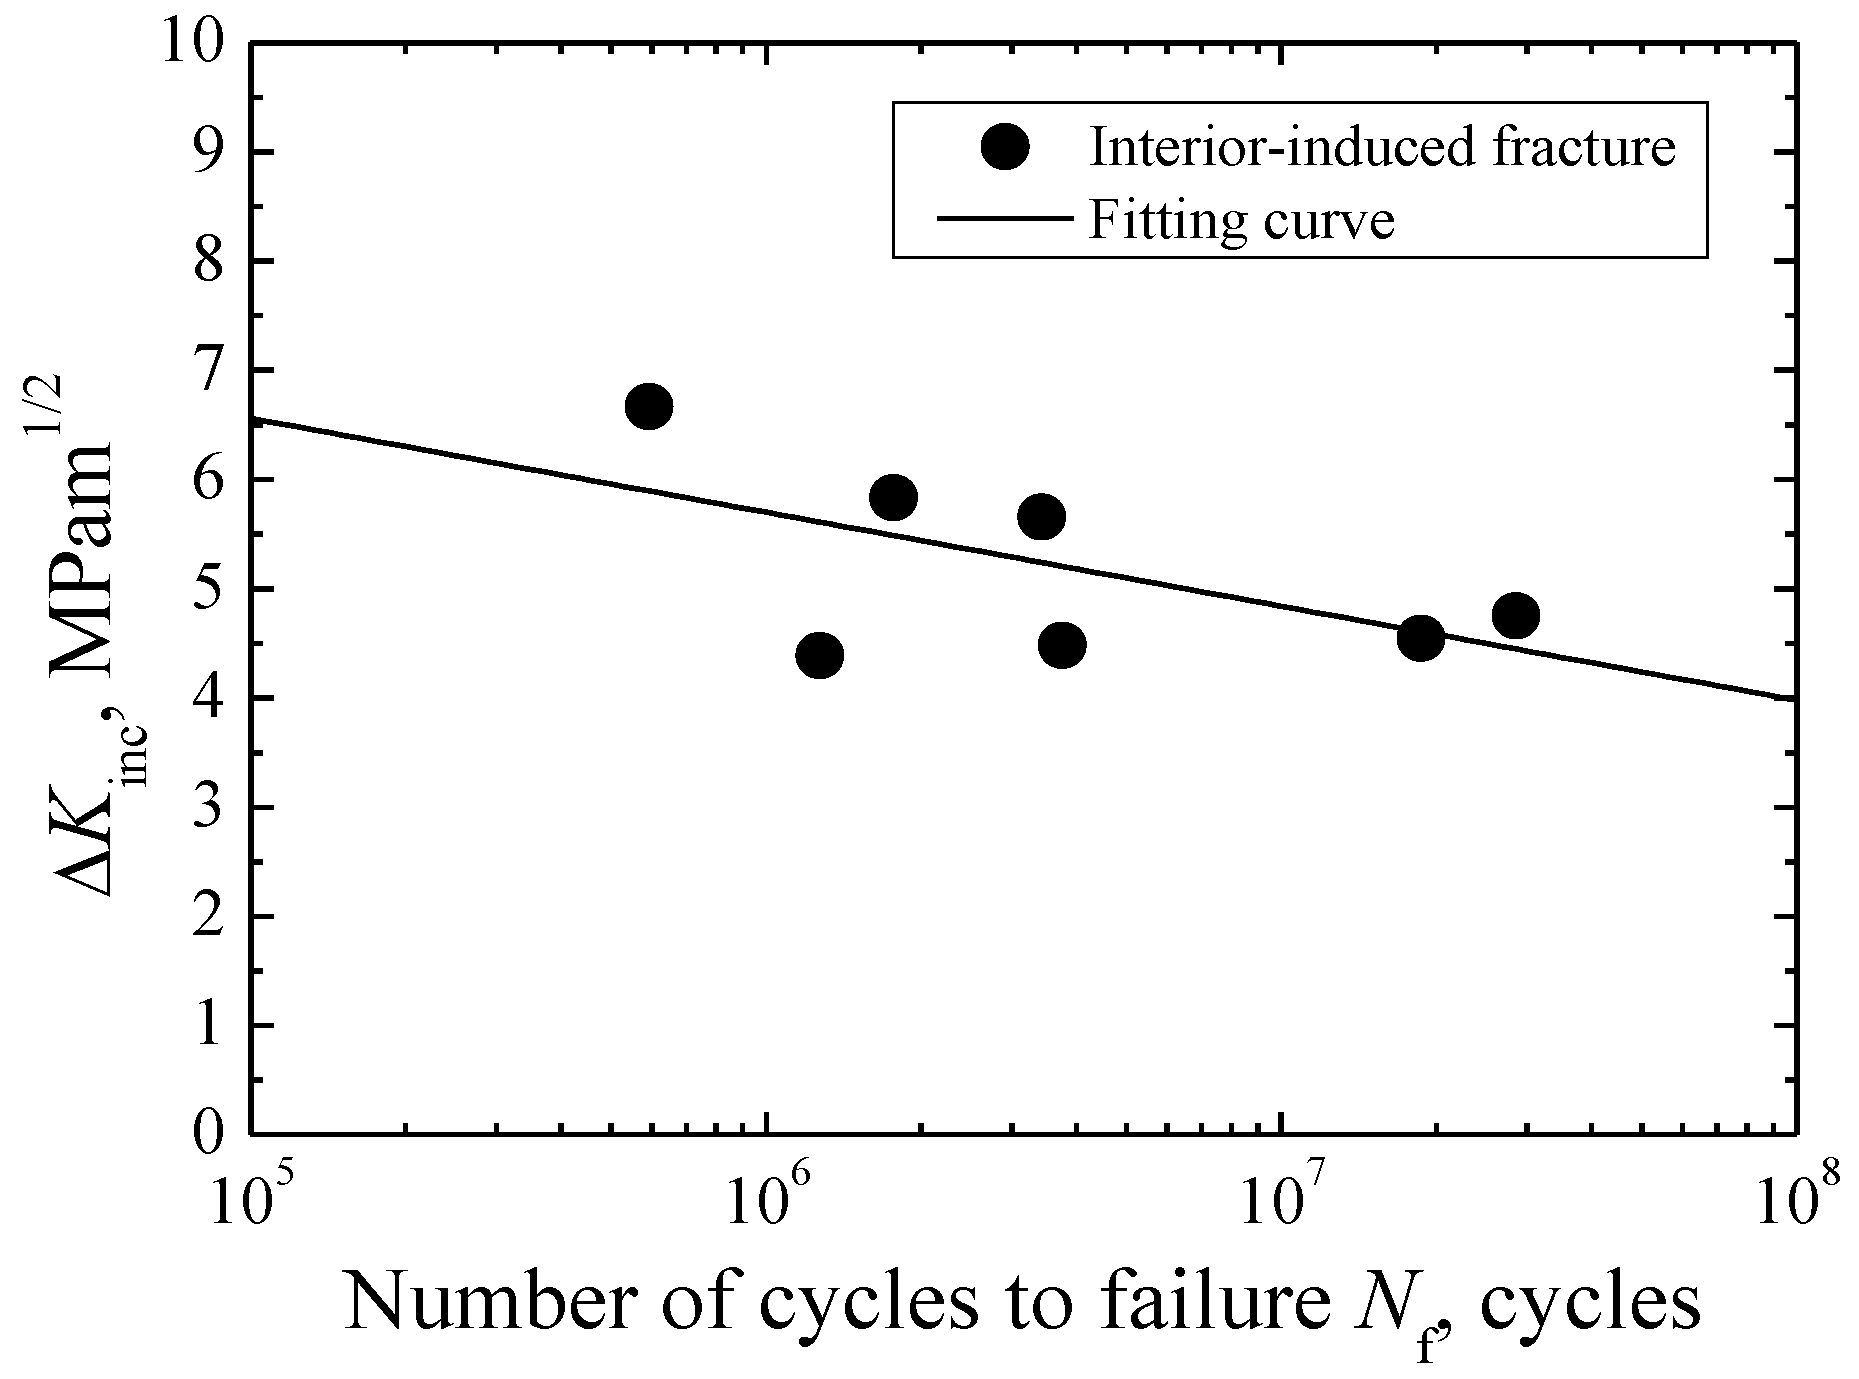
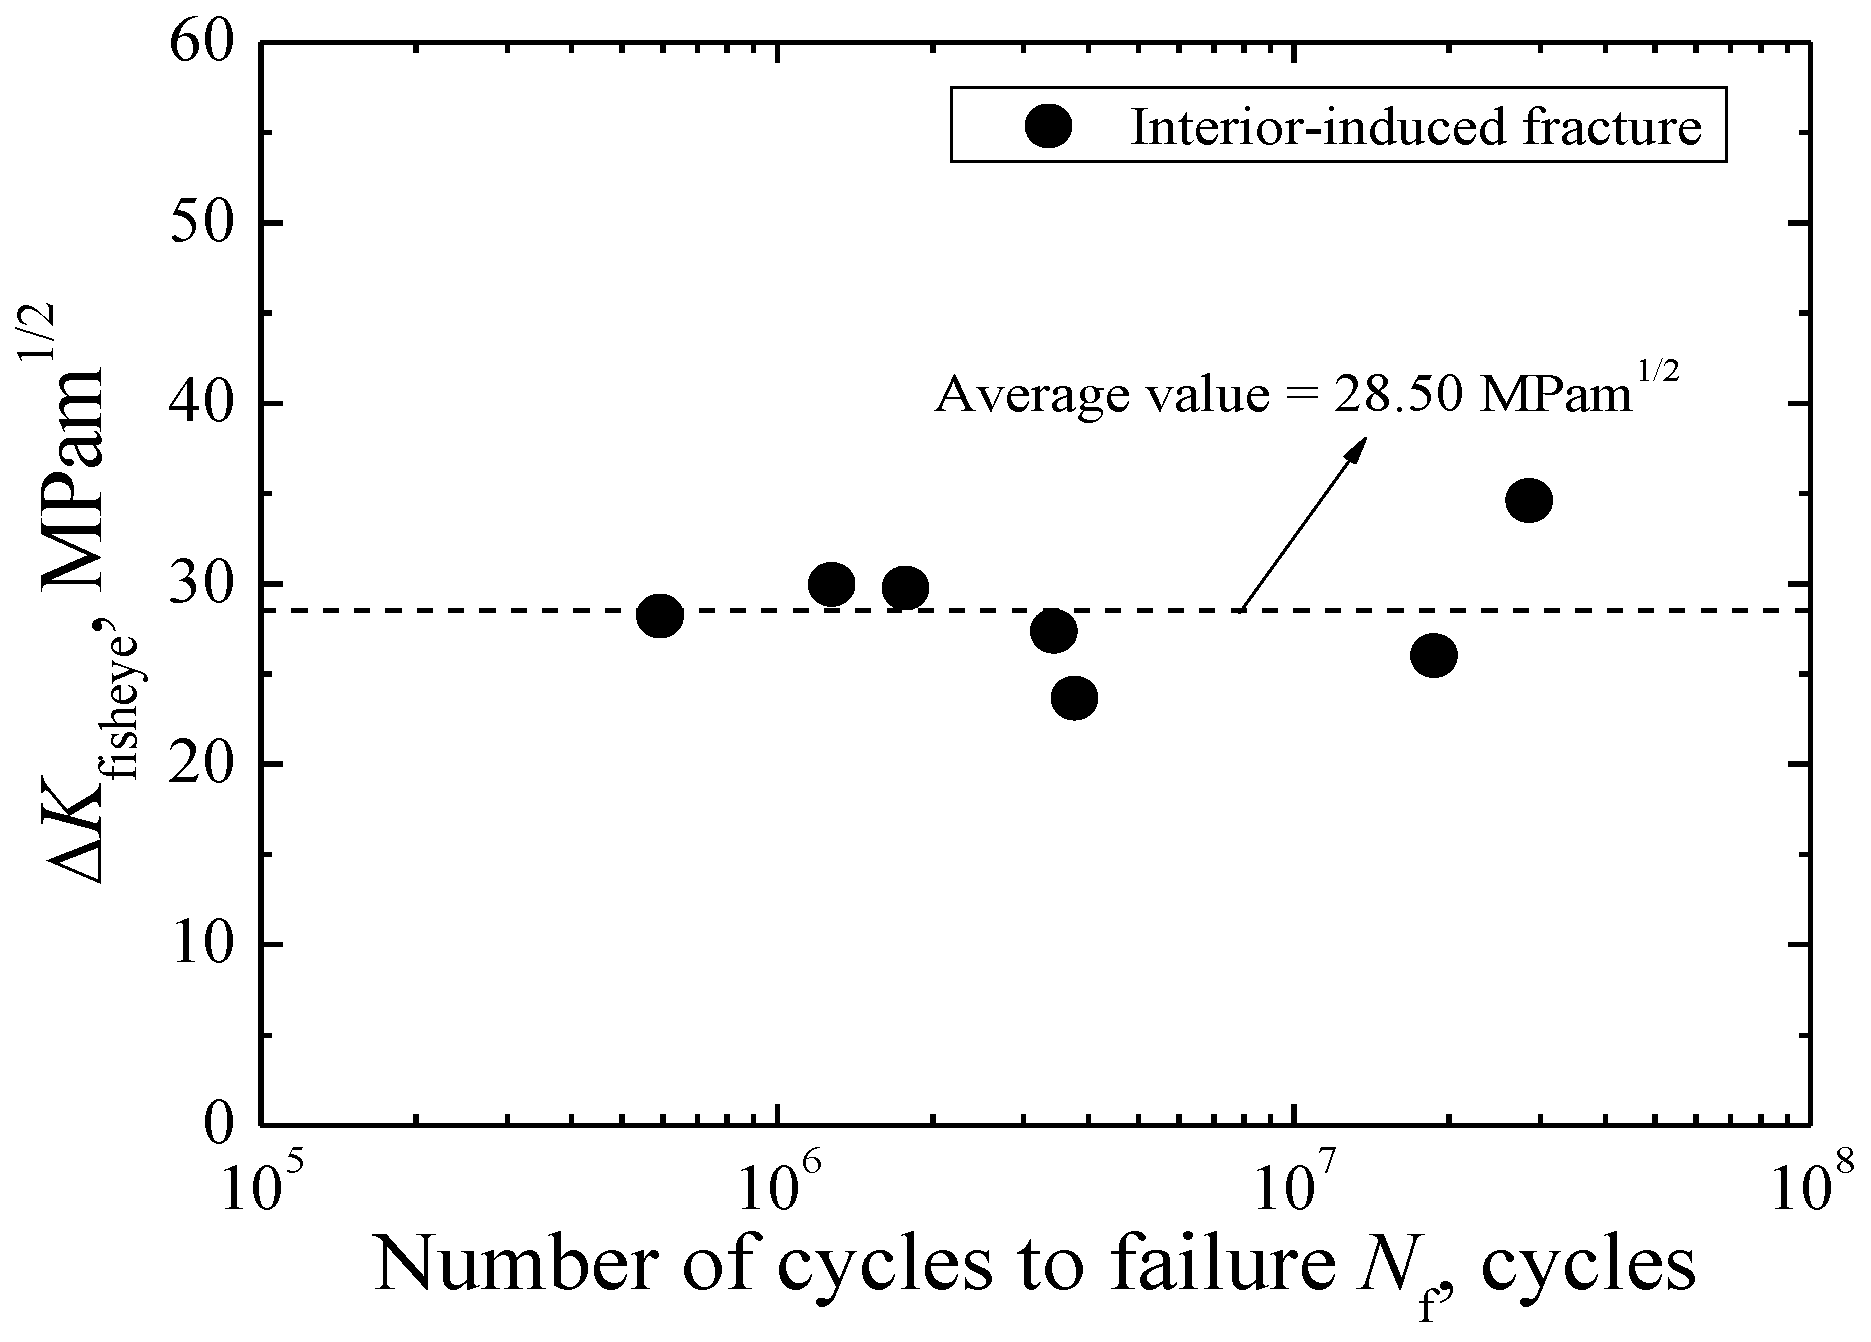
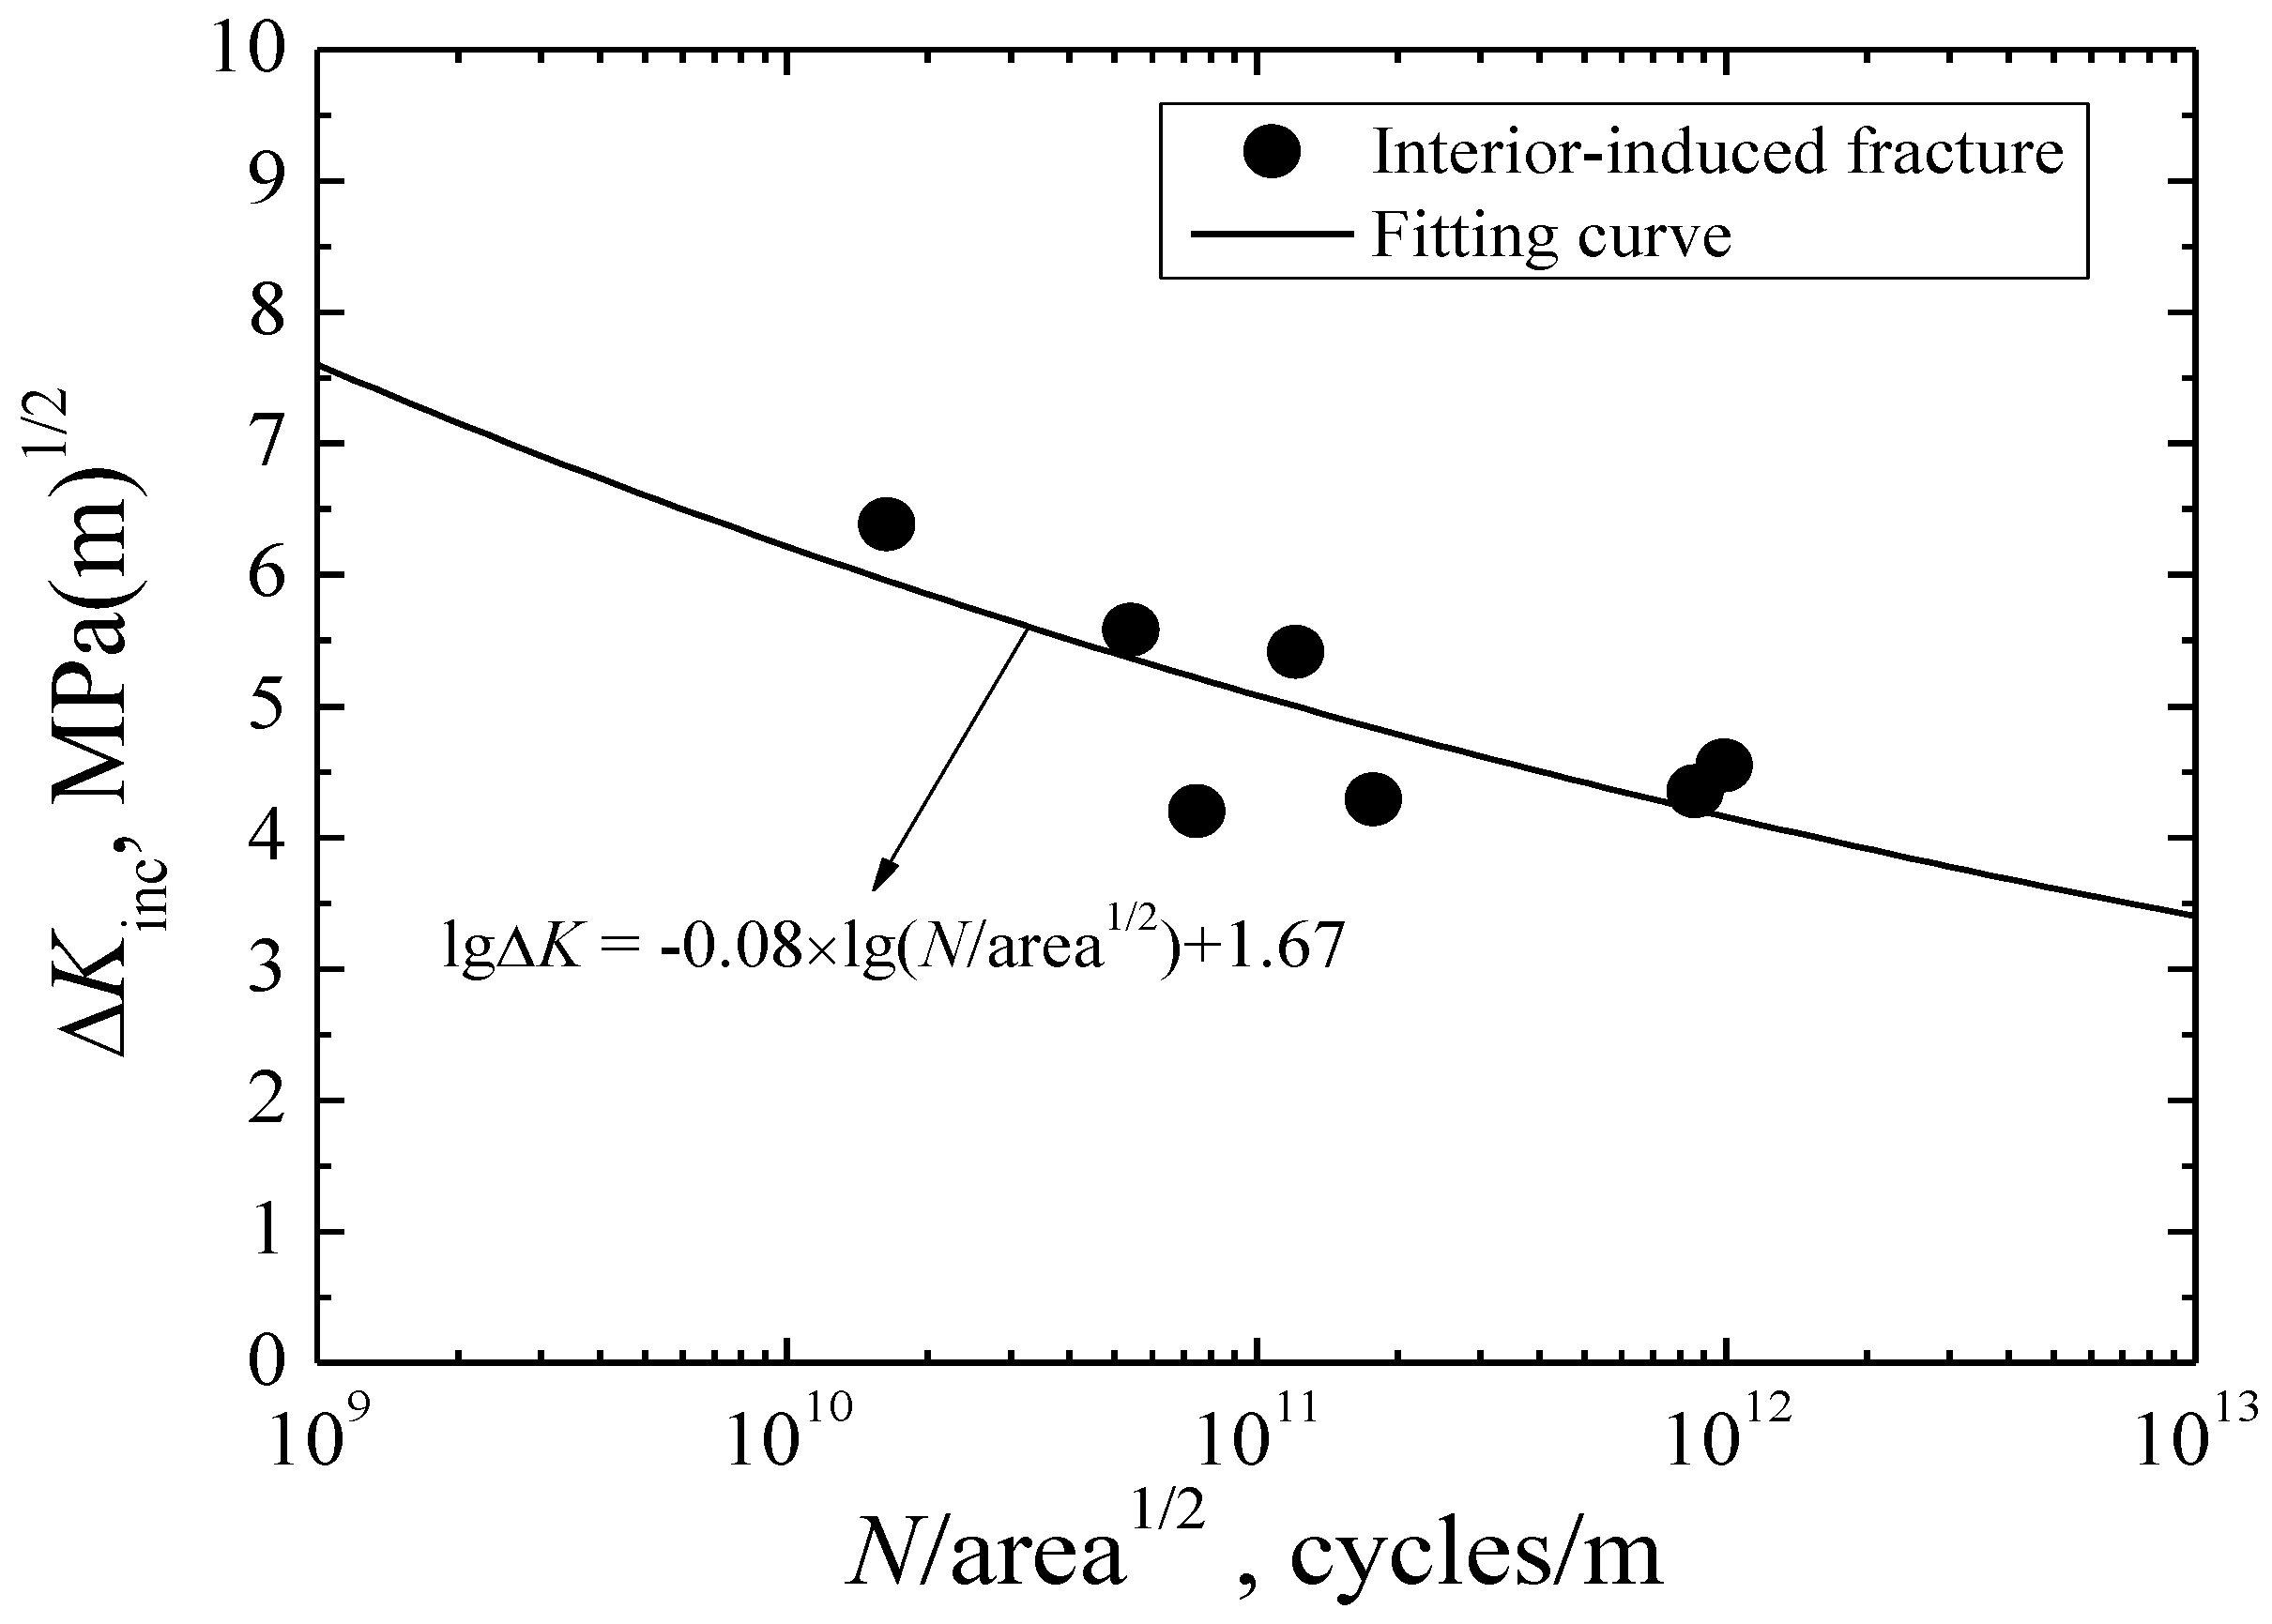
4.1. Evaluation of Interior Crack Growth Rate

The interior inclusions can be regarded as pre-existing cracks [13], and the shapes of the inclusion and fisheye are approximately circular. Thus, the stress intensity factor range ΔK at the front of the inclusion and fisheye, ΔKinc and ΔKfisheye, can be given by [18]:
Δ K = 2 π Δ σ π r = 2 π Δ σ π a r e a
where r denotes the radius of the defect or crack, and Δσ is the applied stress range.
Based on the theory of linear elastic fracture mechanics, the test data with the stress amplitude of 650 MPa is not considered in the following calculation. Figure 9 shows the relationship between ΔKinc and Nf. The values of ΔKinc are in the range of 4.39–6.67 MPam1/2, and tend to decrease with the increase of fatigue life. It should be noted that the values of ΔKinc are similar to or slightly larger than the values of stress intensity factor range at the front of the FGA, ΔKFGA, reported for some high-strength steel [19]. This is the reason why the FGA cannot be observed in the vicinity of the inclusion. In other words, the inclusion size is large enough and exceeds the critical size corresponding to ΔKFGA, and fatigue crack can directly enter into the stable crack propagation stage under cyclic loading; i.e., the formation period of a fisheye outside of inclusion. Figure 10 shows the relationship between ΔKfisheye and Nf. The values of ΔKfisheye are in the range of 23.66–34.59 MPam1/2, with an average value of 28.50 MPam1/2, which are very similar to the fatigue fracture toughness of this steel. Thus, it can be assumed that ΔKfisheye is the threshold value controlling the unstable growth of interior cracks.
Based on Tanaka’s theory [20], the interior crack growth rate from the inclusion to the fisheye, da/dN, can be described by the Paris law:
d a / d N = C ( Δ K ) m
where C and m are material constants. Studies have shown that the majority of the total fatigue life is consumed in the stage of fisheye formation [21], so the value of N can be regarded approximately as the total fatigue life Nf. Combined with Equation (2), Equation (3) can be rewritten as:
( Δ K inc ) m ( N / a r e a inc 1 / 2 ) = [ 2 / C ( m 2 ) ] [ 1 ( a r e a inc / a r e a fisheye ) m 2 1 ]
The relationship between ΔKinc and N/areainc1/2 is shown in Figure 11. Combined with the evaluated sizes of inclusion and fisheye, as well as the S-N data, the values of C and m can be obtained. Thus, the interior crack growth rate equation from the inclusion to the fisheye can be expressed as:
d a / d N = 1.05 × 10 20 ( Δ K ) 11.45

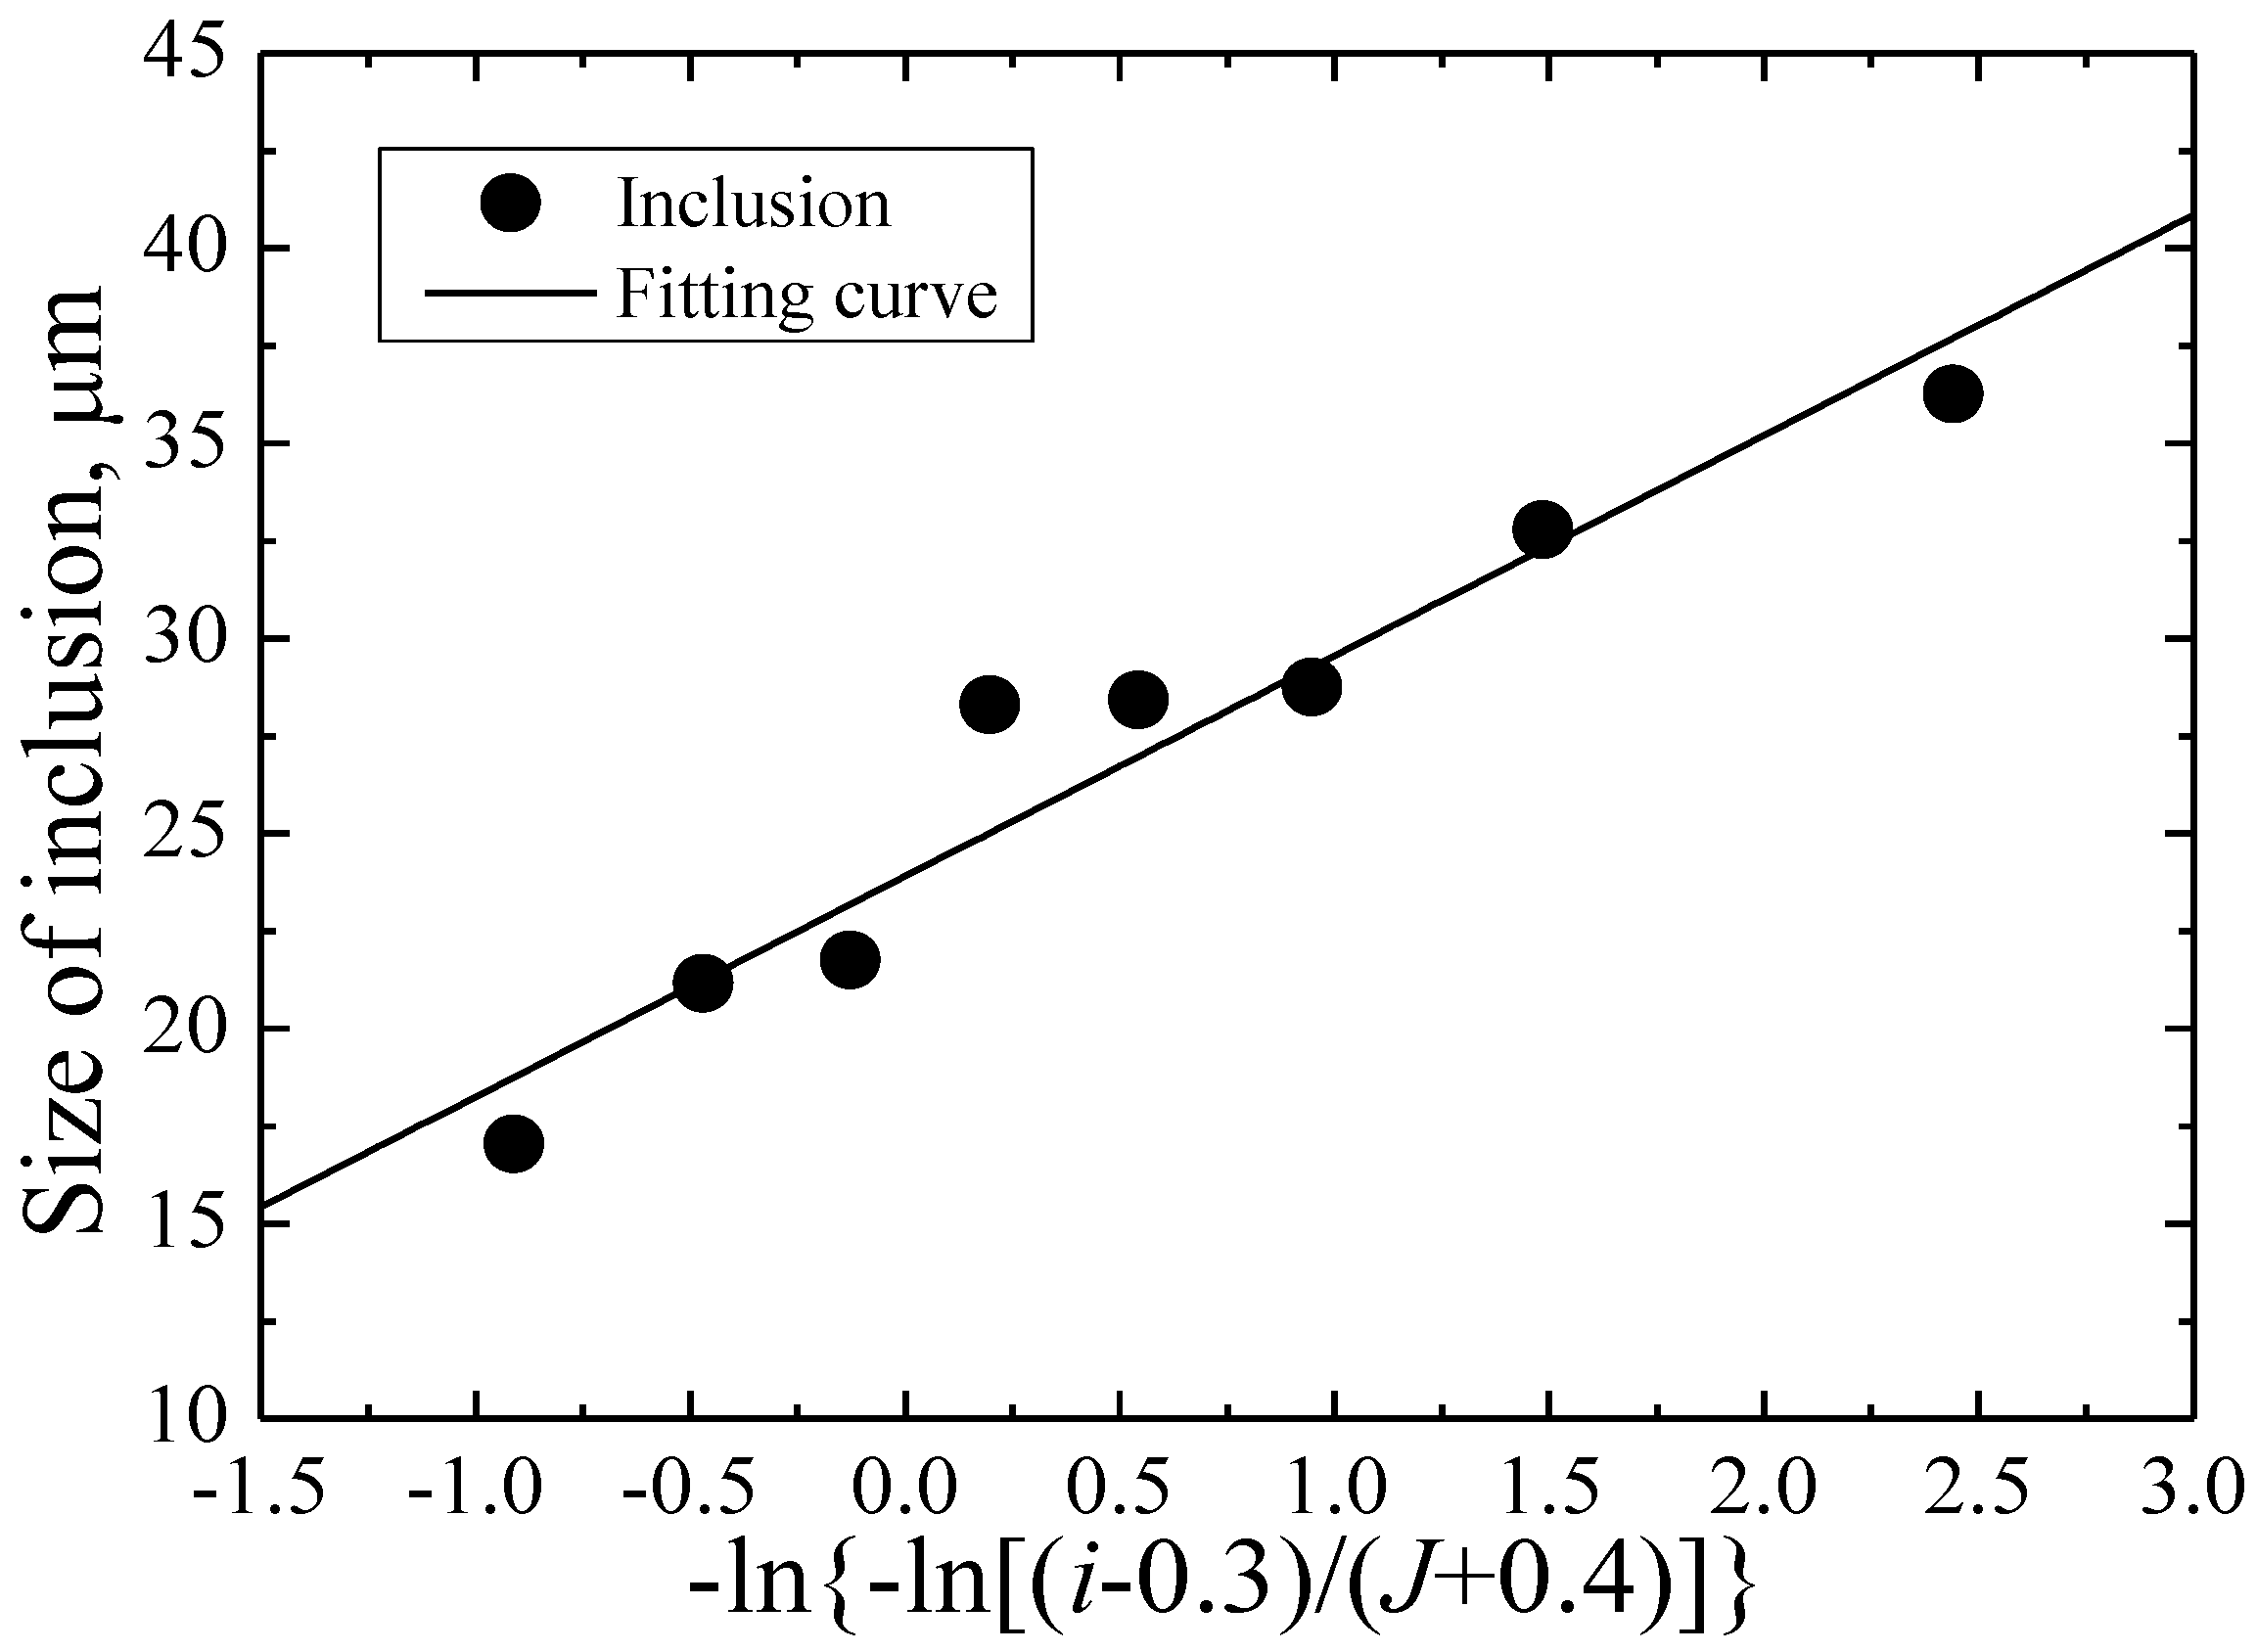
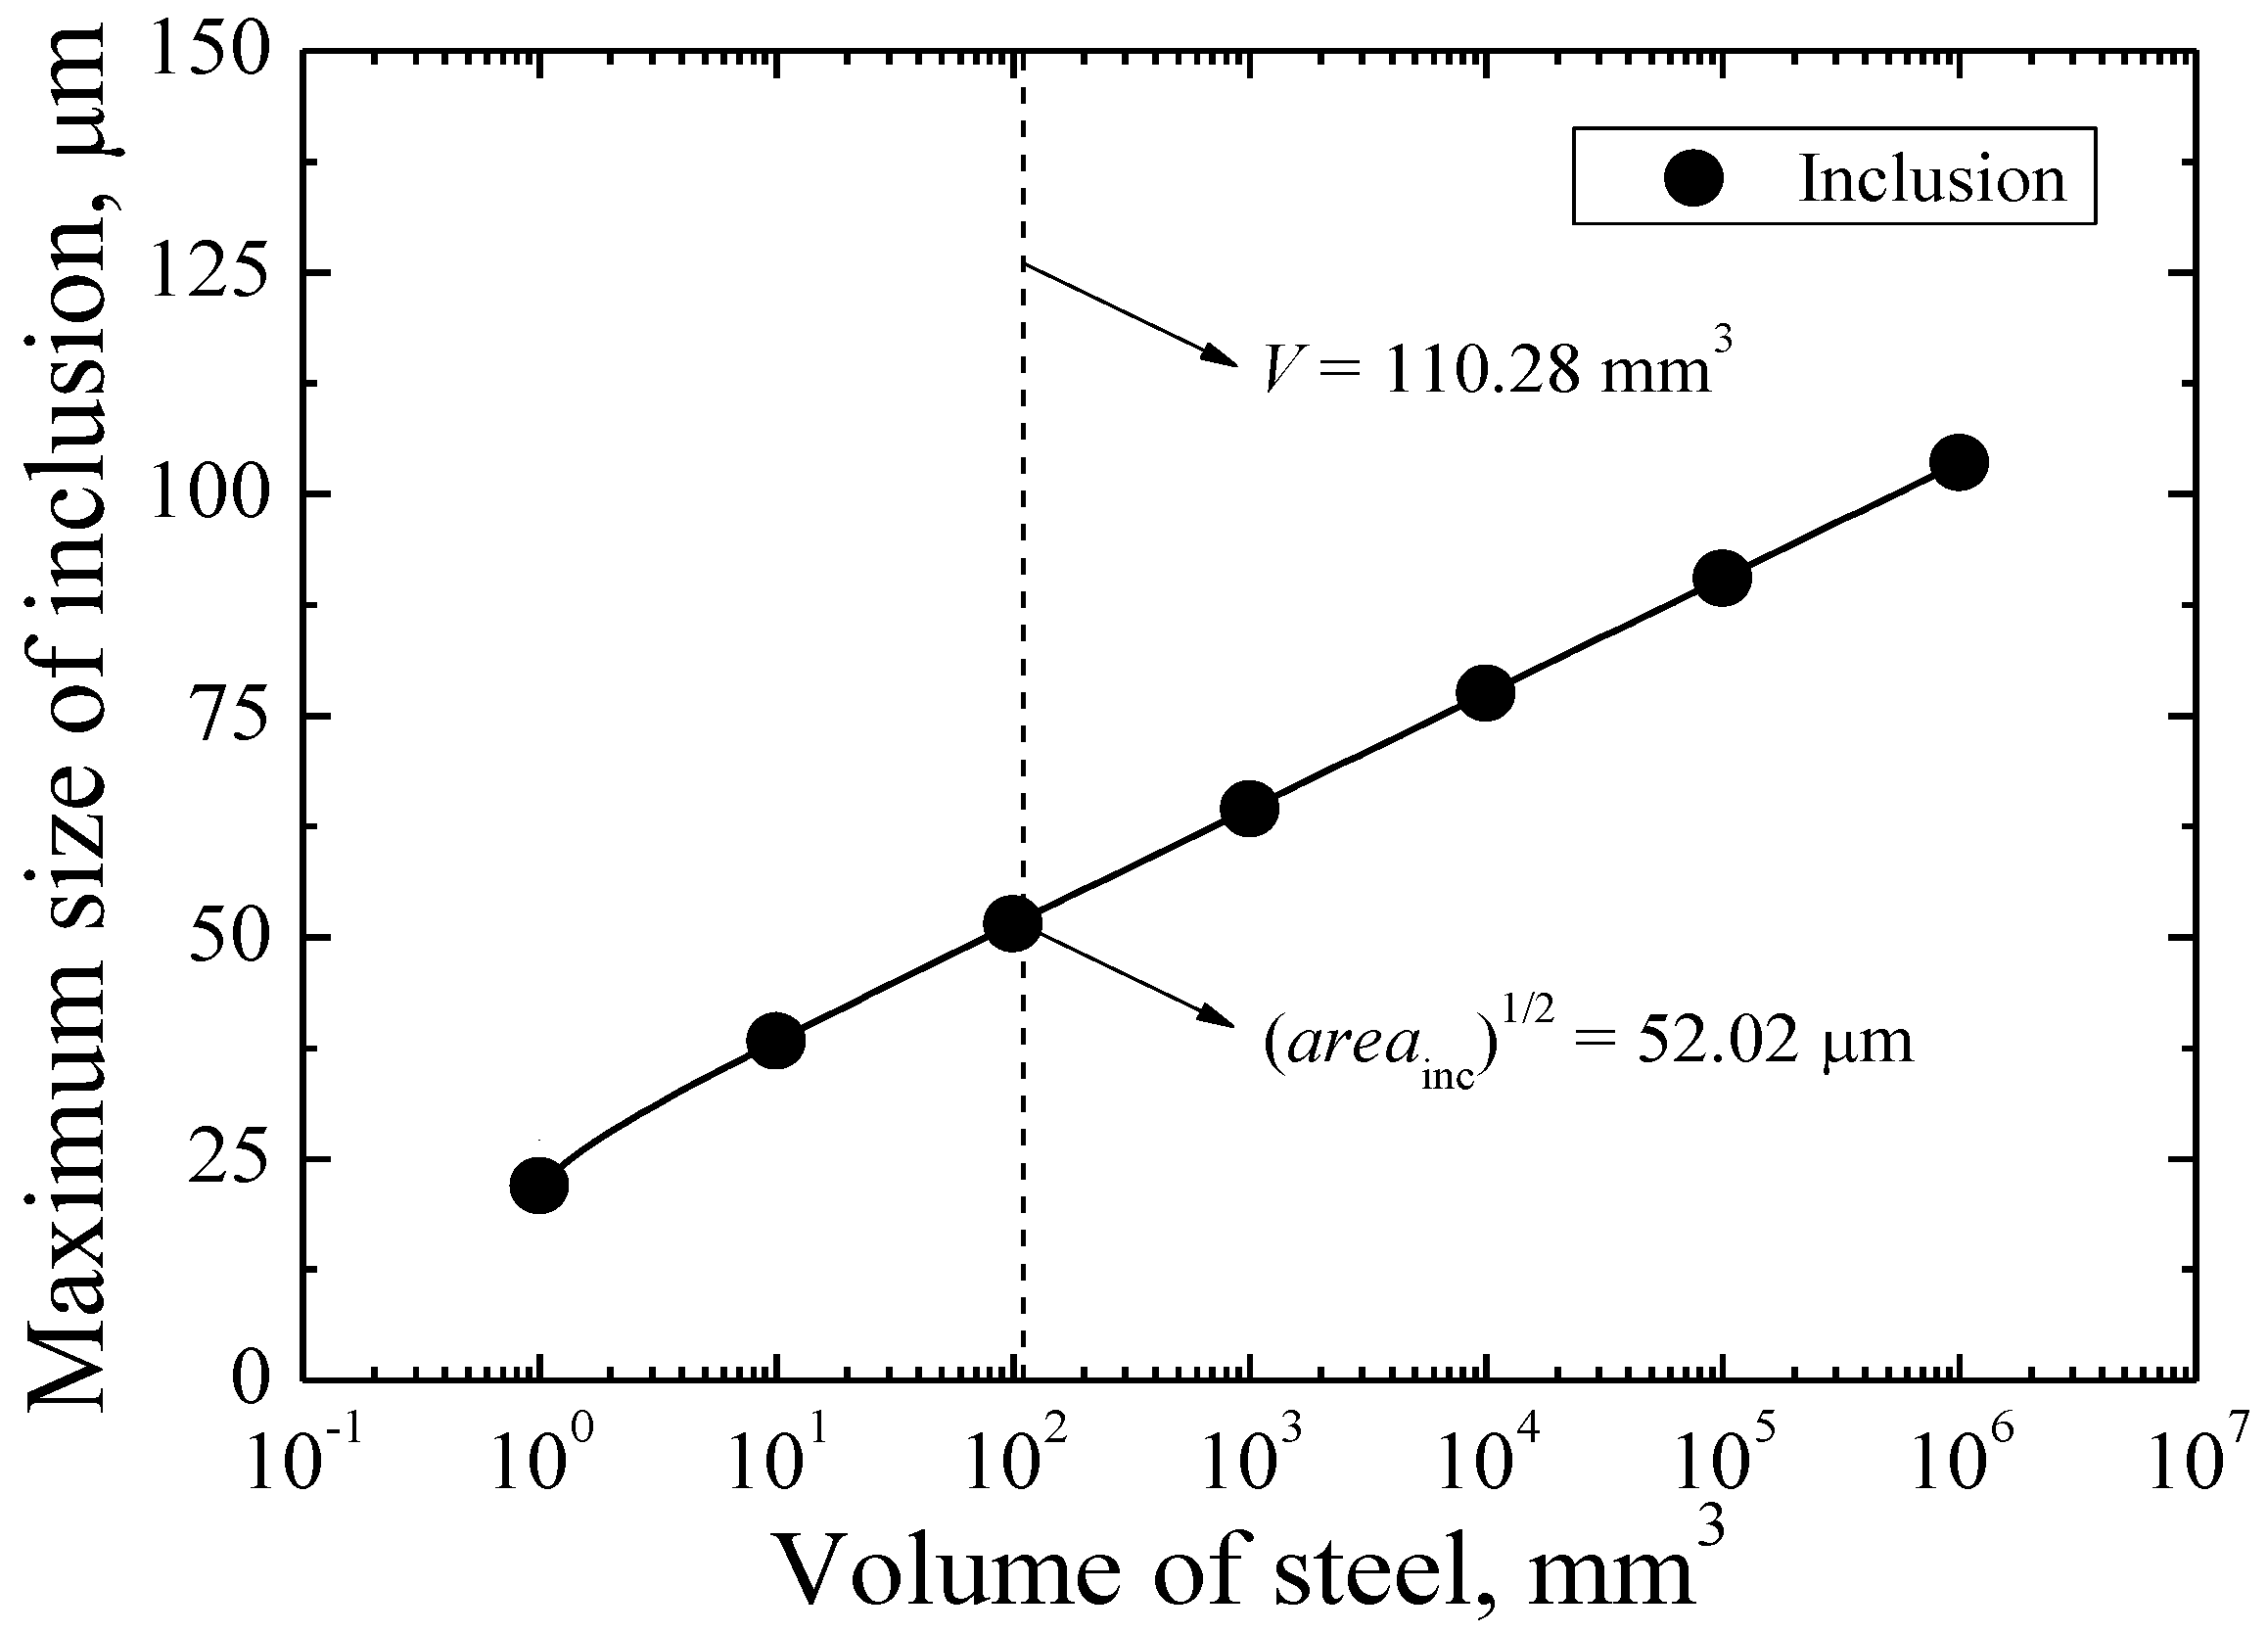
4.2. Prediction of Maximum Inclusion Size

Based on the statistics of extreme values (SEV) presented by Murakami et al. [22], the maximum inclusion size in a given control volume of steel, V (units: mm3), can be predicted. Firstly, it is confirmed that the measured sizes of inclusions observed on the fracture surfaces can be well characterized by the Gumbel distribution, and the corresponding cumulative distribution function F(x) is given by:
F ( x ) = exp { exp { [ ( x λ ) / α ] } }
where λ and α are location parameter and scale parameter, respectively. The size of the ith inclusion, xi, are classified, starting from the smallest and indexed with i = 1, 2, …, J, where J denotes the number of inclusions. For small samples, the cumulative probability corresponding to xi is expressed as:
P ( x i ) = ( i 0.3 ) / ( J + 0.4 )
Based on Equations (6) and (7), the following equations can be obtained as:
y i = ( x i λ ) / α
y i = ln { ln [ ( i 3 ) / ( J + 0.4 ) ] }
Thus, a straight line with slope α and intercept λ indicating relationship between xi and yi can be plotted in Figure 12. The fitted values of λ and α are 23.9 and 5.65, respectively. Let XV denote the characteristic value of maximum inclusion size in units of μm, the return period, T, and the cumulative probability of XV, P(XV), are given by:
T = V / V 0
P ( X V ) = 1 1 / T
where V0 is the volume of a standard inspection plane, S0, with a certain thickness. Under axial loading, S0 is the area of the minimum cross-section of the specimen (about 28.26 mm2), and its thickness value is approximately defined as the mean size of inclusions (about 26.8 μm). Thus, the value of V0 is evaluated to be about 0.76 mm3. Therefore, the value of XV can be evaluated by the following equation:
X V = 23.9 5.65 ln [ ln ( 1 0.76 / V ) ]
Figure 13 shows the predicted maximum inclusion sizes as a function of V for carburized 20Cr steel. They tend to increase with the increase of V. For the specimen tested in this study, the tested volume V can be expressed as [22]:
V = 0.25 π l d 2
where d is the diameter of minimum cross-section, l is defined as the length at which the stress value on the cross-section is 0.9 times that on minimum cross-section at l/2. Herein, the values of d and l are 6 mm and 3.9 mm, respectively. Thus, the value of V is 110.28 mm3, and the relevant maximum inclusion size is about 52.02 μm.

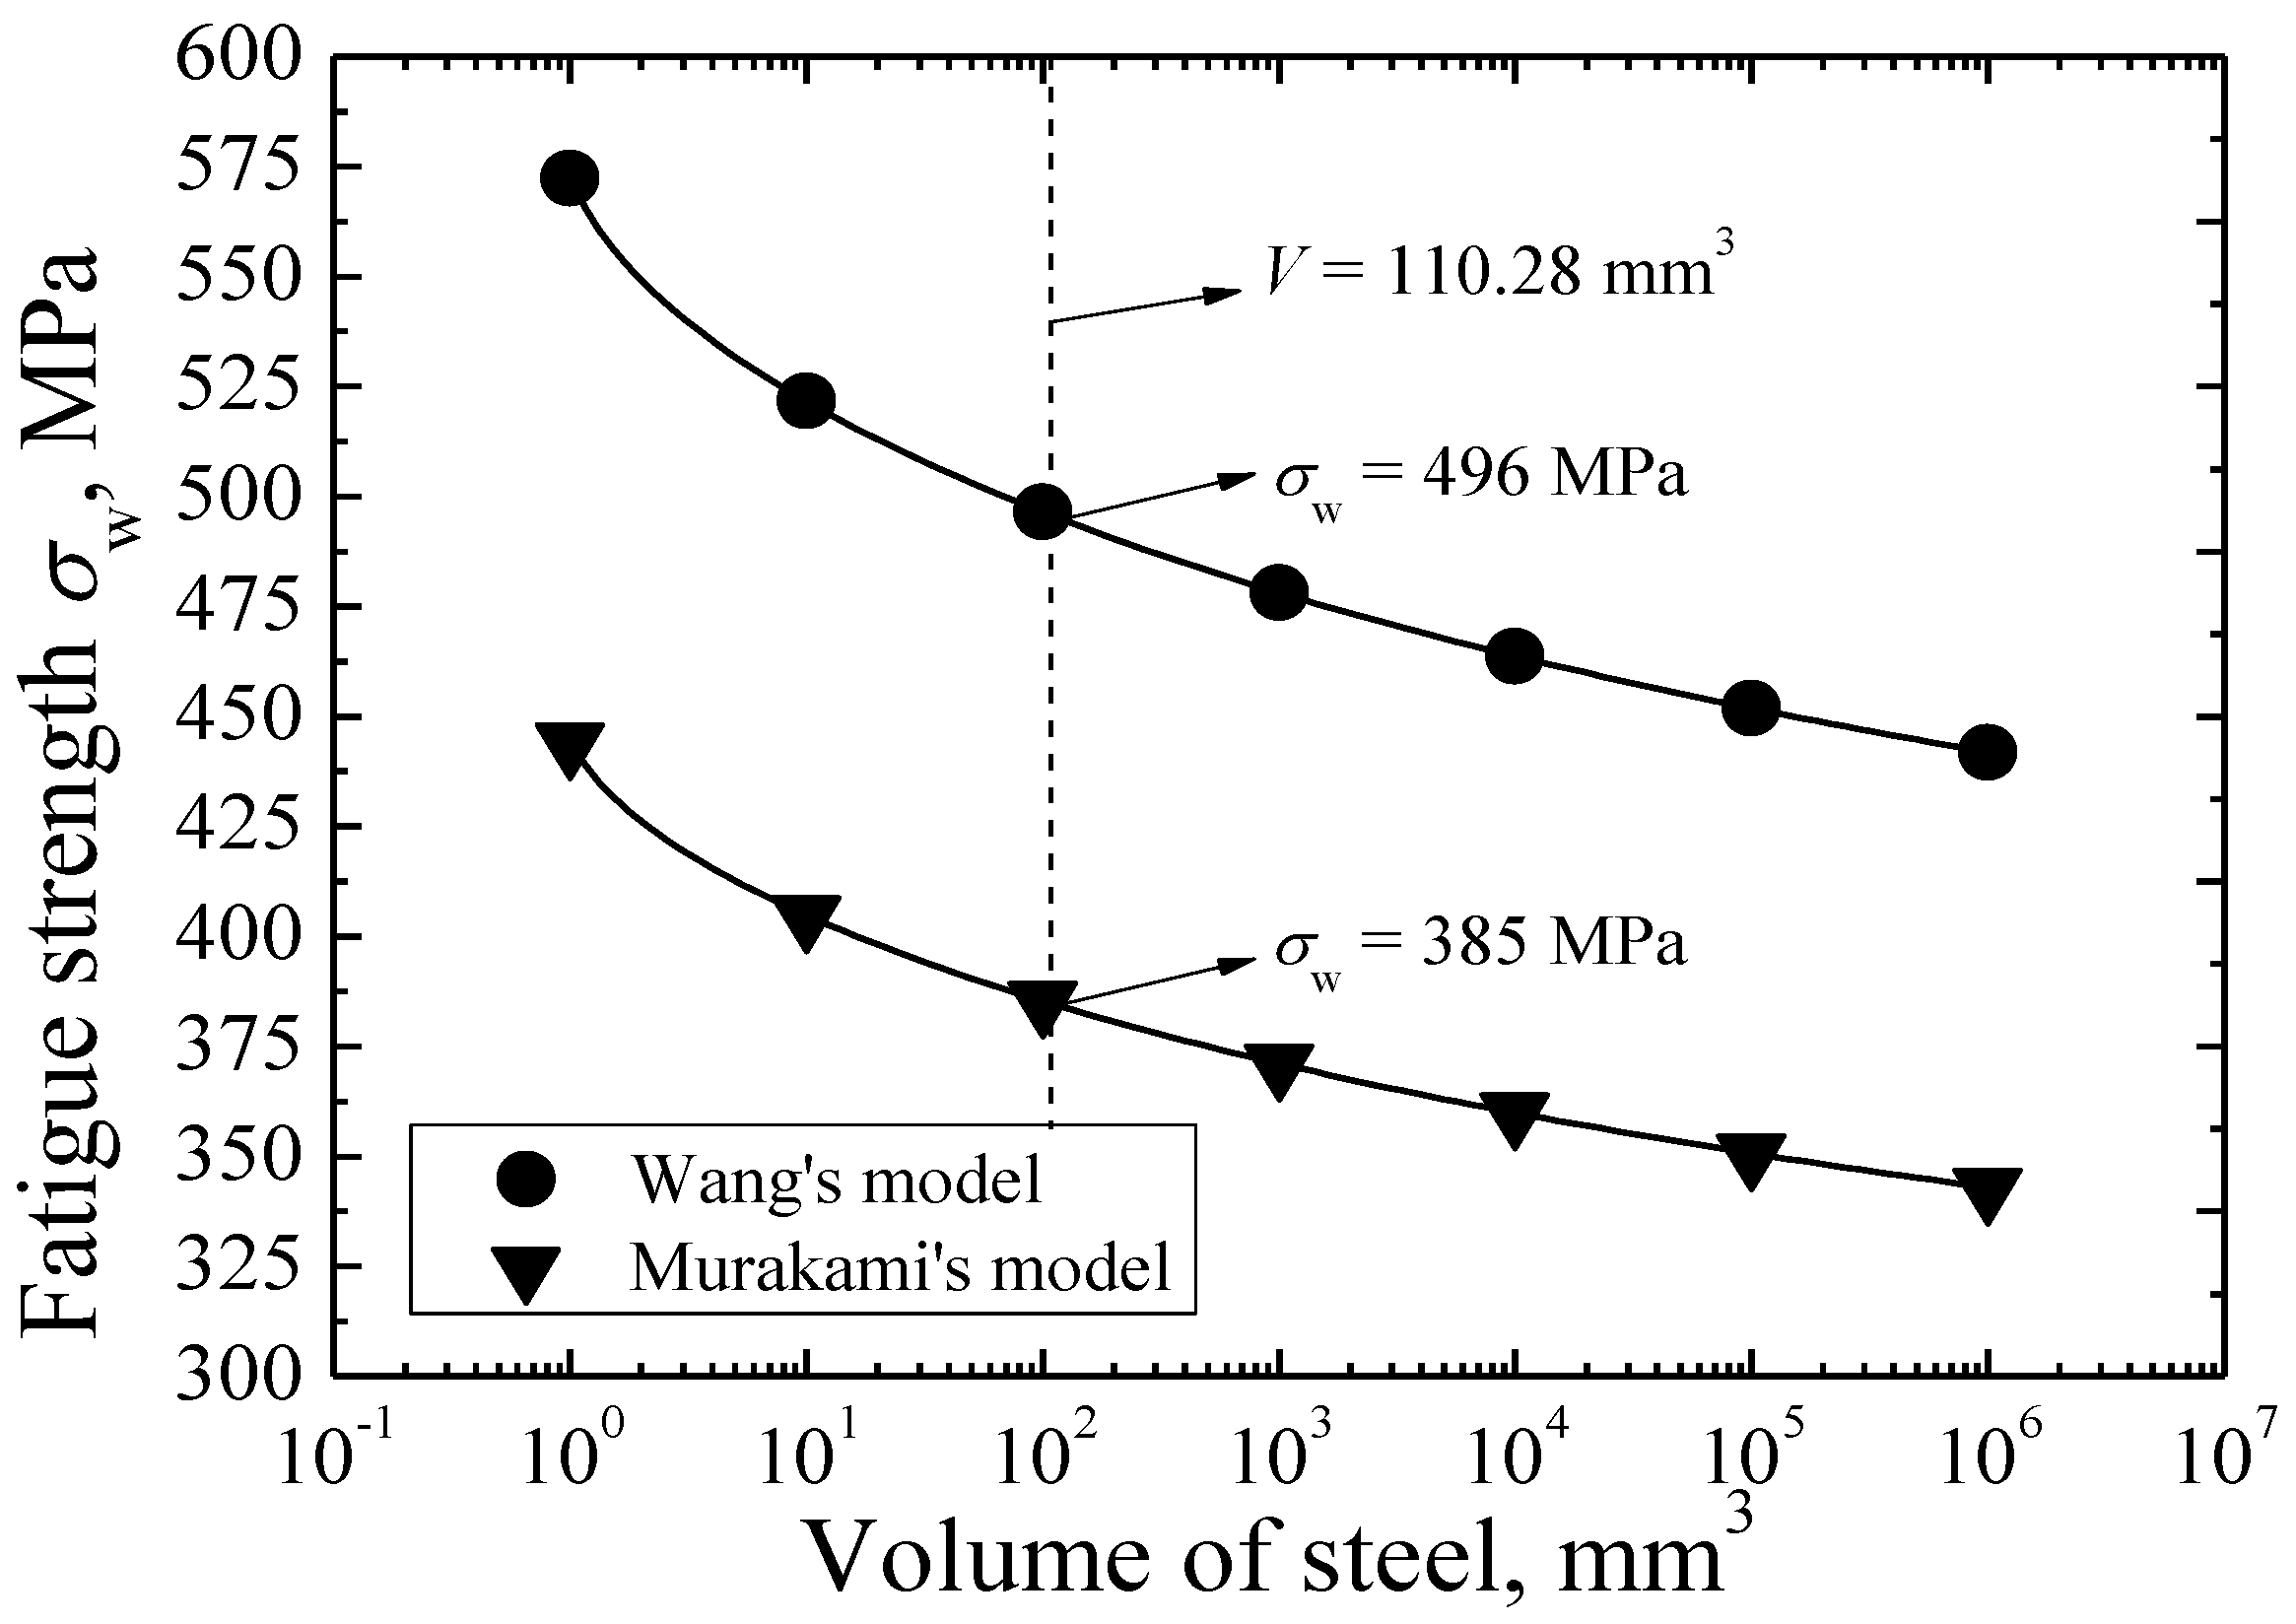
4.3. Prediction of the Fatigue Strength at 109 Cycles

A theoretical model proposed by Murakami can be used to predict the fatigue strength at 109 cycles, σw, corresponding to the interior inclusion-induced fracture under a certain stress ratio, and is given by [23]:
σ w = [ 1.56 ( H V + 120 ) / ( a r e a 1 / 2 ) 1 / 6 ] [ ( 1 R ) / 2 ] β
where β = 0.226 + HV × 10−4. The value of HV for carburized 20Cr steel is 455, so the value of β is evaluated to be 0.2715. For surface inclusion, the value of area parameter area1/2 must be less than 1000 μm. For interior inclusion, the value of area1/2 does not have this limit [24]. All inclusions are interior in this study. Furthermore, considering the effect of fatigue life, Wang modified this model and presented a new model, as follows [5]:
σ w = [ γ ( H V + 120 ) / ( a r e a 1 / 2 ) 1 / 6 ] [ ( 1 R ) / 2 ] β
where γ = 3.09 − 0.12logNf for the interior inclusion-induced fracture. Herein, the value of Nf is defined to be 109 cycles. Based on these two models, Figure 14 shows the predicted values of σw as a function of steel volume for carburized 20Cr steel under axial loading.
It can be seen from Figure 14 that the predicted values of the fatigue strength at 109 cycles tend to decrease with the increase of steel volume, which is in inverse proportion to the predicted results of maximum inclusion size. For the tested volume of a specimen with about 110.28 mm3, the predicted results by using Murakami’s model and Wang’s model are 385 MPa and 496 MPa, respectively. Compared with the experimental result of about 455 MPa corresponding to 109 cycles, the predicted result based on Wang’s model is a little higher, whereas that based on Murakami’s model is relatively low but is safe.

5. Conclusions

In this study, main conclusions obtained are listed as follows:
  • The carburized 20Cr gear steel shows continuously decreasing S-N characteristics without a traditional fatigue limit, and the fatigue strength corresponding to 109 cycles is about 455 MPa.
  • The interior inclusion-fisheye-induced fracture is main fracture mode in the HCF regime, but the FGA cannot be found in the vicinity of the inclusion.
  • Based on the evaluation of stress intensity factor ranges at the front of inclusion and fisheye, the interior crack growth rate equation from the inclusion to fisheye can be established; i.e., da/dN = 2.39 × 10⁻²¹K)12.32.
  • Based on the SEV method, the predicted maximum inclusion size is about 52.02 μm and is larger than the observed inclusion size.
  • The predicted fatigue strength corresponding to 109 cycles by using Wang’s model is slightly higher than the experimental result, but that by using Murakami’s model is relatively conservative.

Acknowledgments

This research was supported by the National Natural Science Foundation of China (No. 51305027).

Author Contributions

Wei Li conceived and designed the experiment; Pengfei Liu and Abdelhak Nehila performed the experiments; Zhenduo Sun and Hailong Deng observed the fracture surfaces; Pengfei Liu and Nehila Abdelhak analyzed and processed the data; Pengfei Liu and Wei Li wrote the paper.

Conflicts of Interest

The authors declare no conflict of interest.

References

  1. Bathias, C. There is no infinite fatigue life in metallic materials. Fatigue Fract. Eng. Mater. Struct. 1999, 22, 559–565. [Google Scholar] [CrossRef]
  2. Bandara, C.S.; Siriwardane, S.C.; Dissanayake, U.I.; Dissanayake, R. Fatigue failure predictions for steels in the very high cycle region—A review and recommendations. Eng. Fail. Anal. 2014, 45, 421–435. [Google Scholar] [CrossRef]
  3. Li, W.; Sakai, T.; Li, Q.; Lu, L.T.; Wang, P. Reliability evaluation on very high cycle fatigue property of GCr15 bearing steel. Int. J. Fatigue 2010, 32, 1096–1107. [Google Scholar] [CrossRef]
  4. Deng, H.L.; Li, W.; Sakai, T.; Sun, Z.D. Very high cycle fatigue failure analysis and life prediction of Cr-Ni-W gear steel based on crack initiation and growth behaviors. Materials 2015, 8, 8338–8354. [Google Scholar] [CrossRef]
  5. Wang, Q.Y.; Berard, J.Y.; Dubarre, A.; Baudry, G.; Rathery, S.; Bathias, C. Gigacycle fatigue of ferrous alloys. Fatigue Fract. Eng. Mater. Struct. 1999, 22, 667–672. [Google Scholar] [CrossRef]
  6. Sohar, C.R.; Betzwar-Kotas, A.; Gierl, C.; Weiss, B.; Danninger, H. Gigacycle fatigue behavior of a high chromium alloyed cold work tool steel. Int. J. Fatigue 2008, 30, 1137–1149. [Google Scholar] [CrossRef]
  7. Li, W.; Sakai, T.; Li, Q.; Lu, L.T.; Wang, P. Effect of loading type on fatigue properties of high strength bearing steel in very high cycle regime. Mater. Sci. Eng. A 2011, 528, 5044–5052. [Google Scholar] [CrossRef]
  8. Li, W.; Sun, Z.D.; Zhang, Z.Y.; Deng, H.D.; Sakai, T. Influence of case-carburizing and micro-defect on competing failure behaviors of Ni-Cr-W steel under gigacycle fatigue. Int. J. Fatigue 2015, 72, 66–74. [Google Scholar] [CrossRef]
  9. Yu, Y.; Gu, J.L.; Xua, L.; Shou, F.L.; Bai, B.Z.; Liu, Y.B. Very high cycle fatigue behaviors of Mn-Si-Cr series bainite/martensite dual phase steels. Mater. Des. 2010, 31, 3067–3072. [Google Scholar] [CrossRef]
  10. Yu, Y.; Gu, J.L.; Bai, B.Z.; Liu, Y.B.; Li, S.X. Very high cycle fatigue mechanism of carbide-free bainite/martensite steel micro-alloyed with Nb. Mater. Sci. Eng. 2009, 527, 212–217. [Google Scholar] [CrossRef]
  11. Sakai, T.; Takeda, M.; Shiozawa, K.; Ochi, Y.; Nakajima, M.; Nakamura, T. Experimental reconfirmation of characteristic S-N property for high carbon chromium bearing steel in wide life region in rotating bending. J. Soc. Mater. Sci. Jpn. 2000, 49, 779–785. [Google Scholar] [CrossRef]
  12. Lai, J.; Lund, T.; Ryden, K.; Gabelli, A.; Strandell, I. The fatigue limit of bearing steels—Part 1: A pragmatic approach to predict very high cycle fatigue strength. Int. J. Fatigue 2012, 37, 155–168. [Google Scholar] [CrossRef]
  13. Murakami, Y.; Nomoto, T.; Ueda, T.; Ohtori, M. Analysis of the mechanism of superlong fatigue failure by optical microscope and SEM/AFM observations. J. Soc. Mater. Sci. Jpn. 1999, 48, 1112–1117. [Google Scholar] [CrossRef]
  14. Yang, Z.G.; Zhang, J.M.; Li, S.X.; Li, G.Y.; Wang, Q.Y.; Hui, W.J. On the critical inclusion size of high strength steels under ultra-high cycle fatigue. Mater. Sci. Eng. A 2006, 427, 167–174. [Google Scholar] [CrossRef]
  15. Zhang, J.M.; Zhang, J.F.; Yang, Z.G.; Li, G.Y.; Yao, G.; Li, S.X.; Hui, W.J.; Weng, Y.Q. Estimation of maximum inclusion size and fatigue strength in high-strength ADF1 steel. Mater. Sci. Eng. A 2005, 394, 126–131. [Google Scholar] [CrossRef]
  16. Mayer, H.; Papakyriacou, M.; Zettl, B.; Vacic, S. Endurance limit and threshold stress intensity of die cast magnesium and aluminium alloys at elevated temperature. Int. J. Fatigue 2005, 27, 1076–1088. [Google Scholar] [CrossRef]
  17. JSMS-SD-6-04. Standard Evaluation Method of Fatigue Reliability for Metallic Materials-Standard Regression Method of S-N Curves; The Society of Material Science: Tokyo, Japan, 2004. [Google Scholar]
  18. Israel, M.G.; Paul, C.P.; Hiroshi, T.; Claude, B. Fatigue crack growth from small to long cracks in very-high-cycle fatigue with surface and internal “fish-eye” failures for ferrite-perlitic low carbon steel SAE 8620. Mater. Sci. Eng. A 2007, 468–470, 120–128. [Google Scholar]
  19. Sakai, T.; Sato, Y.; Oguma, N. Characteristic S-N properties of high-carbon-chromium-bearing steel under axial loading in long-life fatigue. Fatigue Fract. Eng. Mater. Struct. 2002, 25, 765–773. [Google Scholar] [CrossRef]
  20. Tanaka, K.; Akiniwa, Y. Fatigue crack propagation behavior derived from S-N data in very high cycle regime. Fatigue Fract. Eng. Mater. Struct. 2002, 25, 775–784. [Google Scholar] [CrossRef]
  21. Sun, Z.D.; Li, W.; Deng, H.L.; Zhang, Z.Y. Fisheye failure analysis and life design approach for case-carburized gear steel based on statistical evaluation of defect size. Eng. Fail. Anal. 2016, 59, 28–40. [Google Scholar] [CrossRef]
  22. Murakami, Y.; Chen, D.; Nisitan, H.; Mori, K. Stress Intensity Factor Handbook, 3rd ed.; Society of Materials Science-Pergamon: Tokyo, Japan, 1993; pp. 661–662. [Google Scholar]
  23. Murakami, Y.; Endo, M. Effect of hardness and crack geometry on delta K threshold of small cracks. J. Soc. Mater. Sci. Jpn. 1985, 35, 911–917. [Google Scholar] [CrossRef]
  24. Murakami, Y. Quantitative Evaluation of Effects of Defects and Defects and Non-metallic Inclusions on Fatigue Strength of Metal. Tetsu-to-Hagane 1989, 75, 1267–1277. [Google Scholar]
Figure 1. Observation of microstructure: (a) microstructure in carburized layer; (b) microstructure in core region.
Metals 06 00246 g001
Figure 2. Shape and dimensions of specimen (units: mm).
Metals 06 00246 g002
Figure 3. Vickers hardness of carburized layer and matrix region.
Metals 06 00246 g003
Figure 4. S-N diagram of carburized 20Cr steel under axial loading with R = 0.
Metals 06 00246 g004
Figure 5. P-S-N diagram of carburized 20Cr steel under axial loading with R = 0.
Metals 06 00246 g005
Figure 6. SEM observation of fracture surfaces: (a) Surface defect-induced fracture (σa = 625 MPa, Nf = 300,600); (b) Fisheye in the high cycle fatigue (HCF) regime beyond 107 cycles (σa = 550 MPa, Nf = 18,704,700); (c) Inclusion without fine granular area (FGA, σa = 550 MPa, Nf = 18,704,700); (d) Fisheye in HCF regime below 107 cycles (σa = 550 MPa, Nf = 3,765,500); (e) Inclusion without FGA (σa = 550 MPa, Nf = 3,765,500).
Metals 06 00246 g006aMetals 06 00246 g006b
Figure 7. Relationship between dinc and Nf.
Metals 06 00246 g007
Figure 8. Relationship between (areainc)1/2 and (areafisheye)1/2, and σa.
Metals 06 00246 g008
Figure 9. Relationship between ΔKinc and Nf.
Metals 06 00246 g009
Figure 10. Relationship between ΔKfisheye and Nf.
Metals 06 00246 g010
Figure 11. Relationship between ΔKinc and N/area1/2.
Metals 06 00246 g011
Figure 12. Fitted values of Gumbel distribution parameter α and λ.
Metals 06 00246 g012
Figure 13. Prediction of maximum inclusion size.
Metals 06 00246 g013
Figure 14. Prediction of the fatigue strength at 109 cycles.
Metals 06 00246 g014

