Article

Dynamic Strain Evolution around a Crack Tip under Steady- and Overloaded-Fatigue Conditions

1
Department of Materials Science and Engineering, Chungnam National University, Daejeon 305-764, Korea
2
Department of Materials Science and Engineering, National Chiao Tung University, Hsinchu 300, Taiwan
3
Neutron Science Division, Korea Atomic Energy Research Institute, Daejeon 305-353, Korea
*
Author to whom correspondence should be addressed.
Metals 2015, 5(4), 2109-2118; https://doi.org/10.3390/met5042109
Submission received: 2 September 2015 / Revised: 26 October 2015 / Accepted: 4 November 2015 / Published: 12 November 2015
(This article belongs to the Special Issue Metals Challenged by Neutron and Synchrotron Radiation)

Abstract

:
We investigated the evolution of the strain fields around a fatigued crack tip between the steady- and overloaded-fatigue conditions using a nondestructive neutron diffraction technique. The two fatigued compact-tension specimens, with a different fatigue history but an identical applied stress intensity factor range, were used for the direct comparison of the crack tip stress/strain distributions during in situ loading. While strains behind the crack tip in the steady-fatigued specimen are irrelevant to increasing applied load, the strains behind the crack tip in the overloaded-fatigued specimen evolve significantly under loading, leading to a lower driving force of fatigue crack growth. The results reveal the overload retardation mechanism and the correlation between crack tip stress distribution and fatigue crack growth rate.

1. Introduction

A fundamental understanding of the fatigue crack growth mechanism is critical for the development of lifetime prediction methodology in structural materials. It is well recognized that variable-amplitude cyclic loading can retard or accelerate the crack propagation rate by making it difficult to predict the crack propagation rate and fatigue life [1,2,3,4,5,6]. A tensile overload, a load higher than a maximum load during constant-amplitude cyclic loading, intervened during constant-amplitude cyclic loading is one of the examples to retard the crack propagation rate and increase the fatigue lifetime significantly. Many investigations have been reported to understand the retardation mechanisms of the crack growth rate following the overload [7,8,9,10,11,12,13,14,15,16,17]. Among them, the plasticity-induced crack closure approach suggested by Elber [1] was well recognized, and it emphasized the importance of a crack closure in the region of a crack wake. The crack tip plasticity approach [18], based on the large overload-induced plastic zone due to large plastic deformation caused by overloading, has drawn much attention from researchers in examining the retardation phenomena.
Our previous works have shown that the combined effects of large compressive residual stresses and crack tip blunting with secondary cracks are responsible for the overload-induced crack growth retardation [15]. In addition, the strain evolution near the crack tip was systematically examined at the various crack growth stages (with a different stress intensity factor range) through the retardation period [16]. For a better understanding of the correlation between the stress/strain distributions around the crack tip and fatigue crack growth rate, the direct comparison of the evolution of the crack tip stress/strain fields between the steady- and overloaded-fatigue conditions under the same applied stress intensity factor range should be elucidated. In this regard, the two fatigued compact-tension specimens were prepared for the direct comparison of the crack tip stress/strain distributions. Importantly, they experienced the identical stress intensity factor range, but a different fatigue history. The evolution of the strain fields around the crack tip under loading was compared using in situ neutron diffraction. The results show the nonlinearity of the strain response as a function of distance from the crack tip under loading, and we discuss the influence of the crack tip stress distribution on the strain nonlinearity, crack opening process, crack tip driving force, and fatigue crack growth rate.

2. Experimental Section

2.1. Materials

Fatigue crack growth experiments were carried out on a compact-tension (CT) specimen of 304L stainless steel. This material has a single-phase face-centered cubic (FCC) structure (Figure 1), a yield strength of 241 MPa, an ultimate tensile strength of 586 MPa, and elongation of 55% at room temperature. The specimen, prepared according to the American Society for Testing and Materials (ASTM) Standards E647-99 [19], has a notch length of 10.16 mm, a width of 50.8 mm, and a thickness of 6.35 mm (Figure 2).
Figure 1. X-ray diffraction pattern of 304L stainless steel.
Metals 05 02109 g001
Figure 2. The geometry of compact-tension specimen. Neutron diffraction measurements were performed as a function of distance from the crack tip along the crack growth direction.
Metals 05 02109 g002

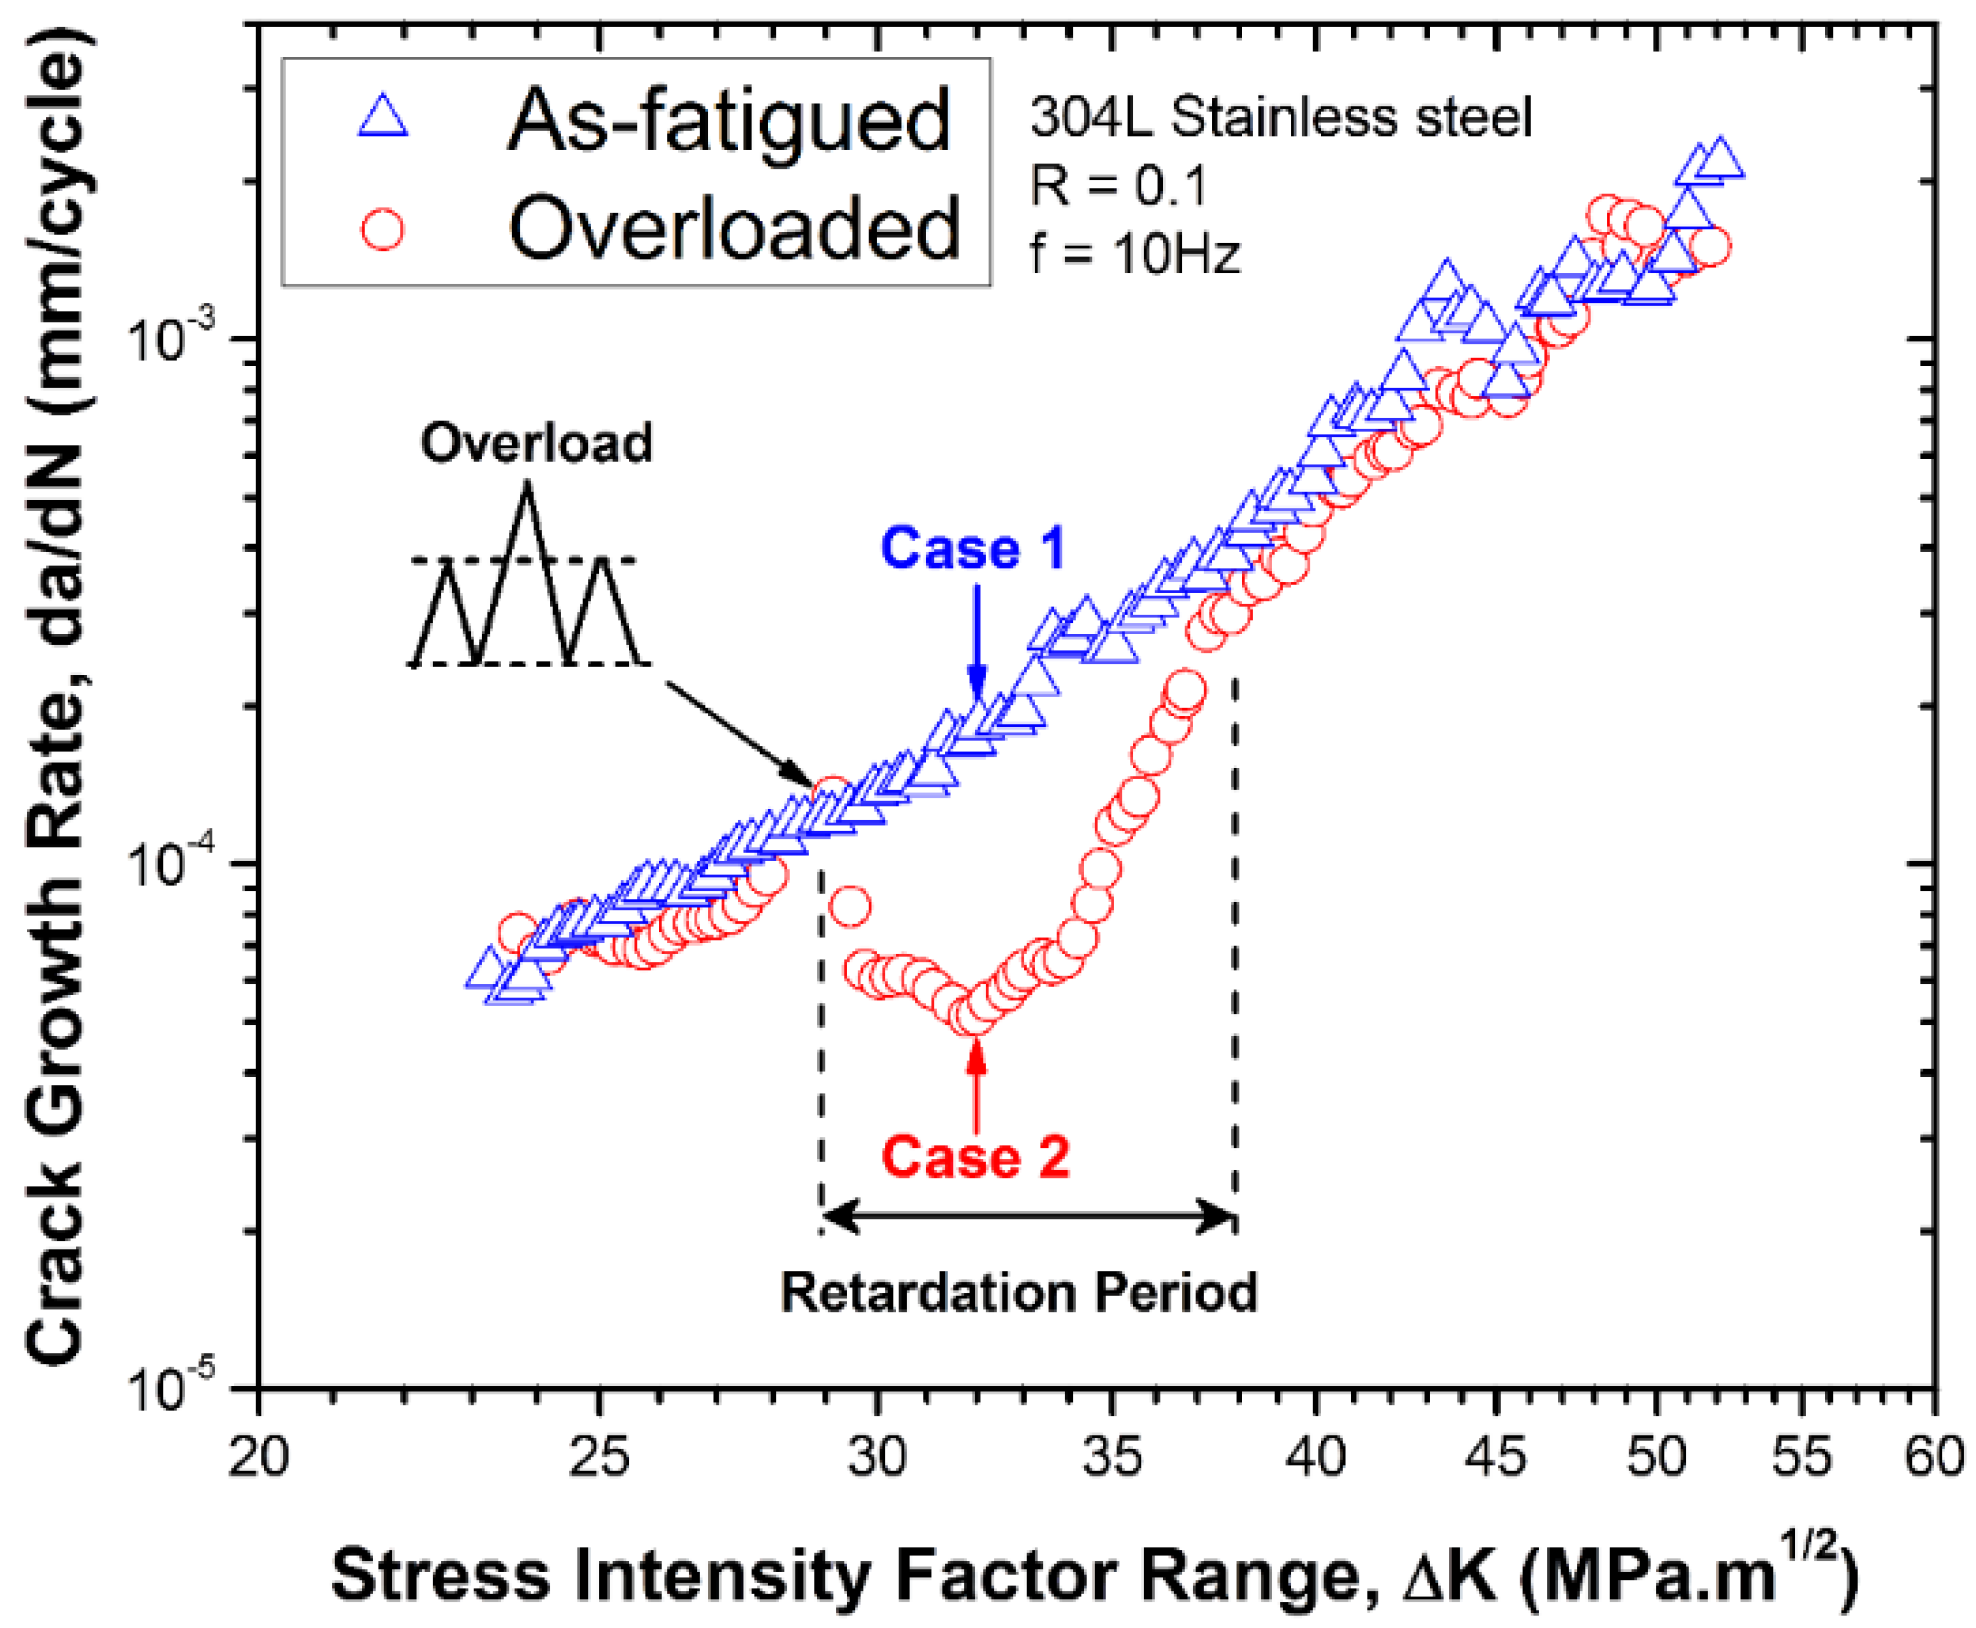
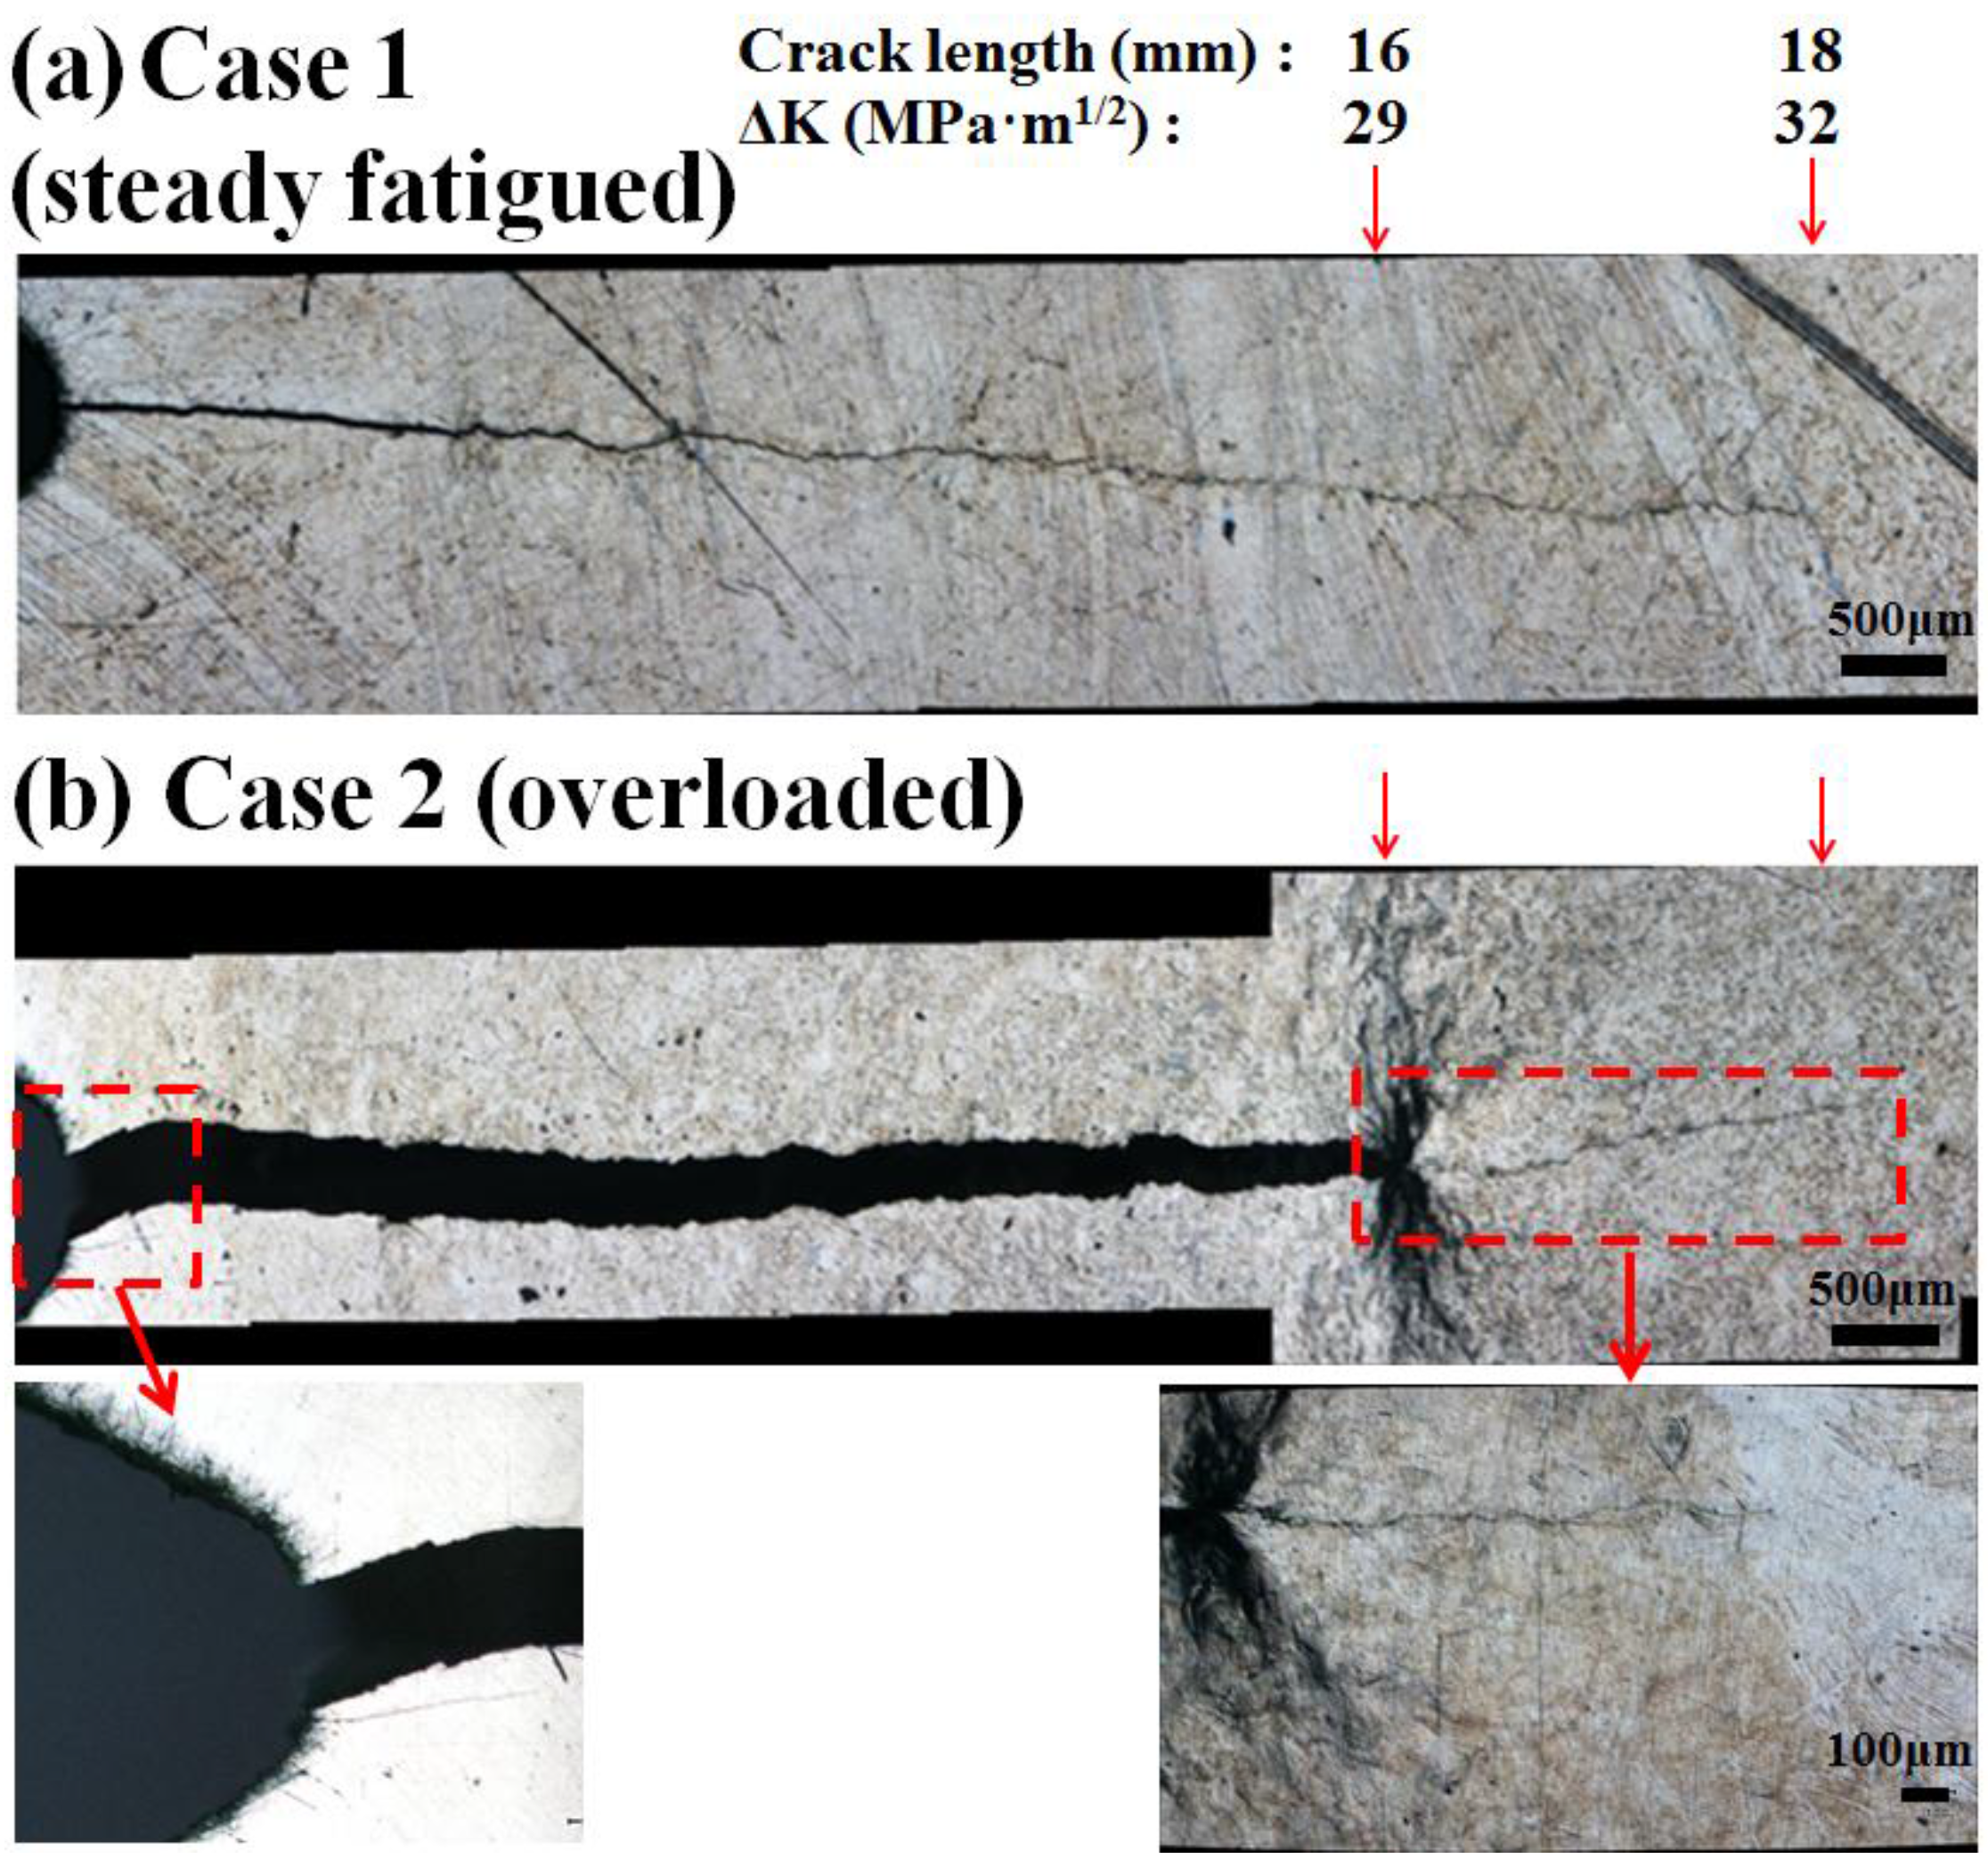
2.2. Fatigue Crack Growth Tests

Prior to the fatigue crack growth test, the CT specimens were precracked to approximately 1.27 mm, and then fatigue crack growth tests were performed in air under a constant load-range control mode (Pmax = 7400 N, Pmin = 740 N, a load ratio R = 0.1, frequency = 10 Hz). The crack length was measured using a compliance method, which is obtained from the load vs. displacement data by a crack-opening-displacement gauge [19]. The stress intensity factor, K, was obtained using the following equation [19]:
K = P ( 2 + α ) B W ( 1 α ) 3 / 2 ( 0.886 + 4.64 α 13.32 α 2 + 14.72 α 3 5.6 α 4 )
where P = applied load, B = thickness, α = a/W, a = crack length, and W = width for a CT specimen. The two fatigued CT specimens are prepared: (i) steady-fatigued condition, Case 1: continuously fatigued under the same baseline condition until the crack length reaches 18 mm (ΔK = 32 MPa·m1/2); (ii) tensile-overloaded condition, Case 2: fatigued under the same baseline condition until the crack length reaches 16 mm (ΔK = 29 MPa·m1/2), after which a single tensile overload of 10,360 N (140% of Pmax) was applied, and then continuously fatigued under the same baseline condition until the crack length reaches 18 mm (ΔK = 32 MPa·m1/2). Therefore, Case 1 and Case 2 have identical crack lengths but the different fatigue histories.

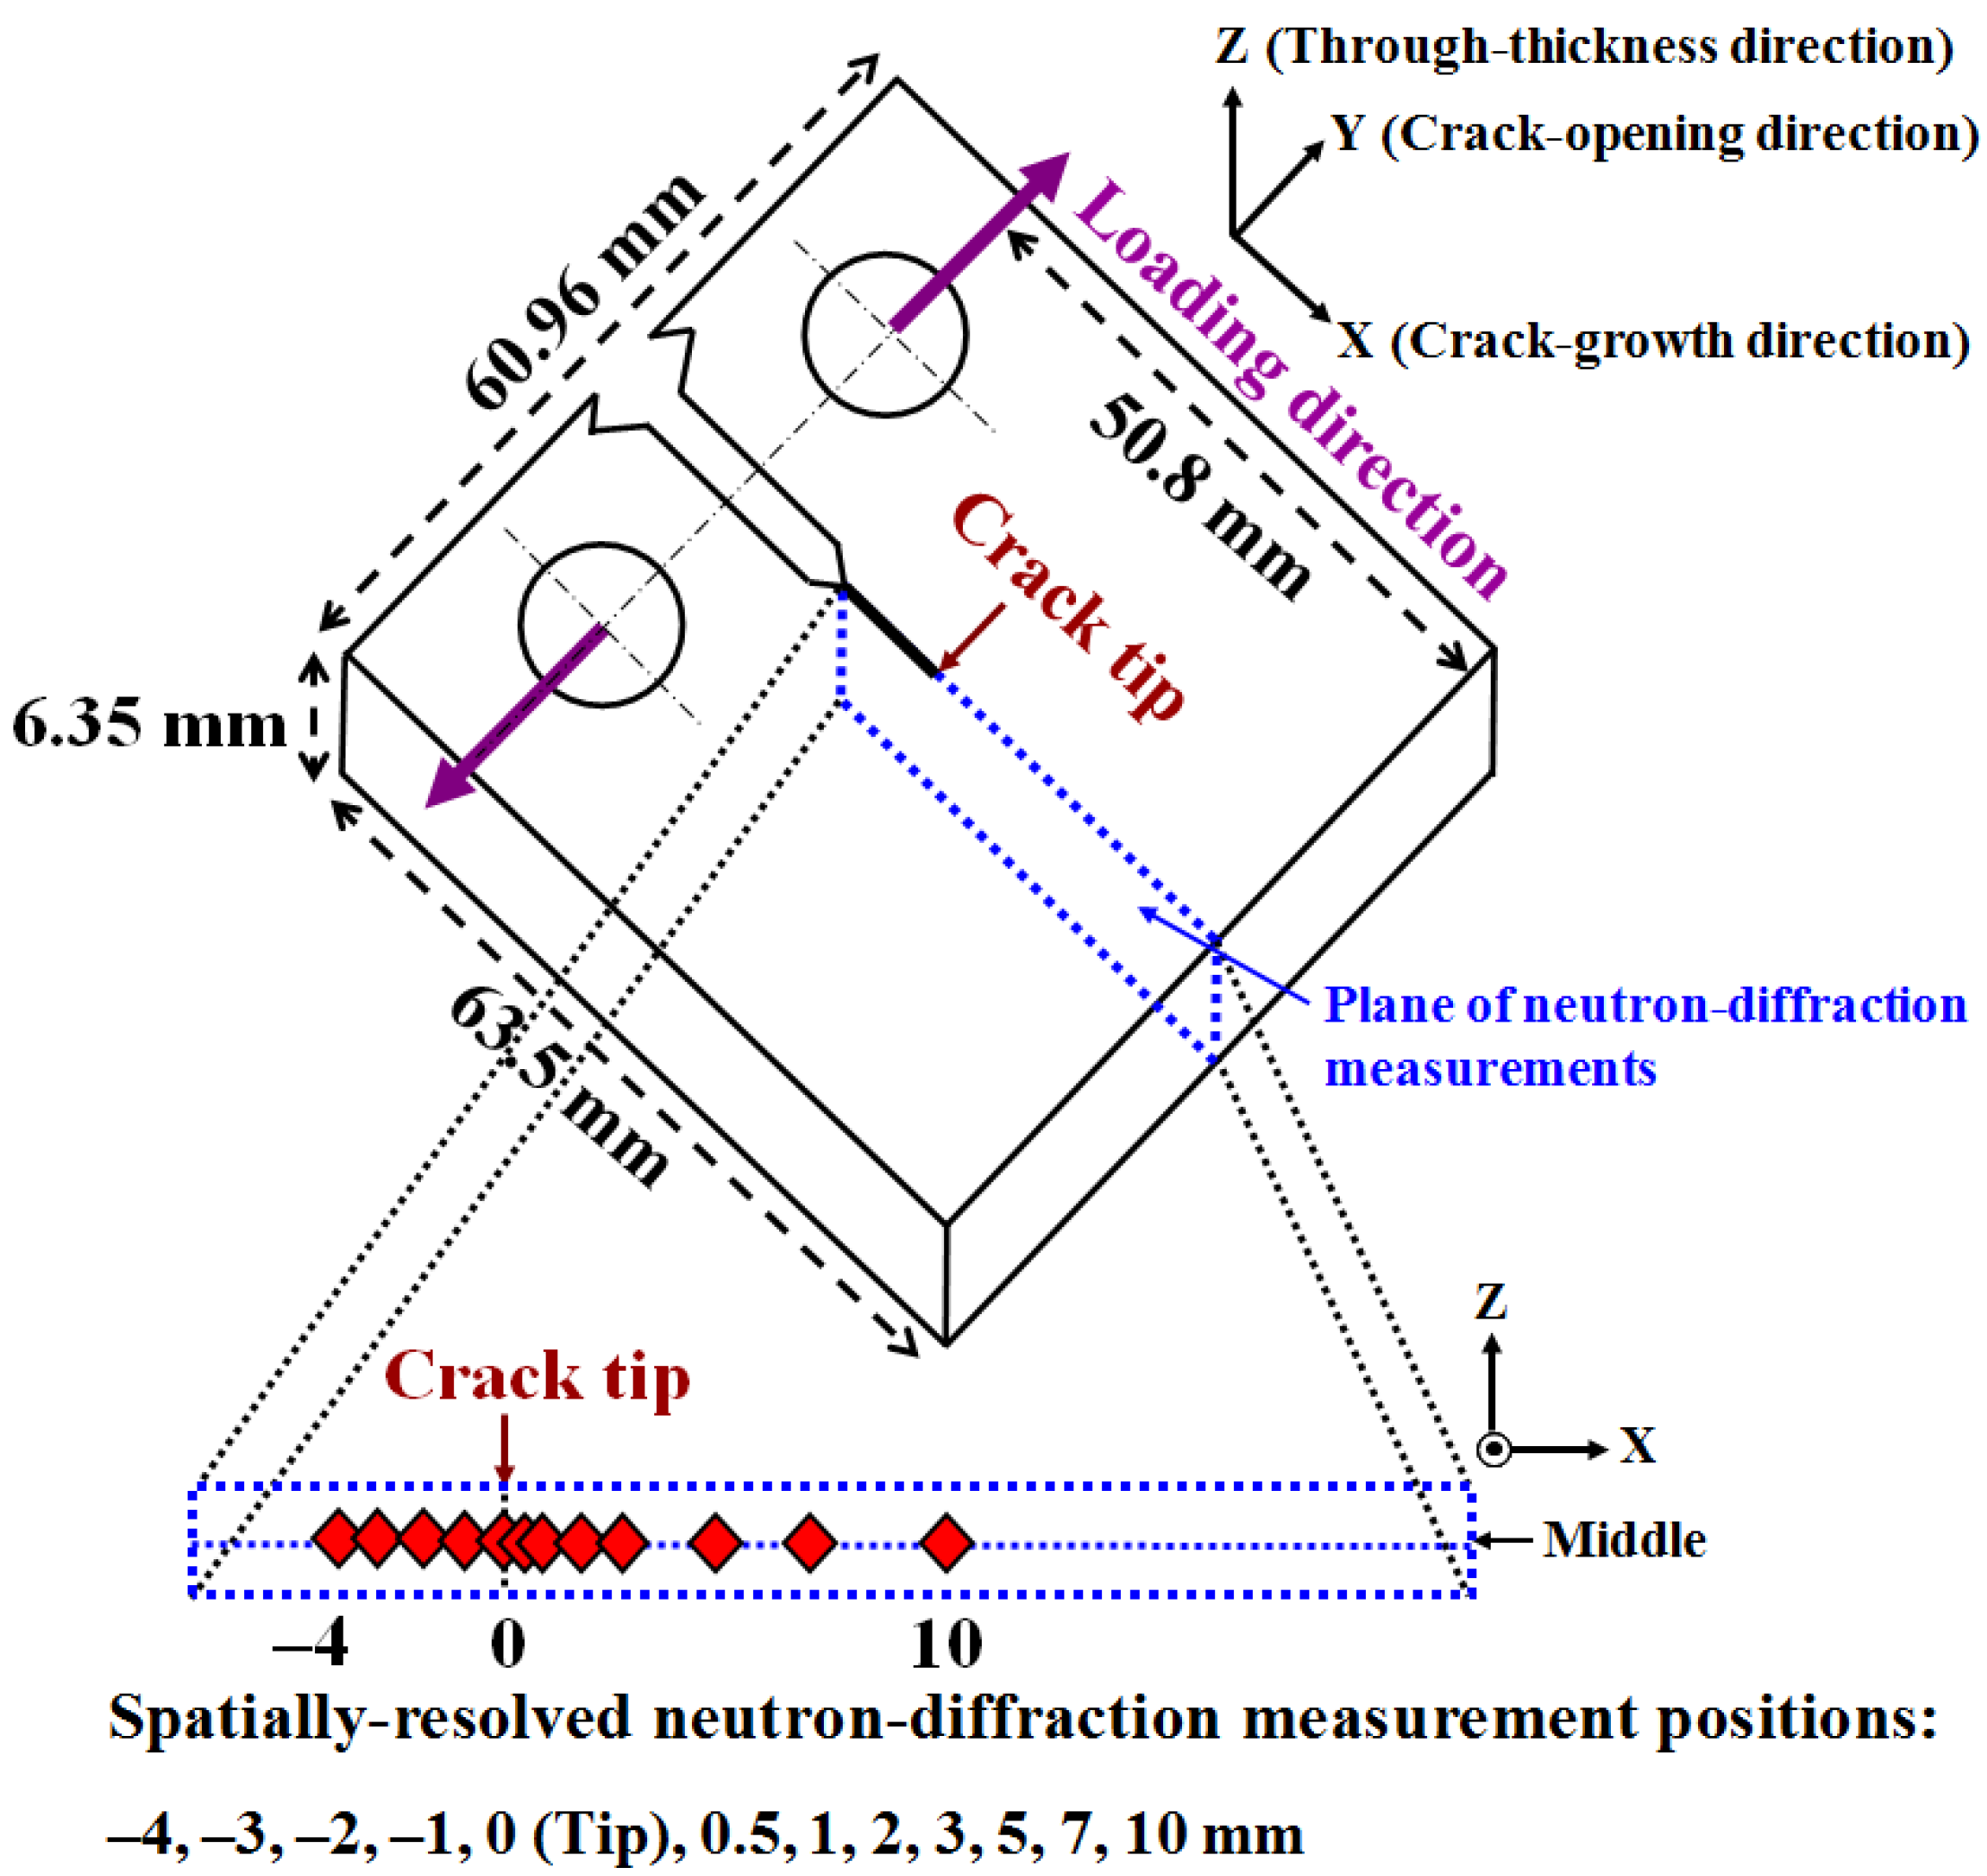
2.3. In Situ Neutron Diffraction Strain Measurements

In situ neutron diffraction experiments were performed using the Residual Stress Instrument at HANARO, Korea Atomic Energy Research Institute. The neutron diffraction measurements were performed at diffraction angles (2θ) of 84° for the {311} diffraction peaks of the austenite phase using a wavelength of 1.46 Å on the neutron beam. The (311) plane normal is perpendicular to the crack plane, i.e., crack growth direction. The change of d-spacings in the (311) orientation was measured in situ during loading as a function of distance from the crack tip along the crack-propagation direction. The strain mapping with a 1 mm spatial resolution was performed along the center line (mid-thickness) of the CT specimen (−4, −3, −2, −1, 0 (crack tip), 0.5, 1, 2, 3, 5, 7, 10 mm, Figure 2). The peak position was determined from the Gaussian fitting of the {311} diffraction peak in the crack-opening direction strain component. The lattice strains were then calculated by Equation 2.
ε = (dd0)/d0 = −cotθ (θ − θ0)
where d0 is the stress-free reference d-spacing, d is the lattice spacing under the stress condition, θ0 and θ are the diffraction angles for the stress-free and stressed conditions, respectively. The stress-free reference d-spacing was obtained 10 mm away from the corner of the annealed CT specimen. In the current study, the lattice strain evolution in the vicinity of the crack tip was examined at the 15 load levels (i.e., 0.01Pmax, 0.1Pmax, 0.2Pmax, 0.25Pmax, 0.3Pmax, 0.35Pmax, 0.4Pmax, 0.45Pmax, 0.5Pmax, 0.55Pmax, 0.6Pmax, 0.65Pmax, 0.7Pmax, 0.85Pmax, and 1Pmax), as the sample was in situ deformed.

3. Results and Discussion

Figure 3 shows the crack growth rate (da/dN) as a function of the stress intensity factor range (ΔK) under the two different fatigue loading conditions. While the constant-amplitude fatigue crack growth testing shows a linear relationship of the crack growth rate vs. ΔK following the Paris law, the tensile overloaded testing reveals the crack growth retardation period with a ΔK range of 29 to 38 MPa·m1/2 after the application of a single tensile overload. For a better understanding of the crack growth retardation phenomena, the two different fatigued specimens, Case 1 and Case 2, marked in Figure 3, with a ΔK range of 32 MPa·m1/2, are used to examine the effect of fatigue history on the strain evolution around the crack tip. The crack growth rates of Case 1 and Case 2 at ΔK = 32 MPa·m1/2 were 1.72 × 10⁻⁴ and 5.13 × 10⁻⁵, respectively.
Figure 3. The crack growth rates (da/dN) versus stress intensity factor range (ΔK) for the as-fatigued and overloaded conditions. The compact-tension specimens of Case 1 and Case 2 marked with the same ΔK of 32 MPa·m1/2 were used for in situ neutron diffraction experiments.
Metals 05 02109 g003
Figure 4 shows the crack morphology of Case 1 and Case 2 measured by the optical microscope. While Case 1 shows a relatively sharp crack tip, Case 2 shows a blunt crack at a ΔK range of 29 MPa·m1/2 due to large plastic deformation by the overload, followed by a sharp crack tip at a ΔK range of 32 MPa·m1/2.
Figure 4. The crack morphology measured by optical microscope: (a) Case 1, (b) Case 2. At a tensile overload point, the crack length and ΔK are 16 mm and 29 MPa·m1/2, respectively. The crack tip positions for both Case 1 and Case 2 are located at a crack length of 18 mm and a ΔK of 32 MPa·m1/2.
Metals 05 02109 g004
Figure 5 shows the evolution of internal strains around the crack tip as a function of applied load. In Figure 5a, the strains were compressive from −4.5 to 2.5 mm at 0.01Pmax. The maximum compressive strain of ~770 με (microstrain, 10−6) was observed at the crack tip. As the load increases, the strains right in front of the crack tip evolve significantly, exhibiting the maximum tensile strain of ~1450 με at 0.5 mm ahead of the crack tip. The change of the strains under loading becomes smaller, as the distance from the crack tip is far away. It is noted that very little change of the strains is observed in the locations behind the crack tip.
Figure 5. The lattice strain evolution as a function of distance from the crack tip under loading: (a) Case 1, (b) Case 2.
Metals 05 02109 g005
Figure 5b shows the strain profile of Case 2 upon loading. Three distinct observations are found: First, upon an applied loading of 0.01Pmax, much higher compressive strains with a maximum of ~1050 με were observed at −2 to 0 mm behind the crack tip, which is between an overload point and the crack tip. It is suggested that the enlarged compressive residual strains in conjunction with a blunting of the crack occurring at the overload point (Figure 4b) are related to the crack growth retardation mechanism after the overloading. Secondly, unlike the strain evolution of Case 1 shown in Figure 5a, it is obvious that the strains behind the crack tip of Case 2 evolve systematically with increasing applied load. It indicates that the stresses are distributed during loading not only in the locations ahead of the crack tip, but also in the locations behind the crack tip for Case 2. Finally, the maximum tensile strain of Case 2 at 0.5 mm in front of the crack tip was slightly smaller than that of Case 1. It was also found that the change of strains right in front of the crack tip during loading from Pmin to Pmax was smaller in Case 2 than in Case 1. It is thought that the less stresses applied right ahead of the crack tip for Case 2 result in less driving force of the crack growth, and thus, a lower crack growth rate as shown in Figure 3.
Figure 6 shows the strain evolution as a function of applied load at various locations away from the crack tip for Case 1 (Figure 6a) and Case 2 (Figure 6b). The nonlinearity of lattice strain as a function of applied load at the various locations means a change of the stress distribution during loading by being associated with a crack opening process. Earlier works have demonstrated that the onset of the nonlinearity of the lattice strain can be used to determine the crack opening level [16].
Figure 6. Lattice strain evolution as a function of applied load at the various locations away from the crack tip: (a) Case 1, (b) Case 2. “COL” indicates the crack-opening load. The square box highlights the difference of strain evolution behind the crack tip between Case 1 and Case 2. The arrow indicates the transfer of stress concentration in the locations behind the crack tip during loading.
Metals 05 02109 g006
As shown in Figure 6a, the stresses were not applied at all at −2.5 and −1.5 mm locations behind the crack tip during loading, as revealed in the invariant lattice strains during loading. From the nonlinearity of strain evolution, the crack opening load (COL) of ~0.25Pmax was determined for Case 1. On the other hand, quite different strain distributions were observed for Case 2 (Figure 6b). At a lower load, the stresses concentrate on the locations of −1 and −0.5 mm behind the crack tip, where the large compressive residual strains are observed as shown in Figure 5b. Upon loading, the stress concentration moves toward the crack tip by influencing the strain nonlinearity as indicated in Figure 6b. With the completion of a transfer of stress concentration at the crack tip, a relatively high COL of ~0.5Pmax was obtained for Case 2. The transfer of stress concentration at the crack tip should be understood in conjunction with the crack opening process, as is well described in the previous work [16]. Based on the crack opening loads determined from the strain nonlinearity shown in Figure 6, the effective stress intensity factor ranges (ΔKeff) as a driving force of fatigue crack growth were calculated as 25.06 MPa·m1/2 for Case 1 and 16.70 MPa·m1/2 for Case 2. These correlate well with a decrease of the crack growth rate of Case 2 compared with Case 1, as shown in Figure 3. Moreover, the smaller responses of the strains right in front of the crack tip for Case 2, as compared with those of Case 1 (Figure 5), can be shown to account for a lower crack tip driving force (ΔKeff) and a retardation of crack growth for Case 2.

4. Conclusions

In situ neutron diffraction was employed to compare the evolution of internal strains around the crack tip between the steady-fatigued (Case 1) and overload-fatigued (Case 2) specimens where the stress intensity factor range is identical but a different fatigue history exists. While strains behind the crack tip in Case 1 are irrelevant to increasing applied load, the strains behind the crack tip in Case 2 evolve significantly under loading, leading to smaller maximum tensile strain and strain change right in front of the crack tip. In Case 2, the transfer of stress concentration occurs toward the crack tip upon loading, resulting in a nonlinearity of the strain profile. The crack growth retardation after the overload can be attributed to a higher crack opening level measured for Case 2 by being correlated with a calculation of the effective stress intensity factor range as a driving force of fatigue crack growth.

Acknowledgments

This work was supported by the National Research Foundation of Korea (NRF) grant funded by the Korean government (MSIP) (Nos. 2014M2B2A4031983, 2013R1A1A1076023, 2013R1A4A1069528). EWH appreciates the support from Ministry of Science and Technology (MOST) Program 101-2221-E-008-039-MY3 and Atomic Energy Council (AEC) Program 10309037L.

Author Contributions

S.Y.L. wrote the initial draft of the manuscript; S.Y.L., E.-W.H., W.W., C.Y. analyzed the data; All co-authors contributed to the interpretation of the data.

Conflicts of Interest

The authors declare no conflict of interest.

References

  1. Elber, W. The Significance of Fatigue Crack Closure. In Damage Tolerance in Aircraft Structures; ASTM STP 486; American Society for Testing Materials: West Conshohocken, PA, USA, 1971; Volume 486, pp. 230–242. [Google Scholar]
  2. Gan, D.; Weertman, J. Crack closure and crack propagation rates in 7050 aluminum. Eng. Fract. Mech. 1981, 15, 87–106. [Google Scholar] [CrossRef]
  3. Shin, C.S.; Hsu, S.H. On the mechanisms and behavior of overload retardation in AISI-304 stainless-steel. Int. J. Fatigue 1993, 15, 181–192. [Google Scholar] [CrossRef]
  4. Sadananda, K.; Vasudevan, A.K.; Holtz, R.L.; Lee, E.U. Analysis of overload effects and related phenomena. Int. J. Fatigue 1999, 21, S233–S246. [Google Scholar] [CrossRef]
  5. Makabe, C.; Purnowidodo, A.; McEvily, A.J. Effects of surface deformation and crack closure on fatigue crack propagation after overloading and underloading. Int. J. Fatigue 2004, 26, 1341–1348. [Google Scholar] [CrossRef]
  6. Lee, S.Y.; Rogge, R.B.; Choo, H.; Liaw, P.K. Neutron diffraction measurements of residual stresses around a crack tip developed under variable-amplitude fatigue loadings. Fatigue Fract. Eng. Mater. Struct. 2010, 33, 822–831. [Google Scholar] [CrossRef]
  7. Jones, R.E. Fatigue crack growth retardation after single-cycle peak overload in Ti/6Al/4V titanium alloy. Eng. Fract. Mech. 1973, 5, 585–604. [Google Scholar] [CrossRef]
  8. Newman, J.C., Jr. A Crack-Closure Model for Predicting Fatigue Crack Growth under Aircraft Spectrum Loading; American Society for testing Materials: West Conshohocken, PA, USA, 1981; Volume 748, pp. 53–84. [Google Scholar]
  9. Suresh, S. Micromechanisms of fatigue crack growth retardation following overloads. Eng. Fract. Mech. 1983, 18, 577–593. [Google Scholar] [CrossRef]
  10. Wardclose, C.M.; Blom, A.F.; Ritchie, R.O. Mechanisms associated with transient fatigue crack-growth under variable-amplitude loading—An experimental and numerical study. Eng. Fract. Mech. 1989, 32, 613–638. [Google Scholar] [CrossRef]
  11. Dougherty, J.D.; Srivatsan, T.S.; Padovan, J. Fatigue crack propagation and closure behavior of modified 1070 steel: Experimental results. Eng. Fract. Mech. 1997, 56, 167–187. [Google Scholar] [CrossRef]
  12. Singh, K.D.; Khor, K.H.; Sinclair, I. Roughness- and plasticity-induced fatigue crack closure under single overloads: Finite element modelling. Acta Mater. 2006, 54, 4393–4403. [Google Scholar] [CrossRef]
  13. Bichler, C.H.; Pippan, R. Effect of single overloads in ductile metals: A reconsideration. Eng. Fract. Mech. 2007, 74, 1344–1359. [Google Scholar] [CrossRef]
  14. Lee, S.Y.; Choo, H.; Liaw, P.K.; Oliver, E.C.; Paradowska, A.M. In situ neutron diffraction study of internal strain evolution around a crack tip under variable-amplitude fatigue-loading conditions. Scr. Mater. 2009, 60, 866–869. [Google Scholar] [CrossRef]
  15. Lee, S.Y.; Liaw, P.K.; Choo, H.; Rogge, R.B. A study on fatigue crack growth behavior subjected to a single tensile overload: Part I. An overload-induced transient crack growth micromechanism. Acta Mater. 2011, 59, 485–494. [Google Scholar] [CrossRef]
  16. Lee, S.Y.; Choo, H.; Liaw, P.K.; An, K.; Hubbard, C.R. A study on fatigue crack growth behavior subjected to a single tensile overload: Part II. Transfer of stress concentration and its role in overload-induced transient crack growth. Acta Mater. 2011, 59, 495–502. [Google Scholar] [CrossRef]
  17. Lee, S.Y.; Huang, E.W.; Wu, W.; Liaw, P.K.; Paradowska, A.M. Development of crystallographic-orientation-dependent internal strains around a fatigue-crack tip during overloading and underloading. Mater. Charact. 2013, 79, 7–14. [Google Scholar] [CrossRef]
  18. Wheeler, O.E. Spectrum loading and crack growth. J. Basic Eng. 1972, 94, 181–186. [Google Scholar] [CrossRef]
  19. American Society for Testing and Materials (ASTM). Standard Test Method for Measurement of Fatigue Crack-Growth Rates; ASTM Standard E647-99; American Society for Testing Materials: West Conshohocken, PA, USA, 2000; pp. 591–630. [Google Scholar]

