Article

Effect of Strain Localization on Pitting Corrosion of an AlMgSi0.5 Alloy

Technische Universität Chemnitz, Professur Oberflächentechnik/Funktionswerkstoffe, 09107 Chemnitz, Germany
*
Author to whom correspondence should be addressed.
These authors contributed equally to this work.
Metals 2015, 5(1), 172-191; https://doi.org/10.3390/met5010172
Submission received: 8 December 2014 / Revised: 12 January 2015 / Accepted: 29 January 2015 / Published: 3 February 2015
(This article belongs to the Special Issue Ultrafine-grained Metals)

Abstract

:
The corrosion susceptibility of an age-hardened aluminum alloy in different processing conditions, especially after a single pass of equal-channel angular pressing (ECAP), is examined. The main question addressed is how corrosive attack is changed by strain localization. For that purpose, an AlMgSi0.5 alloy with a strain localized microstructure containing alternating shear bands was subjected to potentiodynamic polarization on a macro-scale and micro-scale using the micro-capillary technique. Pitting potentials and the corrosion appearance (pit depth, corroded area fractions and volumes) are discussed with respect to microstructural evolution due to casting, extrusion and ECAP. Size, shape and orientation of grains, constituent particle fragmentation, cell size and microstrain were analyzed. Stable pitting of shear bands results in less positive potentials compared to adjacent microstructure. More pits emerge in the shear bands, but the pit depth is reduced significantly. This is attributed to higher microstrains influencing the stability of the passivation layer and the reduced size of grains and constituent particles. The size of the crystallographic pits is associated with the deformation-induced cell size of the aluminum alloy.

Graphical Abstract

1. Introduction

Aluminum alloys are used in a wide range of technical applications, especially when considering the lightweight aspect. Mechanical properties are influenced by microstructural heterogeneities formed by adding alloying elements mostly combined with thermal or thermo-mechanical treatments. Solution heat treatment and aging lead to the formation of solid solutions and intermetallic compounds (ICs) stimulating mechanisms of solid solution and precipitation strengthening. Mechanical-based treatments cause strain hardening by multiplication of dislocations or grain refinement in the deformed metal. An effective deformation technique is equal-channel angular pressing (ECAP), also known as equal-channel angular extrusion, originally invented by Segal in 1972, first described in his Sc.D. thesis in 1974 and patented in 1977 (Patent of the USSR, No. 575892) [1,2]. A massive metallic billet is pressed through two intersecting channels whereby the material is severely deformed by exceptional, intensive and oriented simple shear, which is localized inside thin, so-called shear bands [1]. Accordingly, after one ECAP pass, one family of shear bands is activated. Repetitive pressing induces new shear bands depending on the rotation between the successive passes. Grain refinement down to ultrafine grains (UFG), re-distribution and fragmentation of second phases or impurities if existing in the material and texture evolution differ according to the applied processing route. In addition, the bulk material is characterized by high densities of dislocations and grain boundaries, internal elastic strains as well as residual stress thus delivering improved mechanical properties [3,4].
The effect of any microstructural heterogeneity results in an electrochemical heterogeneous behavior influencing the susceptibility to corrosion. In recent years, significant progress has been achieved in the understanding of both the microstructure of high strength alloys and its influence on corrosion [5]. Dominant features like the surface fraction of grain boundaries and dislocations as well as the distribution of second phases including constituent and impurity particles, dispersoids and precipitates are studied with respect to their corrosion susceptibility. The improved physico-chemical characterization of the composition and spatial distribution of second phases together with advanced electrochemical techniques expanded the understanding of the influence of intermetallic particles on the corrosion of conventionally grained (CG) alloys. A comprehensive review is given by Hughes et al. [5]. Recently, electrochemical properties of UFG aluminum and its alloys in different ECAP conditions were studied in a variety of publications (Table 1). Pitting corrosion starts with the local destruction of the natural oxide layer by critical anions (e.g., chloride ions) and is a dominant corrosion type of passivating materials. In electrochemical studies used to investigate the susceptibility to pitting, the pitting potential marks the breakthrough of the passive layer. In high-purity aluminum and single-phase aluminum model alloys, the pitting potential is lowered [6,7] or unaffected [8] compared to the CG material and is ascribed to the effect of grain refinement. Ralston et al. [9] correlate the corrosion rate in terms of oxide formation and film ion conduction with reactive surfaces provided by enhanced grain boundary density. Brunner et al. [7] found a lowered pitting potential due to the transition from CG to UFG material but no significant influence with the number of ECAP passes. The pit morphology after polarization occurred less crystallographically, deeper and more localized in the UFG material compared to the CG material in which laterally spreading crystallographic filiform corrosion dominated. The dislocation density and the deformation state were supposed to be the dominating factors for the different propagation mode of pitting corrosion: propagation in depth for UFG and laterally spreading for CG material [7]. The variation in passive film stability and the existence of local galvanic cells stimulate the anodic dissolution of the surrounding matrix material. Coherent solute enriched clusters can act as local cathodes in precipitation hardening alloys. Ralston et al. [10] found a critical particle size (of some nm) below which they do not act as distinct galvanic cells, but promote susceptibility to pitting if they increase.
Table 1. Review of pitting corrosion results published for Al and its alloys.
Material and processingEffect of pass number on EpitDominant pit initiation Pit morphology with increasing pass numberAnalytical techniquesReference
high purity Al 2, 6, 10 ECAP passes (route Bc)lowereddislocations, grain boundaries PP[6]
Al-2.5 wt% Cu-1.5 wt% Mg alloy aging, no ECAP unaffected/loweredcritical size of GP zones (solute enriched regions) PP, CT[10]
Al-Mg model alloys (varying Mg content) 4, 8, 12 ECAP passes (route Bc)lowered/unaffecteddeformation state more dominant than grain sizeafter PP: pits deeper and more localized, hindered repassivation with increasing pass number, filiform, decreasing crystallographic character PP, EIS[7]
high purity Al 1, 4, 8 ECAP passes (route Bc)unaffectedmore reactive surfaces for passivation (grain size, grain boundaries) PP[8]
AA 1050 1, 2, 3, 5 passesraisedfragmentation of Si-containing constituent particlesafter PT: decreased pit size, less severe attackPP, PT, EIS[11]
AA 1100 8 ECAP passes (route Bc); AA5052 4 ECAP passes (route Bc)raisedfragmentation of Fe-Al impurities, increased formation rate of passivation filmafter PT: decreased pit size, crystallographic pitsPP, EIS[12]
Al-5.4 wt% Ni and Al-5 wt% Cu 2, 4, 6 ECAP passes (route Bc)raisedfragmentation of constituent particles, microstructural homogenizationafter PP: fewer pits in the shear bandsPP[6]
EN AW-6082 1, 2, 8 ECAP passes (route E), 1 ECAP pass + post ageingraisedfragmentation and redistribution of constituent particlesafter PP: decreased pit depthPP, EIS, CV[13,14]
low purity Al (Al-0.5 wt% Si-0.15 wt% Fe) 16 ECAP passesraisedmore stable passivation film due to strain induced crystalline defects and residual (micro)stressafter PT: decreased pit size uniform distributionPP, PT, IT, EIS[15]
low purity Al (99.1 wt%) with α-AlFeSi phases 2, 4 ECAP passes (route A)loweredfragmentation of constituent particles (α-phase), grain refinement and higher dislocation densityafter IT: crystallographic pittingIT, PP, EIS[16]
low purity Al (99.1 wt%) with Al8Fe2Si phase 1, 2, 3, 4, 5 ECAP passes (route A)unaffectedfragmentation of constituent particles, increased volume fraction of grain boundariesafter IT and PP: reduced intergranular corrosion increased pitting increased density and decreased pit depthsIT, PP, EIS, 3D optical profilometry[17]
Note: PP, potentiodynamic polarization test; PT, potentiostatic polarization test; EIS, electrochemical impedance spectroscopy; CV, cyclovoltammetry; CT, current transient experiments; IT, immersion test; Epit, pitting potential.
Constituent particles in multi-phase materials mostly act as cathodic inhomogeneity performing a key role in pit initiation and propagation. With an increasing number of ECAP passes, the pitting potential of a variety of multi-phase aluminum alloys, which were reported to increase [11,12,15], decrease [16] or stay unaffected [17]. Correspondingly, for AA 5052, after four ECAP passes, the pitting potential was distinctly shifted to more positive potentials [12]. The crystallographic pits were smaller and more uniformly distributed in the UFG material than in the as-cast condition. The authors suggested a higher oxide formation rate based on the enhanced grain boundary fraction and dislocation density in the UFG materials. Similarly, Song et al. [15] stated that strain-induced crystalline defects provide more nucleation sites for the formation of a denser and thicker oxide film. Akiyama et al. [6] found an increasing pitting potential of Ni and Cu containing aluminum alloys due to ECAP processing. Fewer pits in the shear band areas were attributed to the microstructural homogenization and refinement of primary particles [6]. The amount, fragmentation and redistribution of constituent particles, containing mostly Si and Fe along with Al, were considered as the main factors for the modified pitting susceptibility and morphology of multiphase alloys [6,11,12,16].
Korchef et al. [16] found decreasing pitting potentials explained by the increasing fragmentation of α-AlFeSi particles acting as cathodes and driving anodic dissolution of the surrounding matrix. Jilani et al. [17] found no influence on the pitting potential with an increasing number of ECAP passes, but an increasing pitting density and decreasing pit depth. The change in the pitting morphology was assumed because of the fragmentation of Al8Fe2Si particles and/or the related increase of the volume fraction of grain boundaries acting as potential sites for pitting. Finally, the corrosion resistance of UFG materials processed by accumulative roll bonding shows similarly contrasting results [18,19].
Table 1 presents the reviewed literature together with own results [13,14] demonstrating little consensus in the influence of ECAP processing on the corrosion behavior of aluminum alloys even within the same alloy. Certainly, the main challenge of corrosion studies in this regard is the lack of a standardized material condition suitable as benchmark for evaluating the effect of ECAP processing on the corrosion behavior.
In order to overcome this obstacle, the present work adapts the testing and evaluating area to the strain localizations generated by a single ECAP pass processing. The selected ECAP condition presents concurrently ECAP-affected (shear bands) and non-affected (matrix) areas, which can be locally tested using a micro-capillary cell technique [20] and independently evaluated because only one family of shear bands is activated. Additional impacts by further processing are excluded. A commercial alloy AlMgSi0.5 with a well-known microstructure [21,22,23] was selected. The results of the micro-scale electrochemical studies are compared to standard macro-scale experiments including the material conditions of the foregoing processing steps casting and extrusion. Finally, the induced pitting damage is separately quantified for shear bands and matrix zones. The results are correlated with the microstructure of the material.

2. Experimental Section

2.1. Sample Preparation

A commercial AlMgSi0.5 alloy (EN AW-6060, chemical composition given in Table 2) was used in different material conditions. Samples were taken from a cast billet (referred to as cast) and from bars after appropriate processing steps. Homogenization and solution annealing at 560 °C for 10 h was followed by water quenching. The ingot was extruded at room temperature (RT) reducing the initial diameter of 110 mm to a cross-section of 50 × 50 mm² (samples referred to as RT-extruded). Severe plastic deformation was achieved using the combination of RT-extrusion with a subsequent large-scale ECAP single pass at RT [22,23] (samples referred to as ECAP). The internal angle of the die was 90°, the pressing speed 20 mm min−1 and the backpressure 200 MPa. The resulting effective strain was approximately 1.1 [24].
Table 2. Chemical composition of the investigated EN AW-6060 (wt%).
SiFeCuMnMgZnAl
EN AW-60600.450.160.0030.0260.490.003bal.
Samples with longitudinal planes were cut of each billet. After mechanical grinding with SiC, the final polishing step of the metallographic preparation was dependent on the intended investigation method. For optical microscopy (OM), polishing in a silicon oxide suspension (OP-S, Struers GmbH, Willich, Germany) and grain boundary etching for microstructural contrasting (2% NaOH) was applied. For electrochemical measurements, polishing with 1 µm diamond suspension was used to achieve a fairly chemically unaffected surface. After corrosion experiments, the surface was carefully rinsed with de-ionized water and ethanol and subjected to vibrational polishing using OP-S to provide a clean and deformation-free surface for backscattered electron (BSE, Zeiss, Jena, Germany) imaging and electron backscatter diffraction (EBSD, AMETEK GmbH, Wiesbaden, Germanyin the scanning electron microscope (SEM, Zeiss, Jena, Germany [25].

2.2. Electrochemical Measurements

Deformation localizations (shear bands) were detected by OM on the etched ECAP sample surface and marked by indentations. The electrochemical experiments were accomplished in an aerated and unbuffered 0.1 M NaCl solution (pH 7) at (22.0 ± 0.5) °C. The samples were exposed to the solution for 15 min to stabilize the open circuit potential (OCP). Polarization curves were measured using a high-resolution potentiostat IMP83 PCT-BC (Jaissle Elektronik, Waiblingen, Germany). After determining the starting potential, potentiodynamic polarization experiments were done covering the potential range from 200 mV below the corrosion potential (between −1300 mV and −1100 mV depending on the material condition) to 1000 mV with a scan rate of 1 mVs−1. For experiments with an exposed area of 10 mm in diameter (referred to as macro-scale), a three-electrode corrosion cell with a platinum plate as counter electrode and an Ag/AgCl (3 M KCl) reference electrode was used according to the standard specification DIN 50918. Macro-scale measurements were repeated three times.
For local micro-electrochemical measurements (referred to as micro-scale), a glass capillary with a ground tip of 200 µm in diameter was used. A layer of silicone rubber worked as a seal to prevent leakage. The capillary size was selected in order to cover either the shear band or the matrix of the material in ECAP condition. The three-electrode set-up consisting of the glass capillary, a 0.5 mm platinum wire counter electrode and a Ag/AgCl (3 M KCl) reference electrode was mounted in an objective nosepiece. With the samples fixed on the stage of the OM, exact positioning on the microstructural localization (shear band or matrix) was obtained. The set-up of the micro-cell system is described in detail in [20,26]. Micro-scale measurements were repeated nine up to 13 times depending on the material condition.

2.3. Microstructural Characterization

Characterization of the microstructure and the pit morphology were performed in a field-emission scanning electron microscope (FE-SEM, NEON40EsB, Carl Zeiss MicroImaging GmbH, Jena, Germany) equipped with an EBSD system (EDAX TSL OIM 5.2, AMETEK GmbH, Wiesbaden, Germany. EBSD patterns were acquired at an acceleration voltage of 15 kV with a 60 µm aperture in high-current mode under a sample tilt angle of 70°. After data acquisition, a slight cleanup procedure for the nearest neighbor pixels was conducted comprising neighbor confidence index (CI) correlation and grain CI standardization with a minimum CI of 0.1.
Material removal by corrosion was quantitatively evaluated by using a 3D optical profilometer (Mikro-CAD compact, GFMesstechnik GmbH, Teltow, Germany). Corroded surface areas were determined by means of the software a4i analysis (GFMesstechnik GmbH, Teltow, Germanycity). Depth and volume of the resulting corrosion pits were measured using replicas of the tested regions. Pits with a depth larger than 5 µm were considered.
X-ray diffraction (XRD) analysis (sin2ψ method) was applied for the determination of local residual stresses and microstrains. The diffractometer D8 Discover (Bruker AXS, Karlsruhe, Germany) was equipped with a Cu anode, a Ni filter for monochromatization, polycap optics and a 2D detector (Vantec-500, Karlsruhe, Germany. The {311} lattice planes of Al were considered for the residual stress measurements using several measurement directions (0°, 45°, 90°–rotation around the sample normal) each with tilt angles between −50° and 50° (in 10° steps) and a measurement time of 900 s for each angle. A small aperture (100 µm) in the primary beam, adequate to the dimensions of the strain localizations, and a point detector (SOL-XE) with a 0.6 mm detector slit were used for the determination of microstrains and coherence lengths in a line scan. The step size of the line scan was 100 µm. The program LEPTOS was used for stress evaluation. The line widths of the strong textured {220} lattice planes were evaluated by means of the program TOPAS under consideration of the device-related line-broadening effects to estimate the coherence length.

3. Results and Discussion

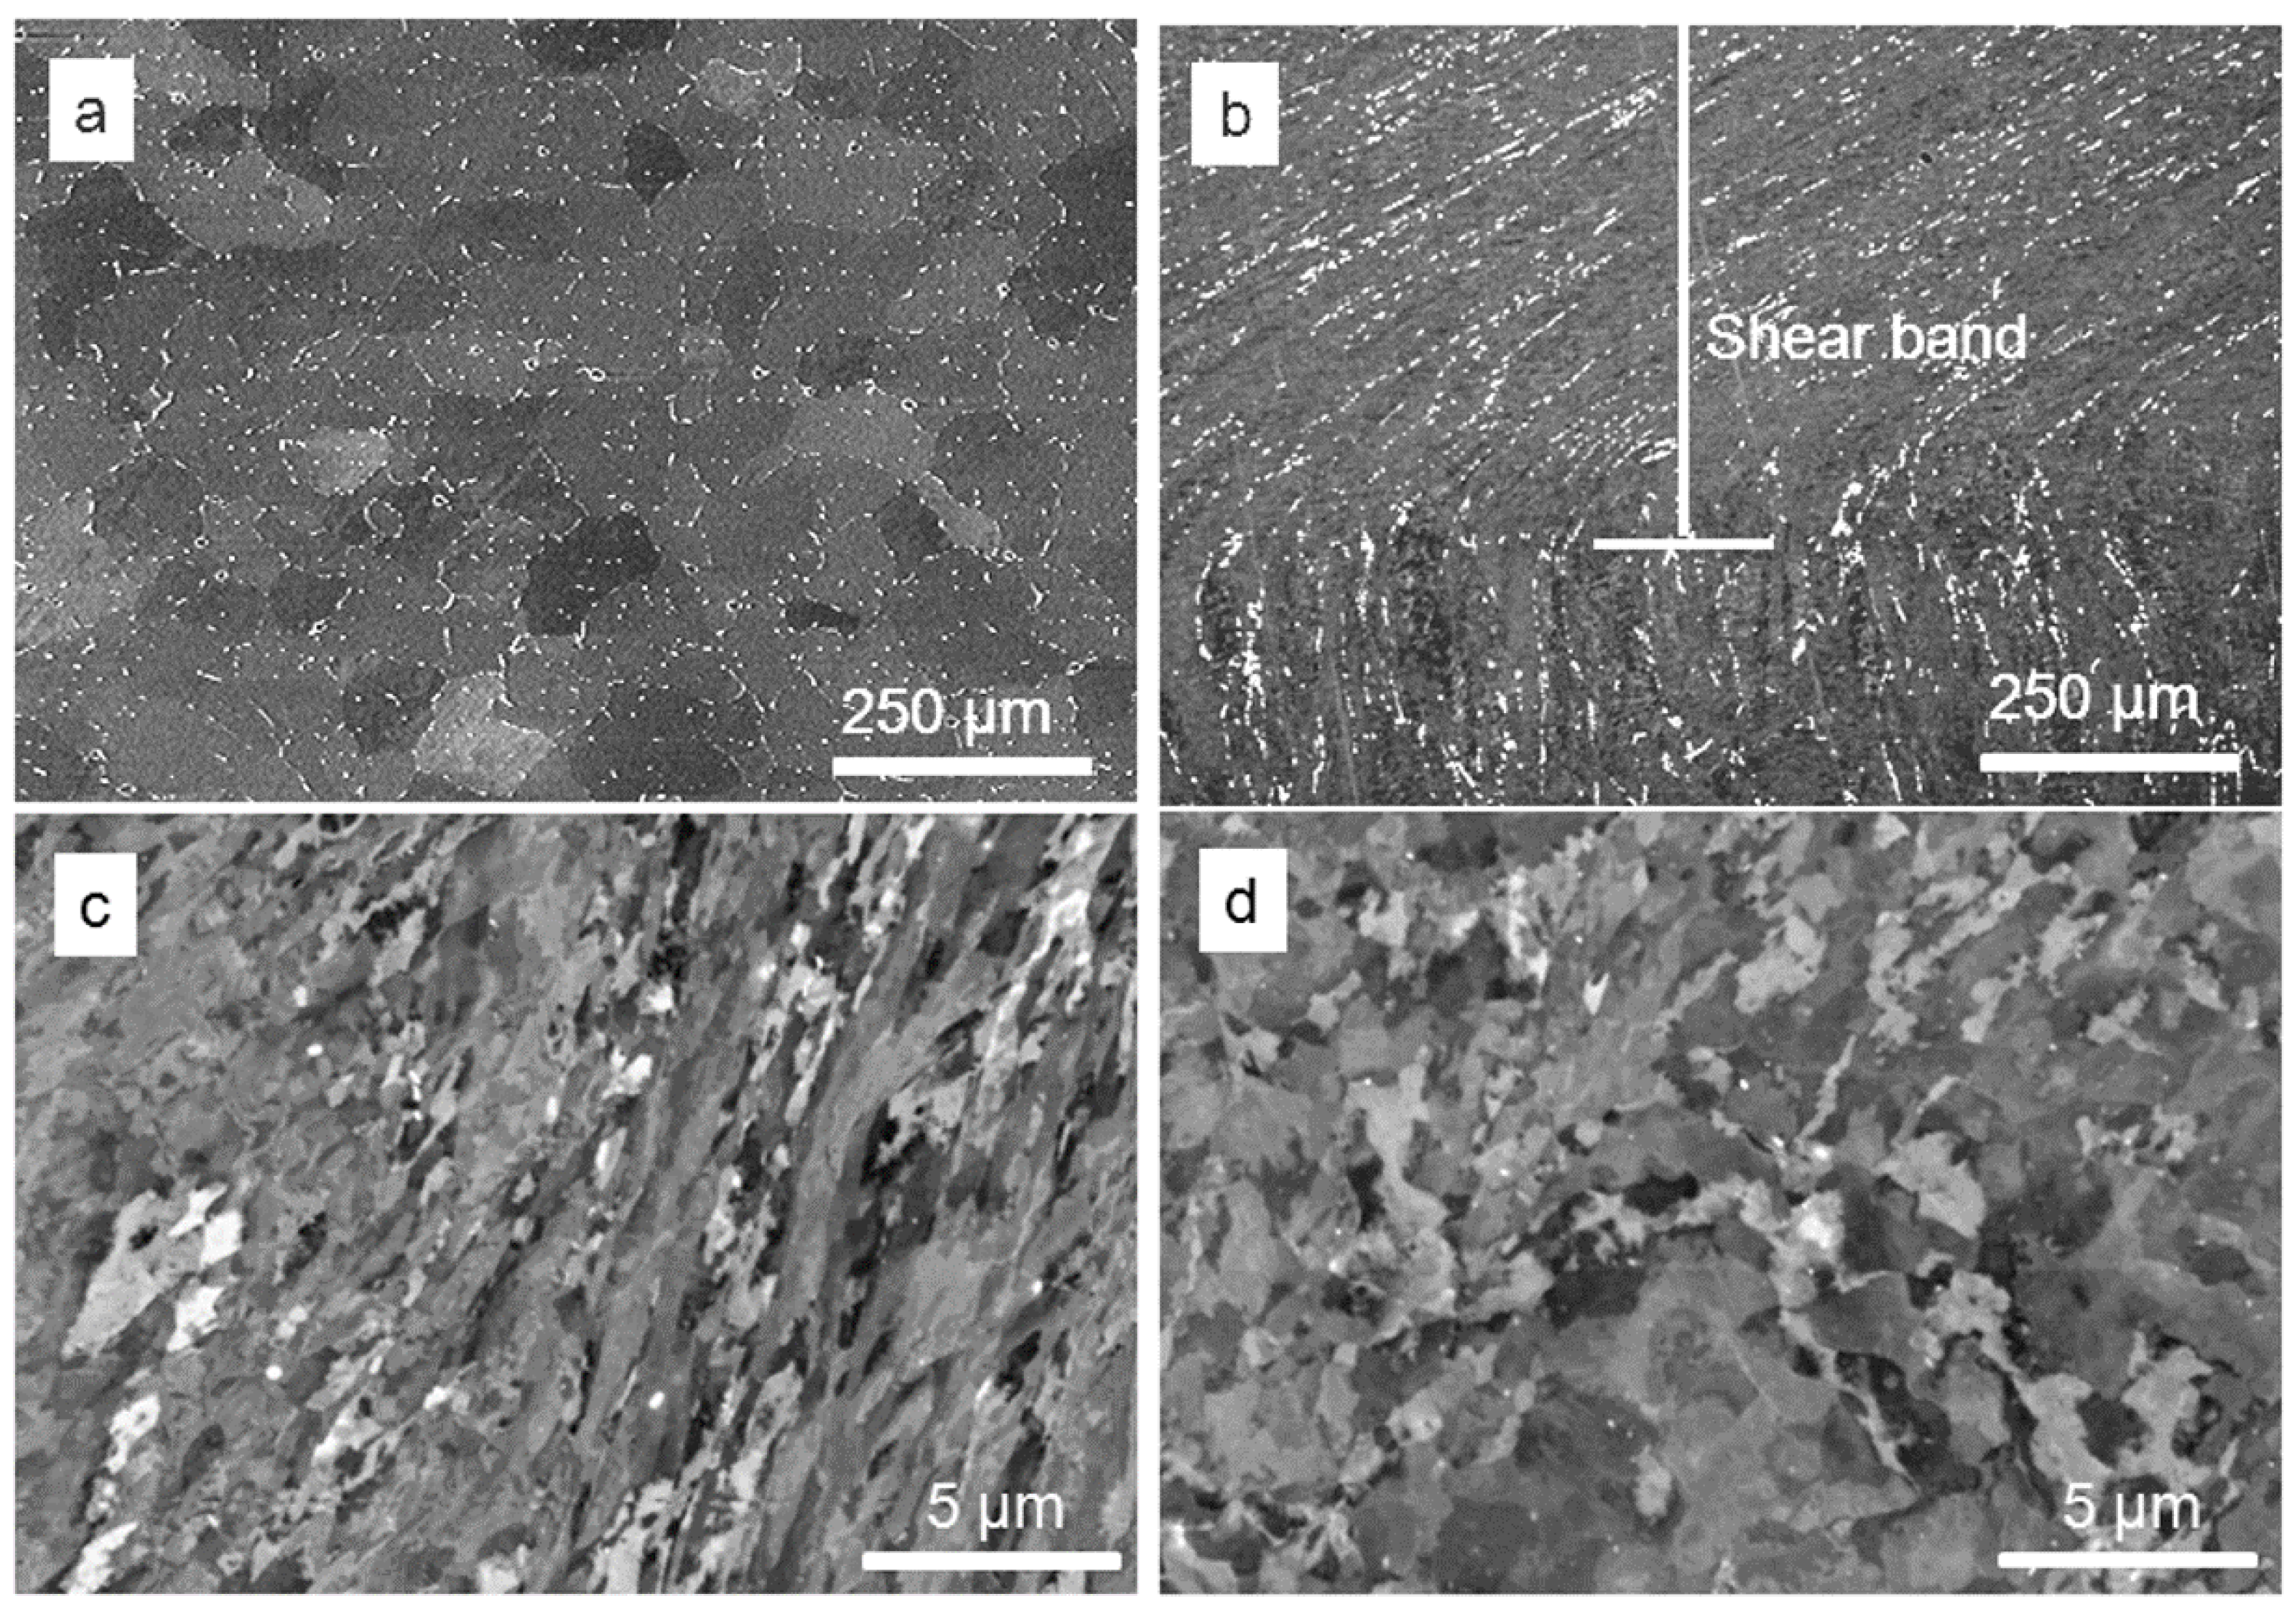
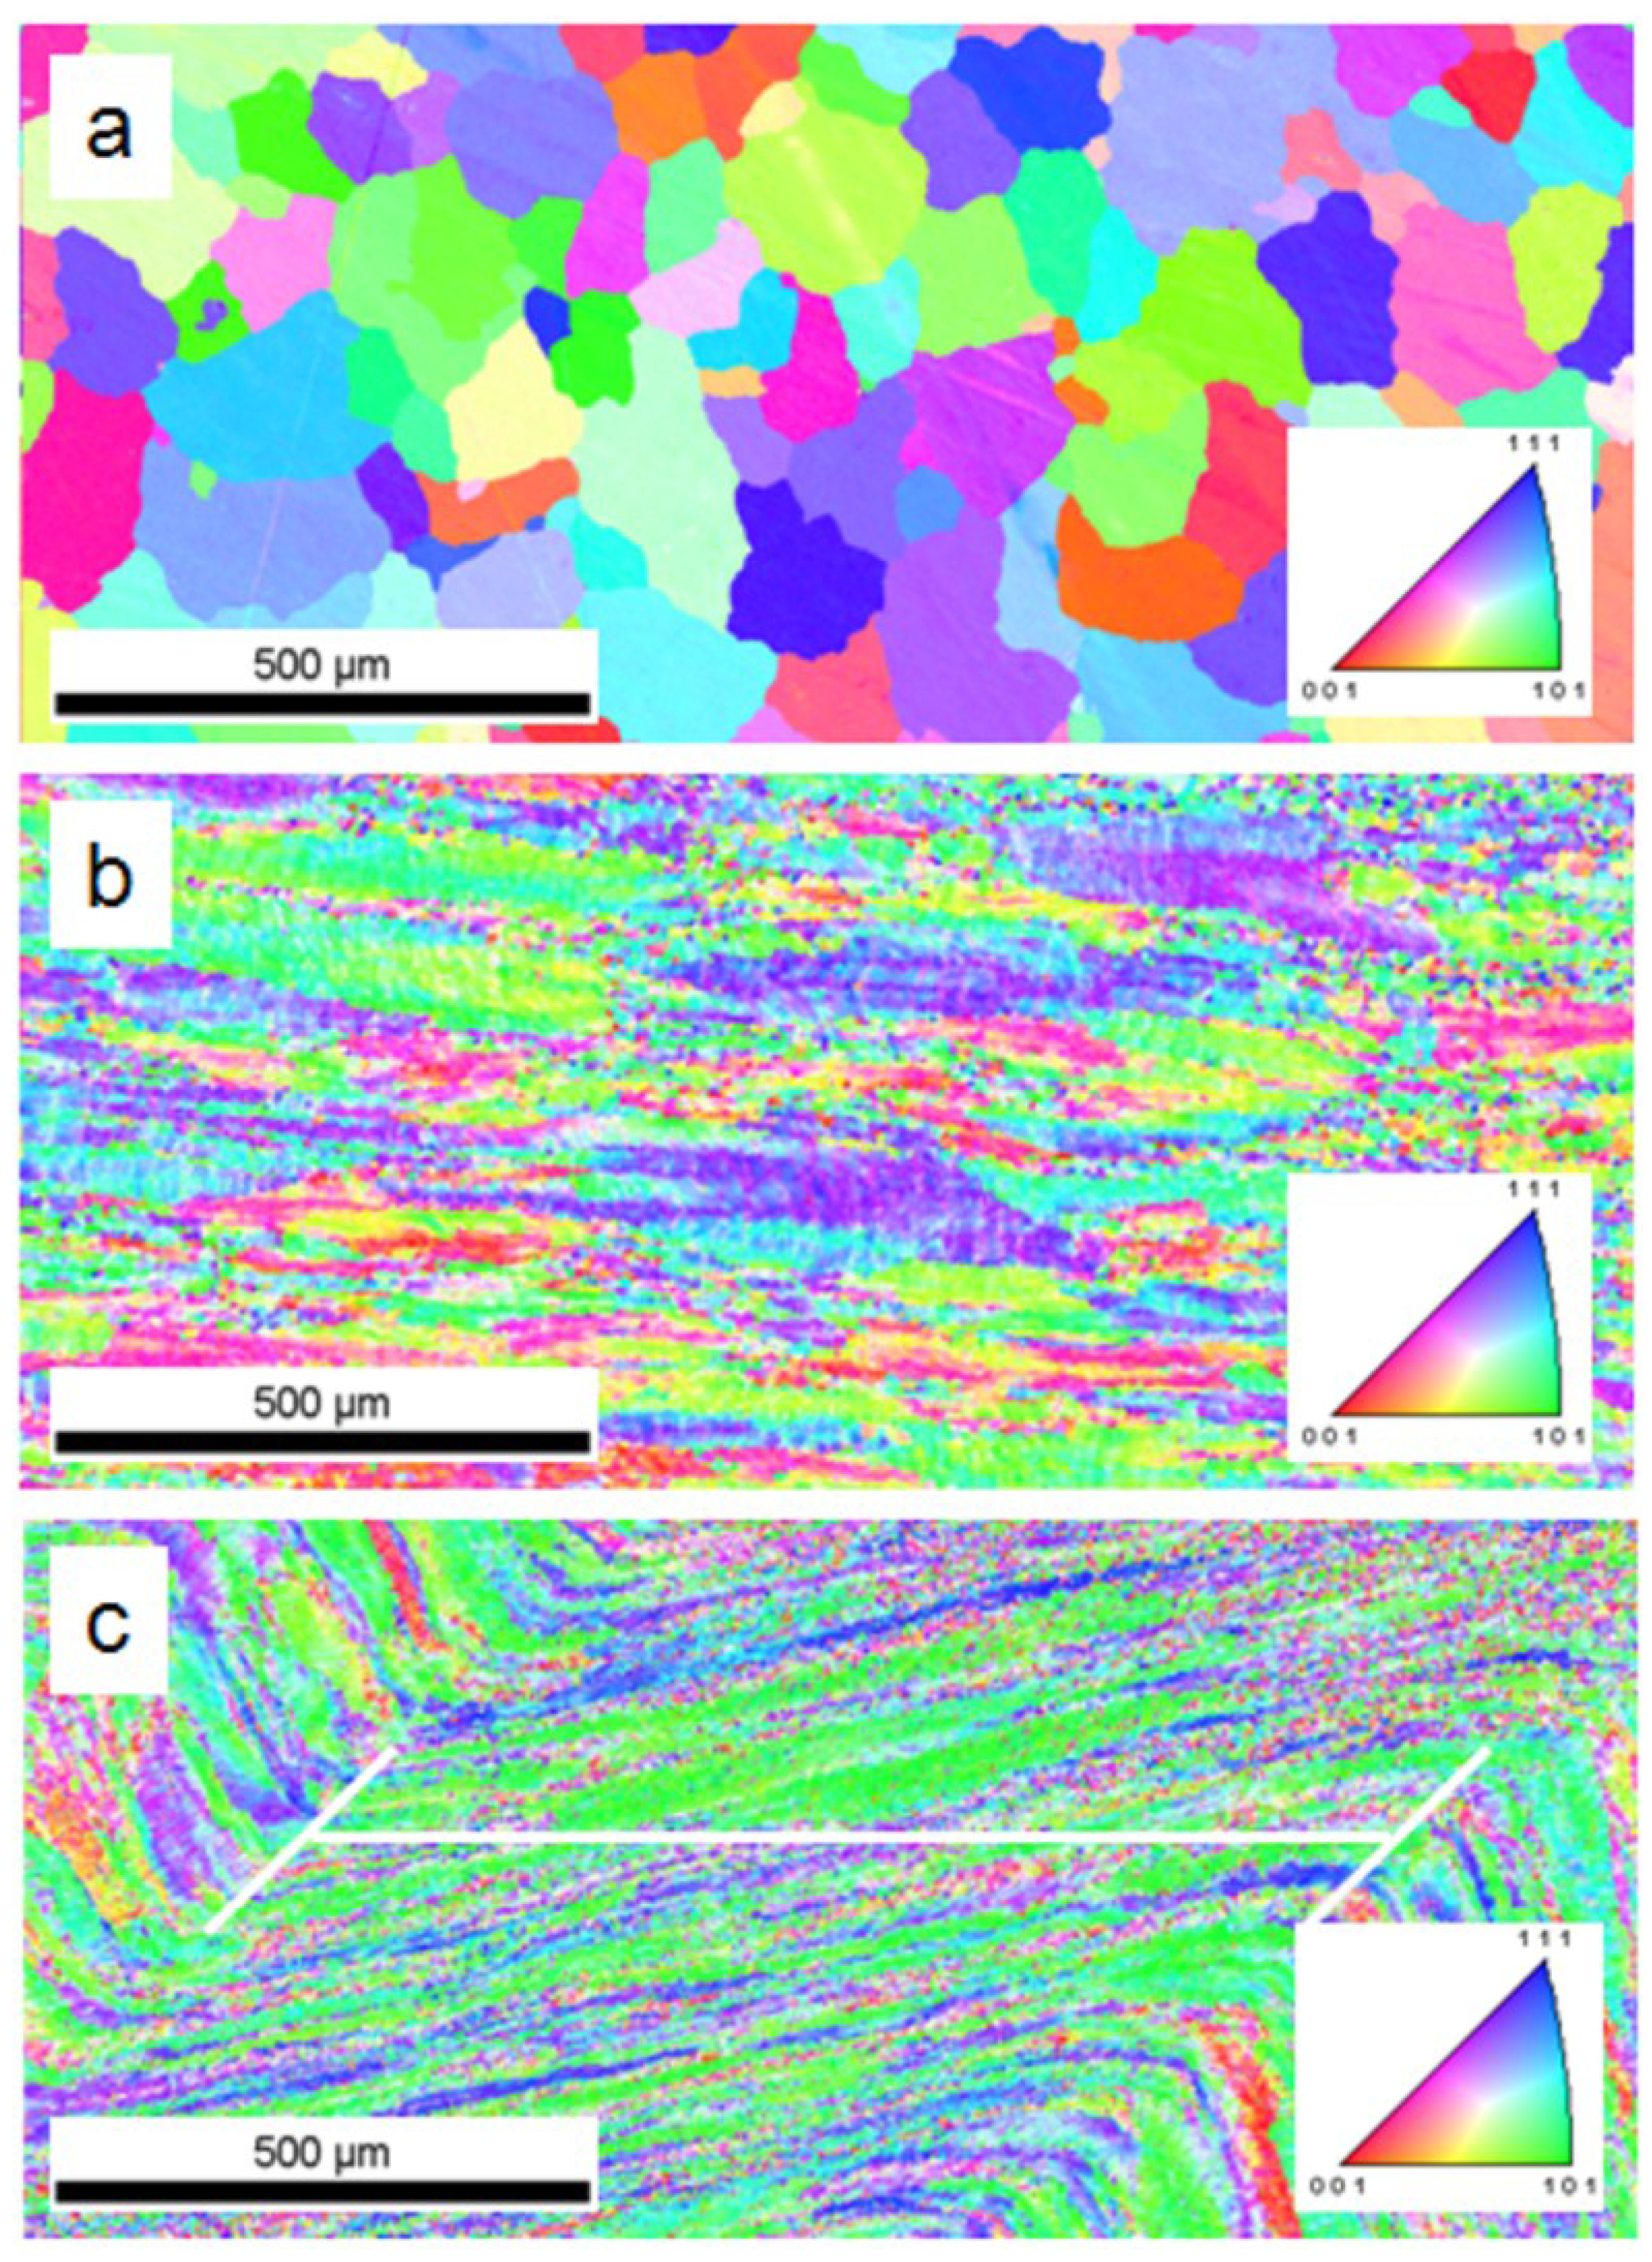
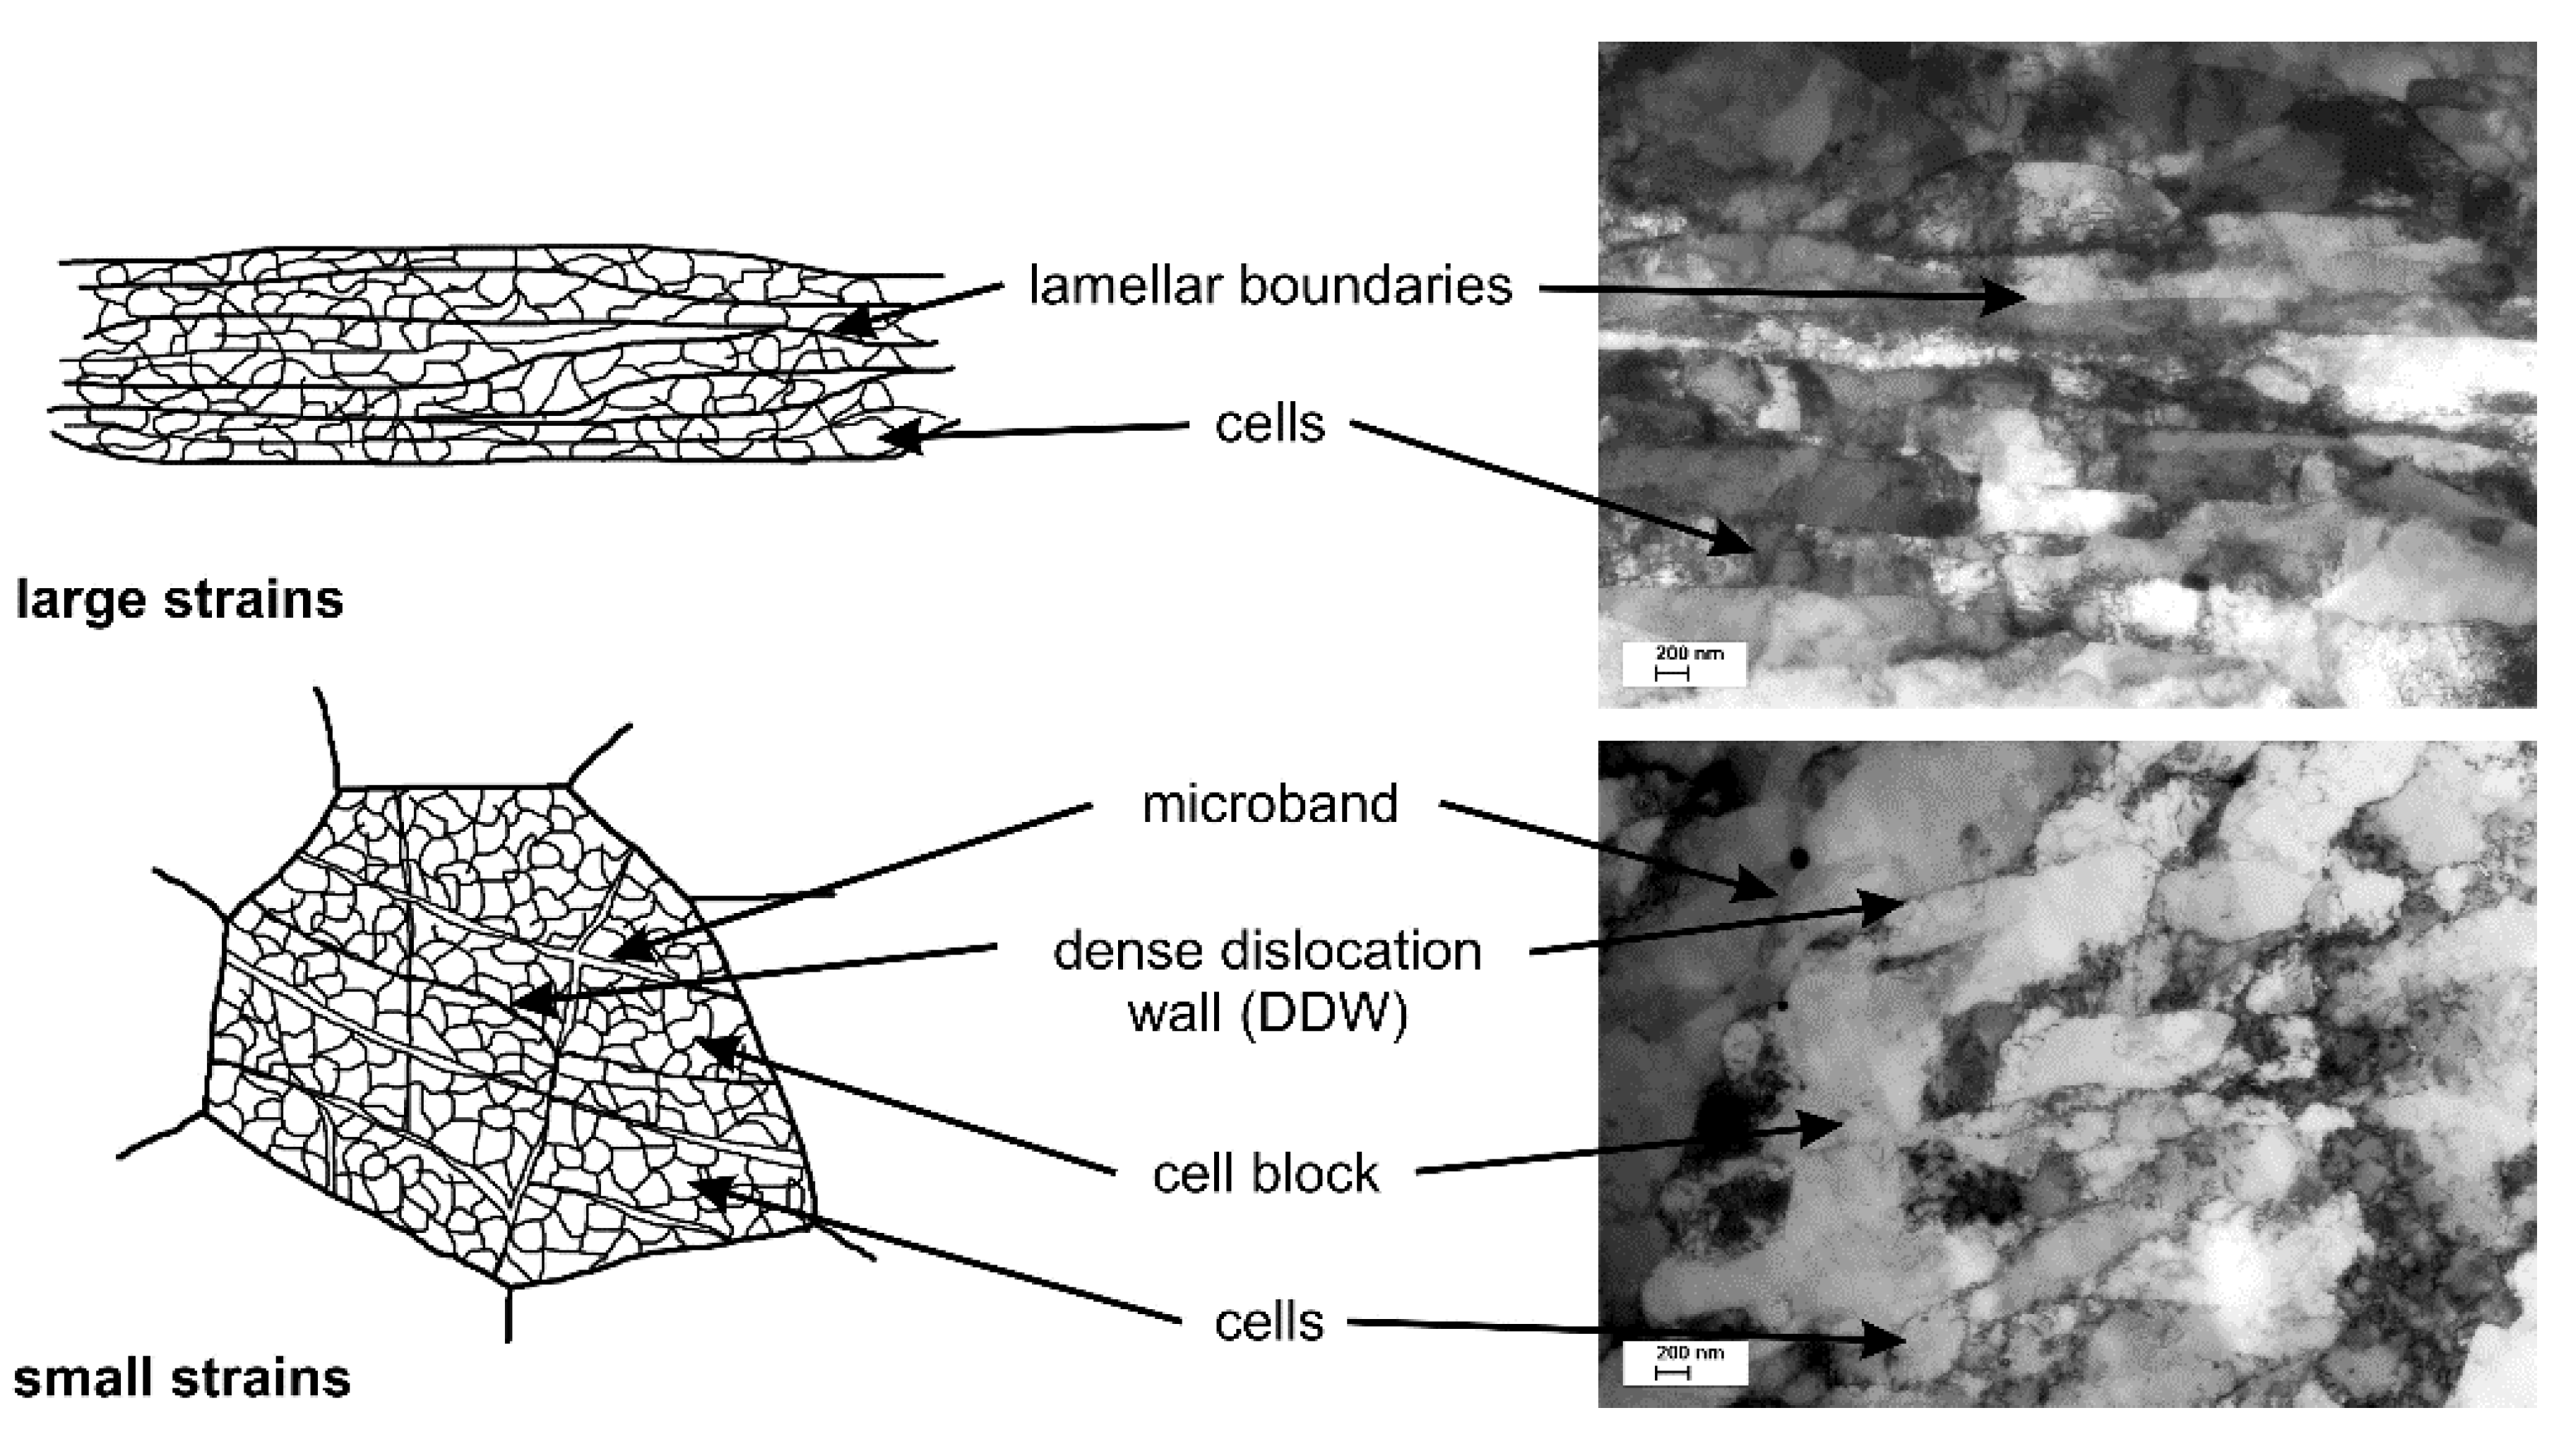
3.1. Evolution of Microstructure

The cast material (Figure 1a) is characterized by equiaxed grains with a mean diameter of 100 µm and numerous constituent particles decorating the grain boundaries. The IC particles in the cast condition are a few micrometers in size; homogenization and solution annealing resulted in a slight enlargement. The extrusion process transformed the alloy microstructure to elongated grains with an aspect ratio around 0.5 associated with the redistribution of the IC particles located at the grain boundaries. The single-pass ECAP process introduced a series of deformation localizations (shear bands) intercalated in fairly unchanged matrix regions. The grains in the shear bands become more elongated to an aspect ratio below 0.3. The IC particles are re-aligned with the aluminium grains and slightly fragmented (Figure 1b). Additionally, the deformation processing introduced a sub-grain structure with a size around 1 µm (Figure 2c,d). This is in agreement with transmission electron microscopic results achieved at the same alloy [23].
Figure 1. Microstructure of the AlMgSi0.5 alloy in (a) cast condition showing constituent particles in the grain boundaries; (b) ECAP (equal-channel angular pressing) condition showing shear bands (a part of it is marked by a white bar) introduced into the matrix (below); (c) elongated grains in the shear band and (d) fairly unchanged grains in the matrix, which is similar to the extruded condition.
Metals 05 00172 g001
According to Birbilis et al. [27], the IC particles of particular interest with regard to localized corrosion are those with the greatest quantity in size or frequency—these are AlFeSi phases in the AlMgSi0.5 alloy. As shown for the extruded condition of the alloy [28], the iron and silicon containing constituent particles include compositions with different stoichiometry. Apart from the AlFeSi phases, the solid solution matrix of the as-cast billet contains dissolved Mg and Si, which precipitate to fine β and β´ particles during quenching [29,30]. Certain observations show that the hardening precipitates in the studied AlMgSi0.5 alloy undergo fragmentation and change in coherency by ECAP [31,32].
Apart from grain sizes and aspect ratios, orientation maps (Figure 2a–c) were derived from EBSD measurements which illustrate the microstructural evolution of the material with respect to grain orientation or texture. The random orientation of the cast material (Figure 2a) is transformed by RT extrusion to a fiber texture with the main component <110> in extrusion direction (Figure 2b). The grain orientation map of the ECAP condition (Figure 2c) shows a shear band in the center with a texture fairly similar to the matrix. Deformation localizations are clearly reflected by dark regions in EBSD pattern quality maps as shown later in Figure 9.
Figure 2. Orientation distribution maps of the material in the (a) cast; (b) the RT-extruded and (c) the ECAP condition showing the grain shape transformation to elongated grains of reduced size and texture evolution by extrusion and ECAP; the shear band in (c) is marked by a white bar.
Metals 05 00172 g002
The measurement of residual stresses and microstrains was focused on the deformation localizations of the material in ECAP condition. Almost no differences could be detected for the principal stress components σ1 and σ2 inside shear bands and matrix regions. The measured components of the residual stress are σ1 ≈ 60 MPa and σ2 ≈ −20 MPa.
Microstrains have been specified referring to the full width at half maximum of the Gaussian part of the line profile. Measurements of several points on the material in the RT-extruded condition were taken for comparison and reveal a fairly constant microstrain of 0.21. The microstrain in the ECAP condition varies between 0 and 0.34. A line scan was measured with an increment of 100 µm across three shear bands intercalated in the matrix. Figure 3 shows the local distribution of microstrain in correlation to the shear bands revealed by grain boundary etching. The shear band-matrix transitions are marked by white lines. It can be seen that the widths of deformation localizations comprise a wide range. For reasons of representation, the values of the microstrain are grouped in bins. Color-coded according to the legend, the microstrain scan is inserted in the optical micrograph at the position of the measurement. As expected, higher values of microstrain are found in the shear bands and lower values in the matrix (Figure 3). The broad matrix band on the right shows an additional subdivision—possibly because of the actual three-dimensional distribution of shear bands, which is not observable in the plain cross-section. Apparently, the microstrains are a result of the deformation localization introduced by the severe deformation during the ECAP pass.
Figure 3. Local distribution of the microstrain in a line scan across three shear bands of the material in the ECAP condition; the region of interest is shown with respect to the deformation localizations shown by grain boundary etching (for color-coding, see legend).
Metals 05 00172 g003
Crystallite size was determined by the Lorentzian part of the line profile. The measured characteristic is the distance that scatters the incident X-ray beam coherently. Apart from grains and sub-grains defined by high- and low-angle boundaries, coherent regions are bounded by accumulated dislocations and are commonly assigned as cells. Cell sizes are averaged out at 180 nm in the extruded condition and typically range from 80 nm–170 nm for both matrix and shear bands of the ECAP condition, which is consistent with the published cell size data determined by STEM [32]. Interestingly, the mean cell size in the matrix region is smaller (≈100 nm) compared to the shear band with the largest cells in the region with the highest microstrain.

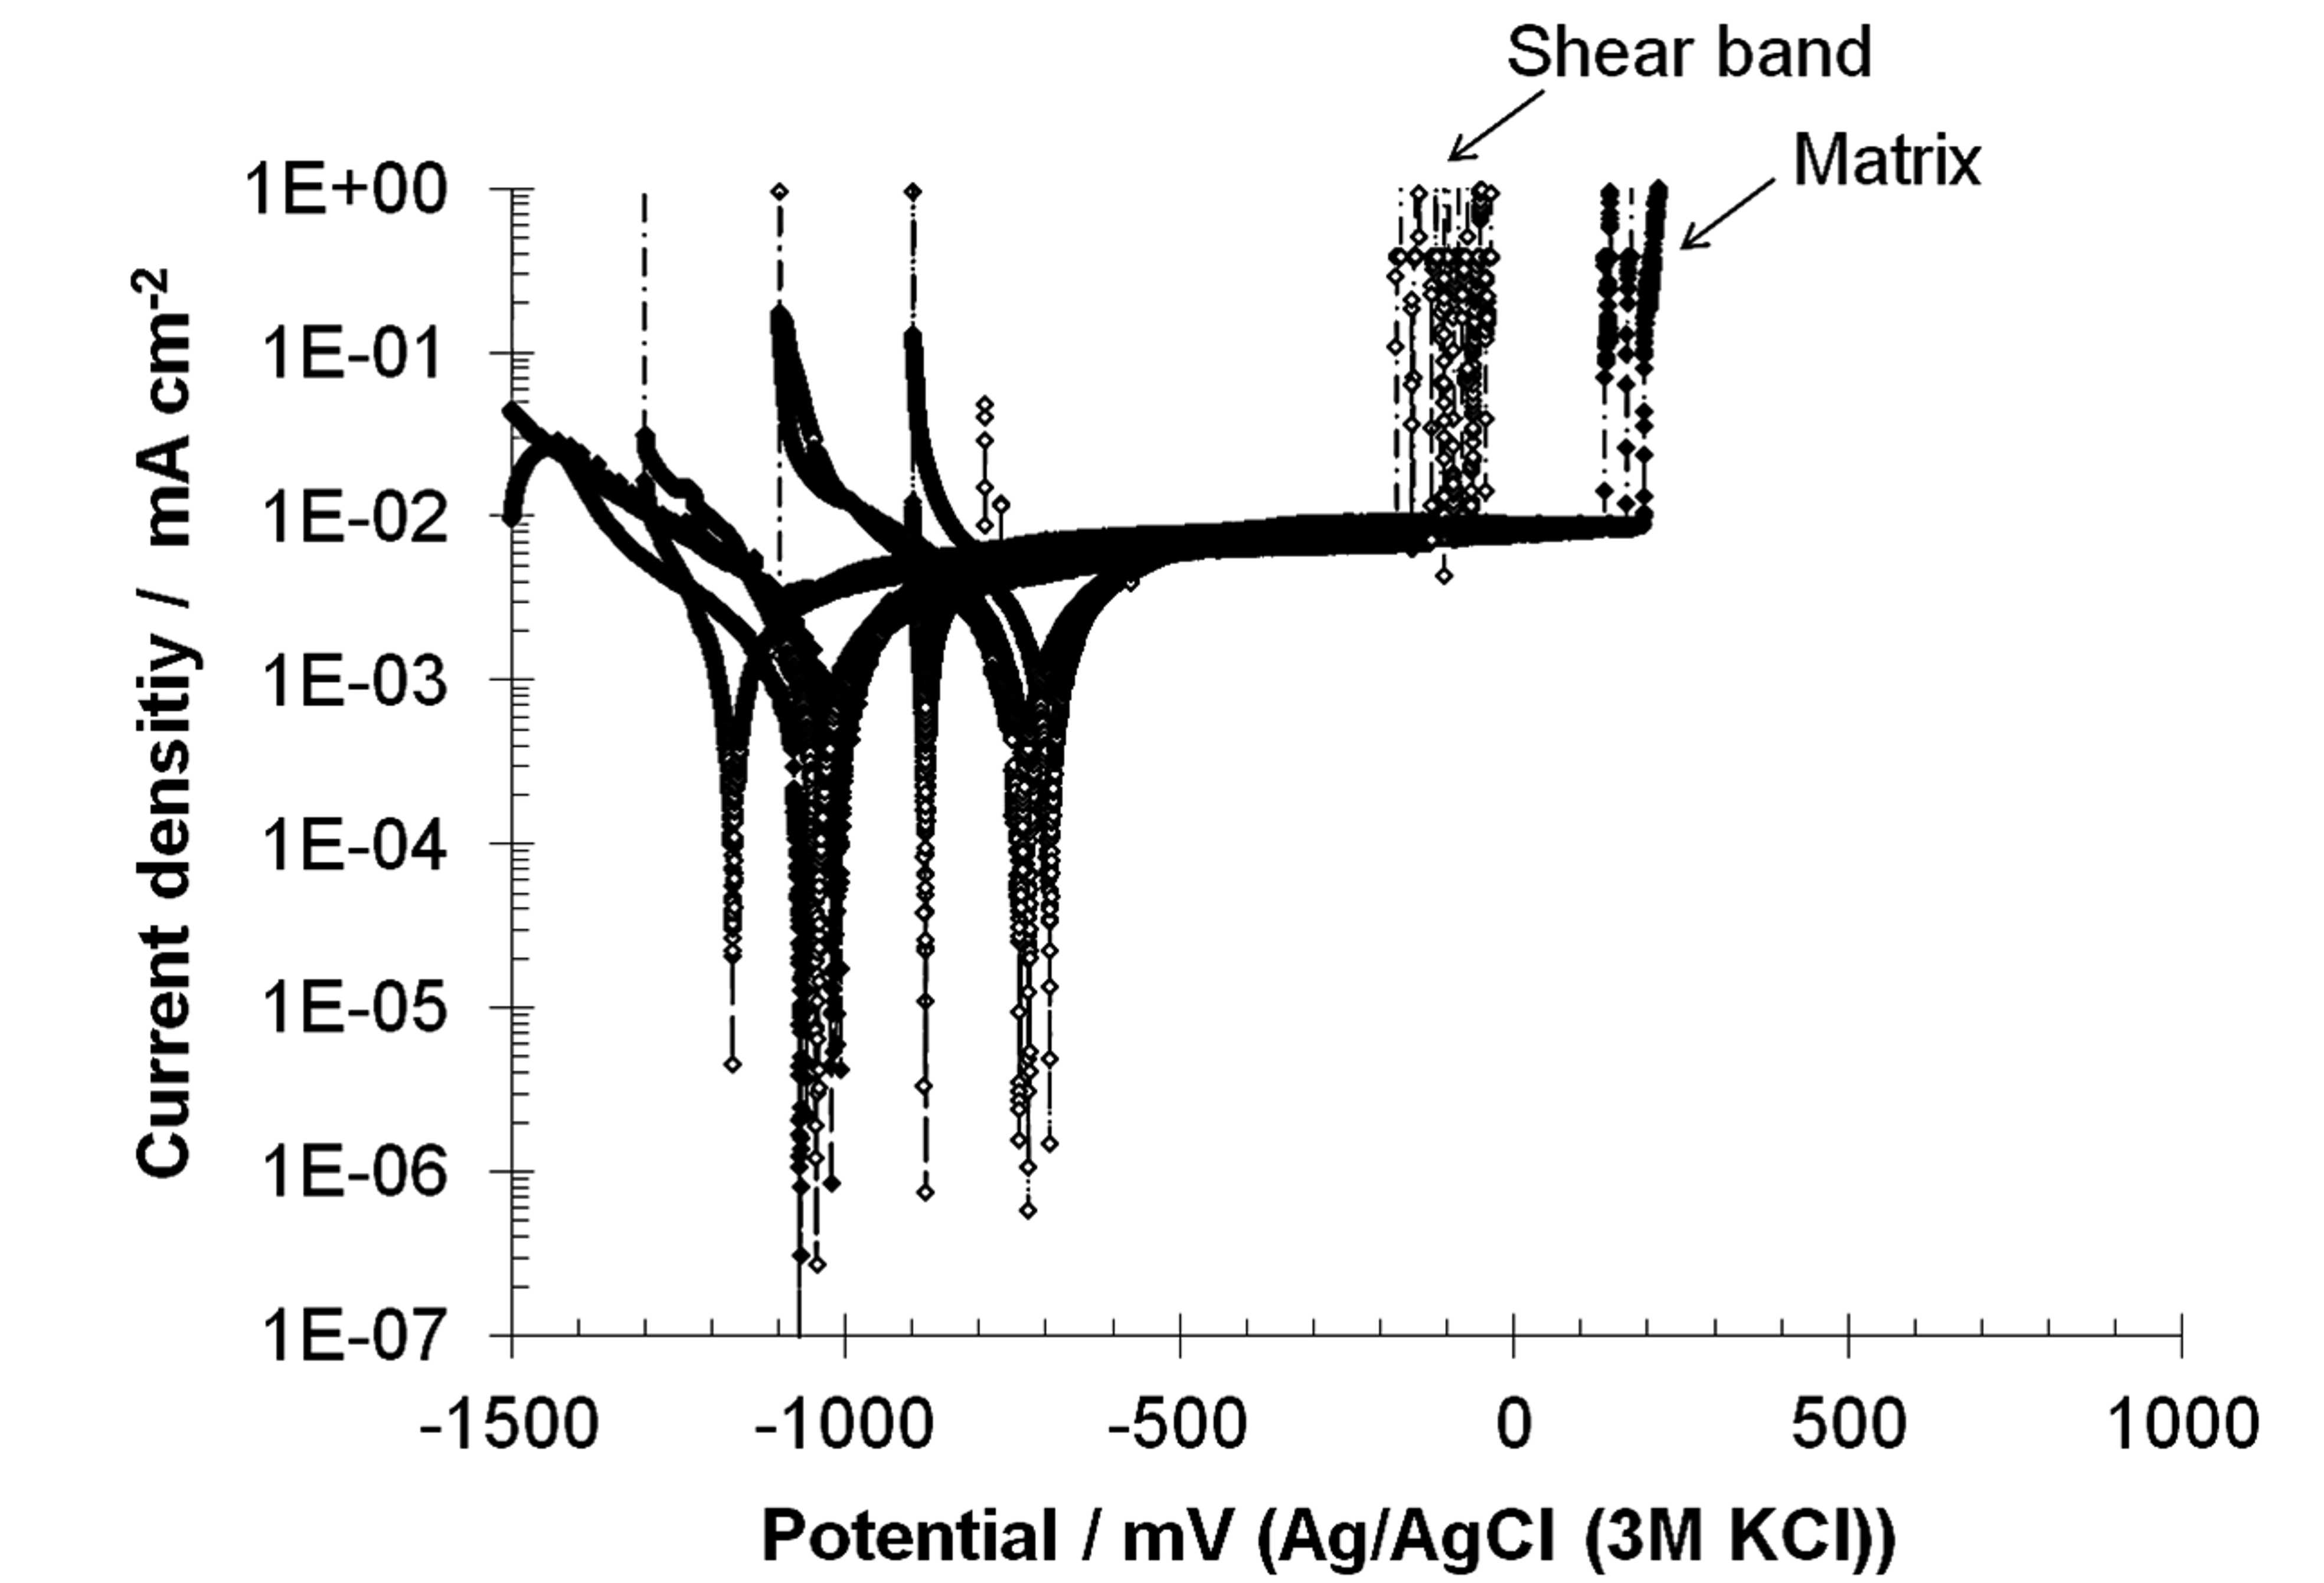
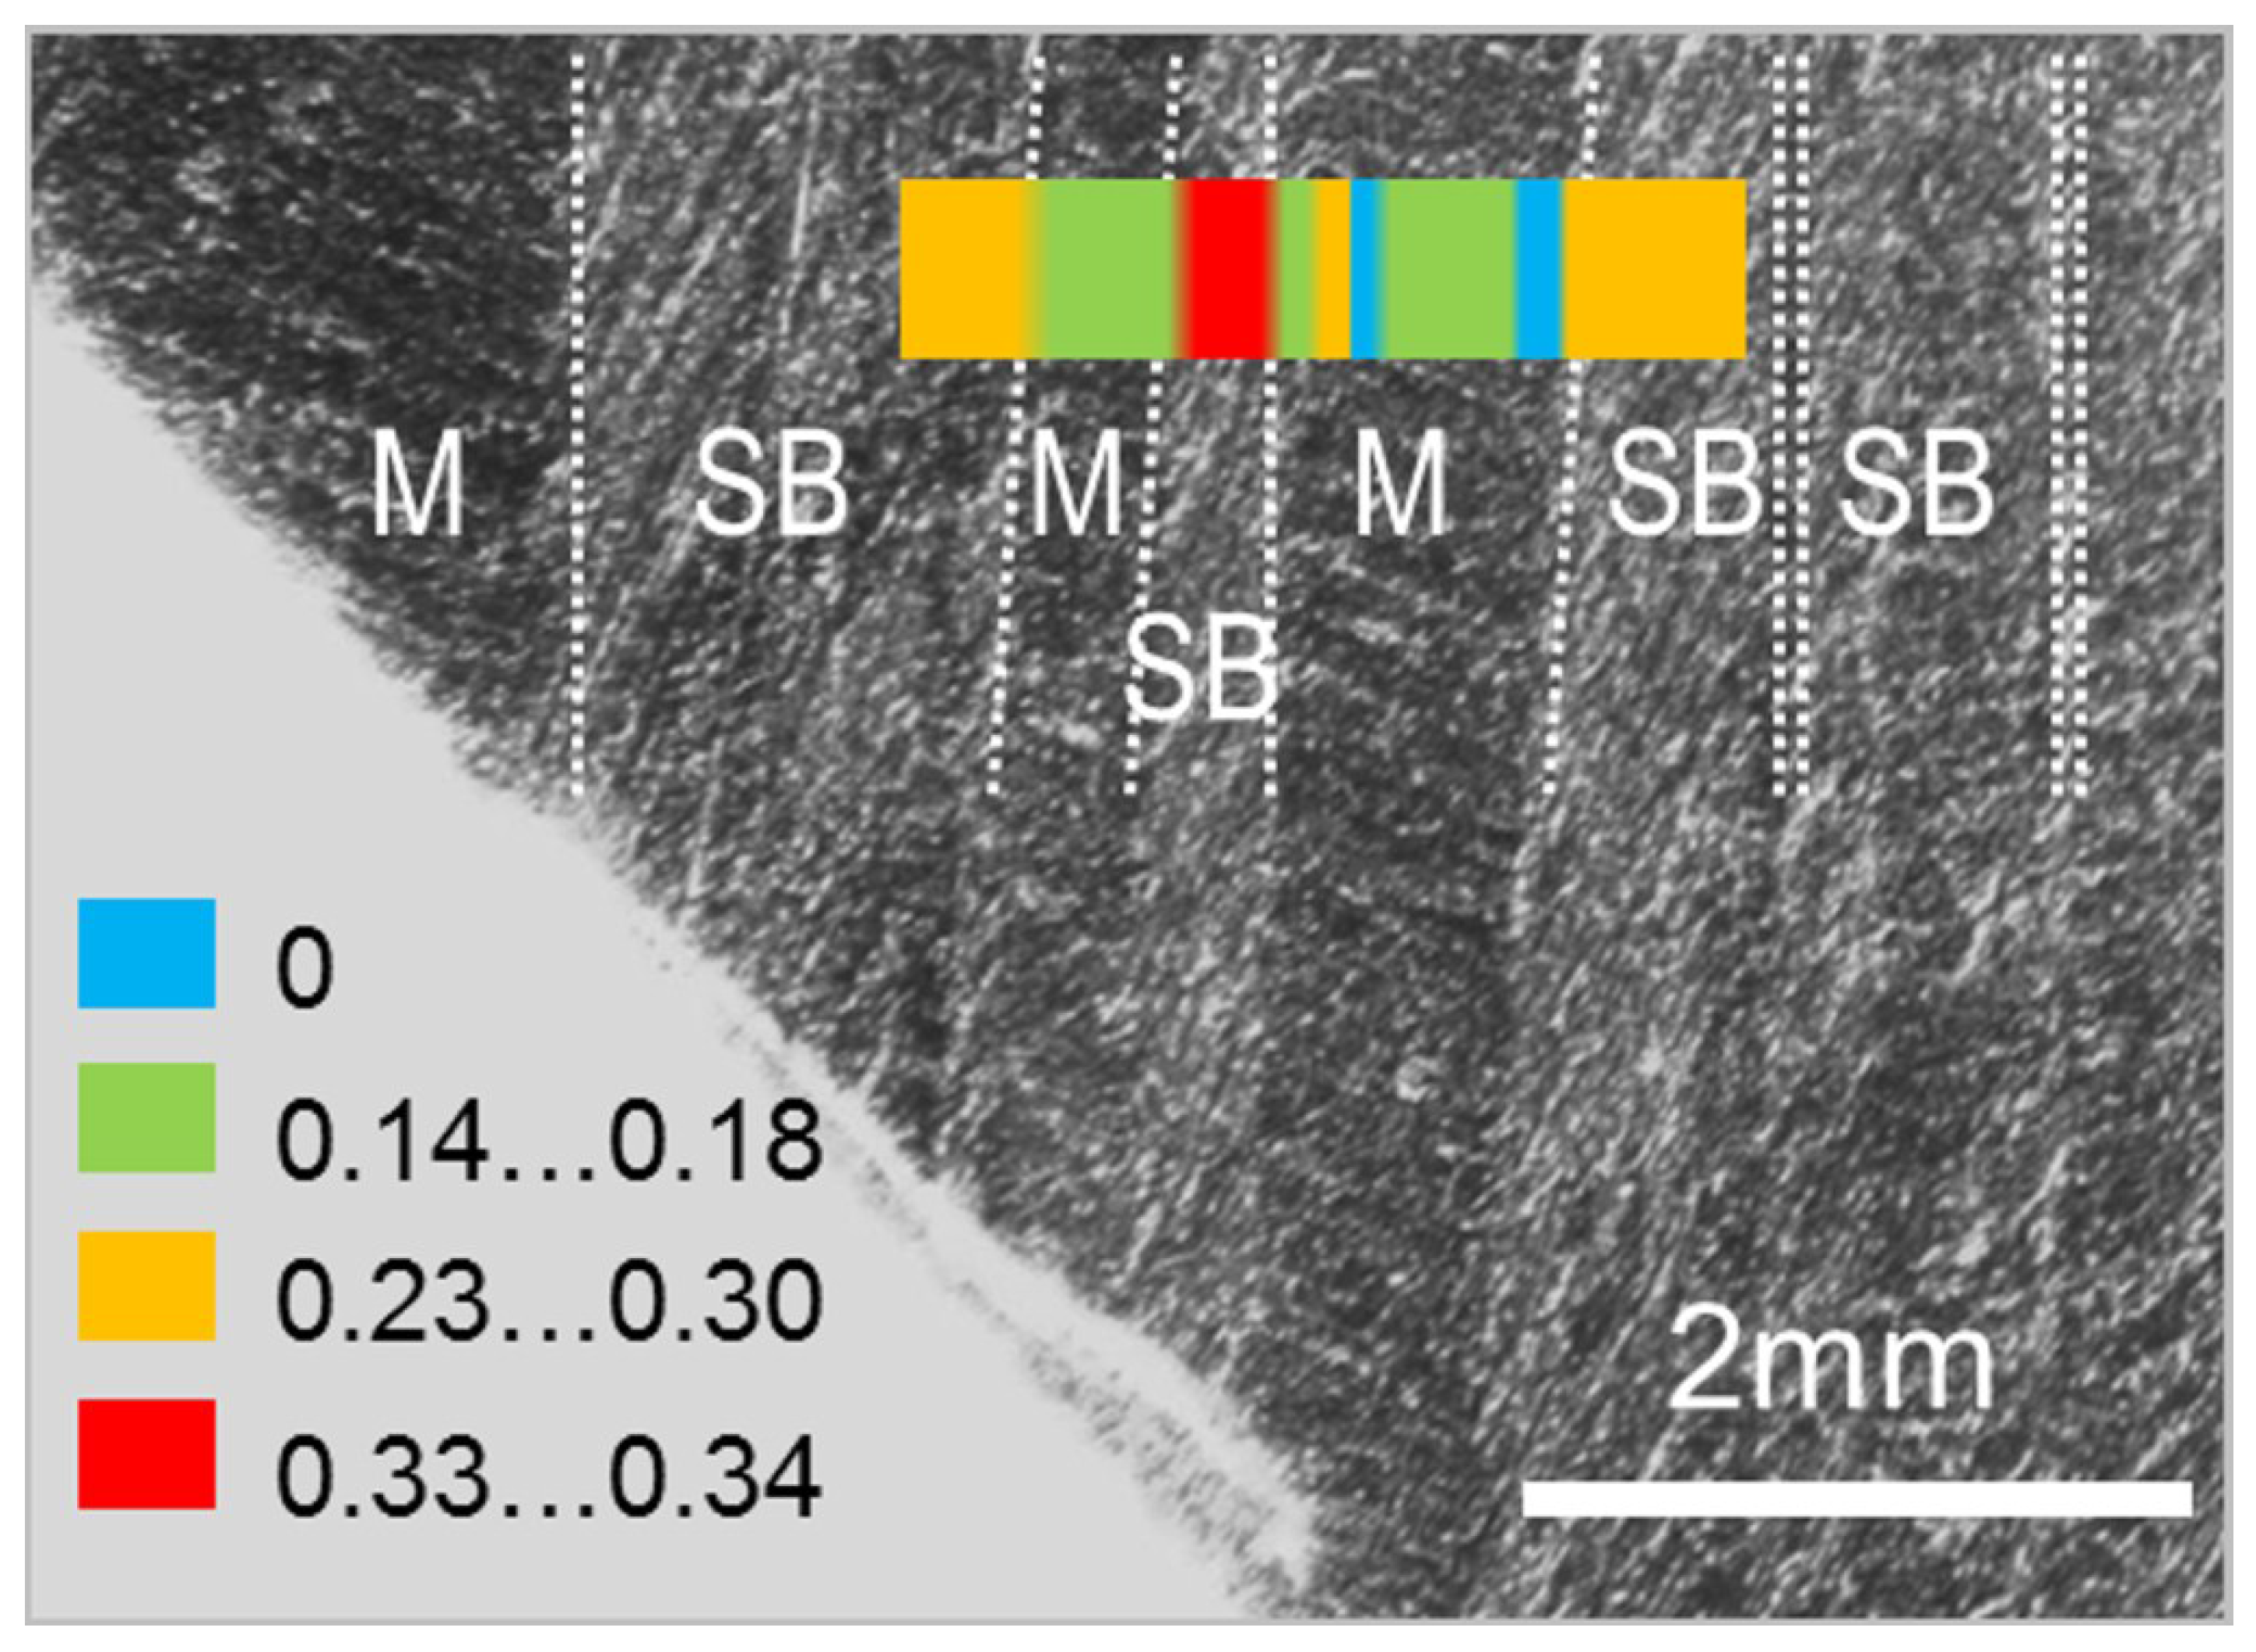
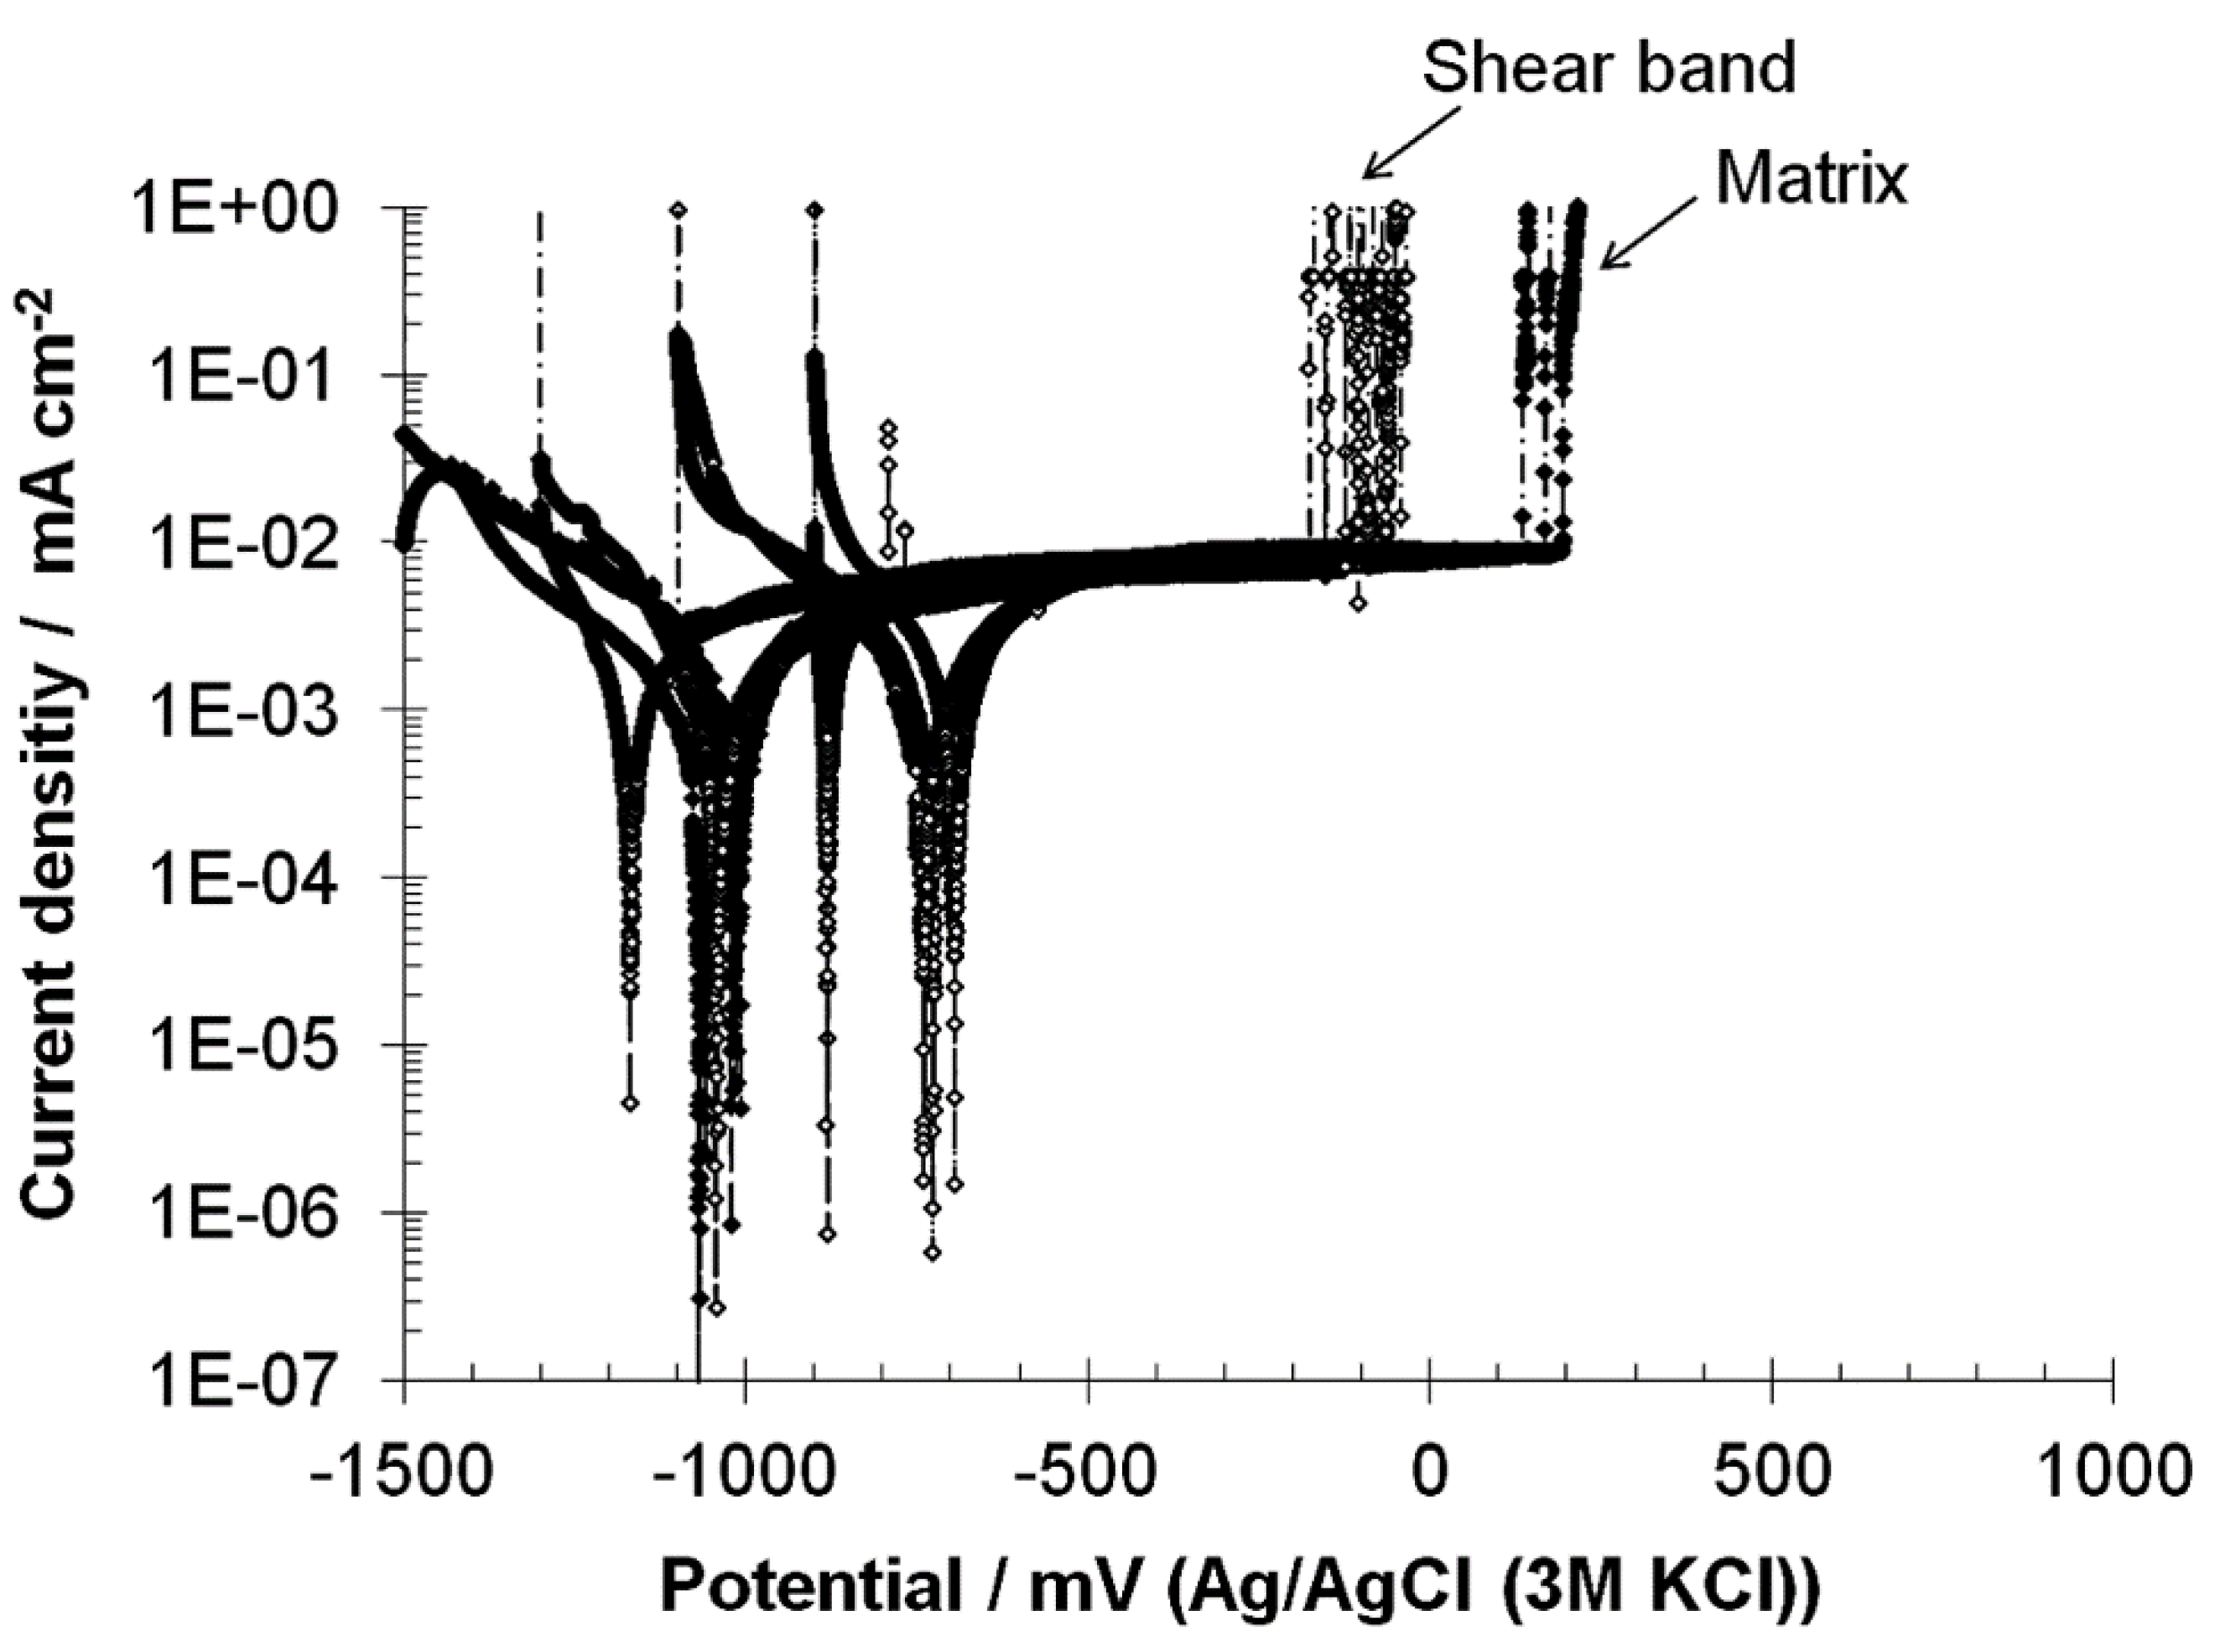
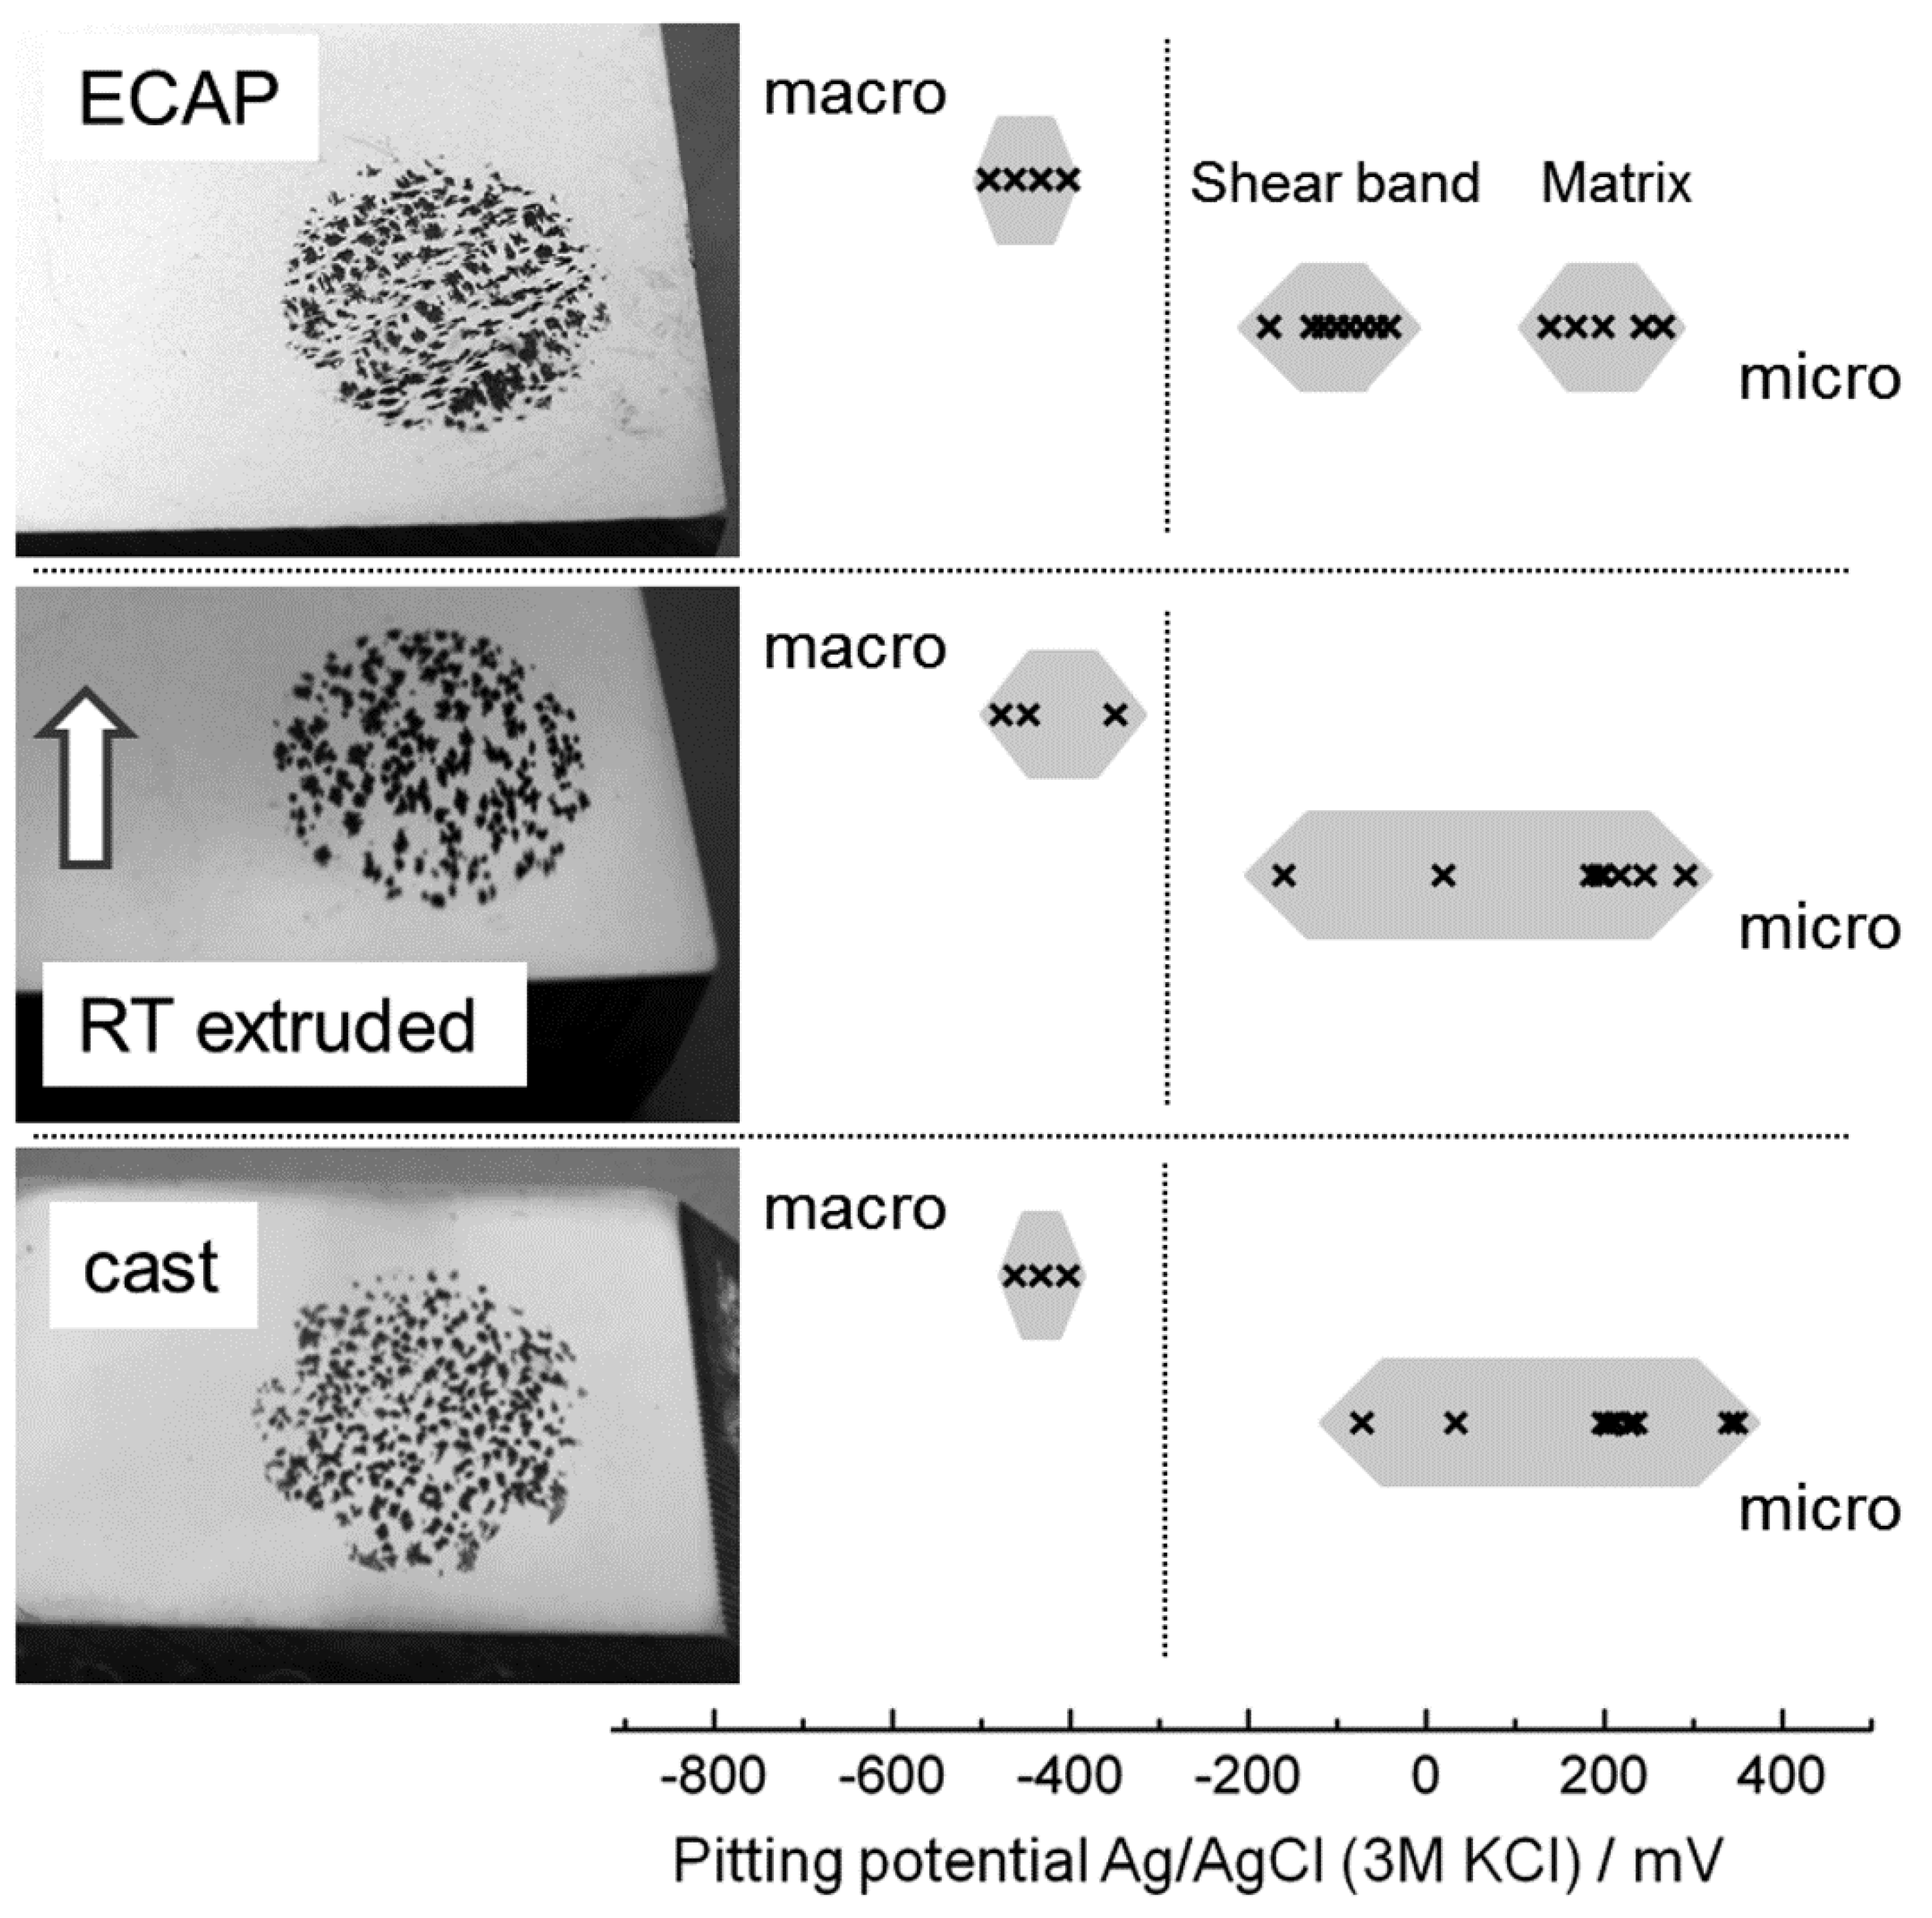
3.2. Pitting Corrosion Potential Derived from Macro- and Micro-Electrochemical Tests
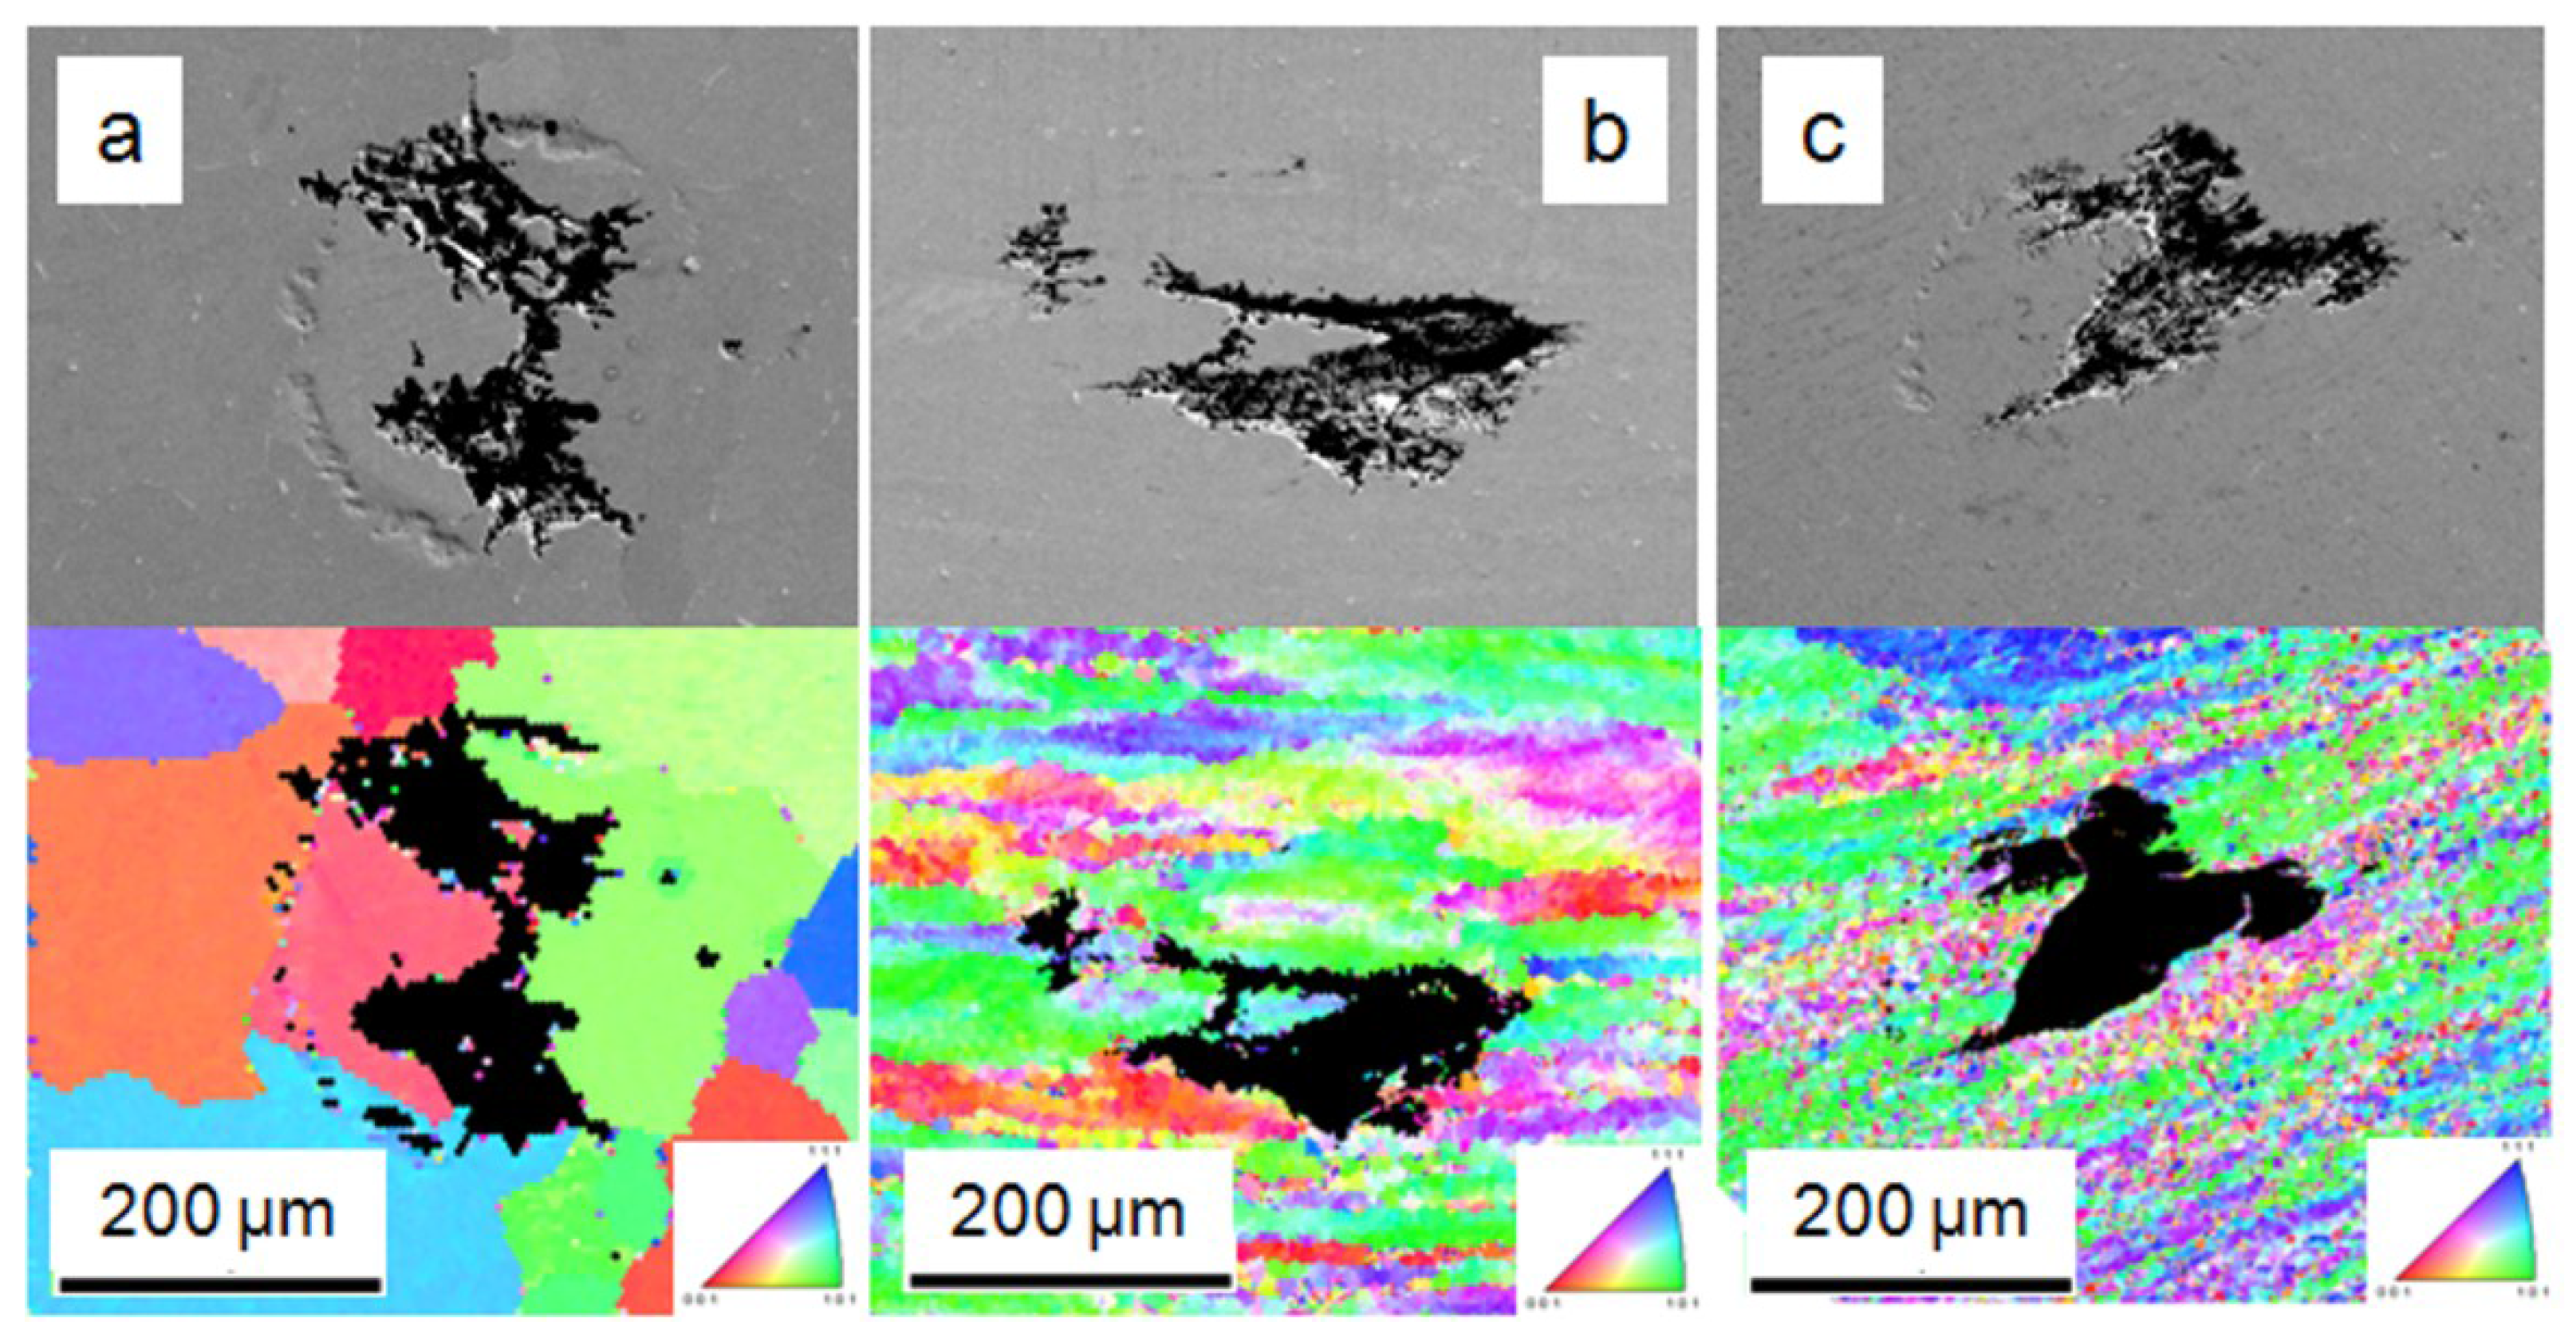
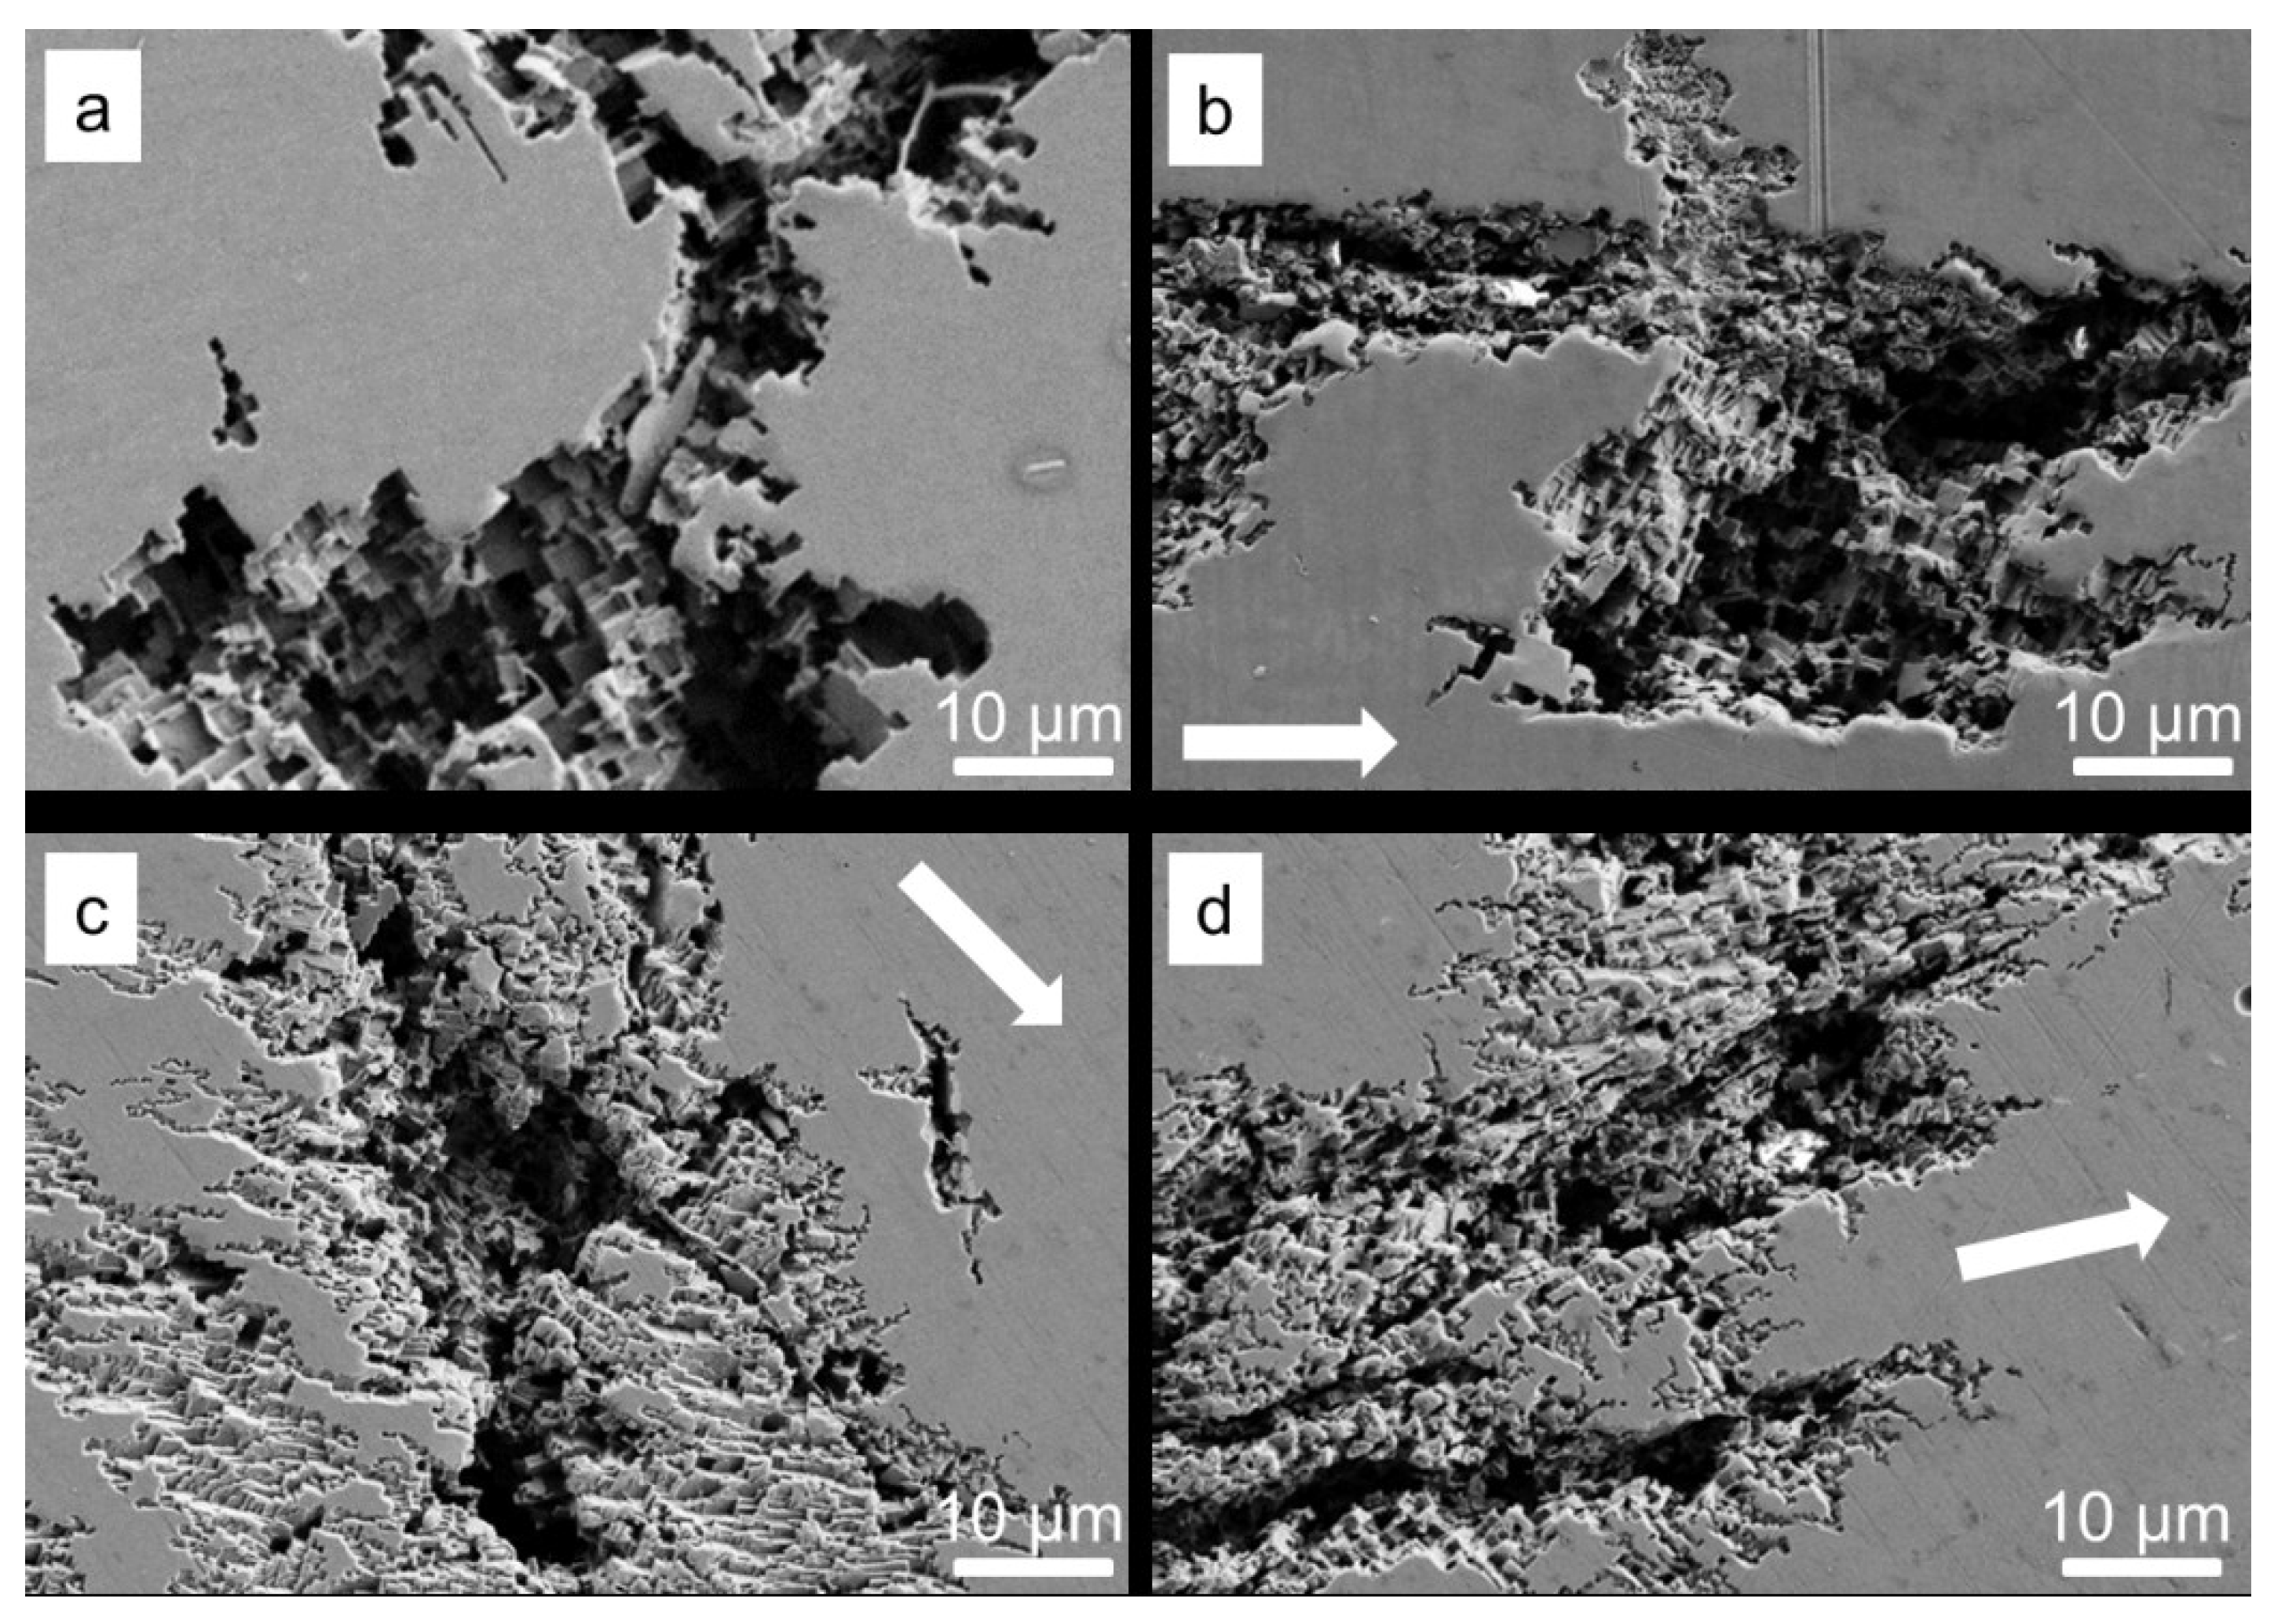
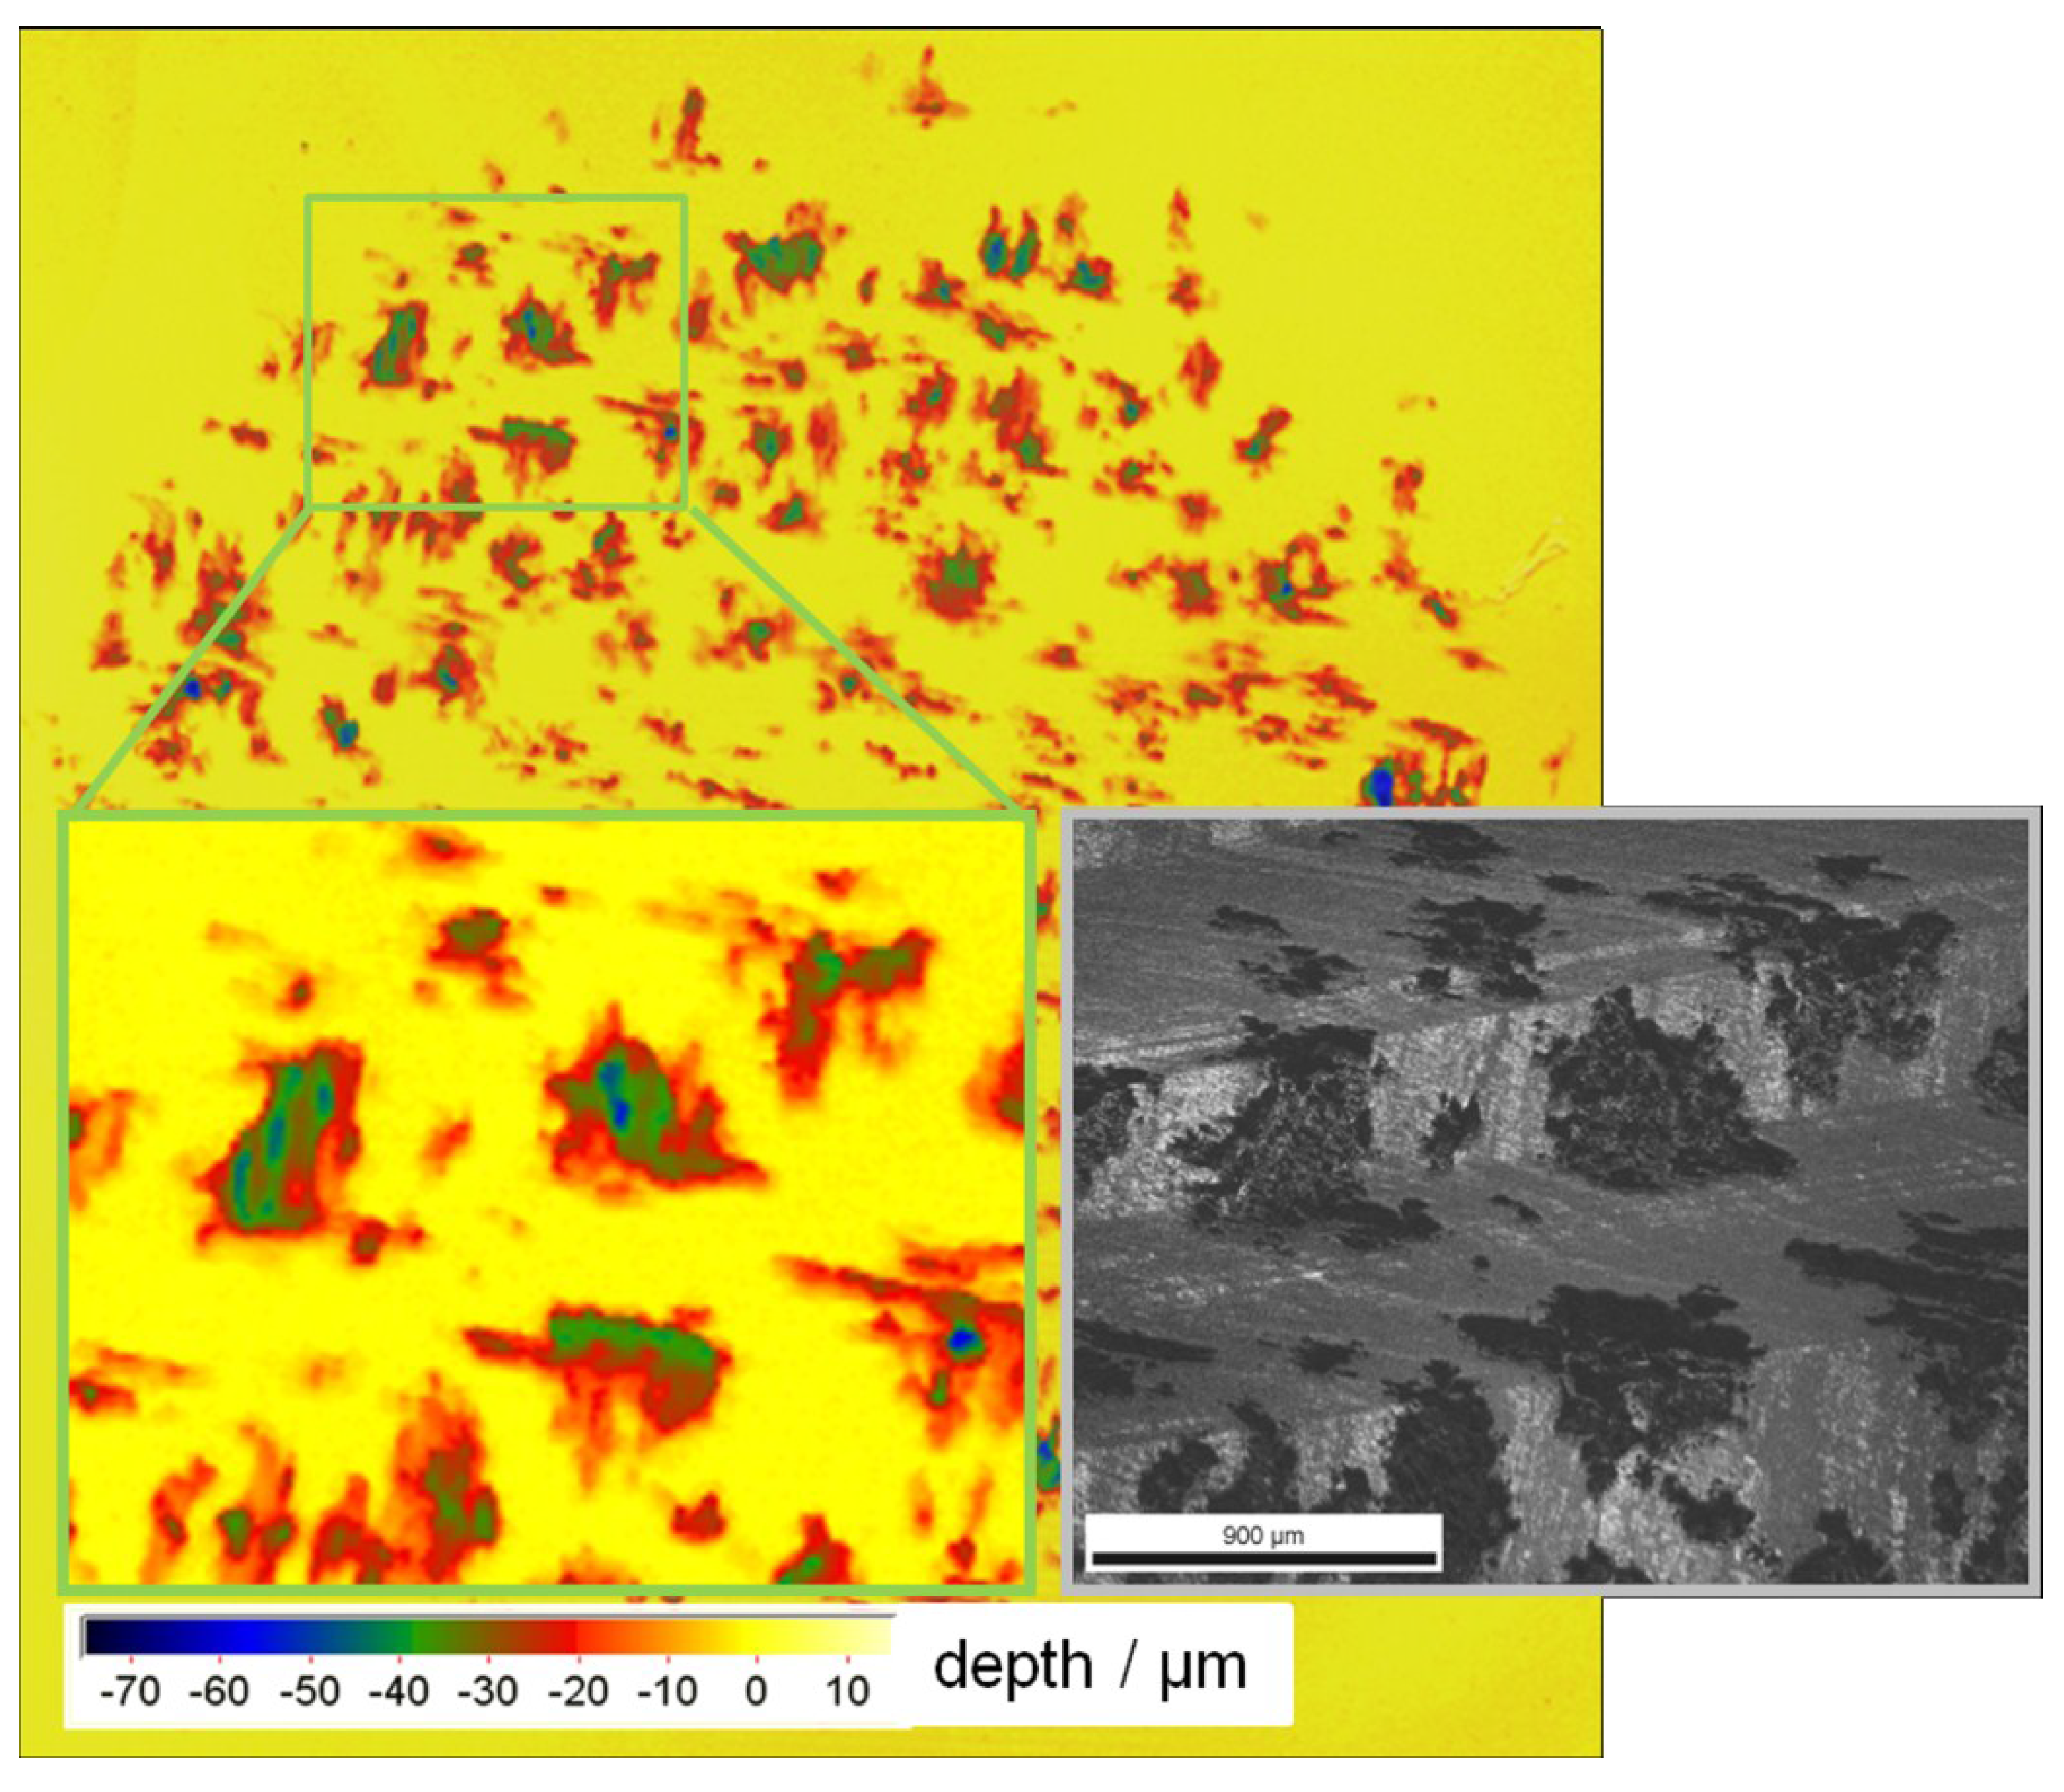
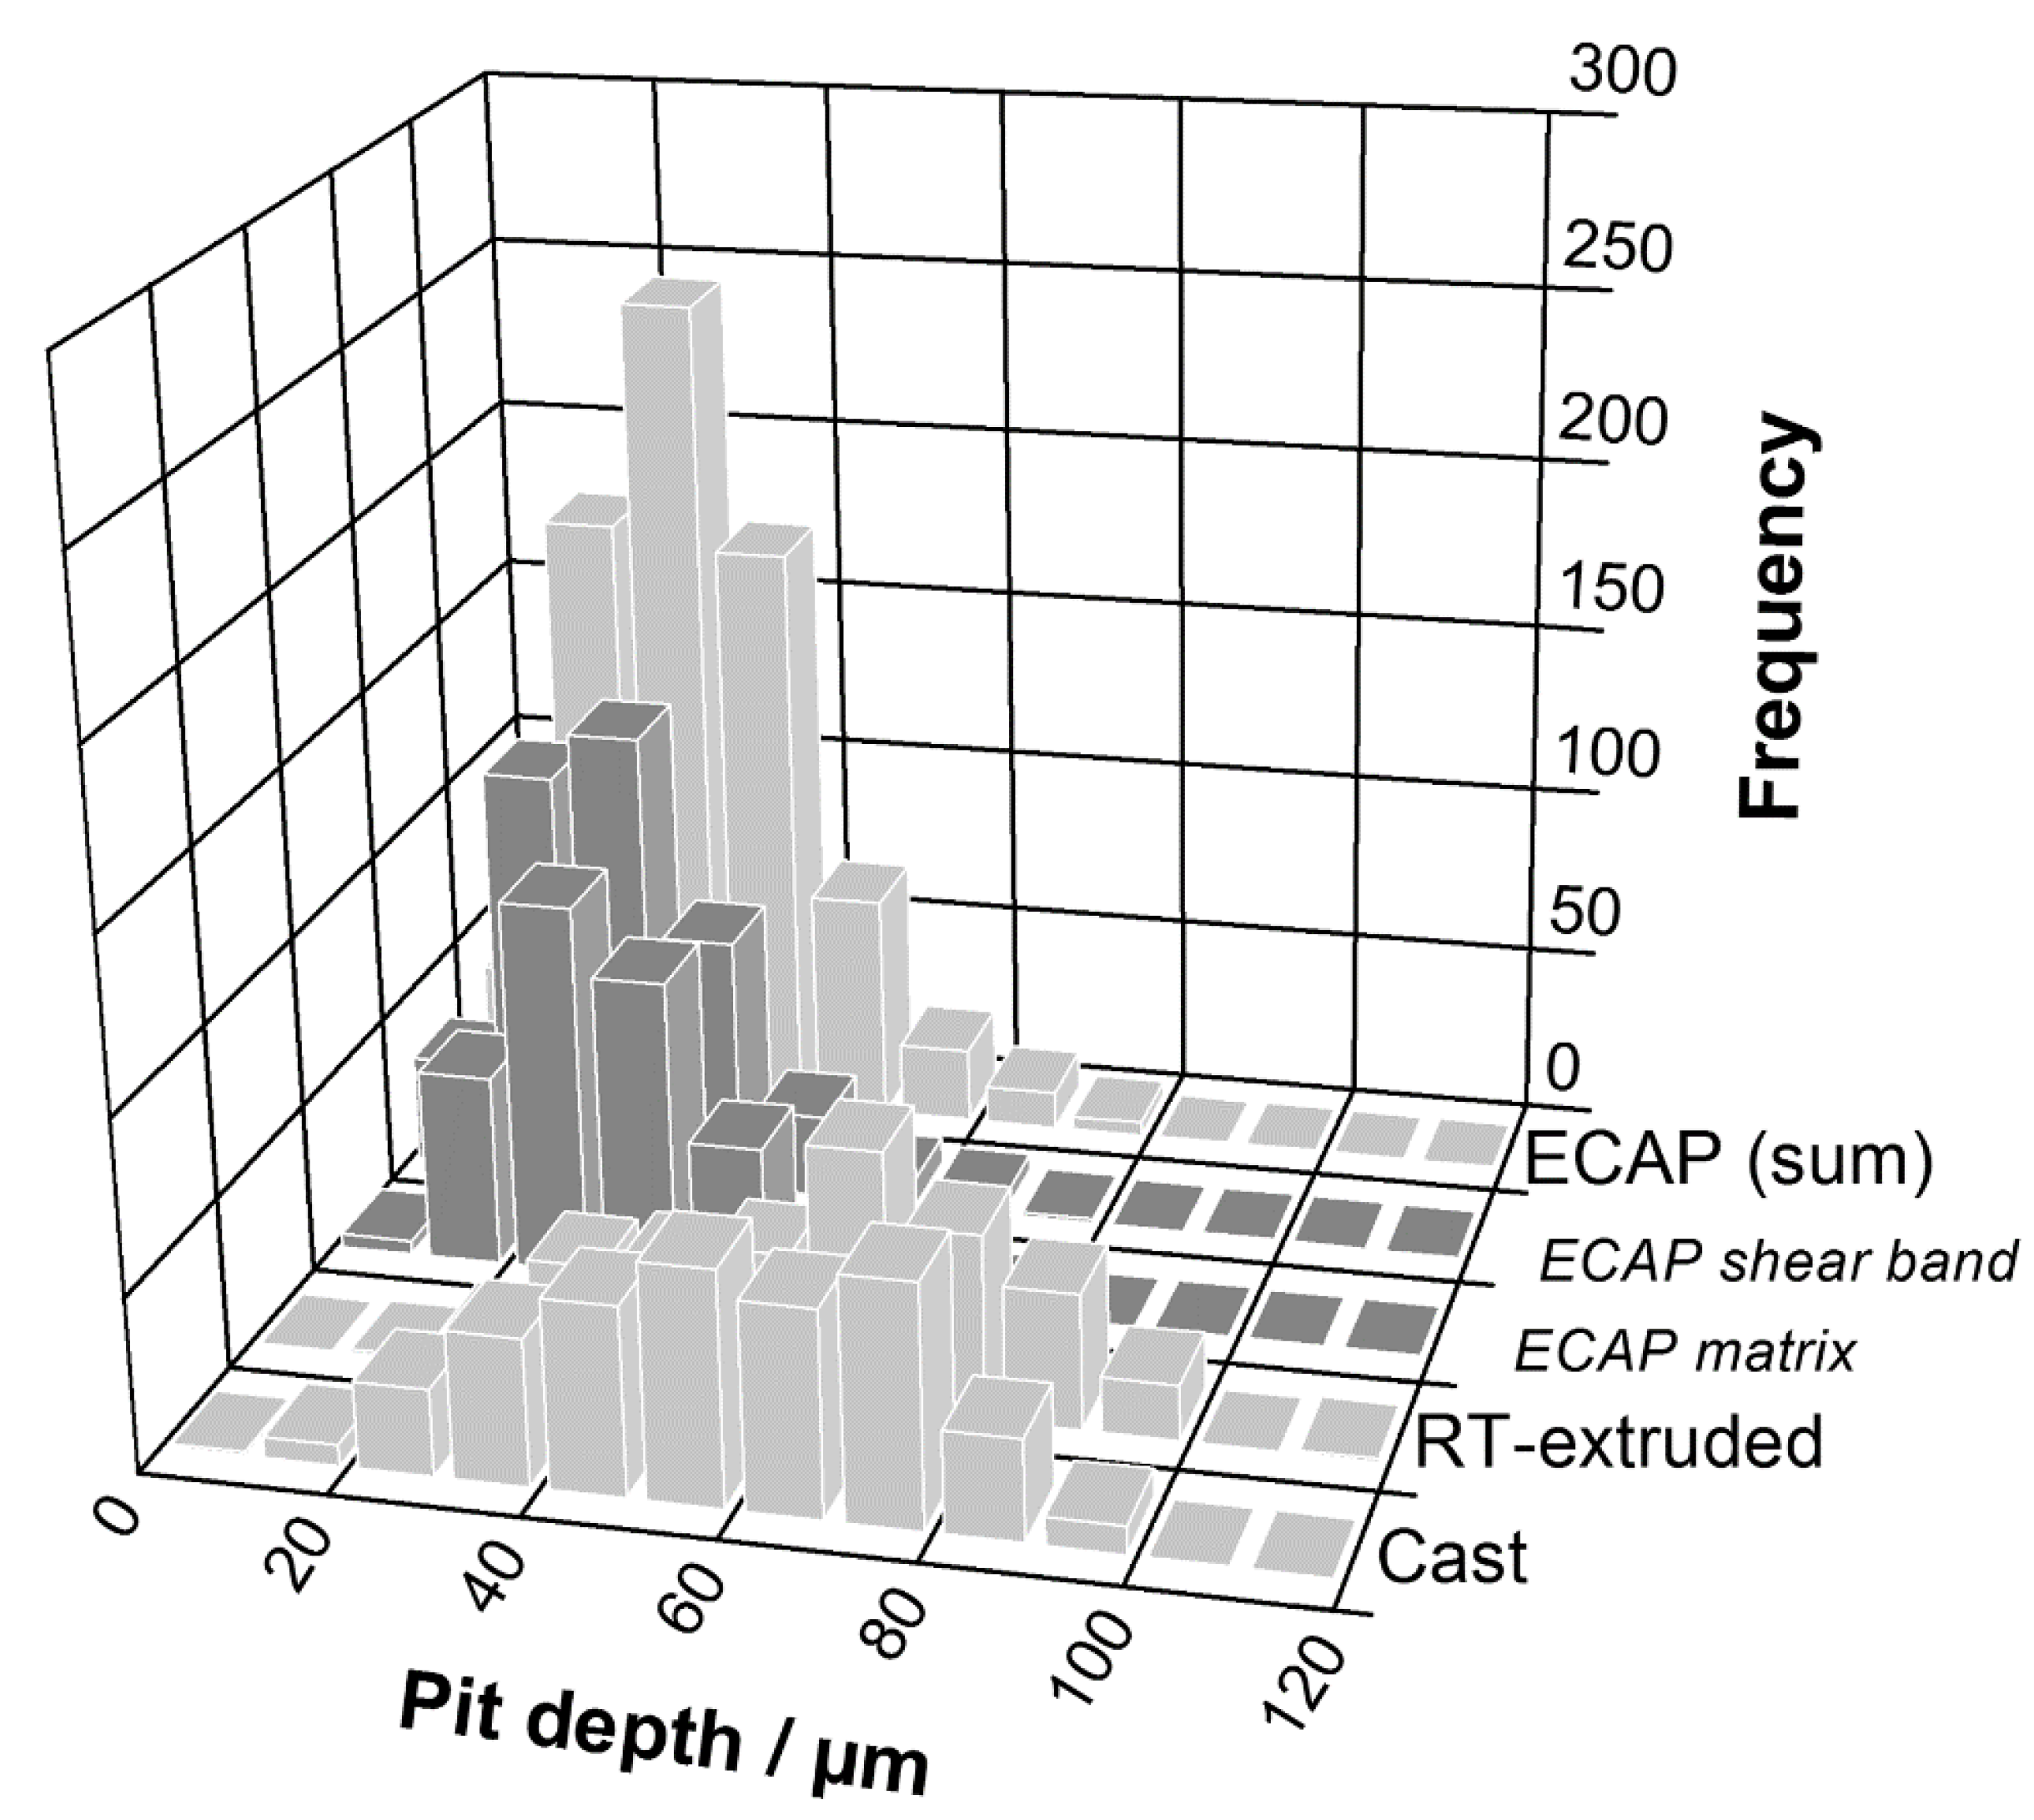
Pitting corrosion is the most common corrosion type for aluminum alloys. The local destruction of the passivation film is caused by anions, e.g., chloride ions. Potentiodynamic polarization curves were measured to evaluate pitting susceptibility. The most negative potential above which pits nucleate and grow (pitting potential) was determined as the decisive corrosion characteristic. Figure 4 gives an example for the curves measured on the material in ECAP condition. A grouping of the pitting potentials depending on the position of the micro-capillary either on the shear bands or on the matrix is observed.
Figure 4. Potentiodynamic polarization curves measured on the shear bands and the matrix.
Metals 05 00172 g004
Pitting potentials and the corresponding corrosion appearance are shown in relation to the material condition and to the exposed area of 10 mm (macro-scale) and 200 µm (micro-scale) in diameter in Figure 5. The pitting potentials determined by macro-scale electrochemical measurements are very similar regardless of the material condition (Figure 5). Averaged out −430 mV referring to Ag/AgCl (3 M KCl), a variation of ±30 mV for the cast condition, of ±90 mV for the RT-extruded condition and of ±40 mV for the ECAP condition is ascertained. This is in agreement with the results of [8] and [17], which stated that the pitting potential of low purity aluminum does not vary with grain size or with the size of the Al8Fe2Si phase. The macro-scale pitting potentials are shifted to at least 700 mV lower values compared to micro-scale pitting potentials. This potential shift was already evidenced for a 2024 alloy in T3 temper state [33] and for Al-Zn-Mg-Cu alloys [34]. Evidently, this is because of the number of pit initiating constituent particles present in the testing area. More constituent particles exist in the area exposed in macro-scale experiments compared to the lower number in the area exposed in micro-scale experiments. For the same reason, the pitting potentials of the micro-scale measurements are spread over a wider potential range, also mentioned in [27].
Micro-scale experiments result in pitting potentials from −80 mV to +340 mV for the cast condition, more negative potentials from −160 mV to +300 mV for the RT extrusion condition and similarly from −180 mV to +270 mV for the ECAP condition. The scatter of the pitting potentials observed for all material conditions is suspected to be mainly the effect of various surface fractions of second phases in the exposed area according to Birbilis et al. [27]. Furthermore, the micro-scale experiments show a clear grouping of the higher pitting potentials related to the matrix (between +100 mV and +270 mV) and lower pitting potentials related to the shear bands (between −180 mV and +50 mV), whereas no influence of material conditions can be seen in the macro-scale experiments. Thus, micro-scale experiments allow for the differentiation of the pitting potentials in ECAP induced deformation localizations. The selected shear bands exceed a width of 600 µm thus providing a test region surely larger than the used opening of the micro-capillary (200 µm in diameter). Compared to the matrix, the significantly lower pitting potential in the shear band indicates more weak points with respect to corrosion in this region.
Figure 5. Documentation of the corrosion appearance after macro-scale potentiodynamic polarization of the ECAP condition, the extruded condition (extrusion direction marked by arrow) and the cast condition showing the modification from uniform to oriented (left from top to bottom) with corresponding pitting potentials in 0.1 M NaCl determined by macro-scale tests (middle) and micro-scale tests (right) at 1 mA cm−2.
Metals 05 00172 g005

3.3. Pit Morphology

In Figure 6a–c, the secondary electron images (top) and the corresponding orientation maps derived from EBSD (below) show typical examples of the corrosion appearance as a consequence of different processing history. Pitting seems to start as well as to be terminated at the precipitation decorated grain boundaries thus evolving different corrosion appearance with respect to the grain shape.
The dominant feature of the alloy microstructure along with the modification of grain size and grain shape is the distribution and fragmentation of second-phase intermetallic particles (constituent particles) with respect to electrochemical characteristics. The constituent particles in an AlMgSi alloy are electrochemically nobler compared to the surrounding aluminum solid solution [16,17,27]. Due to the galvanic coupling between the AlSiFe phases and the surrounding Al matrix in the Cl-containing test environment, the naturally occurring passivation layer will be reduced and the surrounding aluminum dissolved. Starting at the precipitations mostly localized at the grain boundaries, the corrosion paths regularly start at the grain boundaries, spread into the grain and are terminated at the opposite grain boundary when the constituent particles are undermined and lose electrical contact. The large equiaxed grains of the cast condition are mirrored by a similar corrosion appearance. Similarly, the aligned and elongated grains of the material in the RT extrusion and ECAP condition are associated with an aligned and elongated corrosion appearance. The fragmentation of constituent particles by ECAP processing provides numerous starting sites for corrosion, but also faster removal of the smaller particles by undermining the surrounding aluminum. Thus, the propagation of the corrosion attack in vertical direction is decreased.
Figure 6. Corrosion appearance after micro-scale potentiodynamic polarization of the (a) cast condition; (b) extruded condition (extrusion direction is horizontal) and (c) in a shear band of the ECAP condition.
Metals 05 00172 g006
The pitting appearance produced during macro-scale testing shows a striking correlation to the microstructure developed by the processing history (Figure 5). The uniform corrosion in the cast condition is transformed to a non-uniform appearance corresponding to the directed and elongated grains after extrusion and ECAP. This behavior is accompanied by an obviously shallower corrosion attack in the ECAP condition which will be quantitatively evaluated and discussed later on. Crystallographic pitting is evidenced regardless of the material condition but with a remarkable influence on the size of the individual {100} facetted pits. Large crystallographic pits around 1 µm in length of the edge can be seen in the cast condition (Figure 7a), around half as long are the edges of crystallographic pits in the in RT-extruded condition (Figure 7b) and even more reduced in the ECAP condition (Figure 7c,d). Particularly noteworthy is the fact that the reduced size of individual crystallographic pits in the matrix zones in the ECAP condition is more similar to those in the shear bands. This was unexpected, since the mean grain size and the primary precipitate size are fairly equal in the RT-extruded condition and in the matrix of the single pass ECAP condition.
ECAP processing enhances the fraction of low- and high-angle grain boundaries, the dislocation density and the fragmentation of strengthening precipitates of the studied aluminum alloy [23,32]. A bimodal grain size distribution and an increased dislocation density appear already after one ECAP pass in both matrix and shear bands [32]. The dislocations accumulate to a complex network of deformation induced cell boundaries [23]. A schematic representation of the cell distribution and corresponding STEM images are shown in Figure 8 (adopted from [23]). The size of the cells as the smallest elements which subdivide grains is evaluated by XRD in this work and ranges between 80 nm and 180 nm.
Figure 7. Formation of crystallographic {100} facetted pits due to micro-scale potentiodynamic polarization in the (a) cast condition; (b) in the extruded condition (extrusion direction and grain alignment marked by arrow); (c) in ECAP condition in the matrix and (d) in a shear band (deformation direction marked by arrows).
Metals 05 00172 g007
Apart from the decreasing pitting potential in shear bands, we observe a significant reduction of the single crystallographic pit size in both the matrix and shear bands in the ECAP condition. This observation correlates with the reduced dimensions of the cells evaluated by XRD and STEM. We conclude that the cell size and the microstrains are the distinguishing features to control the pit growth in the ECAP condition.
The reduced corrosion depth after ECAP was already indicated by several authors [11,12,13,14,15,17]. Contrary results were reported for Al-Ni and Al-Cu alloys containing other second phases [6]. In an Al-Mg model alloy [7], more localized and deeper pits were found in the UFG condition. Furthermore, the pitting potential evidenced influence of the number of ECAP passes. However, tests after one ECAP pass were not considered.
Figure 8. Schematic representation of the deformation microstructure and grain subdivision at different strains (large/small) and corresponding STEM-micrographs of the investigated aluminum alloy [23].
Metals 05 00172 g008
Jilani et al. [17] qualitatively discussed the change in the corrosion appearance from a low density of deep pits to a high density of less deep pits with an increasing ECAP pass number. This is in agreement with our observation. At first sight, the removal of material in the ECAP condition seems to be more concentrated in the regions without deformation localizations. The simple comparison of corrosion areas leads to this conclusion, but the volume of the eroded material has to be considered. To substantiate our findings by quantifying the material removal, several metrological characteristics were determined using a 3D optical profilometer. A depth mapping of the complete area exposed to macro-scale testing after ECAP is shown in Figure 9 with a magnified detail in the inset. Pit depths between 5 µm (red) and 75 µm (blue) were recorded and are shown by a color code. The contiguous EBSD pattern quality map corresponds to the position of the detailed depth map and illustrates the deformation localizations by darker gray tones (the corroded areas are shown in black). Several metric features were analyzed to reveal differences in the matrix and shear bands and to compare the other material conditions: the fraction of the corroded area, the corroded volume, the average corrosion depth, the maximal pit depth, the average pit depth and the density of pits (Table 3). The average corrosion damage refers to a uniform removal of the material across the tested area. The average pit depth refers to the total corroded volume divided by the total corroded area. The pit density is related to the total area used for macro-scale testing.
Figure 9. Depth mapping of pitting corrosion after macro-scale potentiodynamic polarization of the ECAP material (depth scale color-coded); the left inset shows the details; the right inset shows the corresponding EBSD pattern quality map indicating deformation localization (position of the insets is marked by the box in the overview map).
Metals 05 00172 g009
Table 3. Characteristics of the corrosion appearance for the studied conditions after macro-scale potentiodynamic polarization (Ø 10 mm).
StateCorroded area fraction (%)Corroded volume (mm³)Average corrosion depth (µm)Maximal pit depth (µm)Average pit depth (µm)Density of pits (pits/mm²)
cast340.577.310019.64.6
RT-extruded370.759.612028.13.9
ECAP
sum380.435.17513.58.7
matrix450.246.07513.38.0
shear band320.194.47513.69.3
The fraction of the corroded surface area of the cast condition is about 10% smaller than that of the RT-extruded and ECAP condition, but the corroded volume follow the order ECAP < cast < RT-extruded. The same applies to the average corrosion depth, the maximal pit depth and the average pit depth. Hence, the corrosion of the RT-extruded condition is the most local one of the considered conditions and thus most susceptible to corrosion damage. In contrast, the material in the ECAP condition corrodes in a more uniform way with remarkably lower maximal and average pit depths compared to the other conditions. The pit densities verify the statement of the more uniform corrosion of material in the ECAP condition. Vice versa, lower pit densities in association with enhanced corroded volumes for the cast and the RT-extruded conditions correspond to more local corrosion.
Figure 10. Frequency distribution of pit depths for different material conditions, additionally matrix and shear band are considered separately.
Metals 05 00172 g010
In order to substantiate the result, pit depth frequencies are shown for the cast, RT-extruded and ECAP condition with a detailed breakdown of the matrix and shear band (Figure 10). The pit depths are grouped in 10 µm bins. A fairly similar broad distribution of pit depths between 10 µm and 100 µm was found for the cast and the RT-extruded conditions. The maximum of the frequency distribution is about 65 µm. A tendency to lower pit depths in the cast condition can be noticed. The ECAP condition shows a strikingly enhanced number of pits. More than twice as many pits are evidenced in the material after one ECAP pass, but the depth distribution is quite sharp with its maximum being only about 30 µm. In order to differentiate the corrosion attack between the shear bands and the matrix, distinct frequency distributions of pit depths are shown (Figure 10). A slightly higher number of pits in the shear band contribute to the total pit frequency distribution. However, the pit depths in the shear band tend to be lower compared to the matrix which is attributable to the fragmentation and re-distribution of the constituent particles and moreover, to the enhanced microstrains in the shear bands. Thus, offering additional sites for the pit initiation and growth, pitting corrosion results in a uniform attack and prevents local deep damage.

4. Conclusions

With the focus on deformation localizations, our study demonstrates the effect of extrusion and ECAP on pit initiation and pit growth in an aluminum alloy EN AW-6060. The refined microstructure together with a heterogeneous distribution of microstrains and an increased dislocation density are the controlling microstructural features.
The influence of deformation localizations on pit initiation is proven by local electrochemical measurements restricted to single shear bands of the alloy in the single pass ECAP condition. Deformation localizations show an enhanced pitting susceptibility in relation to the cast and extruded condition. There was a strong indication that the enhanced pitting susceptibility is related to local microstrains.
However, easier pit initiation is associated with more homogeneous and shallow pit propagation in the AlMgSi0.5 alloy after a single ECAP pass. Regardless of the material condition, dissolution of complete grains was observed starting and stopping at primary precipitates predominantly located at the grain boundaries. The origin of corrosion is the cathodic behavior of the primary precipitates with respect to the AlMgSi0.5 alloy. When the dissolution front approaches the next grain boundary, the decorating precipitates are undermined and the local electrochemical cell disappears. Hence, grain fining and precipitate fragmentation increase pitting density but reduce pitting depth.
The pitting morphology shows characteristic channels formed by {100} facetted crystallographic pits. In contrast to the uniform microstrain in the material in the extruded condition, significant differences in microstrains in the shear bands and the alloy matrix are shown and supposed to be the reason for the particular corrosion appearance. The crystallographic pits appear modified in size with regard to the material condition. The reduced size of the pits in the material in ECAP condition is attributed to the cells as the smallest elements subdividing the grains by accumulation of dislocations (cell boundaries) as a response to the microstrains generated by the single ECAP step. The cell size corresponds with the size of the crystallographic pits.

Acknowledgments

Financial support was granted by the Deutsche Forschungsgemeinschaft (German Research Foundation) via the collaborative research centre “High strength aluminium-based lightweight materials for safety components” (DFG SFB 692) as well as via the project LA 1274/27-1. The technical assistance of A. Schulze, E. Benedix, C. Gläser, K. Muhr, G. Röllig, and A. Rauscher is gratefully acknowledged.

Author Contributions

D.N. is the primary author of the paper, and performed analysis of the experimental data. D.D., T.M., P.F. and D.S. contributed to the experimental research work (SEM and EBSD, XRD, electrochemical measurements and analysis). T.L. supervised the work and discussed the results and analysis with the other authors.

Conflicts of Interest

The authors declare no conflict of interest.

References

  1. Segal, V.M. Equal channel angular extrusion: from macromechanics to structure formation. Mater. Sci. Eng. A 1999, 271, 322–333. [Google Scholar] [CrossRef]
  2. Segal, V.M. The Method of Material Preparation for Subsequent Working. Patent of the USSR 1977 No. 575892.
  3. Vinogradov, A.; Mimaki, T.; Hashimoto, S.; Valiev, R. On the corrosion behaviour of ultra-fine grain copper. Scripta Mater. 1999, 41, 319–326. [Google Scholar] [CrossRef]
  4. Valiev, R.Z.; Langdon, T.G. Principles of equal-channel angular pressing as a processing tool for grain refinement. Prog. Mater. Sci. 2006, 51, 881–981. [Google Scholar] [CrossRef]
  5. Hughes, A.E.; Birbilis, N.; Mol, J.M.C.; Garcia, S.J.; Zhou, X.; Thompson, G.E. High Strength Al-Alloys: Microstructure, Corrosion and Principles of Protection. In Recent Trends in Processing and Degradation of Aluminium Alloys; InTech: Rijeka, Croatia, 2011. [Google Scholar]
  6. Akiyama, E.; Zhang, Z.; Watanabe, Y.; Tsuzaki, K. Effects of severe plastic deformation on the corrosion behavior of aluminum alloys. J. Solid State Electrochem. 2009, 13, 277–282. [Google Scholar] [CrossRef]
  7. Brunner, J.G.; May, J.; Höppel, H.W.; Göken, M.; Virtanen, S. Localized corrosion of ultrafine-grained Al–Mg model alloys. Electrochim. Acta 2010, 55, 1966–1970. [Google Scholar] [CrossRef]
  8. Ralston, K.D.; Fabianic, D.; Birbilis, N. Effect of grain size on corrosion of high purity aluminium. Electrochim. Acta 2011, 56, 1729–1736. [Google Scholar] [CrossRef]
  9. Ralston, K.D.; Birbilis, N. Effect of grain size on corrosion: A review. Corrosion 2010. [Google Scholar] [CrossRef]
  10. Ralston, K.D.; Birbilis, N.; Weyand, M.; Hutchinson, C.R. The effect of precipitate size on the yield strength-pitting corrosion correlation in Al-Cu-Mg alloys. Acta Mater. 2010, 58, 5941–5948. [Google Scholar] [CrossRef]
  11. Chung, M.K.; Choi, Y.S.; Kim, J.G.; Kim, Y.M.; Lee, J.C. Effect of the number of ECAP pass time on the electrochemical properties of 1050 Al alloys. Mater. Sci. Eng. A 2004, 366, 282–291. [Google Scholar] [CrossRef]
  12. Son, I.J.; Nakano, H.; Oue, S.; Kobayashi, S.; Fukushima, H.; Horita, Z. Pitting corrosion resistance of ultrafine-grained aluminum processed by severe plastic deformation. Mater. Trans. 2006, 47, 1163–1169. [Google Scholar] [CrossRef]
  13. Hockauf, M.; Meyer, L.W.; Nickel, D.; Alisch, G.; Lampke, T.; Wielage, B.; Krüger, L. Mechanical properties and corrosion behaviour of ultrafine-grained AA6082 produced by equal channel angular pressing. J. Mater. Sci. 2008, 43, 7409–7417. [Google Scholar] [CrossRef]
  14. Wielage, B.; Nickel, D.; Lampke, T.; Alisch, G.; Podlesak, H.; Darwich, S.; Hockauf, M. Corrosion characteristics of an ultrafine-grained Al-Mg-Si alloy (AA6082). Mater. Sci. Forum 2008, 584–586, 988–993. [Google Scholar]
  15. Song, D.; Ma, A.B.; Jiang, J.H.; Lin, P.H.; Yang, D.H. Corrosion behavior of ultra-fine grained industrial pure Al fabricated by ECAP. Trans. Nonferrous Metals Soc. China 2009, 19, 1065–1070. [Google Scholar] [CrossRef]
  16. Korchef, A.; Kahoul, A. Corrosion Behavior of Commercial Aluminum Alloy Processed by Equal Channel Angular Pressing. Inter. J. Corros. 2013. [Google Scholar] [CrossRef]
  17. Jilani, O.; Njah, N.; Ponthiaux, P. Transition from intergranular to pitting corrosion in fine grained aluminum processed by equal channel angular pressing. Corros. Sci. 2014, 87, 259–264. [Google Scholar] [CrossRef]
  18. Naeini, M.F.; Shariat, M.H.; Eizadjou, M. On the chloride induced pitting of ultra fine grains 5052 aluminum alloy produced by accumulative roll bonding process. J. Alloys Compd. 2011, 509, 4696–4700. [Google Scholar] [CrossRef]
  19. Wei, W.; Wei, K.X.; Du, Q.B. Corrosion and tensile behaviors of ultra-fine grained Al–Mn alloy produced by accumulative roll bonding. Mater. Sci. Eng. A 2007, 454, 536–541. [Google Scholar] [CrossRef]
  20. Suter, T.; Peter, T.; Böhni, H. Microelectrochemical investigations of MnS inclusions. Mater. Sci. Forum 1995, 192–194, 25–39. [Google Scholar]
  21. Yulinova, A.; Nickel, D.; Frint, P.; Lampke, T. Electrochemical properties of AL-6060 alloy after industrial scale ECAP. Mater. Sci. 2012, 48, 191–196. [Google Scholar] [CrossRef]
  22. Frint, P.; Hockauf, M.; Halle, T.; Strehl, G.; Lampke, T.; Wagner, M.F.X. Microstructural features and mechanical properties after industrial scale ECAP of an Al-6060 alloy. Mater. Sci. Forum 2011, 667–669, 1153–1158. [Google Scholar]
  23. Frint, P.; Hockauf, M.; Dietrich, D.; Halle, T.; Wagner, M.F.X.; Lampke, T. Influence of strain gradients on the grain refinement during industrial scale ECAP. Mater. Sci. Eng. Technol. 2011, 42, 680–685. [Google Scholar]
  24. Iwahashi, Y.; Wang, J.T.; Horita, Z.; Nemoto, M.; Langdon, T.G. Principle of equal-channel angular pressing for the processing of ultra-fine grained materials. Scripta Mater. 1996, 35, 143–146. [Google Scholar] [CrossRef]
  25. Dietrich, D.; Berek, H.; Schulze, A.; Scharf, I.; Lampke, T. EBSD and STEM on aluminium alloys subjected to severe plastic deformation. Prac. Metall. 2011, 43, 136–150. [Google Scholar] [CrossRef]
  26. Böhni, H.; Suter, T.; Schreyer, A. Micro- and nanotechniques to study localized corrosion. Electrochim. Acta 1995, 40, 1361–1368. [Google Scholar] [CrossRef]
  27. Birbilis, N.; Buchheit, R.G. Electrochemical characteristics of intermetallic phases in aluminum alloys—An experimental survey and discussion. J. Electrochem. Soc. 2005, 152, B140–B151. [Google Scholar] [CrossRef]
  28. Couper, M.J.; Rinderer, B.; Yao, J.Y. Characterisation of AlFeSi intermetallics in 6000 series aluminium alloy extrusions. Mater. Sci. Forum 2006, 519–521, 303–308. [Google Scholar]
  29. Milkereit, B.; Wanderka, N.; Schick, C.; Kessler, O. Continuous cooling precipitation diagrams of Al–Mg–Si alloys. Mater. Sci. Eng. 2012, A550, 87–96. [Google Scholar] [CrossRef]
  30. Birol, Y. Precipitation during homogenization cooling in AlMgSi alloys. Trans. Nonferrous Metals Soc. China 2013, 23, 1875–1881. [Google Scholar] [CrossRef]
  31. Bournane, M.; Berezina, A.; Davydenko, O.; Monastyrska, T.; Molebny, O.; Spuskanyuk, V.; Kotko, A. Effect of severe plastic deformation on structure and properties of Al-Mg-Si alloy of 6060 type. Mater. Sci. Metall. Eng. 2013, 1, 13–21. [Google Scholar]
  32. Hockauf, K.; Wagner, M.F.X.; Halle, T.; Niendorf, T.; Hockauf, M.; Lampke, T. Influence of precipitates on low-cycle fatigue and crack growth behavior in an ultrafine-grained aluminum alloy. Acta Mater. 2014, 80, 250–263. [Google Scholar] [CrossRef]
  33. Suter, T.; Alkire, R.C. Microelectrochemical studies of pit initiation at single inclusions in Al 2024-T3. J. Electrochem. Soc. 2001, 148, B36–B42. [Google Scholar]
  34. Wloka, J.; Hack, T.; Virtanen, S. Local electrochemical properties of laser beam-welded high-strength Al–Zn–Mg–Cu alloys. Mater. Corros. 2008, 59, 5–13. [Google Scholar]

