Article

Comprehensive Unveiling of the Oxidation Resistance and Corrosion Protection of an Oxide Layer Formed on the Gd-Alloyed AZ80 Alloy Surface

1
School of Materials Science and Physics, China University of Mining and Technology, Xuzhou 221116, China
2
School of Safety Engineering, China University of Mining and Technology, Xuzhou 221116, China
*
Author to whom correspondence should be addressed.
Metals 2024, 14(4), 474; https://doi.org/10.3390/met14040474
Submission received: 5 March 2024 / Revised: 9 April 2024 / Accepted: 15 April 2024 / Published: 18 April 2024

Abstract

:
In our previous work, the effect of Gd alloying on the oxidation resistance of AZ80 alloy was revealed briefly. However, a comprehensive understanding of the oxidation and corrosion resistance of the oxide layer formed on the Gd alloying AZ80 alloy surface needs to be developed. Thus, in this research, the high-temperature oxidation behaviors, oxidation products, and oxide layer characteristics of AZ80, AZ80-0.47Gd, and AZ80-0.75Gd (wt%) alloys were investigated at 420 °C. The corrosion protection of the oxide layer formed on the alloy surface was evaluated. The results showed that Gd alloying eliminated the content of the low melting point phase of β-Mg17Al12 and promoted the generation of a high melting point phase of Al2Gd. Gd2O3 appeared in the oxide layer and facilitated the propagation of homogeneous oxidation as well as densification of the oxide layer. In addition, the firm oxide layer showed characteristics of a blurred boundary with the magnesium matrix. After immersion of the oxide layer containing gadolinium oxide, the products of corrosion were massively nodulated, leading to the passivation of corrosion. This research provides new ideas for magnesium alloy protective layer preparation via a high-temperature oxidation technique.

1. Introduction

One advantage of using magnesium alloys in applications in automotive, rail transit, and aerospace industries is their lightweight because magnesium alloys show characteristics of low density and high specific strength and provide a satisfactory electric shielding effect [1,2,3]. But the requirement for resistance to oxidation, resistance to corrosion, and heat stabilization has been proposed as magnesium alloys show high chemical and electrochemical activity characteristics [4,5,6,7]. In addition, the oxide products of magnesium alloys, mainly consisting of MgO with a Pilling–Bedworth ratio of less than 1, show poor film formation and limited protection for the matrix [8]. Therefore, the oxidation resistance and corrosion resistance of Mg alloys are poor, which seriously limits their popularization and application.
Alloying, as a simple tactic, has a good effect on enhancing the resistance to oxidation of Mg alloys [5,8,9,10]. For instance, Villegas-Armenta et al. [5] investigated the influence of a low amount of Ca addition (<3 wt%) on high-temperature oxidation resistance of pure magnesium, which demonstrated that calcium-rich interdendritic regions are more resistant to oxidation in the molten state than in the solid state, and this effect could be attributed to the ΔG (Gibbs energy change) in the formation of CaO in the molten and solid phase. Kim et al. [8] reported the critical essential factor affecting the ignition resistance of magnesium alloys at high temperatures, emphasizing that the yttrium element has a high solid solubility in the Mg matrix, which can significantly improve the oxidation resistance of Mg alloys. Fan et al. [9] studied the effect of adding Ho on the oxidation resistance of a Mg-Y-Zn alloy at high temperatures by conducting cyclic oxidation tests at 500 °C for different holding times. The results showed that Ho addition could improve the resistance to high-temperature oxidation of the Mg-3Y-2Zn-12Ho (wt%) alloy, which could be attributed to the formation of dense Ho2O3 on the surface. And compared with Y2O3, Ho2O3 reduced the inward oxygen diffusion coefficient by three orders of magnitude. Cai et al. [10] researched the oxidation and corrosion behavior of Mg-0Gd, Mg-13Gd-0.5Zr, and Mg-20Gd-0.6Zr (wt%) alloys, which showed that with increasing content of Gd, the high-temperature oxidation resistance as well as corrosion resistance increased. The oxide film formed on the surface was divided into two layers as follows: the outermost gadolinium oxide layer with a small amount of zinc oxide (ZrO2) and the inner MgO layer. However, the corrosion-protective performance of the oxide layer was not reported.
Gd alloying can enhance the high-temperature oxidation resistance of pure Mg significantly. However, for the AZ80 alloy with more complex chemical components, limited information is available in the literature regarding the effect of Gd addition on its high-temperature oxidation resistance. Furthermore, the corrosion protection performance of the oxide film of the Gd-alloyed AZ80 alloy has not been researched. Considering the actual development and application of Mg alloys, it is necessary to add low amounts of rare earth elements into magnesium alloys [11,12]. In this research, AZ80-xGd (x = 0, 0.5, and 0.8, wt%) were prepared. The behavior of oxidation and products of the alloys were investigated, and the influence of gadolinium on the oxidation resistance of the magnesium alloy was analyzed. In addition, the corrosion protection performance of the oxide layer formed on the alloy surface was also investigated, aiming to supply novel measures for Mg alloy surface protective technology development.

2. Experimental Methods

2.1. Materials

The AZ80-xGd (x = 0, 0.5 and 0.8, wt%) alloys were designed and prepared via a furnace using commercial pure magnesium, pure aluminum, pure zinc (all of 99.9 wt%), Mg-20 wt% Gd master alloy, and MnCl2 particles. The molten alloy shielded with protective gas was held at 700 °C for half an hour and then cast into a mold. The compositions of the designed alloys were identified by inductively coupled plasma (ICP) emission spectroscopy, as shown in Table 1. Considering the actual compositions, the alloys were named AZ80, AZ80-0.47Gd, and AZ80-0.75Gd, respectively.

2.2. Isothermal Oxidation Evaluation

A sample 20 mm × 15 mm × 15 mm in size, cut from the as-cast ingot, was used for isothermal oxidation evaluation. All samples were metallographically polished with SiC papers up to 3000 grit. Then, the samples were installed in a device equipped with a resistance furnace and analytical balance (METTLER TOLEDD Inc., Shanghai, China) for isothermal oxidation evaluation at standard atmospheric pressure. The weight gain of each sample was recorded during the oxidation time. The isothermal oxidation tests were conducted at temperatures near the second phase melting point.

2.3. Corrosion Tests

After oxidation, the AZ80-0.75Gd alloys with and without an oxide layer were soaked in 3.5 wt% NaCl solution for 1 h. Then, electrochemical measurements were conducted to investigate the corrosion protection of the oxide film. Each sample for the test showed an exposed area of 10 × 10 mm2. The experiment was carried out on a ChenHua CHI660E electrochemical workstation (Shanghai, China). A saturated calomel electrode (SCE) was used as the reference electrode, platinum foil as the reverse electrode, and the tested sample as the working electrode. The experimental temperature was 25 ± 2 °C. The open circuit potential (OCP) evaluation was conducted for 3600 s. Then, electrochemical impedance spectroscopy (EIS) measurements were performed at the OCP. The polarization curve of each sample was also measured. In addition, three replicated samples were carried out to guarantee the reproducibility and reliability of the test. The tests followed the international standard of ASTM G44-1999 (2013), which is a widely used standard method for studying the corrosion performance of coatings [13].

2.4. Microstructure and Surface Morphology Identification

A differential scanning calorimeter (DSC, NETZSCH Inc., Selb, Germany) test was employed to determine the melting point of the second phase. The microstructures of the morphologies of the oxide layer, as-cast alloys, and corrosion products were observed by a JSM-7800 scanning electron microscope (SEM, NIDEC CORPORATION, Tokyo, Japan) equipped with energy-dispersive X-ray spectroscopy (EDS). X-ray diffraction (XRD, BRUKER Inc., Karlsruhe, Germany) was also used for phase identification. The cross-sectional microstructures of the oxidized samples were also identified by the SEM for oxidation behavior analysis.

3. Results and Discussion

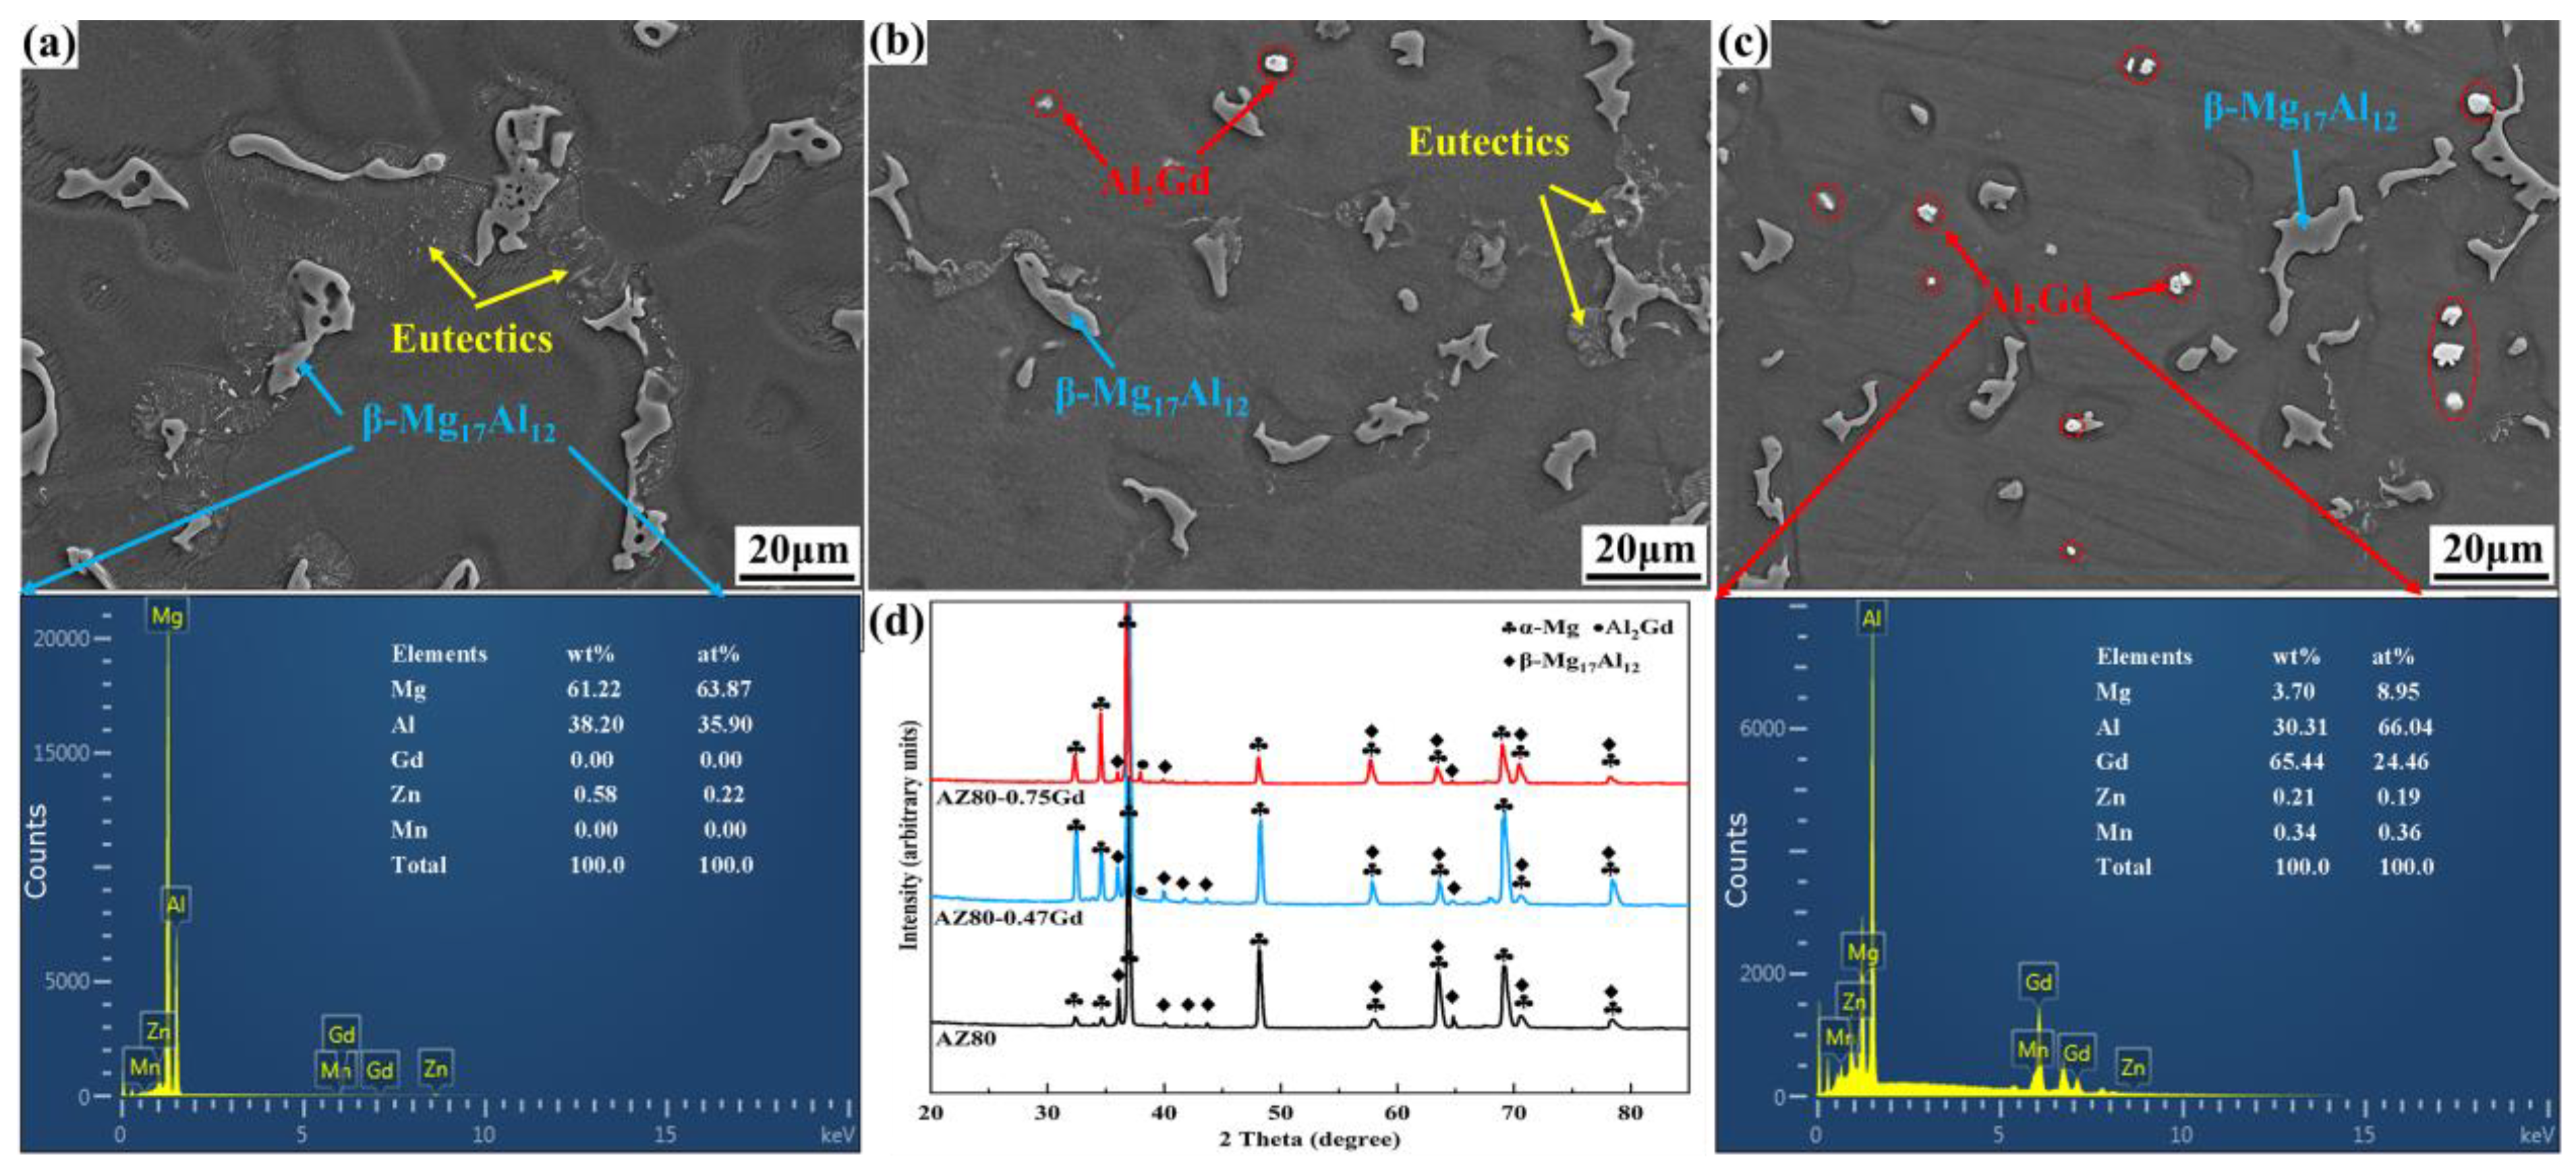
3.1. Microstructure and Phase Composition

Figure 1 portrays the microstructures and normalized XRD patterns of the as-cast AZ80, AZ80-0.47Gd, and AZ80-0.75Gd alloys with β-Mg17Al12 and Al2Gd phase X-ray spectroscopy analysis. AZ80 consists of α-Mg, big chain-like β-Mg17Al12, and widespread eutectics. AZ80-0.47Gd is composed of α-Mg, island-like β-Mg17Al12, concomitant eutectics, and punctiform Al2Gd. AZ80-0.75Gd is made up of α-Mg, punctiform Al2Gd, and small island-like β-Mg17Al12. It is obvious that with Gd addition and increasing the content, β-Mg17Al12 is reduced and refined with Al2Gd appearing.
Figure 2 shows the differential scanning calorimeter curves of the AZ80, AZ80-0.47Gd, and AZ80-0.75Gd alloys. The results show that β-Mg17Al12 begins to melt at 425 °C, and the melting temperature is lower than the matrix. Once the magnesium alloy melts, the melt will undergo catastrophic oxidation [14]. As the magnesium melt is more susceptible to oxidation, the content of β-Mg17Al12 in the microstructure of the magnesium alloy can weaken its resistance to oxidation. However, the melting peak of Al2Gd does not appear in the DSC curve, which means the melting temperature of Al2Gd is higher than the matrix. It is reported that the melting point of Al2Gd is 1525 °C, which is conducive to the thermal stability of the alloy [15,16]. In addition, the content of the crystalline phase was determined via the area of endothermic melting peaks. It can also be seen from Figure 2 that with Gd addition, the content of β-Mg17Al12 decreases, i.e., Gd alloying eliminates the content of β-Mg17Al12. which is in line with the results shown in Figure 1.

3.2. Oxidation Behavior and Kinetics

The weight gain behaviors of the test alloys during oxidation at 420 °C for different times in air are displayed in Figure 3. The isothermal oxidation test was conducted once for each sample. The weight change in each sample was measured in situ by a high-precision analytical balance, so the experimental data show good repeatability. Useful insights could be obtained from a comparison of the oxidation behavior measured with similar setups and operational procedures. The weight gain of each alloy increased step by step with an increase in the exposure time while displaying different oxidation kinetics. In order to investigate the oxidation kinetics of the alloys, Equation (1) [17] was used.
w = ktn
where w is the weight gain per unit area; k is the constant of oxidation rate; t represents the time of oxidation; and n means the reactivity index. In fact, when n = 1, the oxidation kinetics of the alloy behaves as a linear rate law, that is, the alloy behaves as a non-protective oxidation, and the phase-boundary process is the rate-determining step of the reaction. When n = 0.5, the alloy exhibits parabolic rate law oxidation kinetics, which shows that the alloy portrays protective oxidation, and cationic transport across the growing oxide film determines the rate of scaling [18]. In fact, on account of the combined effect of internal and external factors in the oxidation process, n is hardly ever equal to 1 or 0.5 [19,20].
The weight gain (0~1 h) of the three test alloys was fitted via Equation (1), and the results are presented in Figure 3a. The n values of AZ80, AZ80-0.47Gd, and AZ80-0.75Gd are 1.19, 1.15, and 1.32, respectively, which means that the oxidation kinetics approximate a linear rate law. The fitted results of the weight gain behaviors (0~3 h) of the three alloys are shown in Figure 3b. The n values of AZ80, AZ80-0.47Gd, and AZ80-0.75Gd are 2.25, 1.63, and 1.06, respectively, which indicates that the oxidation kinetics of the AZ80 and AZ80-0.47Gd alloys show a superlinear rate law, while the AZ80-0.75Gd alloy oxidation kinetics still depicts an approximately linear rate law. The fitted results of the weight gain behaviors (0~4.5 h) of the three alloys are shown in Figure 3c. The n values of AZ80, AZ80-0.47Gd, and AZ80-0.75Gd are 2.98, 1.99, and 0.84, respectively, which shows that the oxidation kinetics of the AZ80 and AZ80-0.47Gd alloys are a typical superlinear rate law, while that of the AZ80-0.75Gd alloy is a parabolic rate law. In addition, the confidence levels of n values are over 98%. Figure 3d shows the reactivity index (n) transformation of the three alloys as the oxidation time increases. It is worth noting that the n values of the AZ80 alloy are all greater than 1, and the n values gradually increase with the extension of oxidation time, showing non-protective oxidation behavior and superlinear rate law oxidation kinetics. The n values of the AZ80-0.47Gd alloy decrease in the initial stage and increase in the later stage, which means the oxide film formed in the initial stage shows protective properties, and then the protection fails. In contrast, the AZ80-0.75Gd alloy n values decrease with increasing oxidation time, meaning protective oxidation behavior and approximately parabolic rate law oxidation kinetics [18]. The results in Figure 3 indicated that Gd addition improved the resistance to oxidation of the AZ80 alloy and transformed oxidation kinetics from a superlinear rate law to an approximately parabolic rate law. In addition, from the embedded macroscopic morphologies of alloys after 4.5 h of oxidation, as shown in Figure 3c, it is clear that the AZ80 and AZ80-0.47Gd alloys show inhomogeneous oxidation while the AZ80-0.75Gd alloy shows even oxidation. Thus, Gd alloying promoted the film-formation of oxide products on the AZ80 alloy, and complete as well as uniform oxide film was generated on the surface of AZ80-0.75Gd alloy.

3.3. Oxide Film Characteristic

Figure 4 shows the surface three-dimensional micrographs of the experimental alloys after 3 h of exposure at 420 °C. A square area is shown, and the change in height of the morphology is represented by the color variation [21]. A bulge in the figure shows the oxidized region, and the higher the bump, the redder the color. Figure 4a shows that the oxidation of the AZ80 alloy is uneven. The unoxidized zone is smooth and flat without oxide products. Figure 4b shows that the oxidation zone of the AZ80-0.47Gd alloy is dispersed, and oxidation still shows inhomogeneous characteristics. The most uniform oxidation occurred on the surface of the AZ80-0.75Gd alloy, as shown in Figure 4c, compared with the AZ80 and AZ80-0.47Gd alloys. The alloy surface is full of oxidized products, and it is flat as well as smooth without an obvious oxidation bulge. Thus, the results in Figure 4 also show that with Gd addition into the AZ80 alloy, the film-formation ability of alloy oxide products is improved.
Figure 5 displays the micrographs of oxide films formed on the AZ80, AZ80-0.47Gd, and AZ80-0.75Gd alloys after 4.5 h of exposure at 420 °C. Uneven oxidation occurs on the AZ80 alloy surface, and the oxidized region as well as the unoxidized region show a distinct boundary, as shown in Figure 5a. The oxide products on the surface of the AZ80 alloy show a pulverous structure, as shown in Figure 5b. The AZ80-0.47Gd alloy also shows uneven oxidation, but a transitional zone appears between the oxidized region and the unoxidized region, as shown in Figure 5c. The oxide scale generated on the AZ80-0.75Gd alloy is even, and the oxide products show a granular structure, which means the formed oxide film is more compact compared with the AZ80-0.47Gd alloy.
Figure 6 illustrates the cross-sectional morphologies of the AZ80, AZ80-0.47Gd, and AZ80-0.75Gd alloys after 4.5 h of exposure at 420 °C. The oxide layer of the oxidized region of the AZ80 alloy is rough, and oxidation erosion extends inward, as shown in Figure 6a. Figure 6b shows that the oxidized region also shows a distinct boundary on the cross-section. In addition, there are many microvoids both in the outer and inner oxide layer, as shown in the area above the dividing line by the black spots in Figure 6b. The porous scale shows black holes, where less electron scattering happens [22]. Therefore, the oxide layer is loose with defects. However, the oxidative erosion of Gd alloying on AZ80 is not as severe as AZ80, as shown in Figure 6c–e. The oxide layers of the AZ80-0.47Gd and AZ80-0.75Gd alloys were thinner and smoother than that of the AZ80 alloy. The oxide scale of the AZ80-0.75Gd alloy is more compact with a blurred boundary between the Mg matrix and the layer compared with that of the AZ80-0.47Gd alloy, as shown in Figure 6e. The contrast between the Mg matrix and the layer is weak, meaning good adhesion of the oxide layer with the substrate [23,24]. The results in Figure 6 prove that with Gd addition into the AZ80 alloy, the oxide layer of the alloy grows towards completeness and density and shows an oxidation protective effect. The results also explain the transformation of alloy oxidation kinetics.
The XRD spectra of the oxide products of the AZ80-0.75Gd and AZ80 alloys with reference to the spectrum of Gd2O3 (JCPDS No.86–2477) are depicted in Figure 7 [25]. The oxide layer of the AZ80 alloy is mainly composed of magnesium oxide and also contains a trace amount of Al2O3. But the oxide layer of the AZ80-0.75Gd alloy contains Gd2O3 in addition to MgO and Al2O3. Gd2O3 is corundum-like structured and crystallizes in the trigonal p 3 - m1 space group. Gd3⁺ is bonded in a seven-coordinate geometry to seven O2− atoms, as shown in Figure 8. There is a spread of Gd-O bond distances ranging from 2.24 to 2.60 Å and two inequivalent O2− sites. In the first O2− site, O2− combines with six equivalent Gd3⁺ atoms to form OGd6 octahedra, which share corners with twelve equivalent OGd4 tetrahedra, edges with six equivalent OGd6 octahedra, and edges with six equivalent OGd4 tetrahedra. In the second O2− site, O2− is combined with four equivalent Gd3⁺ atoms to form OGd4 tetrahedra that share corners with six equivalent OGd6 octahedra, corners with six equivalent OGd4 tetrahedra, edges with three equivalent OGd6 octahedra, and edges with three equivalent OGd4 tetrahedra. The corner-sharing octahedral tilt angles range from 18 to 56° [26]. Gd2O3 is stable in water. Its appearance facilitates restraining the generation of holes and other defects in the oxide layer, which results in the densification of the oxide film, as shown in Figure 6. Thus, the oxide film propagated on the AZ80-0.75Gd alloy surface is dense and thin, as shown in Figure 6d,e. A dense film inhibits the mutual diffusion of oxidation reactants [27,28], resulting in the transformation of alloy oxidation kinetics from a superlinear rate law to an approximately parabolic rate law, as shown in Figure 3. Thus, the typical structure and excellent properties of Gd2O3 show better benefits for the density and adhesion of the oxide film and enhance the oxidation resistance of the experimental alloy.

3.4. Corrosion Protection Performance

The corrosion protection performance of the Gd2O3-containing oxide layer was briefly reported in our previous short communication work because of space limitations [29]. However, a comprehensive understanding of the corrosion behavior and mechanism of Gd2O3-containing oxide film needs to be developed based on corrosion morphologies and EIS diagrams with equivalent electrical circuits. Figure 9 shows the potentiodynamic polarization curves of the AZ80-0.75Gd alloy with and without an oxide layer during the dip in 3.5 wt% NaCl solution for 1 h. The results show that test samples exhibit similar cathodic polarization behaviors. The cathodic branches depict a particularly obvious linear Tafel characteristic at potentials more negative than the critical potential [30], while the right branches of the polarization curves display different characteristics. The right branch of the polarization curve exhibits anodic polarization, which mainly involves the dissolution of magnesium and abnormal anodic hydrogen evolution (negative difference effect, NDE). Therefore, the anodic polarization curve is too complex to calculate the corrosion current density and cannot be used for Tafel extrapolation [31,32,33]. The polarization curve of oxide film samples showed a breakdown potential Eb. The results indicate that the oxide scale generated on the AZ80-0.75Gd alloy surface exhibits corrosion protection performance, and the passivation layer generated in the corrosion process shows good stability and a diffusion restrain effect on corrosive media Cl [34,35]. In addition, the fitting results of the polarization curves are listed in Table 2. The corrosion resistance of materials is mainly determined by the corrosion current (icorr). The icorr of AZ80-0.75Gd with and without an oxide layer is 6.7 × 10⁻⁵ and 1.6 × 10⁻³, respectively. The icorr of the sample with an oxide layer is two orders of magnitude lower than that of the sample without the oxide film, which proves the protection properties of the oxide layer generated on the AZ80-0.75Gd alloy.
In order to further study the corrosion kinetics of the test alloys without and with an oxide film, EIS tests were carried out, and the EIS diagrams after soaking in 3.5 wt% NaCl solution for 1 h are shown in Figure 10. It is evident from Figure 10a that the Nyquist diagrams for the test alloys consist of the following two loops: a high-frequency capacitance loop and a low-frequency inductance loop. The loops are similar except for their diameters. The capacitance loop diameter represents the charge transfer process of Mg/Mg2+ in the double layer formed on the surface of the membrane [36]. It is generally believed that the induction loop is related to pitting corrosion [37]. In addition, the impedance Z of the test sample can be clearly observed in the low-frequency region between 10−2 and 10−1 Hz, as shown in Figure 10b. The Z values are ranked as a sample without an oxide layer < a sample with an oxide layer, indicating the same sequence of samples corrosion resistance, that is, the generation of the oxide layer hinders the occurrence of corrosion. However, the appearance of the induction loop implies defects in the AZ80-0.75Gd alloy oxide film.
Figure 11 shows the equivalent electrical circuits fitted by ZSimpWin 3.30d software. To be clear, though the Nyquist diagrams of the samples without an oxide film are composed of a low-frequency inductance loop and a high-frequency capacitance loop, they cannot use the same equivalent electrical circuits model as the samples with an oxide film. The fitted equivalent electrical circuit of a sample without an oxide layer is shown in Figure 11a, and the fitted EIS data on account of the equivalent electrical circuit are listed in Table 3. The fitted equivalent electrical circuit of a sample with an oxide layer is demonstrated in Figure 11b, and the fitted EIS data on account of equivalent electrical circuits are also listed in Table 3. Admittedly, it is hard to describe in detail the physical meaning of each electrical element in the equivalent electrical circuits because this is under drastic research and is currently the topic of scientific debate [38]. Despite the lack of consensus, a brief description of the reasonable meaning is attempted as follows. In addition, it should be noted that the equivalent electrical circuits in Figure 11 use the minimum number of time constants required to dependably portray the obtained data and keep the fitting errors to a minimum, as shown in Table 3. In Figure 11, the capacitive response was modeled using constant phase elements (CPEs), the resistive behavior using R, and the inductive loop using an inductor (L). R is associated with the solution resistance between the reference and the working electrodes. CPEdl and Rct are the double-layer capacitance and the charge transfer resistance related to the film and charge transfer of the surface, respectively [22,30,39]. L and RL indicate inductance and inductive resistance, which depict the low-frequency inductive loop and are associated with pitting corrosion as well as the relaxation of the adsorbed intermediates on the Mg surface [37,40,41,42]. The fitted RO1 and RO2 as well as the corresponding CPEO1 and CPEO2 of the sample without oxide film are film resistance and constant phase elements, which is caused by the appearance of microvoids in corrosion products film [22,42]. The results in Table 3 show that the CPEdl values of samples with and without the oxide film do not show significant differences. The Rct values are 370.7 and 1182 Ω·cm2, respectively, showing wide differences. In addition, because of the densification of the oxide film, CPEO1 and CPEO2 disappear in the EIS fitting circuits of the sample with an oxide layer. In addition, the RL values of samples with and without an oxide layer are 3842 and 711.5 Ω·cm2. The results indicate that AZ80-0.75Gd with an oxide layer shows better corrosion resistance than that of AZ80-0.75Gd without an oxide layer.
The hydrogen evolution curves of AZ80-0.75Gd samples with and without an oxide layer immersed in 3.5 wt% NaCl are shown in Figure 12. It is obvious that the sample without oxide film shows higher hydrogen evolution content during the testing time, which means that the oxide layer generated on the AZ80-0.75Gd alloy presents an impressive corrosion protection effect during the immersion time. The oxide layer of the AZ80-0.75Gd alloy shows a compact structure, as illustrated in Figure 5 and Figure 6, so densification of the oxide film improves the corrosion resistance. The results suggest a new method for preparing magnesium alloy surface protective film by high-temperature oxidation.
Figure 13 shows the microscopic corrosion morphologies of the AZ80-0.75Gd samples without and with an oxide scale after soaking for 12 h in 3.5 wt% NaCl solution. As shown in Figure 13a, huge cracks appeared on the surface of the sample without an oxide layer, and after soaking in 3.5 wt% NaCl solution for 12 h, the corrosion products formed a loose rose-like corrosion layer. Only capillary cracks occurred on the surface of the sample with an oxide layer, as shown in Figure 13d, and the high magnification image shows the compact structure of the layer with nodulizing corrosion products, as shown in Figure 13e,f. The nodulizing corrosion products are conducive to the constitution of the compact film and the prevention of corrosion.
So, Gd addition into the AZ80 alloy modulated the phase compositions, eliminated the content of the low melting point phase of β-Mg17Al12, and promoted the generation of a high melting point phase of Al2Gd, which resulted in the thermostability of the alloy. Then, the oxidation behaviors at high-temperature and the oxide layer features of the AZ80, AZ80-0.45Gd, and AZ80-0.75Gd (wt%) alloys were researched to reveal the influence of Gd alloying on the resistance to oxidation and corrosion protection ability of the oxide layer of the test alloy. The results indicated that after oxidation, Gd2O3 was generated in the oxide film of Gd-containing alloy, which improved the densification of the oxide layer and translation of oxidation kinetics from a superlinear rate law to an approximate parabolic rate law of the alloy. After corrosion of the oxide layer, the products were roundly nodulated, leading to corrosion passivation and depicting the protection effect, as illustrated in Figure 14.

4. Conclusions

In this paper, the influence of Gd alloying on the high-temperature oxidation resistance of the AZ80 alloy and corrosion protection of the oxide layer were researched. The main conclusions are summarized as follows:
(1)
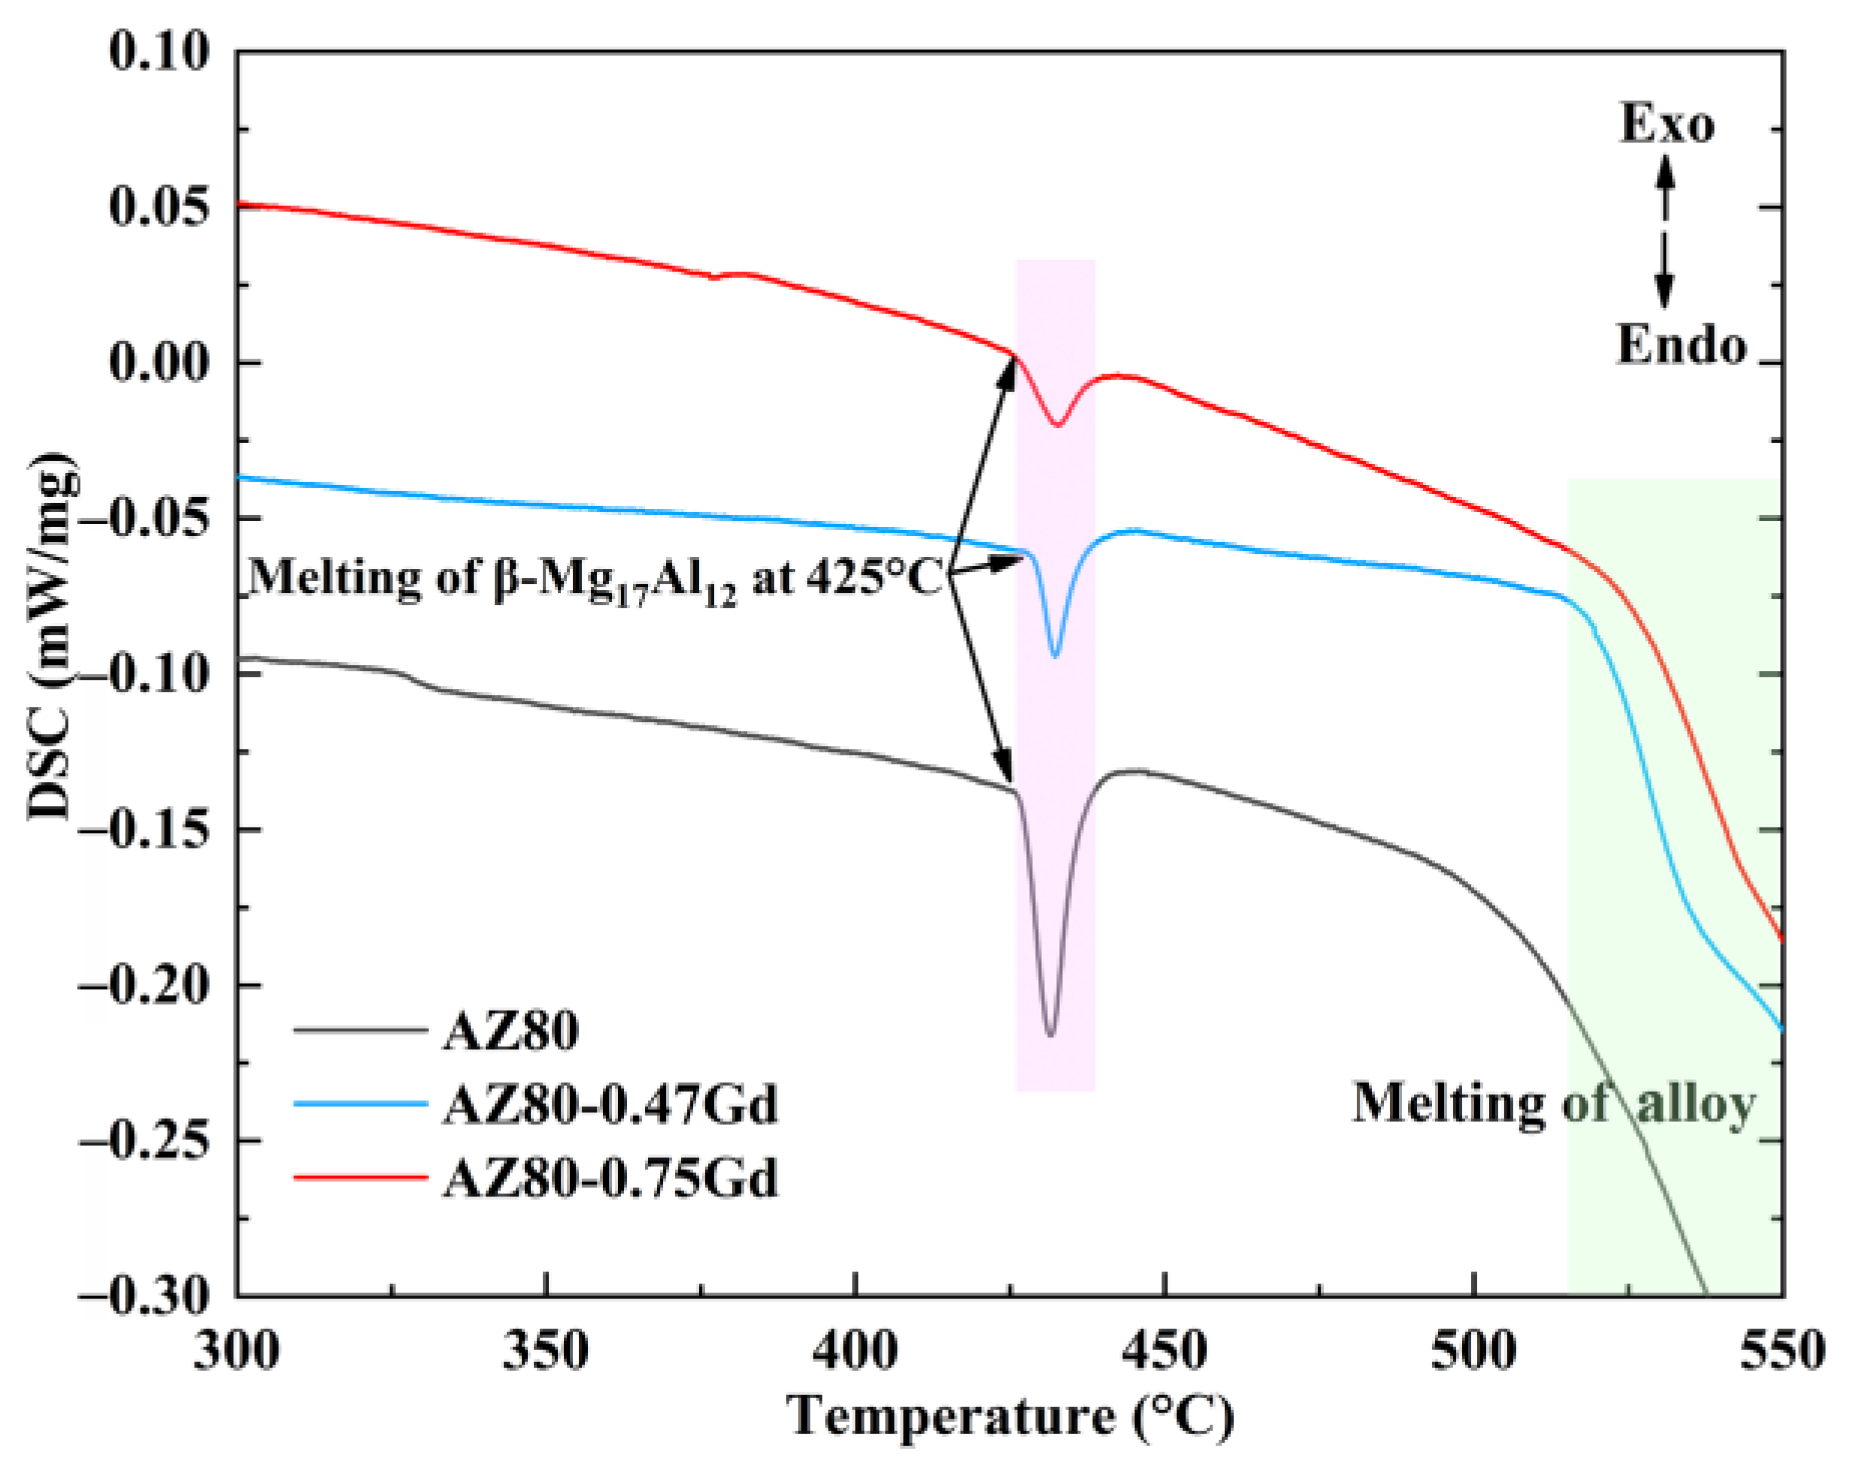
The addition of Gd into the AZ80 alloy modulated the phase compositions. Gd alloying eliminated the content of the low melting point phase of β-Mg17Al12 and promoted the generation of the high melting point phase of Al2Gd, resulting in the thermostability of the alloy.
(2)
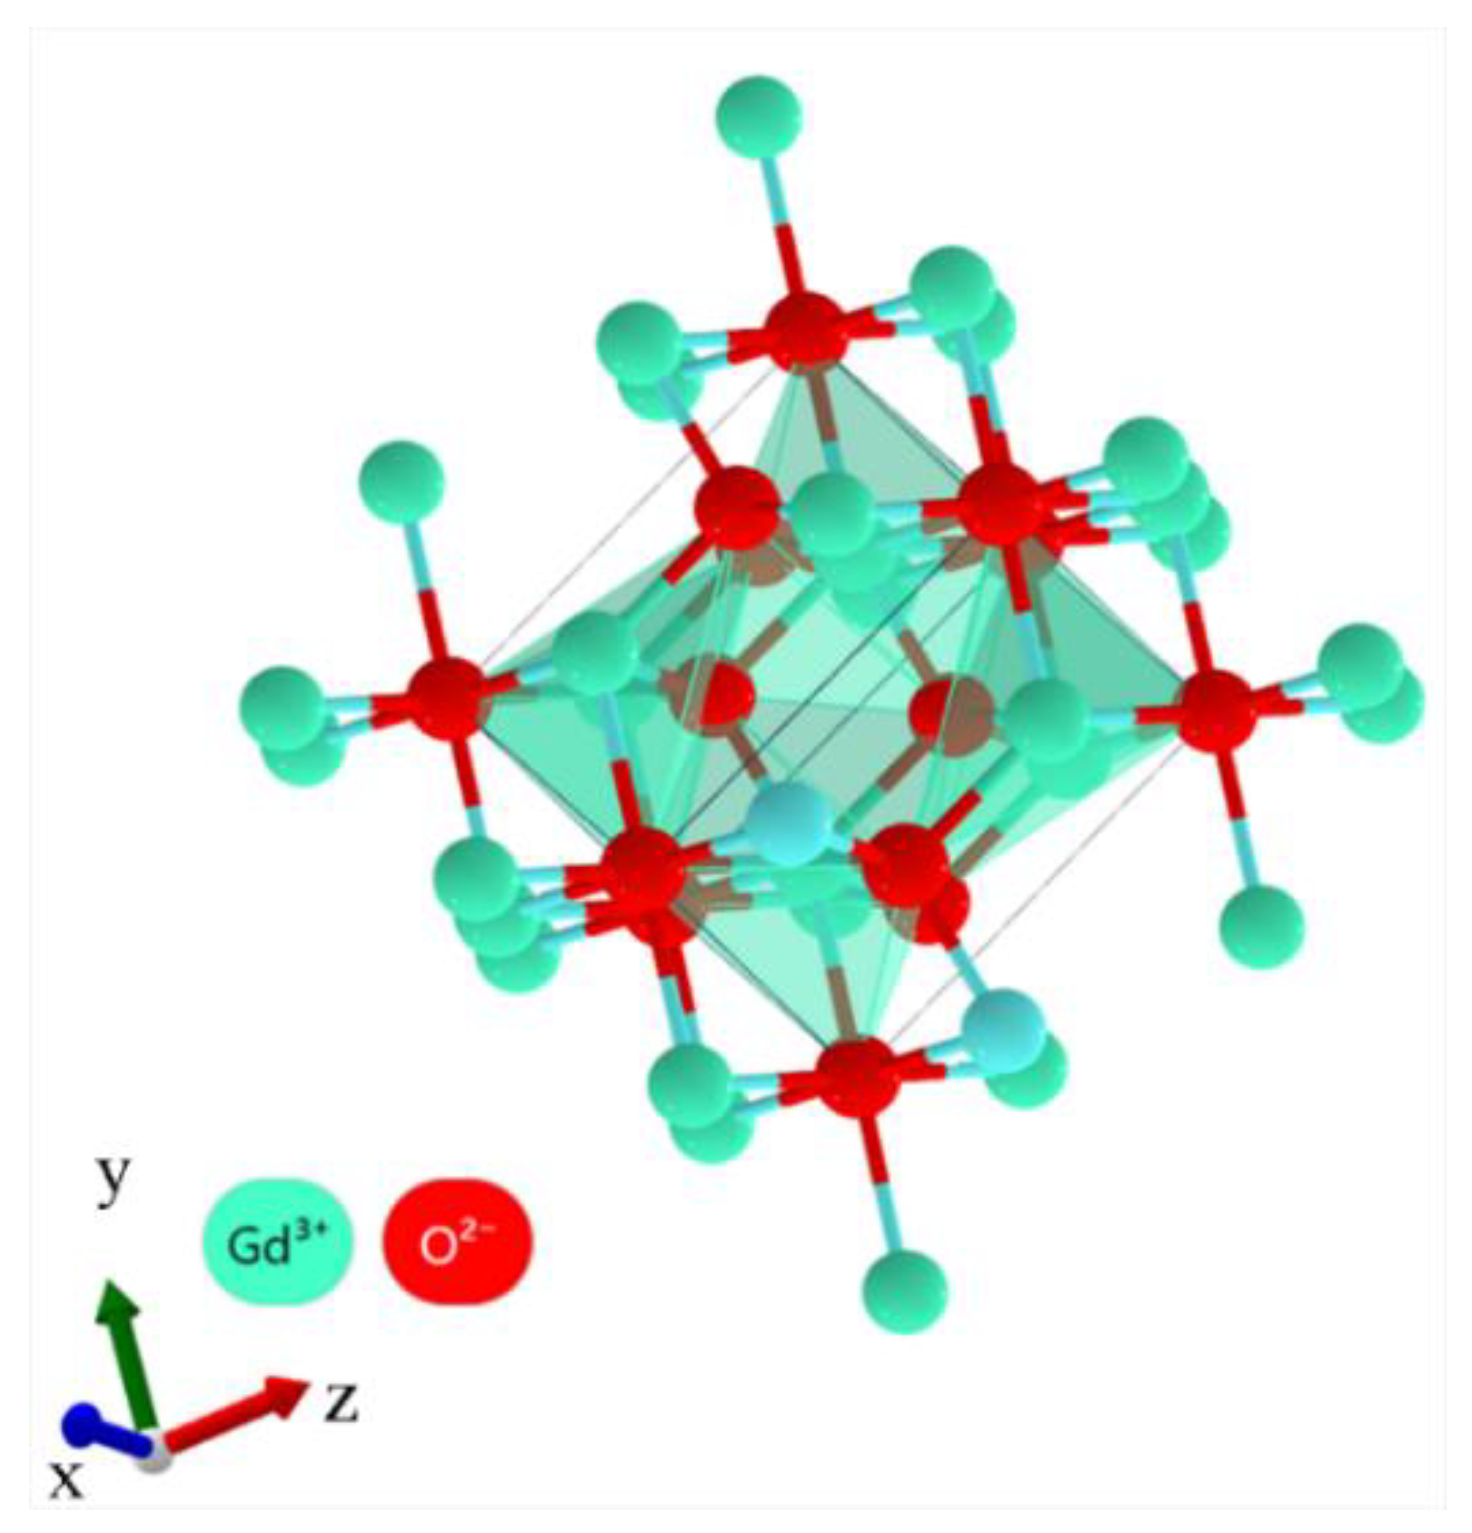
When Gd was added, the enhancement in the thermal stability of the alloy and the formation of Gd2O3 in the oxide product promoted the uniform oxidation, layer formation, and densification of the oxides, thus improving the resistance to oxidation of the alloy and transforming the oxidation kinetics from a superlinear rate law to an approximate parabolic rate law.
(3)
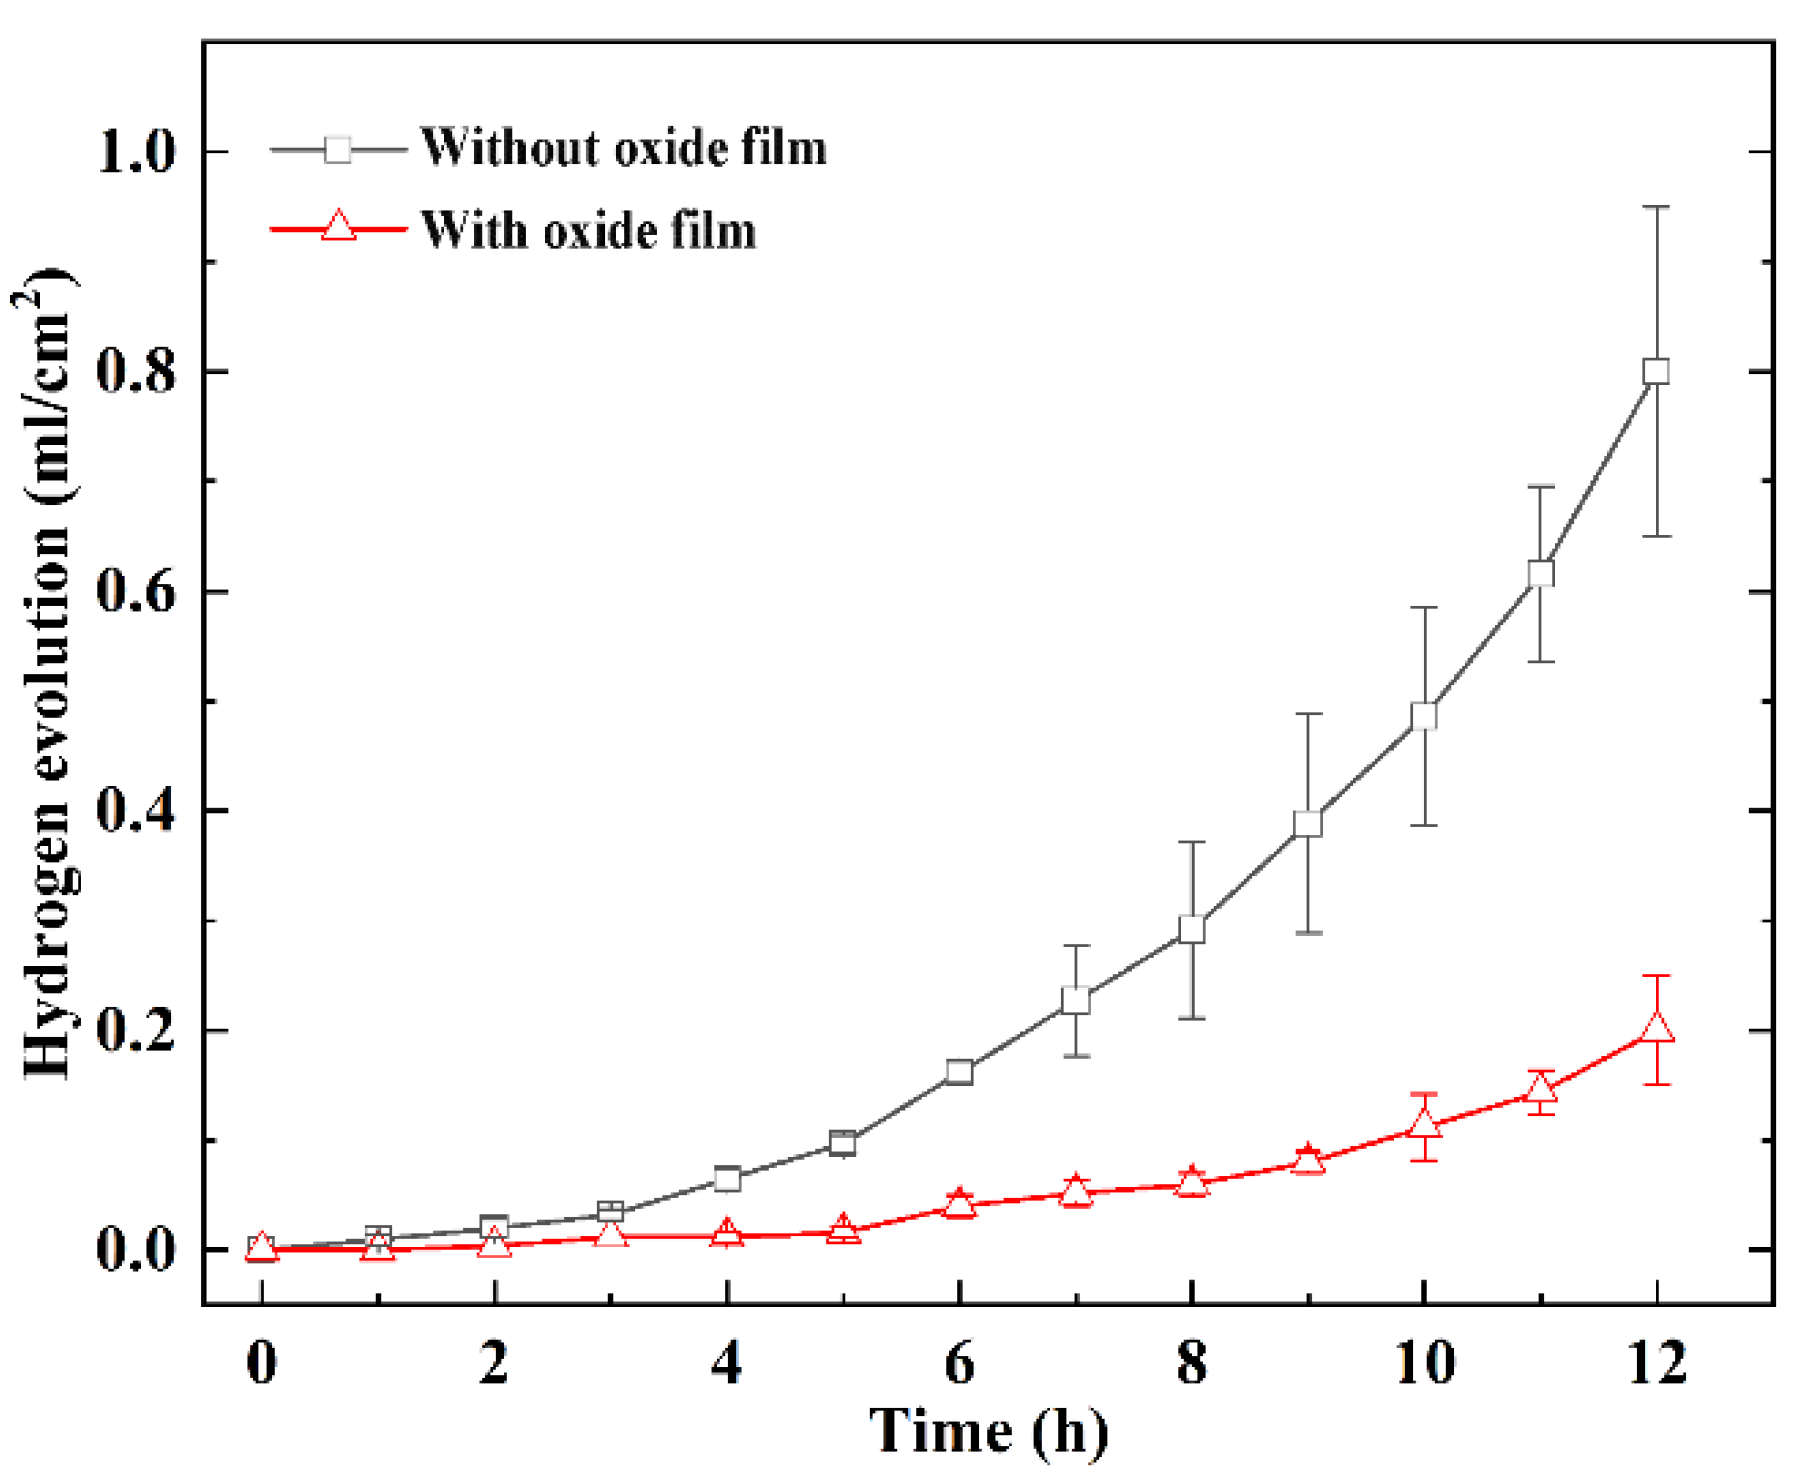
The compact oxide layer demonstrates a blurred boundary with the magnesium matrix, indicating excellent adhesion with the substrate. After the erosion of the compact oxide layer containing Gd2O3, the products were roundly nodulated, resulting in corrosion passivation and showing corrosion protection performance.
(4)
The densification of the magnesium alloy oxide film improved its corrosion protection performance, which provides a new method for preparing magnesium alloy protective layers via high-temperature oxidation.

Author Contributions

Methodology, C.C., B.Q. and A.M.; Software, C.C. and B.Q.; Validation, G.Z. and A.M.; Formal analysis, C.C. and G.Z.; Investigation, L.W. and Z.C.; Data curation, G.Z. and L.W.; Writing—original draft, C.C.; Supervision, Z.C. All authors have read and agreed to the published version of the manuscript.

Funding

The authors thankfully acknowledge the Fundamental Research Funds for the Central Universities (2023QN1033), the Material Science and Engineering Discipline Guidance Fund of China University of Mining and Technology (CUMTMS202210), China Postdoctoral Science Foundation (2023M733776), the Natural Science Foundation of Jiangsu Province (BK20231081), the Jiangsu Funding Program for Excellent Postdoctoral Talent (2023ZB780), and the Open Sharing Fund for the Large-scale Instruments and Equipment of China University of Mining and Technology (DYGX-2023-054).

Data Availability Statement

The data presented in this study are available in the article.

Conflicts of Interest

The authors declare no conflict of interest.

References

  1. Xu, L.D.; Ding, S.J.; Cai, X.C.; Wu, Y.; Li, Z.J.; Wen, K.K.; Xin, S.W.; Sun, B.R.; Huang, M.X.; Shen, T.D. Unveiling initial oxidation behavior of Mg-Y-Zn long-period stacking ordered (LPSO) phase. Corros. Sci. 2022, 208, 110624. [Google Scholar] [CrossRef]
  2. Pan, H.; Ren, Y.; Fu, H.; Zhao, H.; Wang, L.; Meng, X.; Qin, G. Recent developments in rare-earth free wrought magnesium alloys having high strength: A review. J. Alloys Compd. 2016, 663, 321–331. [Google Scholar] [CrossRef]
  3. Yang, Y.; Xiong, X.; Chen, J.; Peng, X.; Chen, D.; Pan, F. Research advances in magnesium and magnesium alloys worldwide in 2020. J. Magnes. Alloy 2021, 9, 705–747. [Google Scholar] [CrossRef]
  4. Ming, Y.; You, G.; Li, Q.; Yao, F.; Zhang, J.; Jiang, B. Flame resistance and oxidation behaviour of Mg–xCa (x = 0.3, 1.0, 2.0 and 3.6 wt%) alloys. Corros. Sci. 2023, 215, 111059. [Google Scholar] [CrossRef]
  5. Villegas-Armenta, L.A.; Drew, R.A.L.; Pekguleryuz, M.O. The ignition behavior of Mg–Ca binary alloys: The role of heating rate. Oxid. Met. 2020, 93, 545–558. [Google Scholar] [CrossRef]
  6. Patel, V.; Li, W.; Andersson, J.; Li, N. Enhancing grain refinement and corrosion behavior in AZ31B magnesium alloy via stationary shoulder friction stir processing. J. Mater. Res. Technol. 2022, 17, 3150–3156. [Google Scholar] [CrossRef]
  7. Fan, Y.; Cao, J.; Zhang, J.; Zhao, Y.; Fang, R.; Wang, Y.; Chen, Z. Stable production of dissimilar steel joints in construction machinery by narrow gap oscillating laser welding. J. Mater. Res. Technol. 2024, 30, 1403–1413. [Google Scholar] [CrossRef]
  8. Kim, Y.M.; Yim, C.D.; Kim, H.S.; You, B.S. Key factor influencing the ignition resistance of magnesium alloys at elevated temperatures. Scr. Mater. 2011, 65, 958–961. [Google Scholar] [CrossRef]
  9. Fan, M.; Cui, Y.; Zhang, Z.; Liu, L.; Li, Q.; Luo, Q. Enhanced oxidation resistance in Mg-Y-Zn-Ho alloys via introducing dense low-oxygen-diffusion Ho2O3 oxide film. Corros. Sci. 2023, 213, 110976. [Google Scholar] [CrossRef]
  10. Cai, Y.; Yan, H.; Zhu, M.; Zhang, K.; Yi, X.; Chen, R. High-temperature oxidation behavior and corrosion behavior of high strength Mg-xGd alloys with high Gd content. Corros. Sci. 2021, 193, 109872. [Google Scholar] [CrossRef]
  11. Tian, J.; Deng, J.; Zhou, Y.; Chang, Y.; Liang, W.; Ma, J. Slip behavior during tension of rare earth magnesium alloys processed by different rolling methods. J. Mater. Res. Technol. 2023, 22, 473–488. [Google Scholar] [CrossRef]
  12. He, M.; Chen, L.; Yin, M.; Xu, S.; Liang, Z. Review on magnesium and magnesium-based alloys as biomaterials for bone immobilization. J. Mater. Res. Technol. 2023, 23, 4396–4419. [Google Scholar] [CrossRef]
  13. ASTM G44; Standard Practice for Exposure of Metals and Alloys by Alternate Immersion in Neutral 3.5% Sodium Chloride Solution. ASTM International: West Conshohocken, PA, USA, 2013.
  14. Czerwinski, F. The reactive element effect on high-temperature oxidation of magnesium. Int. Mater. Rev. 2015, 60, 264–296. [Google Scholar] [CrossRef]
  15. Raghavan, V. Al–Gd–Mg (aluminum–gadolinium–magnesium). J. Phase Eqilib. Diffus. 2007, 28, 464–468. [Google Scholar] [CrossRef]
  16. Chen, H.; Zhang, K.; Yao, C.; Dong, J.; Li, Z.; Emmelmann, C. Effect of Al2Gd on microstructure and properties of laser clad Mg–Al–Gd coatings. Appl. Surf. Sci. 2015, 330, 393–404. [Google Scholar] [CrossRef]
  17. Wagner, C. Reaktionstypen bei der oxydation von legierungen. Z. Elektrochem. 1959, 63, 772–782. [Google Scholar] [CrossRef]
  18. Birks, N.; Meier, G.; Pettit, F. Introduction to the High-Temperature Oxidation of Metals; Cambridge University Press: Cambridge, UK, 2006; pp. 39–65. [Google Scholar]
  19. Wu, J.; Yuan, Y.; Yang, L.; Chen, T.; Li, D.; Wu, L.; Jiang, B.; Steinbrück, M.; Pan, F. The oxidation behavior of Mg-Er binary alloys at 500 °C. Corros. Sci. 2022, 195, 109961. [Google Scholar] [CrossRef]
  20. Cheng, C.; Le, Q.; Li, D.; Hu, W.; Wang, T.; Guo, R.; Hu, C. Effect of Y on high-temperature oxidation behavior and products of AZ80 alloy. Mater. Chem. Phys. 2021, 269, 124732. [Google Scholar] [CrossRef]
  21. Cheng, C.; Le, Q.; Hu, C.; Wang, T.; Liao, Q.; Li, X. Preparation of a novel robustness mineralized layer on surface of AZ80-0.38Nd (wt.%) alloy and investigation of its properties. Appl. Surf. Sci. 2022, 600, 153970. [Google Scholar] [CrossRef]
  22. Wang, L.; Snihirova, D.; Deng, M.; Wang, C.; Vaghefinazari, B.; Wiese, G.; Langridge, M.; Höche, D.; Lamaka, S.V. Insight into physical interpretation of high frequency time constant in electrochemical impedance spectra of Mg. Corros. Sci. 2021, 187, 109501. [Google Scholar] [CrossRef]
  23. Zhao, X.; Wang, Q.; Liu, W.; Yan, G.; Li, C.; Yang, L.; Zhou, Y. Biaxial stress in La2Ce2O7/YSZ thermal barrier coatings for oxidation evolution. Surf. Coat. Technol. 2022, 447, 128809. [Google Scholar] [CrossRef]
  24. Yan, G.; Sun, Y.; Zhao, X.; Liu, W.; Wang, Q.; Li, C.; Yang, L.; Zhou, Y. The enhanced thermal shock resistance performance induced by interface effect in blade-level La2Ce2O7/YSZ thermal barrier coating. Appl. Surf. Sci. 2023, 619, 156723. [Google Scholar] [CrossRef]
  25. Jia, G.; Liu, K.; Zheng, Y.; Song, Y.; Yang, M.; You, H. Highly uniform Gd(OH)3 and Gd2O3: Eu3+ nanotubes: Facile synthesis and luminescence properties. J. Phys. Chem. C 2009, 113, 6050–6055. [Google Scholar] [CrossRef]
  26. Available online: https://materialsproject.org/materials/mp-504886?formula=Gd2O3 (accessed on 20 February 2024).
  27. Wang, R.; Ji, Y.; Cheng, T.L.; Xue, F.; Chen, L.Q.; Wen, Y.H. Phase-field modeling of alloy oxidation at high temperatures. Acta Mater. 2023, 248, 118776. [Google Scholar] [CrossRef]
  28. Song, L.; Zhang, T.C.; Zhang, Y.; Chen, B.C.; Wu, M.; Zhou, S.Q.; Mei, Z. Simulations on the oxidation of Al-Mg alloy nanoparticles using the ReaxFF reactive force field. Mater. Today Commun. 2023, 35, 106180. [Google Scholar] [CrossRef]
  29. Cheng, C.; Chen, Z.; Yue, K.; Chen, C.; Liu, L.; Le, Q. Revealing the effect of Gd alloying on oxidation resistance and oxide film protection performance of AZ80 alloy. Mater. Chem. Phys. 2024, 315, 129082. [Google Scholar] [CrossRef]
  30. Cubides, Y.; Zhao, D.; Nash, L.; Yadav, D.; Xie, K.; Karaman, I.; Castaneda, H. Effects of dynamic recrystallization and strain-induced dynamic precipitation on the corrosion behavior of partially recrystallized Mg–9Al–1Zn alloys. J. Magnes. Alloy 2020, 8, 1016–1037. [Google Scholar] [CrossRef]
  31. Zhang, W.; Liu, Q.; Chen, Y.; Wan, G. Anodic dissolution dictates the negative difference effect (NDE) of magnesium corrosion more in chemical pathway. Mater. Lett. 2018, 232, 54–57. [Google Scholar] [CrossRef]
  32. Esmaily, M.; Svensson, J.E.; Fajardo, S.; Birbilis, N.; Frankel, G.S.; Virtanen, S.; Arrabal, R.; Thomas, S.; Johansson, L.G. Fundamentals and advances in magnesium alloy corrosion. Prog. Mater. Sci. 2017, 89, 92–193. [Google Scholar] [CrossRef]
  33. Atrens, A.D.; Gentle, I.; Atrens, A. Possible dissolution pathways participating in the Mg corrosion reaction. Corros. Sci. 2015, 92, 173–181. [Google Scholar] [CrossRef]
  34. Ma, Y.; Xiong, H.; Chen, B. Effect of heat treatment on microstructure and corrosion behavior of Mg-5Al-1Zn-1Sn magnesium alloy. Corros. Sci. 2021, 191, 109759. [Google Scholar] [CrossRef]
  35. Xu, R.Z.; Yang, X.B.; Li, P.H.; Suen, K.W.; Wu, S.; Chu, P.K. Eelectrochemical properties and corrosion resistance of carbon-ion-implanted magnesium. Corros. Sci. 2014, 82, 173–179. [Google Scholar] [CrossRef]
  36. Liu, Q.; Chen, G.Q.; Zeng, S.B.; Zhang, S.; Long, F.; Shi, Q.Y. The corrosion behavior of Mg-9Al-xRE magnesium alloys modified by friction stir processing. J. Alloys Compd. 2021, 851, 156835. [Google Scholar] [CrossRef]
  37. Liu, S.; Qi, Y.; Peng, Z.; Liang, J. A chemical-free sealing method for micro-arc oxidation coatings on AZ31 mg alloy. Surf. Coat. Technol. 2021, 406, 126655. [Google Scholar] [CrossRef]
  38. Reyes-Riverol, R.; Lieblich, M.; Fajardo, S. Corrosion resistance and anomalous hydrogen evolution in chloride containing solutions of extruded cast and powder metallurgical Mg-1Zn alloy. Corros. Sci. 2022, 208, 110635. [Google Scholar] [CrossRef]
  39. Feliu, S., Jr.; Samaniego, A.; Barranco, V.; El-Hadad, A.A.; Llorente, I.; Serra, C.; Galván, J.C. A study on the relationships between corrosion properties and chemistry of thermally oxidised surface films formed on polished commercial magnesium alloys AZ31 and AZ61. Appl. Surf. Sci. 2014, 295, 219–230. [Google Scholar] [CrossRef]
  40. Li, J.; Zhang, Z.; Guo, Z.; Yang, Z.; Qian, W.; Chen, Y.; Li, H.; Zhao, Q.; Xing, Y.; Zhao, Y. Improved corrosion resistance of ZrO2/MgO coating for magnesium alloys by manipulating the pore structure. J. Mater. Res. Technol. 2023, 24, 2403–2415. [Google Scholar] [CrossRef]
  41. Atrens, A.; Song, G.L.; Liu, M.; Shi, Z.; Cao, F.; Dargusch, M.S. Review of recent developments in the field of magnesium corrosion. Adv. Eng. Mater. 2015, 17, 400–453. [Google Scholar] [CrossRef]
  42. Wang, X.; Chen, Z.; Ren, J.; Kang, H.; Guo, E.; Li, J.; Wang, T. Corrosion behavior of as-cast Mg–5Sn based alloys with in additions in 3.5 wt% NaCl solution. Corros. Sci. 2020, 164, 108318. [Google Scholar] [CrossRef]
Figure 1. SEM microstructures of the AZ80 (a), AZ80-0.47Gd (b), and AZ80-0.75Gd (c) alloys with β-Mg17Al12 and Al2Gd phases energy dispersive X-ray spectroscopy analysis as well as normalized X-ray diffraction patterns (d).
Metals 14 00474 g001
Figure 2. The DSC curves of the AZ80, AZ80-0.47Gd, and AZ80-0.75Gd alloys.
Metals 14 00474 g002
Figure 3. The weight gain behaviors of alloy oxidation for 1 h (a), 3 h (b), and 4.5 h (c) at 420 °C in air and the n values (d).
Metals 14 00474 g003
Figure 4. The surface three-dimensional micrographs of the AZ80 (a), AZ80-0.47Gd (b), and AZ80-0.75Gd (c) alloys after 3 h exposure at 420 °C.
Metals 14 00474 g004
Figure 5. The micrographs of oxide films formed on the AZ80 (a,b), AZ80-0.47Gd (c,d), and AZ80-0.75Gd (e,f) alloys after 4.5 h of exposure at 420 °C.
Metals 14 00474 g005
Figure 6. The cross-sectional microstructures of the AZ80 (a,b), AZ80-0.47Gd (c), and AZ80-0.75Gd (d,e) alloys after 4.5 h of exposure at 420 °C.
Metals 14 00474 g006
Figure 7. The normalized XRD patterns (a) and partially enlarged image (b) of the oxide products of the AZ80 and AZ80-0.75Gd alloys.
Metals 14 00474 g007
Figure 8. The crystal structure of Gd2O3.
Metals 14 00474 g008
Figure 9. The potentiodynamic polarization curves of the AZ80-0.75Gd alloy with and without an oxide layer while soaking in 3.5 wt% NaCl solution for 1 h.
Metals 14 00474 g009
Figure 10. The EIS diagrams of the AZ80-0.75Gd samples after 1 h of soaking in 3.5 wt% NaCl solution: (a) Nyquist plots and (b) Bode plots of impedance modulus and phase angle.
Metals 14 00474 g010
Figure 11. Equivalent electrical circuits used for the simulation of EIS data in Figure 10: (a) sample without oxide film and (b) sample with oxide film.
Metals 14 00474 g011
Figure 12. Hydrogen evolution curves of AZ80-0.75Gd samples with and without an oxide layer immersed in 3.5 wt% NaCl solution.
Metals 14 00474 g012
Figure 13. The microscopic corrosion morphologies of the AZ80-0.75Gd samples without (ac) and with (df) an oxide layer after soaking for 12 h in 3.5 wt% NaCl solution.
Metals 14 00474 g013
Figure 14. Schematic illustration of the mechanism of Gd2O3 involvement in oxide film growth and nodulizing corrosion products.
Metals 14 00474 g014
Table 1. Chemical compositions of the experimental alloys (wt%).
AlloyAlZnMnGdOthersMgNamed
AZ808.120.570.33-<0.1Bal.AZ80
AZ80-0.5Gd8.210.520.350.47<0.1Bal.AZ80-0.47Gd
AZ80-0.8Gd8.180.560.370.75<0.1Bal.AZ80-0.75Gd
Table 2. Fitting results of the polarization curves in Figure 9.
SamplesEcorr (VSCE)icorr (A/cm2)
Without oxide film−1.511.6 × 10−3
With oxide film−1.486.7 × 10−5
Table 3. Fitted EIS data based on the equivalent circuit presented in Figure 11.
SampleRS
Ω·cm2
CPEdl
Ω−1·cm−2·sn
ndlRct
Ω·cm2
CPEO1
Ω−1·cm−2·sn
nO1RO1
Ω·cm2
CPEO2
Ω−1·cm−2·sn
nO2RO2
Ω·cm2
L
H·cm2
RL
Ω·cm2
χ2
Without15.742.56 × 10−51370.71.23 × 10−50.975.471.28 × 10−40.56245.5170.8711.51.5 × 10−3
With10.274.89 × 10−50.961182------------417738422.8 × 10−4
Disclaimer/Publisher’s Note: The statements, opinions and data contained in all publications are solely those of the individual author(s) and contributor(s) and not of MDPI and/or the editor(s). MDPI and/or the editor(s) disclaim responsibility for any injury to people or property resulting from any ideas, methods, instructions or products referred to in the content.

