1. Introduction
The aluminum alloy Al–Mg–Si is a combination of medium mechanical strength, good corrosion resistance, excellent formability, weldability, and easy recycling. The main alloying elements are Mg and Si, which provide heat treatment capabilities [
1].
As a result, it is widely used to make large casts with sophisticated structures for the transportation industry, including chassis frames and battery module housings for electric cars [
2]. The Al 6063 is known as a ternary Al–Mg–Si alloy; also, it can be considered a quaternary alloy since Fe is a controlled impurity. In the casting of primary or recycled aluminum alloys, Fe, Si, and Mg migrate to grain boundaries and interdendritic regions of the α-Al matrix during solidification. This promotes the formation of iron-enriched intermetallic compounds [
3].
Iron levels ranging from 0.4 to 0.8% in recycled aluminum scrap can have a detrimental effect on the alloy’s properties. This is particularly true for the formation of needle-shaped β-Al
5FeSi intermetallics during solidification, which can compromise mechanical properties, including ductility and fatigue strength. As such, careful attention is necessary to ensure that these high iron levels are appropriately managed to maintain the desired quality of the alloy [
4,
5].
Alloys containing Al–Mg–Si are not recommended for hot forming while in their cast state. This is due to the presence of particles, mainly consisting of β-Al
5FeSi, α-Al
8Fe
2Si, and Mg
2Si during solidification. Various factors such as alloy composition, cooling rate, and Fe content influence the morphology of Fe-rich phases. As for the solidification process, α-Al
8Fe
2Si typically forms at higher cooling rates than β-Al
5FeSi [
6].
The large size needle/platelet β-Al
5FeSi phase can induce severe casting defects and declined properties. The other kind of Fe-rich phase in Al–Mg–Si alloy is the α-AlFeSi phase, whose chemical formula is α-Al
8Fe
2Si (or α-Al
15Fe
3Si
2). Depending on the alloying elements and cooling conditions, the α-AlFeSi phase appears as hexagonal, star-like, dendritic, Chinese script, or globular shape. Hereinto, the needle-like β-AlFeSi phase deteriorates the mechanical properties since its sharp interfaces act as the location of high stress concentration. Conversely, the Chinese script-like α-AlFeSi phase is relatively harmless [
7,
8].
The homogenization process is critical for low-cost mechanical deformation without defects. It involves heat treatment to improve the quality of billets [
9,
10]. The heat treatment aims to dissolve particles of Mg
2Si and low-melting silicon, which cause cracking during the process. It also aims to obtain the phase transformation of β-Al
5FeSi to α-Al
12(FeMn)
3Si particles and spheroidize α particles, improving extrusion properties [
11,
12].
The process of homogenization treatment involves the formation of globular phases, reduction of segregation, and precipitation of dispersoids. In Al–Mn–Fe–Si (–Mg) alloys, the term dispersoid refers to intermetallic particles usually on a nanoscale level. The type of dispersoids formed in Al–Mn–Fe–Si alloys depends on the total quantity of Si present. For alloys with low Si content, the dispersoids are generally in the form of the plate-like Al
6FeMn phase, whereas, for alloys with high Si content, the dispersoids are in the cubic α-Al(FeMn)Si phase [
13].
To reduce the fragility of the intermetallic compound β-AlFeSi, researchers have focused on changing the morphology of this phase. One method adds elements like Be, Mn, Cr, or V that promote dispersoid formation. Among these elements, manganese is the most efficient. Manganese acts as a catalyst and increases the phase transformation rate from β-AlFeSi to α-Al(FeMn)Si at high holding temperatures. The resulting α-Al(MnFe)Si phase has a body-centered cubic structure and is known for its Chinese-script morphology [
14,
15].
A study suggest that the stability zones of the αH-AlFeSi (hexagonal) and αc-AlFeMnSi (cubic) phases are limited to a concentration range where the weight of Mn is less than 0.5% [
16].
Adding Mn to aluminum–silicon alloys increases the total number of intermetallic compounds containing (Fe + Mn), such as Al
6FeMn and AlFeMnSi. To promote the precipitation of the α-Fe phase, it is recommended to maintain an Fe/Mn ratio greater than 0.5 [
17]. As a common alloying element, Mn has a relatively low cost and is generally used for alloy strengthening. Moreover, the addition of Mn can eliminate the β-AlFeSi phase and promote the formation of the α-Al(FeMn)Si phase, which is beneficial for the mechanical properties [
18].
The solidification conditions and the presence of other elements such as Cu and Mg lessen the efficiency of Mn in aluminum–silicon alloys. However, the phase transformation from the β plate-like form to α with the Chinese-script form is not completely inhibited, even with a Mn/Fe ratio of up to 2. When the Mn/Fe ratio is around 1.2, the intermetallic phase β-Al
5FeSi is wholly converted to the α-Al
13(FeMn)
4Si
2 phase [
19].
Table 1 shows the phases present in the 6XXX series [
20].
A recent work reports the analysis of variables like that of this study, which are the effect of variations in the Mn/Cr ratios (0.5–8) on the precipitation behavior of dispersoids in 6XXX series aluminum alloys, with homogenization thermal treatment at different temperatures 500, 530, and 560 °C and residence times of 0–24 h [
21]. Another study analyzed the individual and synergistic effects of Mn and Cu on the microstructure evolution and mechanical properties [
22].
The objective of this research is to analyze the impact of the Fe/Mn ratio on microstructural alterations that occur during homogenization heat treatment, specifically how this ratio influences the β→α transformation and its behavior during mechanical forming. To evaluate the microstructural changes in the β and α phases, a homogenization heat treatment on the alloy using varying Fe/Mn ratios (0.5, 0.75, and 1) was performed and halted at a temperature of 575 °C for 12 h; the samples were cooled in water at room temperature every 30 min until we reached a total time of 660 min. Subsequently, we mechanically roughed the samples with SiC paper from #80 to #2400, polished them with 3 and 1 μm diamond paste, and finished them with 0.06 μm colloidal silica to attain a mirror-like finish. Lastly, we prepared the samples for microstructural analysis.
Scanning electron microscopy was used to conduct point analyses and elemental mappings of the intermetallic presents in the casting and heat treatment samples. Also, X-ray diffraction was utilized to determine the stoichiometry of the phases present. The results showed that the β-Al6FeMn and α-Al15(FeMn)3Si2 phases are in the cast structure and the phase β-Al6FeMn is transformed into phase α-Al15(FeMn)3Si2 when the heat treatment ends.
2. Materials and Methods
To manufacture preforms, the raw material (aluminum profile) is melted. The raw material needed to obtain the AA6063 alloy was prepared using aluminum profile scrap in a 50 kg silicon carbide crucible gas furnace. This process results in ingots with the same chemical composition.
Table 2 shows the results obtained.
An induction furnace with a capacity of 14 kg was used to obtain the preforms. The process consisted of melting the raw material to obtain liquid metal. Once this step was complete, the required amount of Fe determined for each of the Fe/Mn ratios was added in the form of a wire at 850 °C. A time of 1 h was provided to ensure its dissolution in the metal bath with mechanical agitation for 15 min. The next stage involved adding the determined amount of Mn flakes at 850 °C without mechanical agitation. Finally, argon gas was injected into the metal bath to degas for 10 min. The final stage involves the removal of the liquid metal. This was conducted at a temperature of 750 °C, using a steel mold preheated to 450 °C with a rectangular shape in a vertical position. The process was repeated for each Fe/Mn ratio used. The chemical composition of the alloys was determined by atomic emission spectroscopy.
Table 3 shows the alloys’ chemical composition and Fe/Mn ratios.
The obtained preforms have dimensions of 381 mm length, 102 mm width, and 12.7 mm thickness. These preforms had a rectangular shape and underwent a homogenization heat treatment at a temperature of 575 °C for 11 h. A sample was obtained every 30 min until reaching 11 h. After the heat treatment, they were cooled in water at room temperature. This heat treatment aimed to analyze its effect on the precipitation of the phases β and α for each of the different Fe/Mn ratios.
The samples were sectioned and prepared for microstructural analysis by being first mechanically roughed with SiC paper from #80 to #2400. Then, they were polished with 3 and 1 μm diamond paste, and, finally, finished with a mirror-like finish using 0.06 μm colloidal silica.
The specimens underwent chemical exposure to the Keller reagent, which comprises 2 mL HF, 3 mL HCl, 5 mL HNO3, and 190 mL H2O. This reagent made it possible to expose the β and α phases, which are distinguished by distinct coloration. To assess the percentages of each phase present in each condition, for the Fe/Mn ratio and heat treatment time, Image-Pro 6.0 software was utilized. To capture measurements and quantify the phases, 10 field micrographs were taken of each sample using a Keyence optical microscope VHX-6000 (Keyence, Osaka, Japan) and Image-Pro Plus 6.0 software.
A JEOL model JSM-7800F PRIME scanning electron microscope (JEOL Ltd., Akijima, Japan) with a BRUKER QUANTAX EDS microanalysis system was used to obtain micrographs of cast and heat-treated samples after 660 min. The microstructure was analyzed to determine the presence and quantification of each element present in the intermetallic compounds of each sample. Elemental mappings were carried out to carry out this analysis. Additionally, BRUKER model D8 ADVANCE ECO X-ray diffraction equipment (Bruker, Billerica, MA, USA) was used to examine the samples. The results obtained were analyzed with Match! 3 software version 3.16 Build 288 to determine which phase corresponds to the intermetallics present in the microstructure. The Inorganic Crystal Structure Database (ICSD) and the Match! 3 software were used for the analysis of the diffraction patterns obtained from each of the samples.
Author Contributions
Conceptualization J.T.T. and A.F.V.; methodology, A.G.A., J.T.T. and A.F.V.; software A.G.A.; validation, A.G.A., J.T.T. and A.F.V.; formal analysis, A.G.A., J.T.T. and A.F.V.; investigation, A.G.A., J.T.T. and A.F.V.; resources, J.T.T. and A.F.V.; data curation, A.G.A. and J.T.T.; writing—original draft preparation, A.G.A.; writing—review and editing, J.T.T. and A.F.V.; visualization, J.T.T. and A.F.V.; supervision, J.T.T. and A.F.V.; project administration, J.T.T. and A.F.V.; funding acquisition, J.T.T. and A.F.V. All authors have read and agreed to the published version of the manuscript.
Funding
The research work was carried out with economic resources and in Cinvestav-Saltillo. laboratories. A.F.V., J.T.T., and A.G.A. would like to thank CONAHCYT (Consejo Nacional de Humanidades, Ciencias y Tecnologías: 20450002) for the financial support.
Data Availability Statement
The raw data supporting the conclusions of this article will be made available by the authors on request.
Acknowledgments
Marco Antonio Leyva Ramirez and Cinvestav-Zacatenco for technical support.
Conflicts of Interest
The authors declare no conflicts of interest.
References
- Yan, L.Z.; Zhang, Y.G.; Li, X.W.; Li, Z.H.; Wang, F.; Liu, H.W.; Xiong, B.Q. Investigation of the microstructure evolution of 6016 aluminum alloy during homogenization. Adv. Mater. Res. 2013, 668, 784–788. [Google Scholar] [CrossRef]
- Singh, P.; Ramacharyulu, D.A.; Kumar, N.; Saxena, K.K.; Eldin, S.M. Change in the structure and mechanical properties of Al-Mg-Si alloys caused by the addition of other elements: A comprehensive review. J. Mater. Res. Technol. 2023, 27, 1764–1796. [Google Scholar] [CrossRef]
- Whalen, S.; Overman, N.; Taysom, B.S.; Bowden, M.; Reza-E-Rabby, M.; Skszek, T.; DiCiano, M. Effect of high iron content on direct recycling of unhomogenized aluminum 6063 scrap by Shear Assisted Processing and Extrusion. J. Manuf. Process. 2023, 97, 115–124. [Google Scholar] [CrossRef]
- Puncreobutr, C.; Phillion, A.; Fife, J.; Rockett, P.; Horsfield, A.; Lee, P. In situ quantification of the nucleation and growth of Fe-rich intermetallics during Al alloy solidification. Acta Mater. 2014, 79, 292–303. [Google Scholar] [CrossRef]
- Medvecká, D.; Kuchariková, L.; Uhríčik, M. The failure degradation of recycled aluminum alloys with high content of β-Al5FeSi intermetallic phases. Trans. Tech. Publ. 2020, 403, 97–102. [Google Scholar]
- Alvarez-Antolin, F.; Asensio-Lozano, J.; Cofiño-Villar, A.; Gonzalez Pociño, A. Analysis of different solution treatments in the transformation of β-AlFeSi particles into α-(FeMn)Si and their Influence on different ageing treatments in Al-Mg-Si alloys. Metall. J. 2020, 10, 620. [Google Scholar] [CrossRef]
- Wang, X.; Ma, P.-K.; Zhang, S.-Y.; Liu, X.; Wang, C.; Wang, D.-W.; Wang, H.-Y. High-ductility AA6061 alloys produced by combination of sub-rapid solidification and Cr-alloying. J. Mater. Res. Technol. 2022, 18, 1566–1577. [Google Scholar] [CrossRef]
- Liu, X.; Wang, C.; Zhang, S.-Y.; Song, J.-W.; Zhou, X.-L.; Zha, M.; Wang, H.-Y. Fe-bearing phase formation, microstructure evolution, and mechanical properties of Al-Mg-Si-Fe alloy fabricated by the twin-roll casting process. J. Alloys Compd. 2021, 886, 161202. [Google Scholar] [CrossRef]
- Katsivarda, M.; Vazdirvanidis, A.; Pantazopoulos, G.; Kolioubas, N.; Papadopoulou, S.; Rikos, A.; Spiropoulou, E.; Papaefthymiou, S. Investigation of the effect of homogenization practice of 6063 alloy billets on beta to alpha transformation and of the effect of cooling rate on precipitation kinetics. Mater. Sci. Forum 2018, 941, 884–889. [Google Scholar] [CrossRef]
- Uttarasak, K.; Chongchitnan, W.; Matsuda, K.; Chairuangsri, T.; Kajornchaiyakul, J.; Banjongprasert, C. Evolution of Fe-containing intermetallic phases and abnormal grain growth in 6063 aluminum alloy during homogenization. Results Phys. 2019, 15, 102535. [Google Scholar] [CrossRef]
- Bayat, N.; Carlberg, T.; Cieslar, M. In-situ study of phase transformations during homogenization of 6005 and 6082 Al alloys. J. Alloys Compd. 2017, 725, 504–509. [Google Scholar] [CrossRef]
- Liu, C.L.; Azizi-Alizamini, H.; Parson, N.C.; Poole, W.J.; Du, Q. Microstructure evolution during homogenization of Al-Mg-Si-Mn-Fe alloys: Modelling and experimental results. Trans. Nonferrous Met. Soc. China 2017, 27, 747–753. [Google Scholar] [CrossRef]
- Kemsies, R.H.; Milkereit, B.; Wenner, S.; Holmestad, R.; Kessler, O. In situ DSC investigation into the kinetics and microstructure of dispersoid formation in Al-Mn-Fe-Si(-Mg) alloys. Mater. Des. 2018, 146, 96–107. [Google Scholar] [CrossRef]
- Warmuzek, M. Solidification path of the AlFeMnSi alloys in a stage of primary intermetallic phases precipitation. Trans. Foundry Res. Inst. 2015, 55, 51–60. [Google Scholar]
- Gao, T.; Hu, K.; Wang, L.; Zhang, B.; Liu, X. Morphological evolution and strengthening behavior of α-Al(Fe,Mn)Si in Al–6Si–2Fe–xMn alloys. Results Phys. 2017, 7, 1051–1054. [Google Scholar] [CrossRef]
- Österreicher, J.A.; Kumar, M.; Schiffl, A.; Schwarz, S.; Bourret, G.R. Secondary precipitation during homogenization of Al-Mg-Si alloys: Influence on high temperature flow stress. Mater. Sci. Eng. A 2017, 687, 175–180. [Google Scholar] [CrossRef]
- Zhao, Q.; Qian, Z.; Cui, X.; Wu, Y.; Liu, X. Influences of Fe, Si and homogenization on electrical conductivity and mechanical properties of dilute Al-Mg-Si alloy. J. Alloys Compd. 2016, 666, 50–57. [Google Scholar] [CrossRef]
- Liu, X.; Jia, H.L.; Wang, C.; Wu, X.; Zha, M.; Wang, H.Y. Enhancing mechanical properties of twin-roll cast Al–Mg–Si–Fe alloys by regulating Fe-bearing phases and macro-segregation. Mater. Sci. Eng. A 2022, 831, 142256. [Google Scholar] [CrossRef]
- Baldan, R.; Malavazi, J.; Couto, A. Microstructure and mechanical behavior of Al9Si0.8Fe alloy with different Mn contents. Mater. Sci. Technol. 2017, 33, 1192–1199. [Google Scholar] [CrossRef]
- Rosefort, M.; Matthies, C.; Buck, H.; Koch, H. Using SEM and EDX for a simple differentiation of α- and β-AlFeSi-Phases in Wrought Aluminum Billets. In Light Metals 2011: The Minerals; Lindsay, S.J., Ed.; Metals & Materials Society: Pittsburgh, PA, USA, 2011; pp. 711–716. [Google Scholar]
- Liu, F.; Zhu, X.; Qin, J.; Zhou, W.; Ling, J.; Dong, Q.; Yu, J.; Nagaumi, H.; Zhang, B. Effect of Mn/Cr ratio on precipitation behaviors of α-Al(FeMnCr)Si dispersoids and mechanical properties of Al–Mg–Si–Cu alloys. Mater. Sci. Eng. A 2022, 860, 144269. [Google Scholar] [CrossRef]
- Liu, X.; Ma, Y.-L.; Wang, X.; Zhang, S.-Y.; Zhang, M.-X.; Wang, H.-Y. Enhanced long-term thermal stability and mechanical properties of twin-roll cast Al–Mg–Si alloys with Mn and Cu additions. Mater. Sci. Eng. A 2023, 872, 144945. [Google Scholar] [CrossRef]
- Alexander, D.T.L.; Greer, A.L. Nucleation of the Al6(Fe,Mn)- to-α-Al–(Fe,Mn)–Si transformation in 3XXX aluminium alloys. I. Roll-bonded diffusion couples. Philos. Mag. 2004, 84, 3051–3070. [Google Scholar] [CrossRef]
- Trømborg, E.; Dons, A.L.; In, L.A.; Lohne, O.; Nes, E.; Ryum, N. (Eds.) Aluminium Alloys: Their Physical and Mechanical Properties: ICAA3; SINTEF Metallurgy: Trondheimin, Norway, 1992; pp. 270–275. [Google Scholar]
- Alexander, D.; Greer, A. Solid-state intermetallic phase tranformations in 3XXX aluminium alloys. Acta Mater. 2002, 50, 2571–2583. [Google Scholar] [CrossRef]
- Anyalebechi, P.N. Effects of silicon, iron, and chromium on the response of aluminum alloy 3004 ingots to homogenization. In Proceedings of the TMS Annual Meeting, New Orleans, LA, USA, 9–13 March 2008; pp. 201–218. [Google Scholar]
- Qian, X.; Parson, N.; Chen, X.G. Effect of homogenization treatment and microalloying with Mn on the microstructure and hot workability of AA6060 aluminum alloys. J. Mater. Eng. Perform. 2019, 28, 4531–4542. [Google Scholar] [CrossRef]
- Trink, B.; Weißensteiner, I.; Uggowitzer, P.J.; Strobel, K.; Pogatscher, S. High Fe content in Al-Mg-Si wrought alloys facilitates excellent mechanical properties. Scr. Mater. 2022, 215, 114701. [Google Scholar] [CrossRef]
- Song, D.F.; Zhao, Y.L.; Wang, Z.; Jia, Y.-W.; Li, D.-X.; Fu, Y.-N.; Zhang, D.-T.; Zhang, W.-W. 3D Fe-Rich Phases Evolution and Its Effects on the Fracture Behavior of Al–7.0Si–1.2Fe Alloys by Mn Neutralization. Acta Metall. Sin. 2022, 35, 163–175. [Google Scholar] [CrossRef]
- Song, D.F.; Jia, Y.; Li, Q.; Zhao, Y.; Zhang, W. Effect of Initial Fe Content on Microstructure and Mechanical Properties of Recycled Al-7.0Si-Fe-Mn Alloys with Constant Mn/Fe Ratio. Materials 2022, 15, 1618. [Google Scholar] [CrossRef]
- Aguilar, I.G.; Torres, J.T.; Valdés, A.F.; Saldivar, A.A.F. The effect of interrumped homogenization on β-Al5FeMnSi→α-Alx(Fe and Mn)Si transformation in the A6063 aluminum alloy. Metals 2022, 12, 2117. [Google Scholar] [CrossRef]
Figure 1.
Micrographs of cast samples (a–c) and homogenized samples (d–f) taken at 500× magnification.
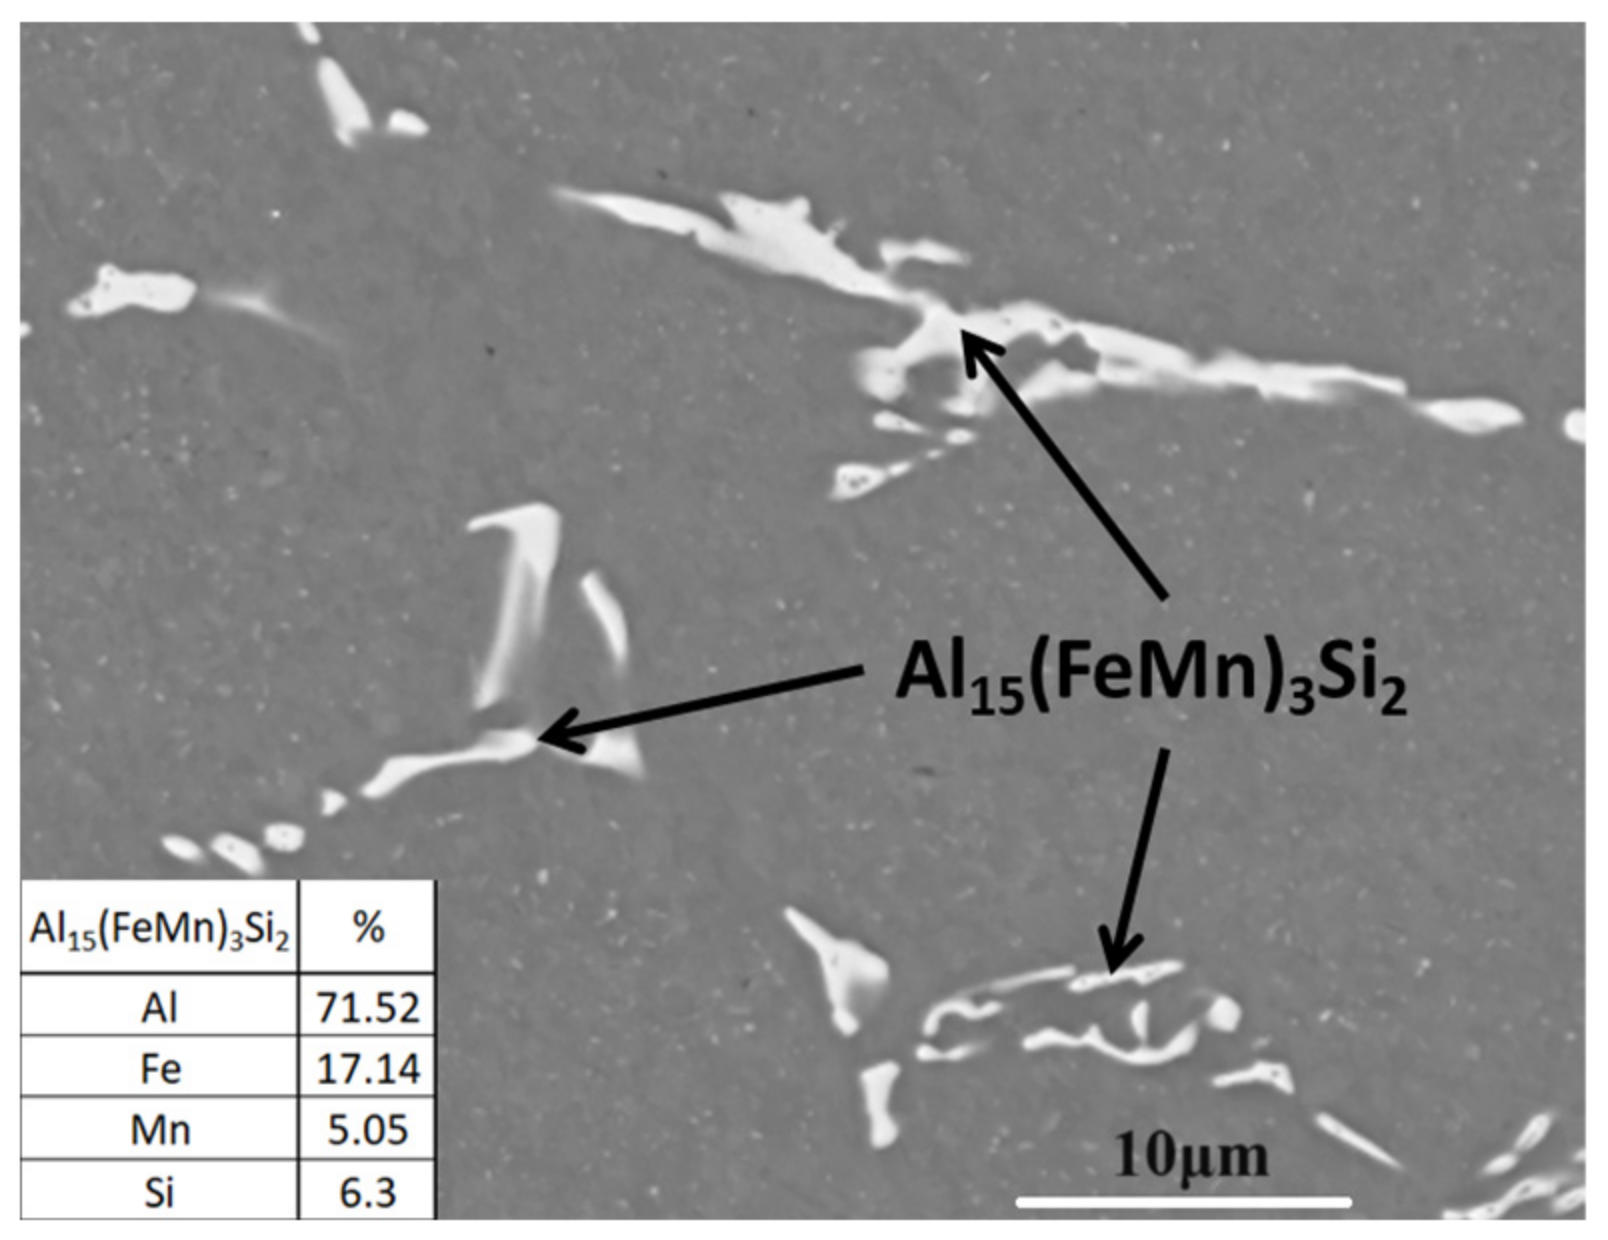
Figure 2.
SEM micrograph of a cast sample with an Fe/Mn ratio of 0.5.
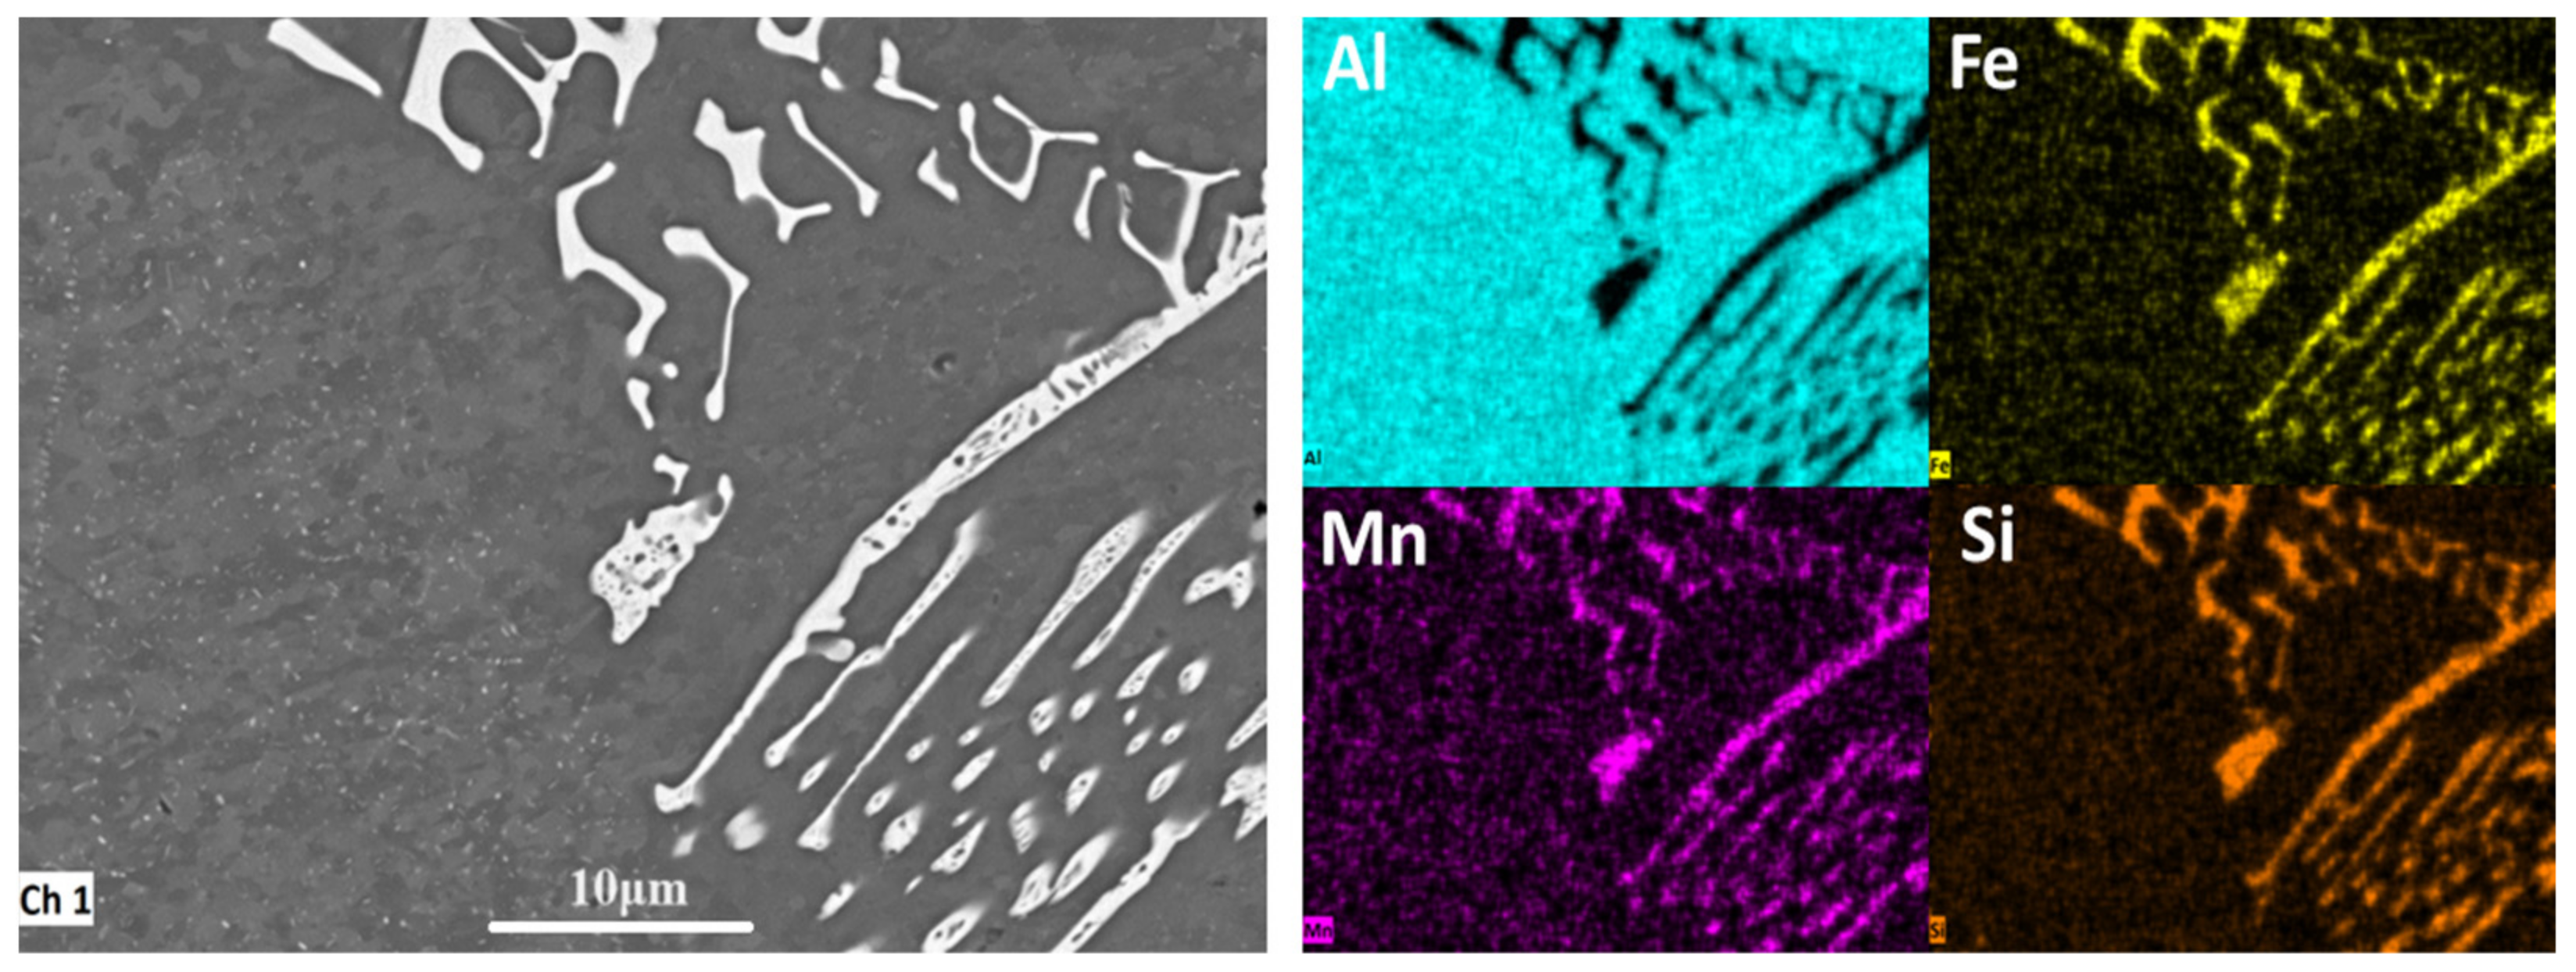
Figure 3.
Elemental mapping using EDS on a cast sample with an Fe/Mn ratio of 0.5.
Figure 4.
SEM micrograph of a sample homogenized for 660 min, with an Fe/Mn ratio of 0.5.
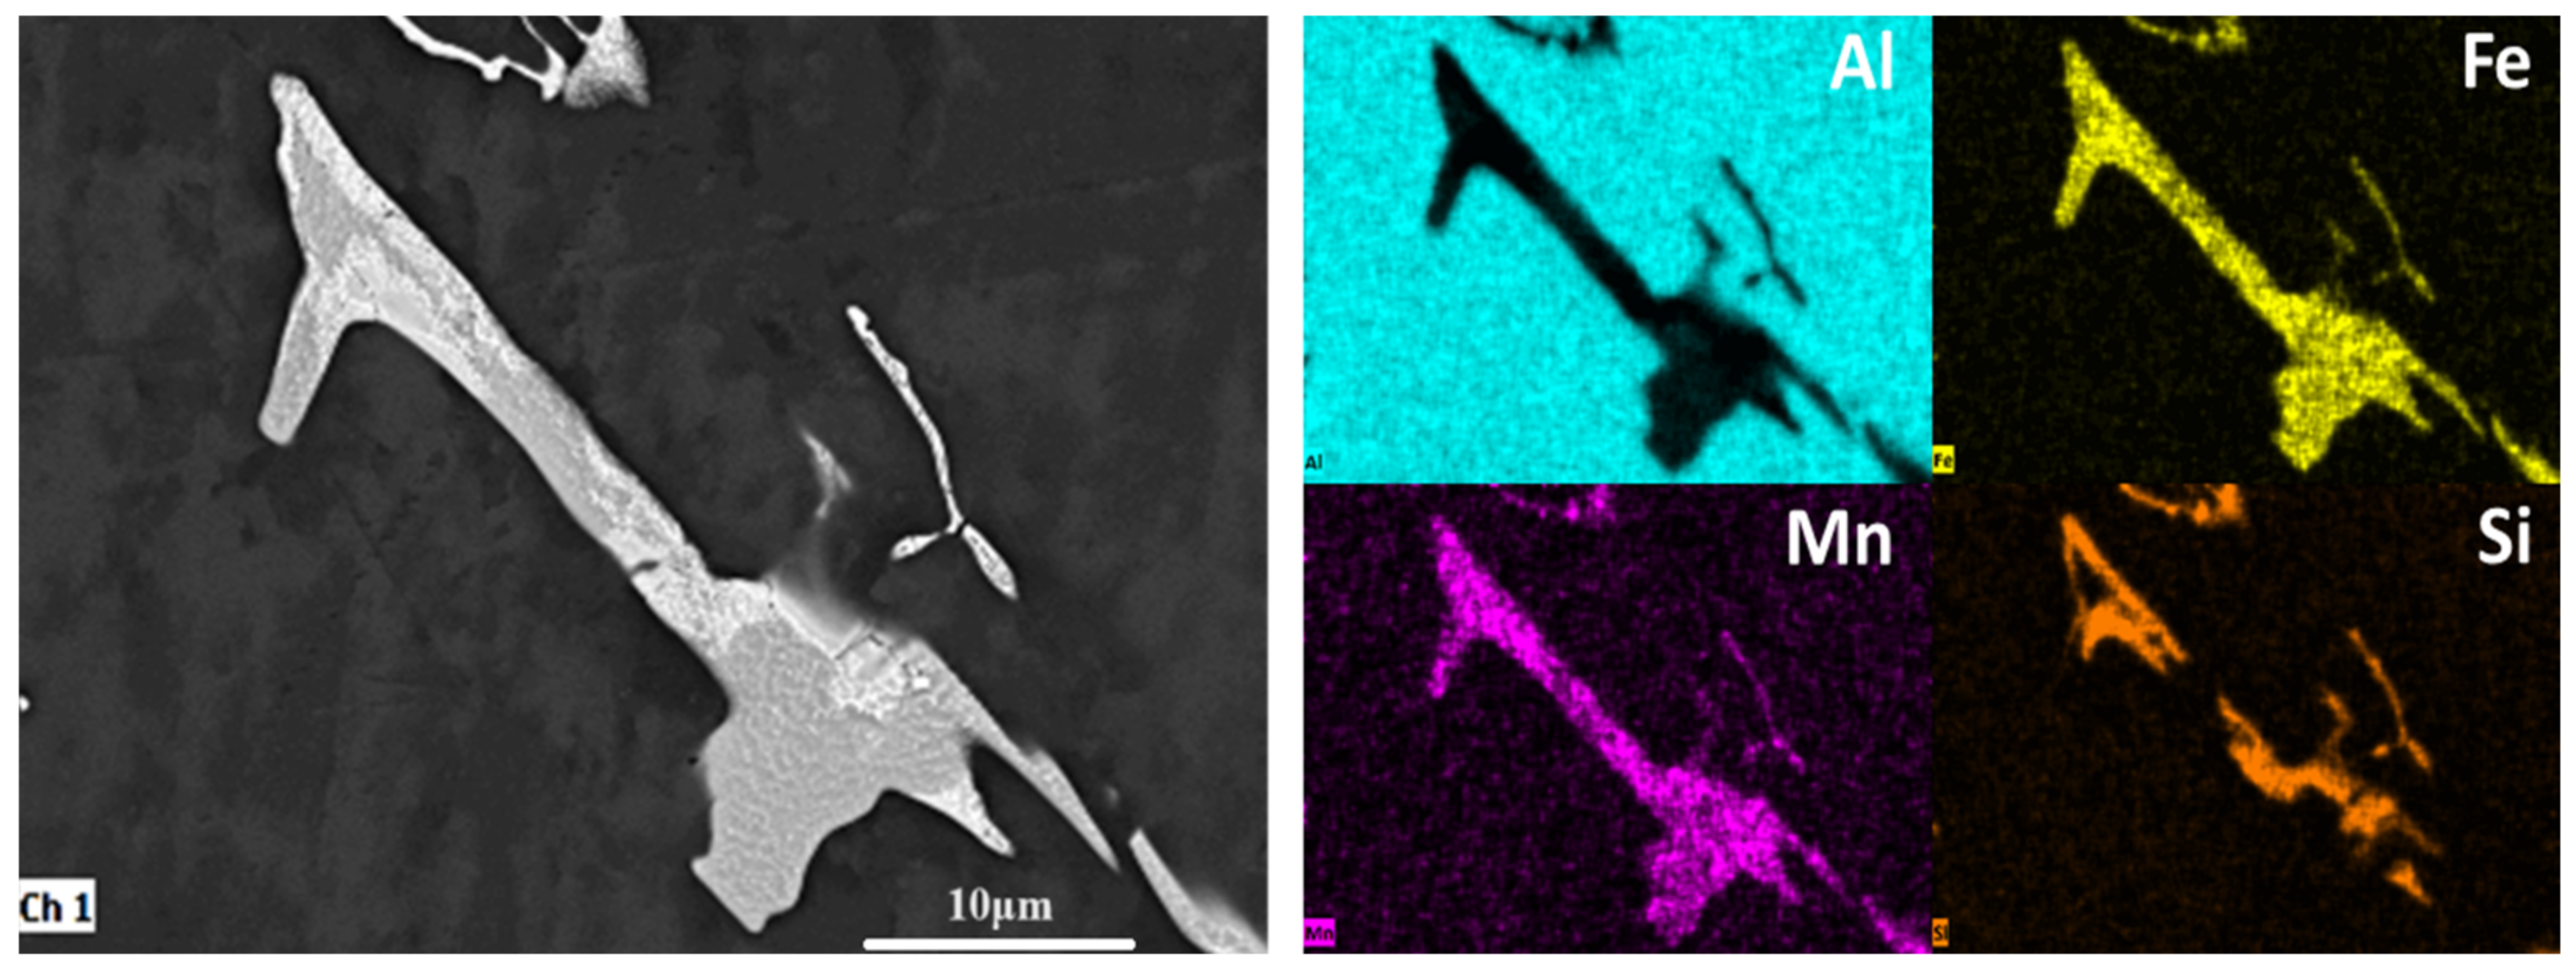
Figure 5.
Elemental mapping using EDS on a sample homogenized for 660 min, with an Fe/Mn ratio of 0.5.
Figure 6.
SEM micrograph of a cast sample with an Fe/Mn ratio of 0.75.
Figure 7.
Elemental mapping using EDS on a cast sample with an Fe/Mn ratio of 0.75.
Figure 8.
SEM micrograph of a sample homogenized for 660 min with an Fe/Mn ratio of 0.75.
Figure 9.
Elemental mapping using EDS on a sample homogenized for 660 min with an Fe/Mn ratio of 0.75.
Figure 10.
SEM micrograph of a cast sample with an Fe/Mn ratio of 1.
Figure 11.
Elemental mapping using EDS on a cast sample with an Fe/Mn ratio of 1.
Figure 12.
SEM micrograph of a sample homogenized for 660 min with an Fe/Mn ratio of 1.
Figure 13.
Elemental mapping using EDS on a sample homogenized for 660 min with an Fe/Mn ratio of 1.
Figure 14.
X-ray diffraction patterns with different Fe/Mn ratios: (a) 0.5, (b) 0.75, and (c) 1.
Figure 15.
Micrographs of samples attacked with Keller reagent for the quantification of the β and α phases.
Figure 16.
Percentage of β and α phase for Fe/Mn ratios: (a) 0.5, (b) 0.75, and (c) 1, with homogenization heat treatment at 575 °C.
Table 1.
Intermetallic phases in the 6xxx series.
| Phase | Structure | Stoichiometry |
|---|
| αc(α)AlFeSi | Cubic | Al12Fe3Si,
Al12-15Fe3Si1-2 |
| | Cubic | Al12(FeMn)3Si,
Al15(FeMn)3Si2 |
| | Cubic | Al12Mn3Si,
Al15Mn3Si2,
Al9Mn2Si |
| αh(α’)-AlFeSi | hexagonal | Al8Fe2Si |
| β-AlFeSi | monoclinic | Al4.5FeSi |
Table 2.
Chemical composition of the ingots (%wt).
| Si | Fe | Mn | Mg | Cu | Zn | Others | Al |
|---|
| 0.55 | 0.237 | 0.014 | 0.23 | 0.03 | 0.02 | 0.019 | Bal |
Table 3.
The chemical composition (%wt) and Fe/Mn ratios of the alloys used in this study.
| Fe/Mn | Si | Fe | Mn | Mg | Cu | Zn | Others | Al |
|---|
| 1 | 0.55 | 0.7 | 0.7 | 0.23 | 0.3 | 0.02 | 0.019 | Bal |
| 0.75 | 0.55 | 0.6 | 0.8 | 0.23 | 0.3 | 0.02 | 0.019 | Bal |
| 0.5 | 0.55 | 0.55 | 1.1 | 0.23 | 0.3 | 0.02 | 0.019 | Bal |
Table 4.
Crystallographic information of the analyzed phases.
| Phase | Crystal System | Stoichiometry | Space Group | Cell Parameters |
|---|
| β-AlFeMn | Orthorhombic | Al6FeMn | C m c m (63) | a = 7.49800 Å
b = 6.49500 Å
c = 8.83700 Å |
| α-Al(FeMn)Si | Cubic | Al15(FeMn)3Si2 | P m-3 (200) | a = 12.5600 Å |
Table 5.
Results of the quantification for the percentages of the transformed fraction β and α phases.
| Time | Ratio |
|---|
| Fe/Mn = 0.5 | Fe/Mn = 0.75 | Fe/Mn = 1 |
|---|
| Min | β
(%) | α
(%) | β
(%) | α
(%) | β
(%) | α
(%) |
|---|
| As cast | 2.69 | 0 | 2.92 | 0 | 2.90 | 0 |
| 120 | 2.19 | 0.50 | 2.32 | 0.60 | 2.58 | 0.32 |
| 210 | 1.99 | 0.70 | 2.17 | 0.75 | 2.37 | 0.53 |
| 240 | 1.83 | 0.86 | 2.10 | 0.82 | 2.31 | 0.59 |
| 270 | 1.75 | 0.94 | 2.02 | 0.90 | 2.23 | 0.67 |
| 300 | 1.64 | 1.05 | 1.89 | 1.03 | 2.10 | 0.80 |
| 330 | 1.53 | 1.16 | 1.79 | 1.13 | 2.09 | 0.81 |
| 360 | 1.3 | 1.39 | 1.71 | 1.21 | 1.92 | 0.98 |
| 390 | 1.15 | 1.54 | 1.65 | 1.27 | 1.81 | 1.09 |
| 420 | 0.98 | 1.71 | 1.4 | 1.52 | 1.70 | 1.20 |
| 450 | 0.76 | 1.93 | 1.12 | 1.80 | 1.62 | 1.28 |
| 540 | 0 | 2.69 | 0.72 | 2.20 | 1.32 | 1.58 |
| 660 | 0 | 2.69 | 0.4 | 2.52 | 0.81 | 2.09 |
| Total (%) | 0 | 100 | 14 | 86 | 28 | 72 |
| Disclaimer/Publisher’s Note: The statements, opinions and data contained in all publications are solely those of the individual author(s) and contributor(s) and not of MDPI and/or the editor(s). MDPI and/or the editor(s) disclaim responsibility for any injury to people or property resulting from any ideas, methods, instructions or products referred to in the content. |
© 2024 by the authors. Licensee MDPI, Basel, Switzerland. This article is an open access article distributed under the terms and conditions of the Creative Commons Attribution (CC BY) license (https://creativecommons.org/licenses/by/4.0/).


