Article

Movement Strategy Influences on the Characteristics of Low-Carbon Steel Generated by the Lamination Object Manufacturing Method

1
School of Industrial Engineering and Management, International University—Vietnam National University HCMC, Ho Chi Minh City 71307, Vietnam
2
Faculty of Mechanical Engineering, HCMC University of Technology and Education, Ho Chi Minh City 71307, Vietnam
*
Author to whom correspondence should be addressed.
Metals 2024, 14(3), 356; https://doi.org/10.3390/met14030356
Submission received: 22 February 2024 / Revised: 13 March 2024 / Accepted: 16 March 2024 / Published: 19 March 2024

Abstract

:
This paper investigates the effects of heating movement techniques on the properties of low-carbon steel samples that are 3D printed using S20C lamination object manufacturing (LOM). A Tungsten iner gas (TIG) machine and a computer numerical control (CNC) machine were used together to join the steel sheet. The LOM samples were created with a straight-profile, short-profile, cross-profile, and curved-profile. The results indicate that the majority of the samples had a grain size number of 7–9. The samples exhibited an isotropy grain shape. The LOM samples exhibited dimples, which suggests ductility fractures. Pore flaws showed up in the microstructure of the cross-profile and short-profile samples during the LOM process. The samples with curved- and straight-profiles had a better microstructure. In comparison to samples with a short profile and a cross-profile, the samples with a straight-profile and a curved-profile had a superior combination of ultimate tensile strengths (UTSs) and elongation value. The straight- and curved-profiles’ greater elongation and tensile strength can be attributed to their improved microstructure and finer grain size. A straight-profile sample with an elongation value of 25.6% and a UTS value of 430 MPa was the ideal LOM sample. Conversely, the weakest sample was the LOM sample with a cross-profile, which had an elongation value of 10.8% and a UTS value of 332.5 MPa. This research could provide further information about the LOM method and the best straight-profile movement strategy. A suitable TIG gun movement strategy could produce a good LOM sample with a good microstructure, tensile strength, and ductility. Further research should incorporate more movement strategies and techniques that completely prevent the formation of pore defects.

1. Introduction

Recently, 3D printing has become a popular manufacturing technique. Three-dimensional printing could overcome the challenges of complex shapes, rapid prototype requirements, and the high cost to which conventional manufacturing techniques are limited [1,2,3]. The initial material type can vary from polymers, metals and alloys, ceramics, foods, and biomaterials [4,5,6,7,8]. The metallic 3D printing parts achieve excellent mechanical properties with a high strength and toughness that can be directly used in industrial applications [9,10,11,12].
In 3D printing, the material’s shape can be liquid, powder, wire, or sheet shapes [13,14,15]. The smaller the material shape, the higher the energy consumption required to build the 3D printing parts. Therefore, the sheet shape could save more energy than the other shapes during the printing process [16,17,18]. Many authors have investigated the 3D printing process using sheet-shaped materials. For example, Bhatt et al. [19] investigated the lamination object manufacturing (LOM) process by adding heterogeneous objects and inclusions between layers by using robotics during the manufacturing process. This study pinpointed benefits including a high speed, the ability to join many types of materials, large-scale part capacity, and low cost. The study also predicted that a higher rate of automatic and more complex shapes could be the future of the LOM process. Furthermore, the robotics application can also fabricate the LOM part with the desired layer orientation with less material waste. Parandoush et al. [20] report a novel fabrication process for a carbon fiber-reinforced thermoplastic composite by laminated object manufacturing. The sheets are bonded using a laser beam and roller system, creating an ultra-high-strength composite with a tensile strength of 668.3 MPa and a flexural strength of 591.6 MPa with a lightweight advance. By using computed tomography scans, the void content of the LOM sample is low. The lap shear strength tests show that the interlaminar bonding strength is comparable to that of the traditional autoclave approach. Furthermore, the suggested method makes it possible to regulate the alignment of carbon fiber in printed layers. The suggested 3D printing approach can be beneficial for fields demanding high-performance, lightweight structural materials with complicated geometries.
Olivier et al. [21] found the best orientation for the LOM method to achieve the highest value of flexural strength. They conducted four samples with different building orientations. Thereafter, the samples underwent a four-point flexural loading test. Additionally, it has been discovered that every tested condition has a repeating failure pattern. The orientation has a strong effect on the mechanical properties of the LOM samples. The study indicated that the best orientation for the highest strength value is 45°. Kumar et al. [22] also reported the LOM process with polylactic acid material. They divided them into many pieces after printing and then joined them to test their mechanical properties. The highest compressive strength of the sample was 42.47 MPa, generated with 70% infill, a honeycomb pattern, and a 3.4 mm thickness in each layer. Applying the Taguchi method, the study also revealed that the infill pattern is the most important factor that strongly impacts compressive strength. Furthermore, Dermeik et al. [23] examined the LOM process with ceramic-based materials. The study indicated that this technique could be applied to SiC, Al2O3, Si3N4, glass, and AlN ceramics. Moreover, the special advantages of the LOM process compared to other additive manufacturing processes are the large-scale parts and rapid speed. The ceramic-based LOM part with function porosity could be applied in energy generation, security, aerospace, and electronic devices. Prechtl et al. [24] surveyed the LOM process by using metal foil. Initially, the metal foil is cut by a laser cutting machine. After that, the metal foils are joined together by soldering or diffusion welding. Interestingly, Obikawa et al. [25] investigated the LOM process with a 0.2 mm-thick steel sheet coated with a 40 µm low melting temperature alloy. The steel sheets were pressed to create the laminated products with the assistance of an induction heater. Thereafter, the laminated sheets were cut to the desired shape. The LOM samples were tested via a peel test and a bending test, indicating good metallic bonding. Notably, the LOM strength can be comparable to that of solid steel when the initial steel sheet is not thick.
Joghan et al. [26] studied a rapid prototype process with steel sheets to create complex die geometry. The study also cut the steel sheet and then joined them by laser power with the assistance of metallic powder as a binder. The surface was then subjected to milling, ball burnishing, and finally laser-treatment processes. The LOM process in producing the deep drawing dies achieved a rapid speed and complex die shapes with cooling channels and functional parts, saving energy when compared to traditional powder 3D printing. Pilipovic et al. [27] investigated the LOM process with polymeric materials using PVC film. This study also surveyed the influence of the orientation of the film on the tensile strength of the LOM samples, indicating that the orientation Pxy obtained optimal properties. On the contrary, the orientation Pz must be avoided due to its low strength. Besides the strength, orientation and chamber filling also impacted the processing speed and the manufacturing cost. The study also suggested that further investigation into other polymeric materials should be conducted in the future. Park et al. [28] studied the characteristics of the composite material created via the LOM process via both a simulation and experiment with 27 processing parameter cases. The results pointed out that the highest interlaminar shear strength was 8.55 MPa, which is also the ultimate shear strength of the LOM samples. Moreover, the simulation model with the finite element method achieved a comparable result to the experimental study, reducing the number of experiment cases. Interestingly, Tao et al. [29] used wood-based materials to create 3D objects by applying the LOM process. The wood lamination was cut by laser and then adhered with polyvinyl acetate adhesive. During the sticking process, a model contour could be applied to ensure the 3D shape. Finally, the lamination stocks were pressed under 10 N force for five minutes to generate a strong bond. Interestingly, the wood-based LOM product could obtain complex shapes with large internal voids, especially using wood veneer. The wood-based LOM product might be used as material matrices and patterns for functional applications, for example, composite structures and sound absorbers. The disadvantage of this technique is the high tolerance of the product when using thick wood layers. However, further post-processing, like surface finishing, could be applied to minimize the tolerance of the samples. The benefits of the wood-based LOM product compared to the other additive manufacturing processes are the larger scale and fewer adhesives. Interestingly, Kozior et al. [30] combined fused filament fabrication (FFF), photo-curing of liquid polymer resins (PJM), and electrospinning (ES) technology to create 3D printing samples. The parameters that were studied were print parameters, which included the direction of printing, layer thickness, and level of material fill, and electrospinning process parameters, which included humidity, voltage, and chamber temperature. This study shows that polymers used for electrospinning can be used to create nanofibers and adaptable composites with various characteristics for specific medicinal purposes. The study also proved that the production of denser nanofibers with larger diameters or a denser matrix is possible.
Zhang et al. [31] were able to create ceramic-based materials by using the LOM process. The study used Al2O3 ceramics and polyvinyl butyral tape to create 3D samples. Thereafter, the samples were sintered at 1580 °C to finish the bonding process. The ceramic-based LOM sample had asymmetrical properties and could be suitable for complex shapes and low-strength requirements. Besides using a single material as the lamination for the LOM process, some researchers applied two different materials for LOM products. For example, Sasahara et al. [32] used metal-polymer lamination to create mechanical parts with a high strength. The epoxy resin, used as a polymer layer, was bonded with the metal layer by adhesive. Then, the 3D object was cured at 200 °C to establish a strong bond. Due to the advancement of the LOM process with metal-polymer lamination, a cooling channel unit, a spherical shell, and a honeycomb thin-wall shape were successfully produced. These complex shapes are extremely hard to create with the traditional milling process. However, the investigations about low-carbon steel sheets are not mentioned in detail. Especially, the effects of heating movement strategies on the LOM process are rarely investigated.
This study tries to examine the effects of heating movement on the characteristics of a 3D printing sample created by the LOM-type method using a low-carbon steel sheet. The steel sheet is joined by a tungsten inner gas (TIG) machine named Jasic TIG 200A from WELDCOM Industry, JSC, Hochiminh city, Vietnam combined with a CNC machine which was built for lamination object manufacturing method. These types of equipment have a reasonable cost and are always available in the industry. The microstructure, fracture surface, and tensile properties of the LOM samples are surveyed. The results can shed more light on the LOM technique using low-carbon steel sheets with different movement strategies.

2. Experimental Methods

In this study, we used S20C plain carbon steel with the nominal chemical composition presented in Table 1. The steel plate was divided into small lamination sheets with the dimensions of 150 mm × 25 mm × 1.0 mm. Compared to other conventional LOM processes, this study uses a thick lamination sheet. Therefore, the lamination sheet must be cut into pieces before joining them together. Moreover, this study applied a TIG machine as a heat source to join the lamination sheets. Initially, the steel laminations were placed on a thick S20C steel base to be joined together by a TIG gun that was assembled in a CNC machine. The TIG gun generated an electrical arc to join the lamination sheets together.
In this study, the movement strategy of the heat source (TIG gun) is investigated. The TIG gun moved in different movement strategies, including long straight-profile (D), short-profile (N), cross-profile (HC), and curved-profile (DT), as shown in Figure 1a–d. Figure 1e–g shows the steel lamination, the ASTM E8/E8M-13 standards sample, and the tensile test samples [33]. Figure 2 shows the LOM equipment, which is the combination of TIG and CNC machines, and the tensile test sample position. After creating a steel piece, it was cut by a wire electrical discharge machine (EDM) following ASTM E8/E8M-13 standards for further tensile testing, as shown in Figure 2c. After many experimental works, the TIG welding parameters were set at the optimal values, as presented in Table 2. The TIG parameters were selected to ensure a suitable heat source, preventing the LOM sample from melting or lacking bonding. Too much heat source could cause leaking, while not enough heat source could lead to poor bonding. The sample surface was ground after each lamination sheet formation to ensure a flat and clean surface.
The tensile tests were conducted by a tensile test machine named SANS model CHT4106, China. Each experimental number was conducted with three samples. Before the tensile test, the samples were cut via a wire EDM to ensure dimension accuracy and good surface roughness. Furthermore, the sample sizes were measured, especially the sample cross-section, to help calculate the tensile strength. The microstructure of the samples was observed via a metallurgy microscope named Oxion OX.2153-PLM EUROMEX, Holland. The samples were polished and etched using 4% Nital solution before the metallurgical microstructure was examined. The fracture surface of the LOM samples after the tensile test was examined by a scanning electron microscope (SEM) named JEOL 5410 LV, Tokyo, Japan.

3. Results and Discussion
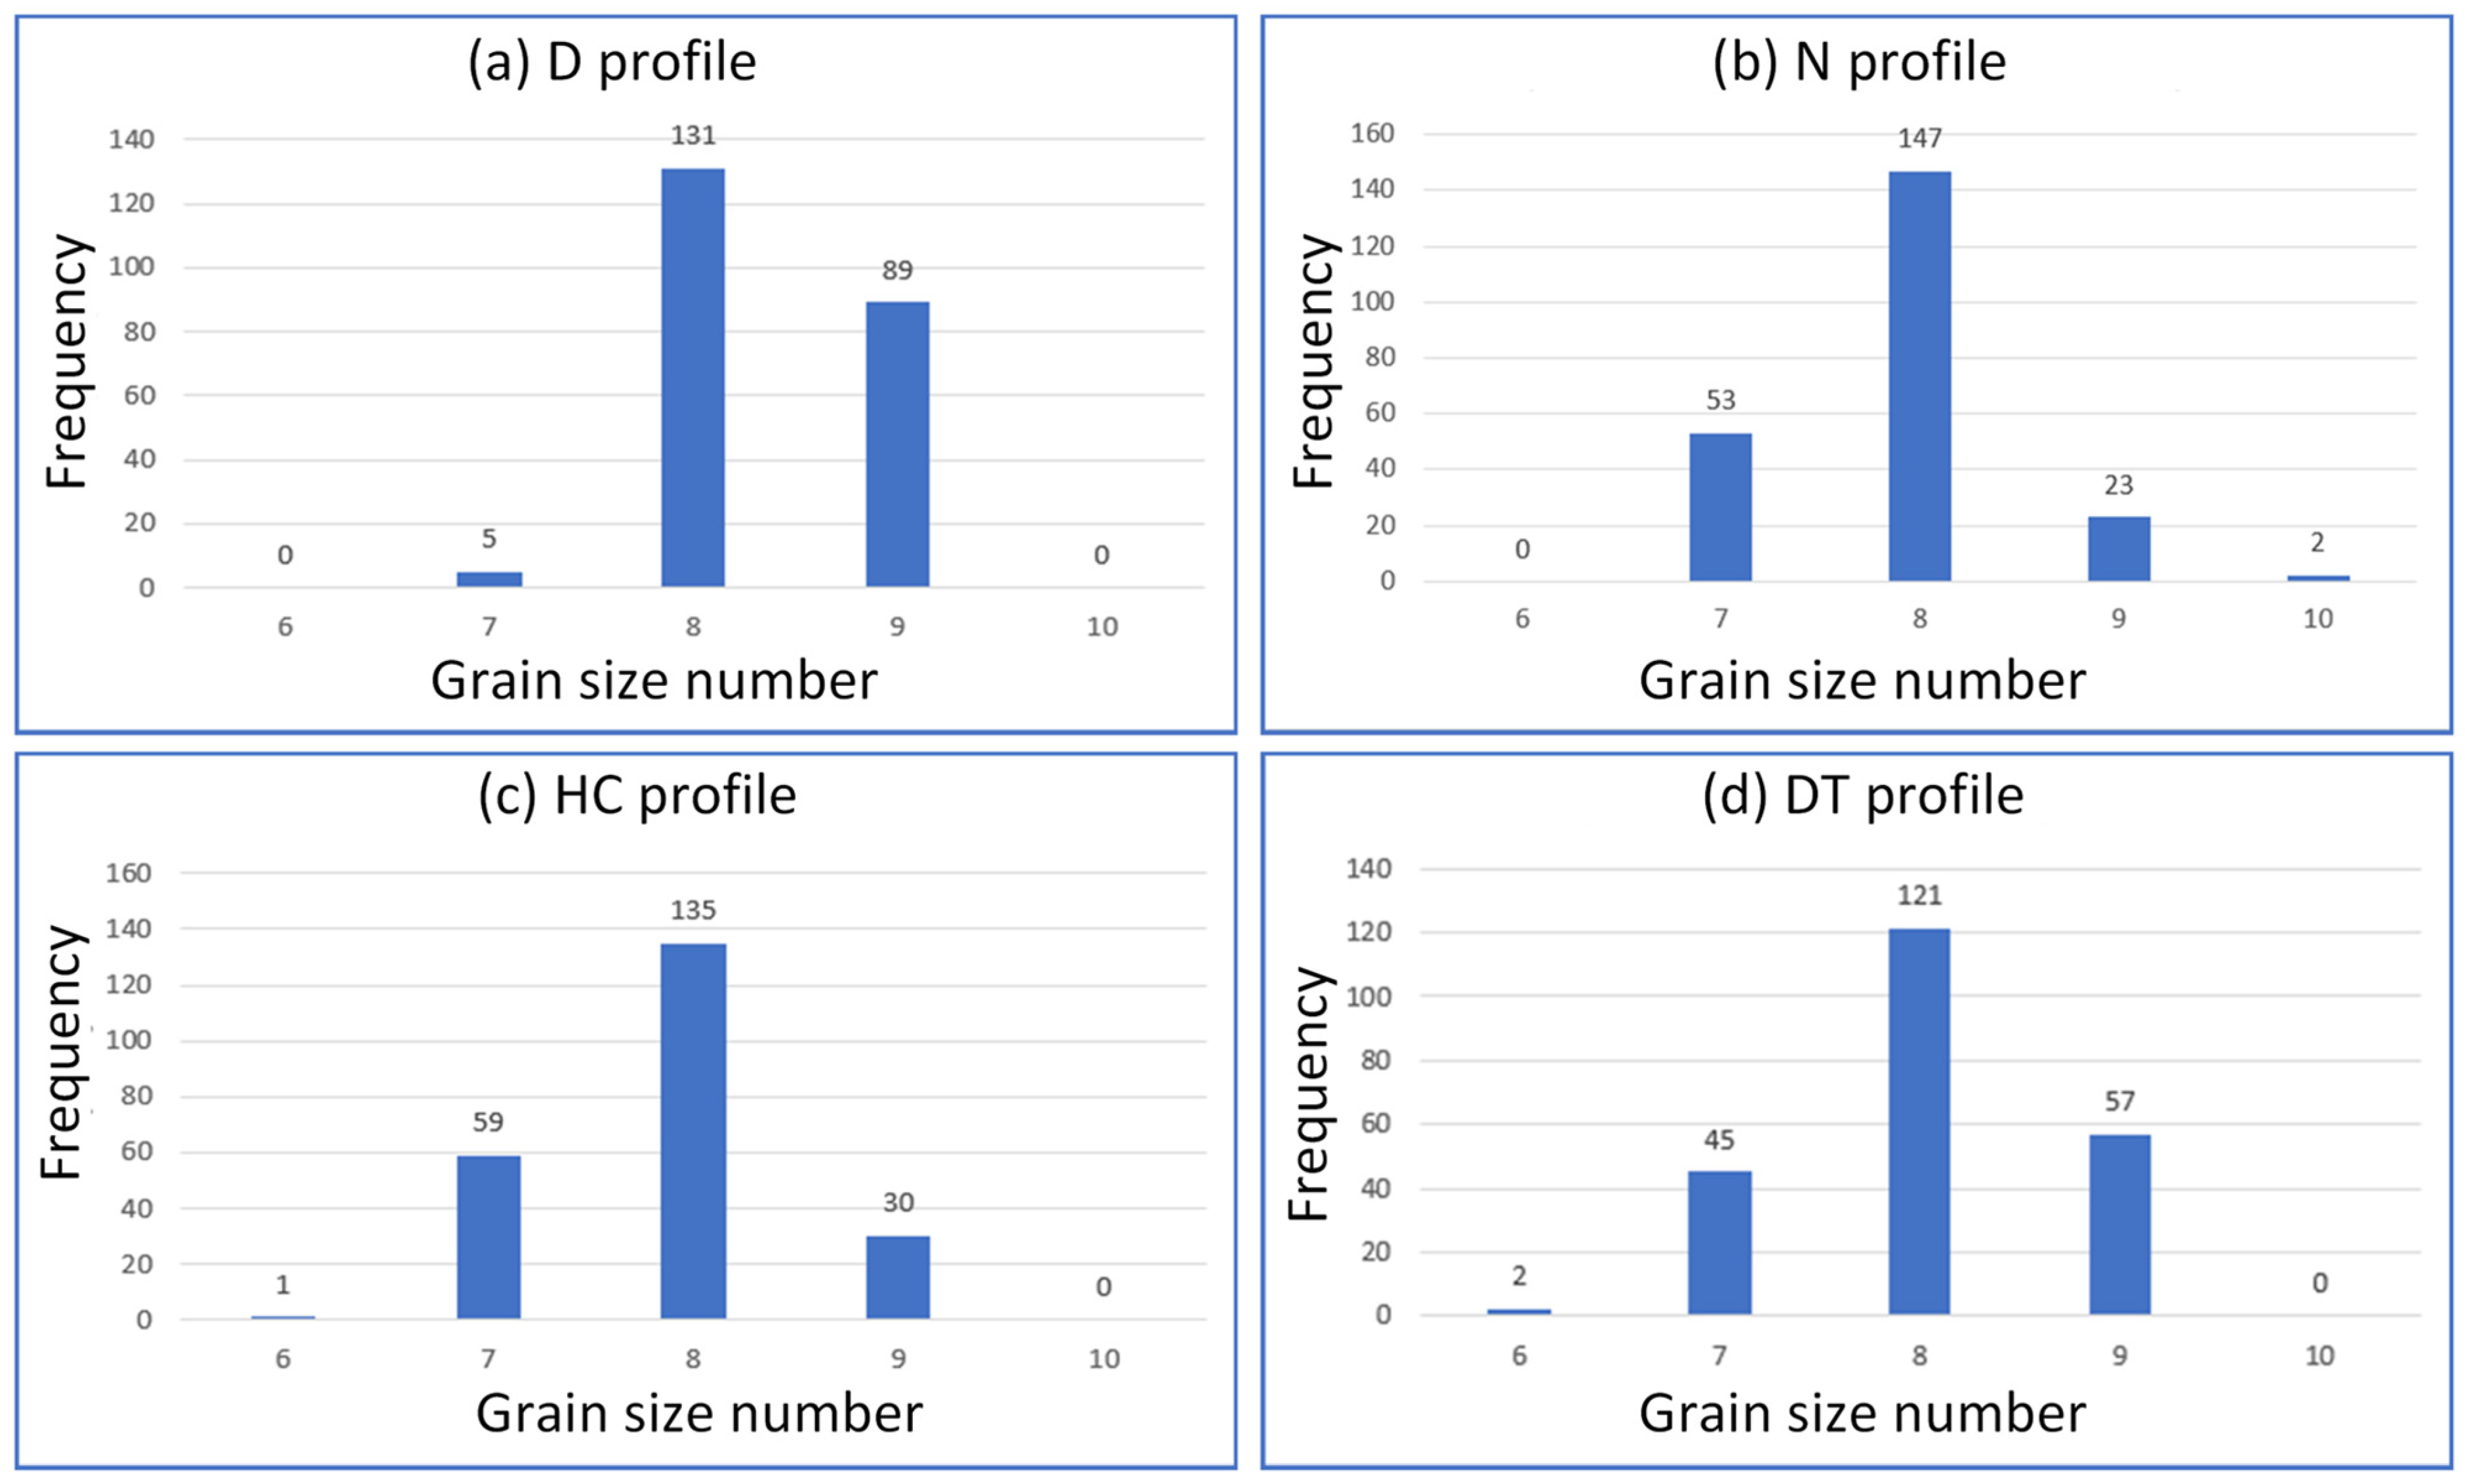
3.1. Microstructure

Figure 3 presents the microstructure of LOM samples with different movement strategies. This is the microstructure of plain carbon steel, consisting of pearlite and ferrite phases. The pearlite phase has a darker color, scattering on the ferrite matrix with a brighter color. The microstructure of the samples is dominated by the ferrite phase, while the pearlite phase ratio is greatly smaller, indicating the typical microstructure of low-carbon steel. Different from the texture shape of the original cold-rolled lamination, after melting and crystallizing, the samples have an isotropy grain shape. The grain size is quite small due to the rapid melting and cooling during the LOM process. There is not enough time and heat source for the grain to grow. Furthermore, the grain size could be affected by the movement strategy due to the difference in heat source. Different movement strategies lead to different heat times for the grain. To examine the grain size number and grain size distribution, the following figure will give more information.
Figure 4 shows the grain size number distribution following the ASTM E112-10 grain size number standard for the LOM samples with different movement strategies [34]. The grain size number of the LOM samples ranges from 6 to 10, but mostly focuses on 7 to 9. Most grains have a grain size of eight. The traditional grain size number of the steel is 6–7. The LOM technique achieves a finer grain size due to the rapid melting and cooling during the fabrication process. Remarkably, the difference in grain size between the LOM samples with different movement strategies is small. Interestingly, the straight-profile has a sufficient number of grains that reach grain size number nine. This result indicates that the straight-profile has the smallest grain size, as shown in Figure 4a. On the other hand, the curved-profile achieves the largest grain size with many grains reaching grain size of nine, as shown in Figure 4d. In general, the grain size number is slightly influenced by the movement strategy. However, this influence is not so strong. The reason for the difference among these samples is the heating time during the LOM process. With the longest pathway, the straight-profile sample has more time to release the heat. Therefore, after melting, the grain has less time to grow during the crystallization process, leading to a smaller grain size. This phenomenon is similar to that which Uyen et al. [35] report. In reverse, the other movement strategy has a denser pathway, leading to a higher heat concentration. Therefore, the grain size has more time and heat energy to grow, resulting in a coarser grain size. In particular, the curved-profile obtains the largest grain size as its movement strategy has the densest pathway, as shown in Figure 1. To observe micro defects, the fracture surfaces of the LOM sample are observed via an SEM microscope.
Figure 5 presents the SEM microstructure of LOM samples of fracture surface after tensile testing with different movement strategies. These figures provide better magnification than the traditional optical microscope, which can find smaller defects. The samples are tested via an SEM microscope named JEOL 5410 LV with a voltage of 5 kV, magnification of X500, working distance of 6.8–8.7 mm, and an emission current of 59,700–66,100 nA. The figures show that the samples are ductility damaged due to the appearance of dimples. According to Pan et al. [36], the dimples are created from voids that grow under plastic strain. The voids grow up and join together, or coalesce, to create dimples. The dimples are perpendicular to the applied tensile direction. The brittle fracture surface has a flatter shape with cleavage and intergranular modes. Moreover, there are some large dimples or pores that could be formed during the LOM process. Notably, the microstructure of the short-profile sample and cross-profile sample has some pore defects that form during the LOM process. The straight-profile and curved-profile samples have a better microstructure than the short-profile and cross-profile samples because there are no pore defects in the straight-profile and curved-profile samples. However, these samples need further mechanical tests to evaluate the quality of the microstructure. Therefore, besides grain size and SEM microstructure, the tensile strength of these samples in the following section could provide more information about the quality of the LOM samples.

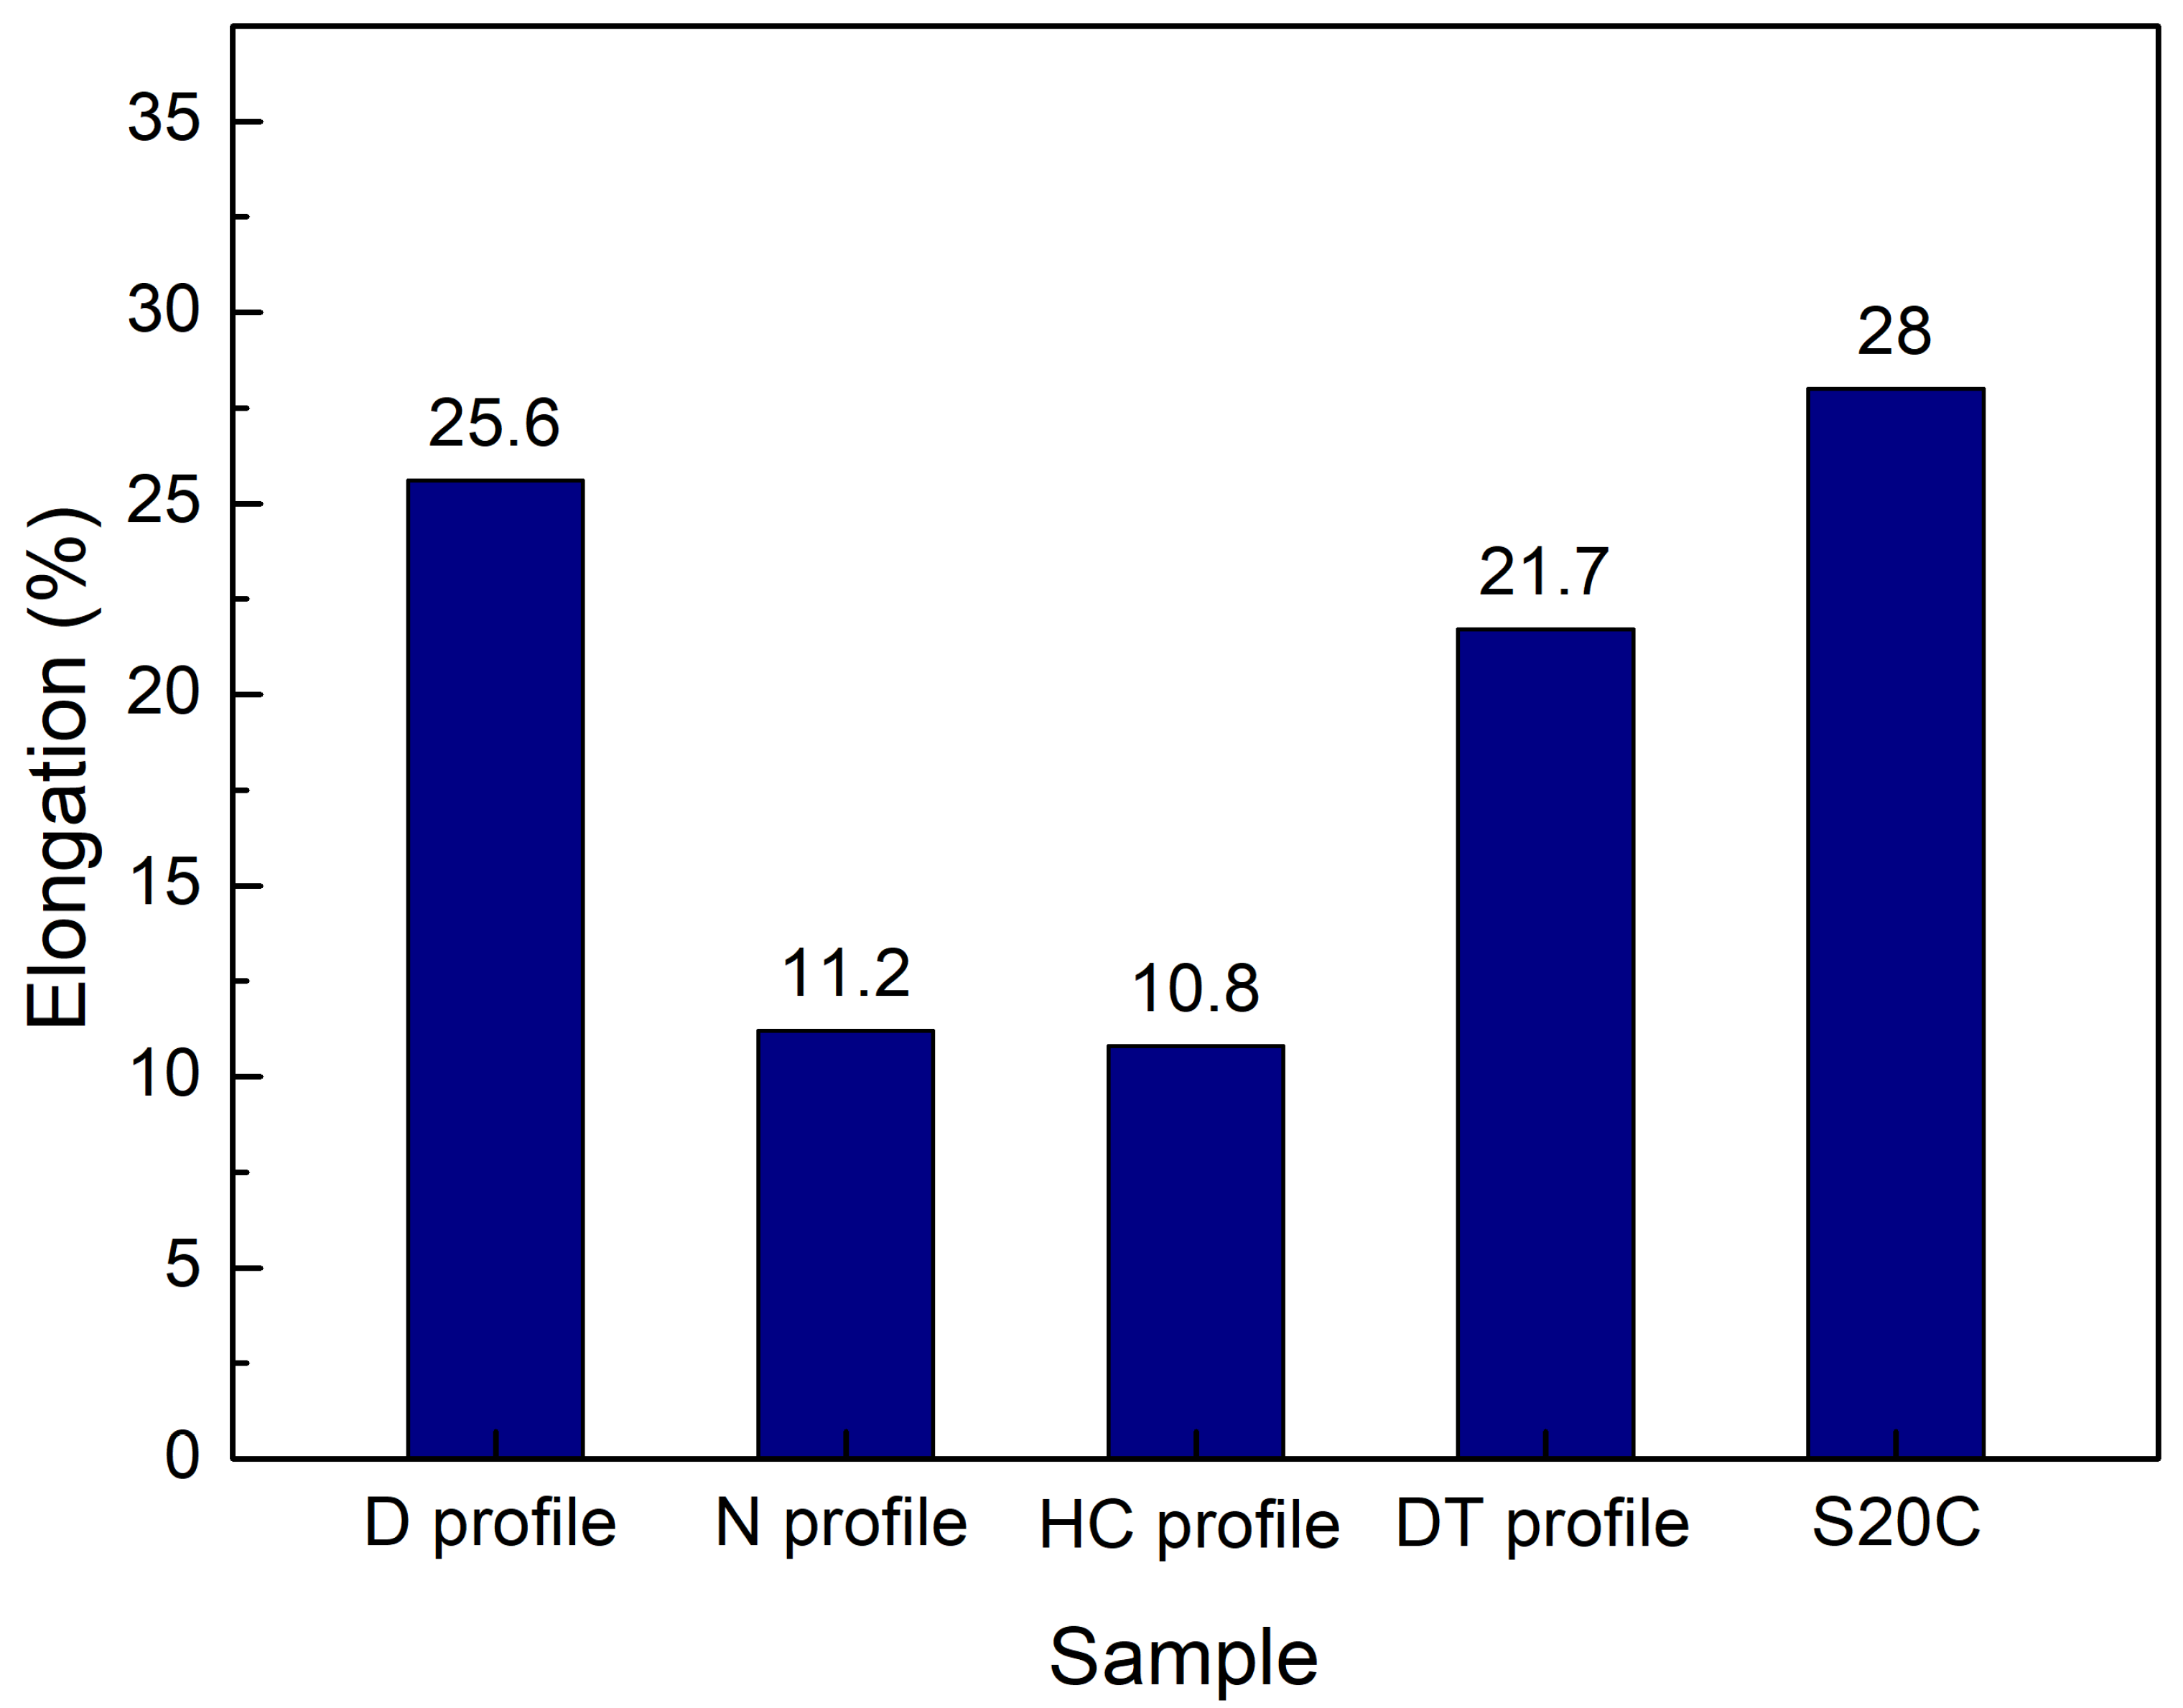
3.2. Tensile Strength

The stress–strain diagrams and the average tensile strength of LOM samples of fracture surface after tensile testing with different movement strategies are shown in Figure 6 and Figure 7. The average ultimate tensile strengths (UTS) of the samples are 430 MPa, 398.6 MPa, 332.5 MPa, and 386.8 MPa, respectively, corresponding to LOM samples of straight-profile, short-profile, cross-profile, and curved-profile. Most LOM samples obtain a similar UTS value compared to the original steel lamination, which is 402 MPa. The straight-profile sample has the highest UTS value of 430 MPa, while the cross-profile has the lowest one of 332.5 MPa. There could be some pores in the straight-profile sample, which is the tensile test result presented in Figure 6a. Therefore, the curve of this sample has some irregular shape in the initial period. Furthermore, only a sample of a straight-profile achieves a UTS value higher than the original S20C lamination, which is 402 MPa, due to its fine grain size and good microstructure. On the contrary, the short-profile and cross-profile samples have a lower UTS value than the original steel lamination. The reason could be the pore defects appearing during the LOM process of the short-profile and cross-profile samples, as shown in Figure 5b,c. Moreover, smaller grain size is also the reason why the straight-profile and curved-profile samples have better UTS values than the short-profile and cross-profile samples, as shown in Figure 4a–d.
Figure 8 displays the average elongation of LOM samples of fracture surface after a tensile test with different movement strategies. The average elongation values of LOM samples are 25.6%, 11.2%, 10.8%, and 21.7%, corresponding to LOM samples of straight-profile, short-profile, cross-profile, and curved-profile, respectively. Different from the UTS value, the elongation value is more sensitive to the movement strategy. This means that changing the movement strategy causes enormous differences in the elongation value. The elongation values of the short-profile and cross-profile samples are only half of those of the straight and curved-profile samples. Moreover, compared to the original steel lamination, all samples have a lower elongation value due to the appearance of porosities. Samples with straight- and curved-profiles achieve a good elongation value, which is close to the 28% value of the original steel lamination. However, samples with a short-profile and a cross-profile have greatly lower elongation values compared to the original steel lamination. The main reason could also be many pore defects appearing during the LOM process, as shown in Figure 5b,c. The difference in grain size between the LOM samples with different movement strategies is small; therefore, its effect on the elongation is also minor. Overall, during the LOM process, the pore defect has a stronger effect on the mechanical properties than the grain size effects. Considering both the UTS and elongation values, samples with a short-profile and a cross-profile achieve a better quality than samples with a short-profile and a cross-profile. The suitable movement strategy of the TIG gun could result in a good LOM sample with good microstructure, tensile strength, and ductility.
To have a better overview of the LOM process, Table 3 shows the comparison of UTS for the LOM process in some reports. The UTS value is strongly impacted by the materials that created the original laminations. For example, Parandoush et al. [20] reported an extremely high UTS value of the LOM sample of 668.3 MPa. The reason for this is the application of high-strength carbon fiber-reinforced thermoplastic materials. In reverse, some natural-based materials achieved a greatly lower UTS. Kumar et al. [22] revealed that the UTS value of the polylactic acid generated by the LOM process is only 42.47 MPa. Jiang et al. [37] also indicated that woven jute fabrics/bioresin materials used for the LOM process only achieved a UTS value of 28.32 MPa. Alimuzzaman et al. [38] achieved a UTS value of 91.25 MPa when using PLA/bagasse as original lamination materials. Moreover, the adhesive material also dramatically impacts the LOM product’s strength. Govender et al. [39] reported that aluminum/epoxy LOM samples only obtained a low UTS value of 50.6 MPa due to the weak bonding of the epoxy. Importantly, using steel lamination as the original materials in the LOM process could reach a high UTS value. Both Chen et al. [40] and Hung et al. [41] achieved a UTS value that is higher than this research study. Chen et al. [40] gained a UTS value of 551 MPa by using AISI 1010 steel, and Hung et al. [41] achieved a UTS value of 565 MPa by using SUS 304L steel.

4. Conclusions

In this study, the impacts of heating movement strategies on the characteristics of 3D-printed low-carbon steel samples generated via the S20C sheet lamination method were examined. A CNC machine and TIG welding machine were used to join the steel sheet. The LOM samples were generated with a straight-profile, short-profile, cross-profile, and curved-profile. The samples had an isotropy grain shape, mostly having a grain size number of 7–9. In the fracture surface, dimples appeared in the LOM samples, indicating ductility fractures. During the LOM process, some pore defects appeared in the microstructure of the cross-profile sample and the short-profile sample, reducing the quality of the sample. The microstructure of the samples with straight- and curved-profiles is better with smaller grain sizes and fewer pores. The samples with a straight-profile and a curved-profile achieved a better combination of UTS and elongation value than the samples with a short-profile and a cross-profile. The finer grain size and better microstructure are the reasons for the better tensile strength and elongation of these profiles. The best LOM sample was a straight-profile sample with a UTS value of 430 MPa and an elongation value of 25.6%. In reverse, the LOM sample with a cross-profile had a UTS value of 332.5 MPa and an elongation value of 10.8% was the weakest sample. This study can provide more insight into the LOM technique with the optimal straight-profile movement strategies. A suitable TIG gun movement strategy could produce a good LOM sample with good microstructure, tensile strength, and ductility. In future work, more movement strategies and methods should be introduced to eliminate the appearance of pore defects.

Author Contributions

P.S.M. and V.-T.N.: conceptualization, funding acquisition; T.L.H.N. and V.-T.N.: writing original draft, investigation; H.T.X.C., T.L.H.N. and V.-T.N.: analyzing, visualization; T.M.T.U., P.S.M. and H.T.X.C.: project administration; T.L.H.N., P.S.M., H.T.X.C., V.-T.N. and T.M.T.U.: investigation; T.L.H.N., P.S.M. and V.-T.N.: writing, review, and editing. All authors have read and agreed to the published version of the manuscript.

Funding

The authors acknowledge the funding from HCMC University of Technology and Education for this study.

Institutional Review Board Statement

Not applicable.

Informed Consent Statement

Not applicable.

Data Availability Statement

The data used to support the findings of this study are available from the corresponding author upon request.

Acknowledgments

The authors acknowledge the support of School of Industrial Engineering and Management, International University, Vietnam National University HCMC, and HCMC University of Technology and Education for this research.

Conflicts of Interest

The authors declare no conflict of interest.

References

  1. Ngo, T.D.; Kashani, A.; Imbalzano, G.; Nguyen, K.T.; Hui, D. Additive manufacturing (3D printing): A review of materials, methods, applications and challenges. Compos. Part B Eng. 2018, 143, 172–196. [Google Scholar] [CrossRef]
  2. Stansbury, J.W.; Idacavage, M.J. 3D printing with polymers: Challenges among expanding options and opportunities. Dent. Mater. 2016, 32, 54–64. [Google Scholar] [CrossRef] [PubMed]
  3. Jandyal, A.; Chaturvedi, I.; Wazir, I.; Raina, A.; Haq, M.I.U. 3D printing—A review of processes, materials and applications in industry 4.0. Sustain. Oper. Comput. 2022, 3, 33–42. [Google Scholar] [CrossRef]
  4. Ranjan, R.; Kumar, D.; Kundu, M.; Moi, S.C. A critical review on Classification of materials used in 3D printing process. Mater. Today Proc. 2022, 61, 43–49. [Google Scholar] [CrossRef]
  5. Bandyopadhyay, A.; Bose, S.; Das, S. 3D printing of biomaterials. MRS Bull. 2015, 40, 108–115. [Google Scholar] [CrossRef]
  6. Singh, T.; Kumar, S.; Sehgal, S. 3D printing of engineering materials: A state of the art review. Mater. Today Proc. 2020, 28, 1927–1931. [Google Scholar] [CrossRef]
  7. Nouri, A.; Shirvan, A.R.; Li, Y.; Wen, C. Additive manufacturing of metallic and polymeric load-bearing biomaterials using laser powder bed fusion: A review. J. Mater. Sci. Technol. 2021, 94, 196–215. [Google Scholar] [CrossRef]
  8. Bhatia, A.; Sehgal, A.K. Additive manufacturing materials, methods and applications: A review. Mater. Today Proc. 2021, 81, 1060–1067. [Google Scholar] [CrossRef]
  9. Zhang, C.; Ouyang, D.; Pauly, S.; Liu, L. 3D printing of bulk metallic glasses. Mater. Sci. Eng. R Rep. 2021, 145, 100625. [Google Scholar] [CrossRef]
  10. Rouf, S.; Raina, A.; Haq MI, U.; Naveed, N.; Jeganmohan, S.; Kichloo, A.F. 3D printed parts and mechanical properties: Influencing parameters, sustainability aspects, global market scenario, challenges and applications. Adv. Ind. Eng. Polym. Res. 2022, 5, 143–158. [Google Scholar] [CrossRef]
  11. Park, S.J.; Lee, J.E.; Park, J.; Lee, N.K.; Son, Y.; Park, S.H. High-temperature 3D printing of polyetheretherketone products: Perspective on industrial manufacturing applications of super engineering plastics. Mater. Des. 2021, 211, 110163. [Google Scholar] [CrossRef]
  12. Arefin, A.M.; Khatri, N.R.; Kulkarni, N.; Egan, P.F. Polymer 3D printing review: Materials, process, and design strategies for medical applications. Polymers 2021, 13, 1499. [Google Scholar] [CrossRef] [PubMed]
  13. Karakurt, I.; Lin, L. 3D printing technologies: Techniques, materials, and post-processing. Curr. Opin. Chem. Eng. 2020, 28, 134–143. [Google Scholar] [CrossRef]
  14. Rafiee, M.; Farahani, R.D.; Therriault, D. Multi-material 3D and 4D printing: A survey. Adv. Sci. 2020, 7, 1902307. [Google Scholar] [CrossRef] [PubMed]
  15. Mostafaei, A.; Elliott, A.M.; Barnes, J.E.; Li, F.; Tan, W.; Cramer, C.L.; Chmielus, M. Binder jet 3D printing—Process parameters, materials, properties, modeling, and challenges. Prog. Mater. Sci. 2021, 119, 100707. [Google Scholar] [CrossRef]
  16. Khosravani, M.R.; Reinicke, T. On the environmental impacts of 3D printing technology. Appl. Mater. Today 2020, 20, 100689. [Google Scholar] [CrossRef]
  17. Selema, A.; Ibrahim, M.N.; Vansompel, H.; Sergeant, P. Development of Yokeless Axial Flux Machine Using 3D-Printed Shape-Profiled Core. In Proceedings of the 2022 International Conference on Electrical Machines (ICEM), Valencia, Spain, 5–8 September 2022; IEEE: Piscataway, NJ, USA, 2022; pp. 1763–1769. [Google Scholar]
  18. Zeng, L.; Li, P.; Yao, Y.; Niu, B.; Niu, S.; Xu, B. Recent progresses of 3D printing technologies for structural energy storage devices. Mater. Today Nano 2020, 12, 100094. [Google Scholar] [CrossRef]
  19. Bhatt, P.M.; Kabir, A.M.; Peralta, M.; Bruck, H.A.; Gupta, S.K. A robotic cell for performing sheet lamination-based additive manufacturing. Addit. Manuf. 2019, 27, 278–289. [Google Scholar] [CrossRef]
  20. Parandoush, P.; Zhou, C.; Lin, D. 3D printing of ultrahigh strength continuous carbon fiber composites. Adv. Eng. Mater. 2019, 21, 1800622. [Google Scholar] [CrossRef]
  21. Olivier, D.; Travieso-Rodriguez, J.A.; Borros, S.; Reyes, G.; Jerez-Mesa, R. Influence of building orientation on the flexural strength of laminated object manufacturing specimens. J. Mech. Sci. Technol. 2017, 31, 133–139. [Google Scholar] [CrossRef]
  22. Kumar, S.; Singh, I.; Kumar, D.; Yahya, M.Y.; Rahimian Koloor, S.S. Mechanical and morphological characterizations of laminated object manufactured 3D printed biodegradable poly (lactic) acid with various physical configurations. J. Mar. Sci. Eng. 2022, 10, 1954. [Google Scholar] [CrossRef]
  23. Dermeik, B.; Travitzky, N. Laminated object manufacturing of ceramic-based materials. Adv. Eng. Mater. 2020, 22, 2000256. [Google Scholar] [CrossRef]
  24. Prechtl, M.; Otto, A.; Geiger, M. Rapid tooling by laminated object manufacturing of metal foil. Adv. Mater. Res. 2005, 6, 303–312. [Google Scholar] [CrossRef]
  25. Obikawa, T.; Yoshino, M.; Shinozuka, J. Sheet steel lamination for rapid manufacturing. J. Mater. Process. Technol. 1999, 89, 171–176. [Google Scholar] [CrossRef]
  26. Joghan, H.D.; Hahn, M.; Sehrt, J.T.; Tekkaya, A.E. Hybrid additive manufacturing of metal laminated forming tools. CIRP Ann. 2022, 71, 225–228. [Google Scholar] [CrossRef]
  27. Pilipovic, A.; Raos, P.; Sercer, M. Experimental Testing of Quality of Polymer Parts Produced by Laminated Object Manufacturing- Lom. Teh. Vjesn. 2011, 18, 253–260. [Google Scholar]
  28. Park, J.; Kang, M.K.; Hahn, H.T. Composite material based laminated object manufacturing (LOM) process Simulation. Adv. Compos. Lett. 2001, 10, 096369350101000504. [Google Scholar] [CrossRef]
  29. Tao, Y.; Yin, Q.; Li, P. An additive manufacturing method using large-scale wood inspired by laminated object manufacturing and plywood technology. Polymers 2020, 13, 144. [Google Scholar] [CrossRef]
  30. Kozior, T.; Mamun, A.; Trabelsi, M.; Sabantina, L. Comparative analysis of polymer composites produced by FFF and PJM 3D printing and electrospinning technologies for possible filter applications. Coatings 2022, 12, 48. [Google Scholar] [CrossRef]
  31. Zhang, Y.; He, X.; Du, S.; Zhang, J. Al2O3 ceramics preparation by LOM (laminated object manufacturing). Int. J. Adv. Manuf. Technol. 2001, 17, 531–534. [Google Scholar] [CrossRef]
  32. Sasahara, H.; Tsutsumi, M.; Chino, M. Development of a layered manufacturing system using sheet metal-polymer lamination for mechanical parts. Int. J. Adv. Manuf. Technol. 2005, 27, 268–273. [Google Scholar] [CrossRef]
  33. ASTM E8/E8M-13; Test Methods for Tension Testing of Metallic Materials. ASTM International: West Conshohocken, PA, USA, 2011.
  34. ASTM E112-10; Standard Test Methods for Determining Average Grain Size. ASTM International: West Conshohocken, PA, USA, 2004.
  35. Uyen TM, T.; Minh, P.S.; Nguyen, V.T.; Do, T.T.; Nguyen, V.T.; Le, M.T.; Nguyen VT, T. Trajectory Strategy Effects on the Material Characteristics in the WAAM Technique. Micromachines 2023, 14, 827. [Google Scholar] [CrossRef]
  36. Pan, X.; Qian, G.; Hong, Y. Nanograin formation in dimple ridges due to local severe-plastic-deformation during ductile fracture. Scr. Mater. 2021, 194, 113631. [Google Scholar] [CrossRef]
  37. Jiang, L.; Amarasekara, A.S. Mechanical properties of the woven natural fiber reinforced sheet stocks used for the laminated object manufacturing (LOM) rapid prototyping process. In Proceedings of the ASC Thirty-Sixth Technical Conference Proceedings, College Station, TX, USA, 20–22 September 2021. [Google Scholar]
  38. Alimuzzaman, S.M.; Jahan, M.P. Composite Based Additive Manufacturing. In Practical Implementations of Additive Manufacturing Technologies; Springer Nature: Singapore, 2023; pp. 117–151. [Google Scholar]
  39. Govender, K.; Walker, A.; Bright, G. Automated Metal Laminate Printing in Rapid Tooling for Mass Customization. In Transdisciplinary Engineering: A Paradigm Shift; IOS Press: Amsterdam, The Netherlands, 2017; pp. 933–940. [Google Scholar]
  40. Chen, C.; Shen, Y.; Tsai, H.L. A foil-based additive manufacturing technology for metal parts. J. Manuf. Sci. Eng. 2017, 139, 024501. [Google Scholar] [CrossRef]
  41. Hung, C.H.; Shen, Y.; Leu, M.; Tsai, H.L. Mechanical Properties of 304L Metal Parts Made by Laser-Foil-Printing Process. In 2017 International Solid Freeform Fabrication Symposium; University of Texas at Austin: Austin, TX, USA, 2017. [Google Scholar]
Figure 1. The LOM movement strategies and samples: (a) straight-profile, (b) short-profile, (c) cross-profile, (d) curved-profile, (e) steel lamination, (f) ASTM E8/E8M-13 standards sample, and (g) tensile test samples after wire EDM cutting.
Metals 14 00356 g001
Figure 2. The LOM equipment and sample position: (a) CNC machine with TIG gun, (b) LOM process, and (c) tensile test sample position.
Metals 14 00356 g002
Figure 3. Microstructure of LOM samples with different movement strategies: (a) straight-profile, (b) short-profile, (c) cross-profile, and (d) curved-profile.
Metals 14 00356 g003
Figure 4. Grain size number distribution following ASTM E112-10 grain size number standard of the LOM samples with different movement strategies: (a) straight-profile, (b) short-profile, (c) cross-profile, and (d) curved-profile.
Metals 14 00356 g004
Figure 5. SEM microstructure of LOM samples of fracture surface after tensile test with different movement strategies: (a) straight-profile, (b) short-profile, (c) cross-profile, and (d) curved-profile.
Metals 14 00356 g005
Figure 6. Stress–strain diagrams of LOM samples of fracture surface after tensile test with different movement strategies: (a) straight-profile, (b) short-profile, (c) cross-profile, and (d) curved-profile.
Metals 14 00356 g006
Figure 7. Average tensile strength of LOM samples of fracture surface after tensile test with different movement strategies.
Metals 14 00356 g007
Figure 8. Average elongation of LOM samples of fracture surface after the tensile test at different movement strategies.
Metals 14 00356 g008
Table 1. Chemical composition of S20C steel for the lamination sheet for the LOM process.
Weight %CSiMnPSNiCrCuFe
S20C0.18–0.230.15–0.350.3–0.60.03 max0.035 max0.2 max0.2 max0.3 max99.08–99.53
Table 2. Experiment parameters and four movement strategies of the LOM process.
No.U (V)I (A)Arc Length (mm)V (mm/min)Argon (L/min)Movement Strategies
122016523511Straight-profile—D
2Short-profile—N
3Cross-profile—HC
4Curved-profile—DT
Table 3. The comparison of UTS of LOM process in some reports.
No.UTS Value (MPa)MaterialsReferences
1.668.3Carbon fiber-reinforced thermoplasticParandoush et al. report [20]
2.42.47Polylactic acidKumar et al. report [22]
3.28.32Woven jute fabrics/bioresinJiang et al. report [37]
4.91.25 PLA/Bagasse Alimuzzaman et al. report [38]
5.50.6Aluminum/epoxyGovender et al. report [39]
6.551AISI 1010 steelChen et al. report [40]
7.565SUS 304L steelHung et al. report [41]
8.332.5–430S20C steel plateThis research
Disclaimer/Publisher’s Note: The statements, opinions and data contained in all publications are solely those of the individual author(s) and contributor(s) and not of MDPI and/or the editor(s). MDPI and/or the editor(s) disclaim responsibility for any injury to people or property resulting from any ideas, methods, instructions or products referred to in the content.

