Article

Advanced EIS-Based Sensor for Online Corrosion and Scaling Monitoring in Pipelines of Geothermal Power Plants

AIMEN Technology Centre, 36410 O Porriño, Spain
*
Author to whom correspondence should be addressed.
Metals 2024, 14(3), 279; https://doi.org/10.3390/met14030279
Submission received: 26 December 2023 / Revised: 5 February 2024 / Accepted: 21 February 2024 / Published: 27 February 2024

Abstract

:
Corrosion and scaling in metal pipelines are the major issues in the exploitation of geothermal sources. Geothermal fluids are complex mixtures consisting of dissolved gases and high-salinity solutions. This creates very aggressive environments primarily due to the high concentrations of carbon dioxide (CO2), hydrogen sulfide (H2S), chlorides, and other chemical species. Besides, the high temperature of the brines also increases corrosion rates, which can lead to failures related to stress and fatigue corrosion. On the other hand, reinjection of cooled brine exiting the heat exchanger favors the onset of scaling, since the chemicals dissolved in geothermal waters may tend to precipitate promoting inorganic depositions on the casing. Corrosion and scaling phenomena are difficult to detect visually or monitor continuously. Standard techniques based on pH, temperature pressure, electrical resistance measurements, chemistry composition, and physical properties are habitually applied as indirect methods for corrosion rate control. These methods, however, lack enough robustness for accurate and reliable measuring of the corrosion behavior of materials. To address this issue, a novel system has been proposed for the continuous monitoring of corrosion degradation caused by the effect of the geothermal brines. The present work aims to design, develop, and validate a dedicated electrochemical-based test system for online and onsite monitoring of the corrosion rate and scaling growth occurring on different materials exposed to real operating conditions. This system uses non-standard methods based on electrochemical impedance spectroscopy (EIS) to obtain quantitative data related to the material quality. It can be used to track the condition of the pipeline, reducing the operation and maintenance (O&M) costs and shutdown times. By providing early corrosion rate data, this system allows the prediction of failures in critical units of the plant.

1. Introduction

Geothermal power is cost-effective, reliable, sustainable, and environmentally friendly and UE recognizes geothermal energy’s essential role in the European energy transition towards net-zero greenhouse gas emissions in 2050. Recent estimations indicate that the global production capacity for geothermal electricity is at about 16 GW (installed capacity in 2020) and is expected to rise to just over 25 GW by 2025 [1].
The economic feasibility of geothermal Installations relies on the continuous operation of the geothermal loop. However, the exploitation of these power plants is usually accompanied by corrosion damages and the formation of scale deposits in the pipelines and power equipment, leading to efficiency reduction.
The overall economic losses connected with the formation of deposits and corrosion of metallic components at the plants comprise the costs for measures taken to remove the consequences and prevent the occurrence of the above-mentioned problems and the impact connected with the underproduction of electricity due to failures of the equipment, forced outages, and degraded efficiency of the power station as described in the comprehensive review published in [2] focused on water pipelines corrosion and in [3,4] for geothermal plants.
In this scenario, corrosion-resistant components made of titanium alloys and high-alloyed stainless steels are commonly employed for dealing with these problems [5]. However, if inexpensive carbon steel or low alloying stainless steel components could be used, this would improve the power plant’s economic factors by generating a considerable reduction in capital investment. Moreover, if the system could be monitored in real time to determine the condition of the materials, it would lead to optimized maintenance schedules and a decrease in operation and maintenance (O&M).
Since laboratory testing cannot completely mimic all the complex processes that occur in real operating conditions, a detailed demonstration and monitoring plan for evaluating the performance of the material at a selected geothermal demo site in Iceland was elaborated within the GECO (geothermal emission control) project [6].
Corrosion and scaling phenomena are difficult to detect visually or monitor continuously. Commonly non-destructive testing methods for pipeline corrosion include visual inspection, magnetic flux leakage detection [7], eddy currents [8], ultrasonic tomography [9], and X-ray technology [10,11]. However, these techniques are strongly impacted by the surrounding environmental factors and in practice, usually require professionals or robots to scan the pipes, which is very labor-intensive. One shortcoming of this kind of inspection relies on the expertise of the staff and thus, the reliability of the results is not guaranteed.
Alternative standard sensors based on pH, temperature, pressure measurements, chemistry composition, and fluid physical properties have been also applied as indirect methods for corrosion rate control [12]. Other techniques utilizing different types of sensors have been introduced more recently to establish a better means of assessing pipeline corrosion such as mass loss probes or electrical resistance measurements [13]. However, these commercially available methods lack enough robustness for accurate and reliable measuring and evaluating the corrosion behavior of the alloys employed in geothermal systems.
Acoustic emission [14,15] and fiber optic sensors [16,17] are also popular technologies in the field of pipe monitoring. They both have high accuracy and can be used for remote monitoring but the low anti-interference of acoustic emission and the intricate optical fiber design are the main drawbacks.
Electrochemical techniques have been also extensively researched in laboratories for corrosion studies and have also found practical applications in the construction sector for structural health monitoring. Those commonly employed include linear polarization resistance (LPR), half-cell potential [18], wire beam electrode (WBE) [19], and a combination of them [20].
In particular, electrochemical impedance spectroscopy (EIS) and electrochemical noise (EN) have been reported as some of the most promising in situ electrochemical methods with the potential to be extended to other industrial sectors and their development was rapid in recent years with the advancements in instrumentation and signal processing [21]. One advantage of EN is its application in long-term or early-stage corrosion process monitoring because it instantly detects corrosion rate and corrosion forms [22]. However, EN data are largely influenced by the measurement mode, the surface area of the working electrodes, the electrolyte resistance, and the symmetry of the electrode system; thus, any changes in state variables at the metal/electrolyte interface will lead to fluctuations in potential and current. Coupling EN measurements with other techniques giving access to other quantities or simultaneous measurements of EN with other fluctuating quantities would be of great help for improving technique results [23].
Meanwhile, electrochemical impedance spectroscopy (EIS) analysis is a highly effective method to track metallic conditions and has been used in corrosion analysis for decades, particularly at the laboratory scale [24]. EIS is a powerful tool due to its advantages such as high sensitivity, good accuracy, strong anti-interference, and the ability to achieve real time monitoring. Its non-invasive nature and easy operation made it easy to perform quick and preliminary analysis. One of the significant benefits of conducting EIS analysis is that it allows a better understanding of the electrode reactions with relatively simple steps and analysis and it is possible to detect a failure even before it becomes visible. Potentiostatic EIS is the most used method for monitoring metal corrosion. At different frequencies in potentiostatic EIS, the required DC voltage across the sample is relatively stable and a small AC disturbance voltage signal is applied across the sample under test. By calculating the current and voltage values across the material, the sample’s complex impedance can be calculated [25]. EIS measurements are also being made in the field on materials in service in different industrial environments. In the field, EIS is being established as a method to monitor the material condition, rate of deterioration, remaining life, etc., information that is valuable in planning maintenance programs. However, despite its benefits, EIS is not widely used for onsite corrosion measurements due to the required instrumentation and the complexity of the data interpretation [26].
In this work, an innovative monitoring system is introduced to be installed in a pipeline for onsite and online metallic corrosion monitoring using EIS to determine the corrosion rate and the scaling degree of steel and special alloy pipes under realistic operating conditions in an Icelandic geothermal plant.
This monitoring system uses a three-electrode cell configuration for evaluating the corrosion resistance and identifying the corrosion mechanisms, corrosion rate, and scaling formation occurring in the internal wall of the geothermal pipes. The EIS measurement campaign allowed the comparison between the behavior of different materials under the operating conditions and to establish a ranking of metallic alloys based on their resistance to corrosion. The main focus of this paper is on reviewing field applications of mentioned techniques rather than laboratory experiments.

2. Materials and Methods

2.1. Geothermal Brine and Operating Conditions of the Plant

The Hellisheiði geothermal power plant, SW Iceland, was commissioned in 2006 as a combined heat and power plant. Its capacities reach 303 MW for electricity production and 200 MW thermal energy for Reykjavík’s district heating system. The plant utilizes the geothermal energy from the Hengill volcanic system. Currently, ~37,000 tonCO2/year and ~9000 tonH2S/year are produced from the geothermal reservoir, related to geothermal production activities. Roughly one-third of CO2 emissions and three-quarters of H2S are currently dissolved in water and re-injected into the subsurface basaltic host rock for safe and permanent carbon mineralization storage [27].
During the first field campaign, acidified brine at 117 °C and pH~6 is connected straight through to the piping system and returned to the re-injection process stream of the power plant. The operational conditions of the selected location for monitoring were provided by OR [28] and are detailed in Table 1. The composition and characteristics of the brine are collected in Table 2.

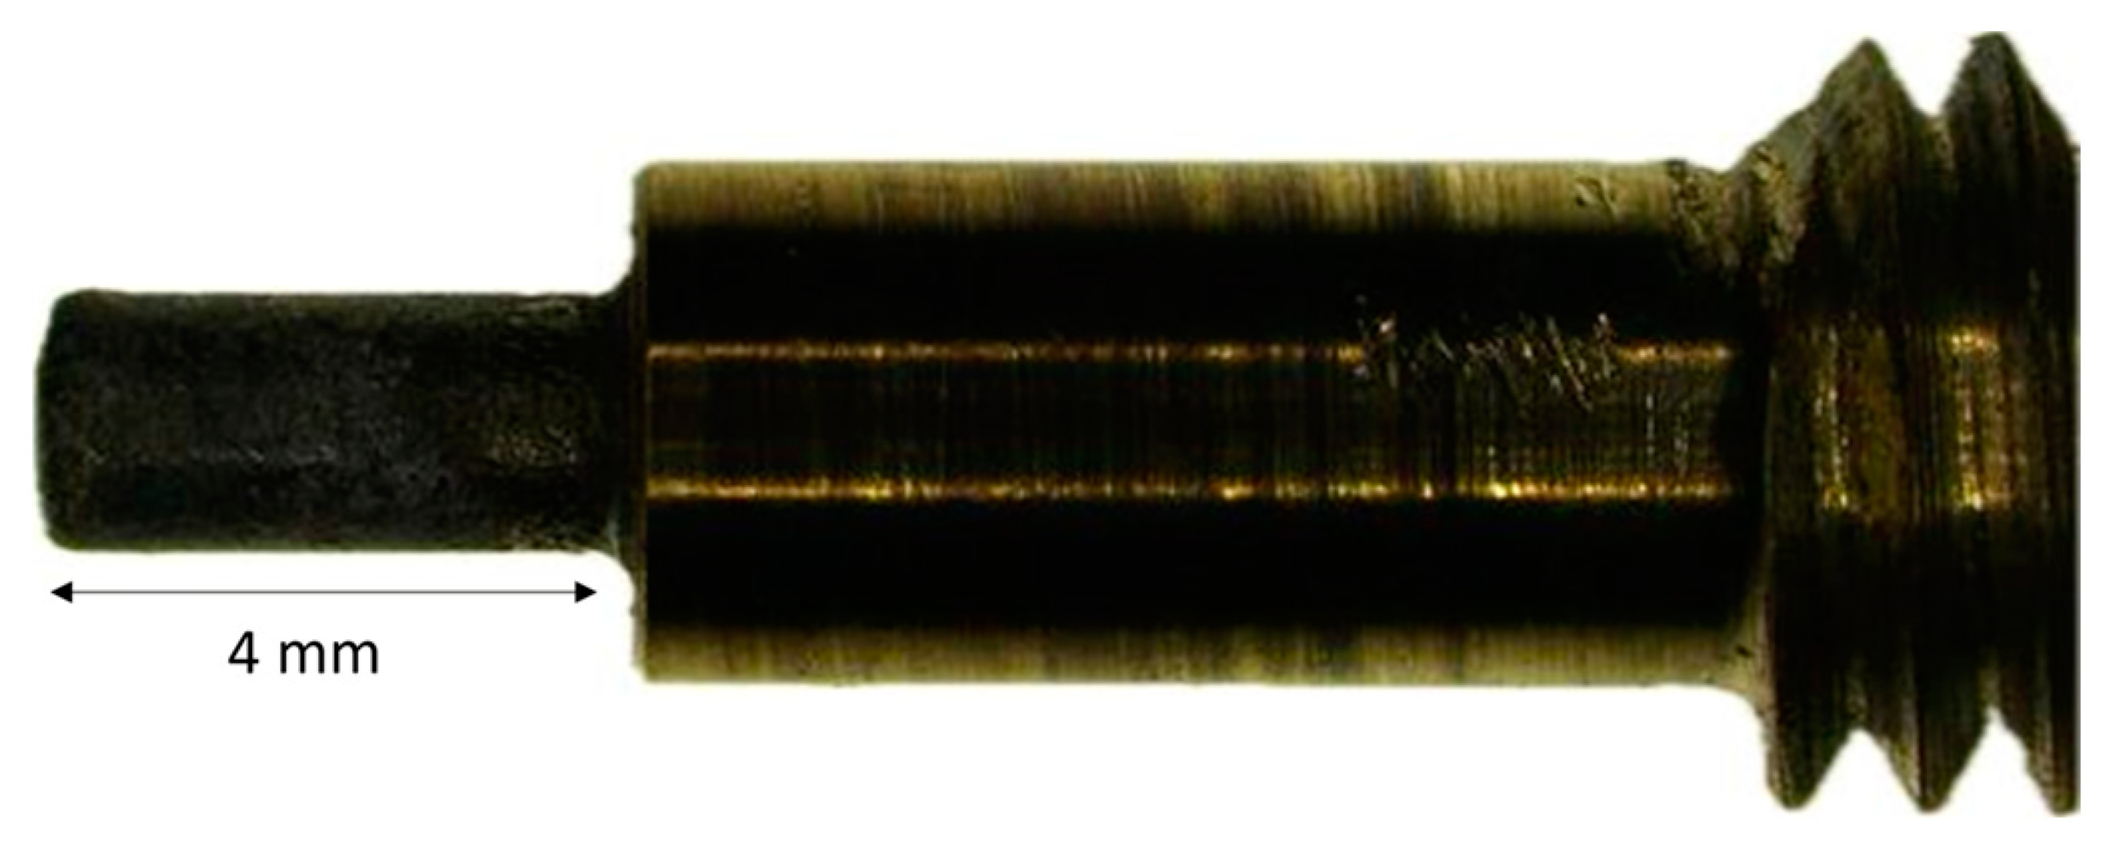
2.2. Metal Substrate

According to the information provided by the plant, it is evident that the operational conditions at the Hellisheiði facilities require materials with high corrosion resistance for the elements in direct contact with brine. Stainless steel and nickel alloys were selected a priori for the corrosion monitoring arrangement. These highly resistant alloys were compared with more cost-competitive materials such as carbon steels. The chemical compositions of each tested alloy are shown in Table 3:

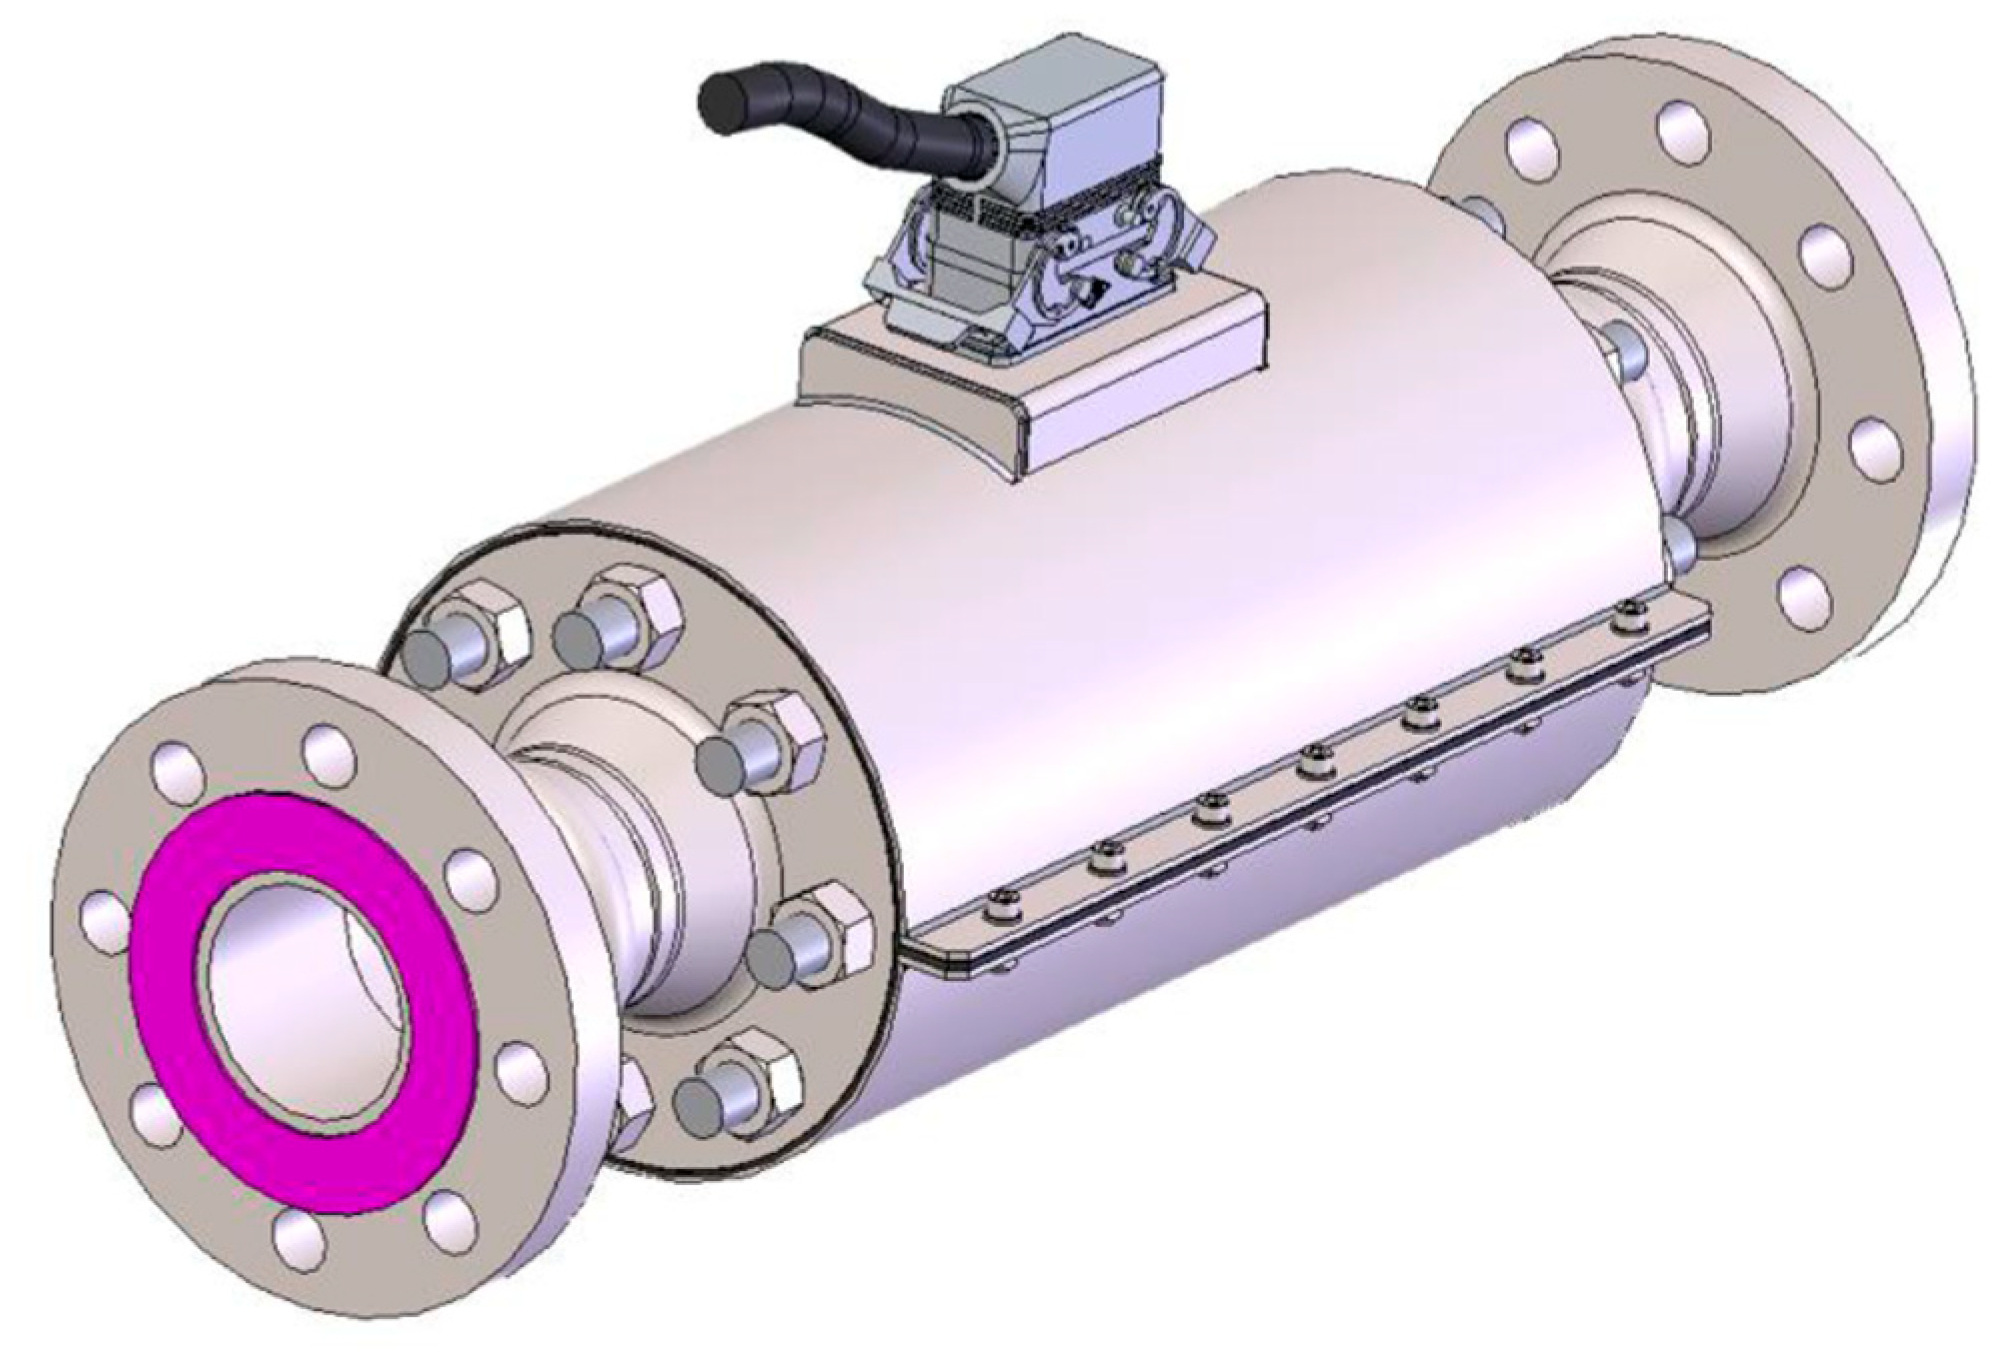
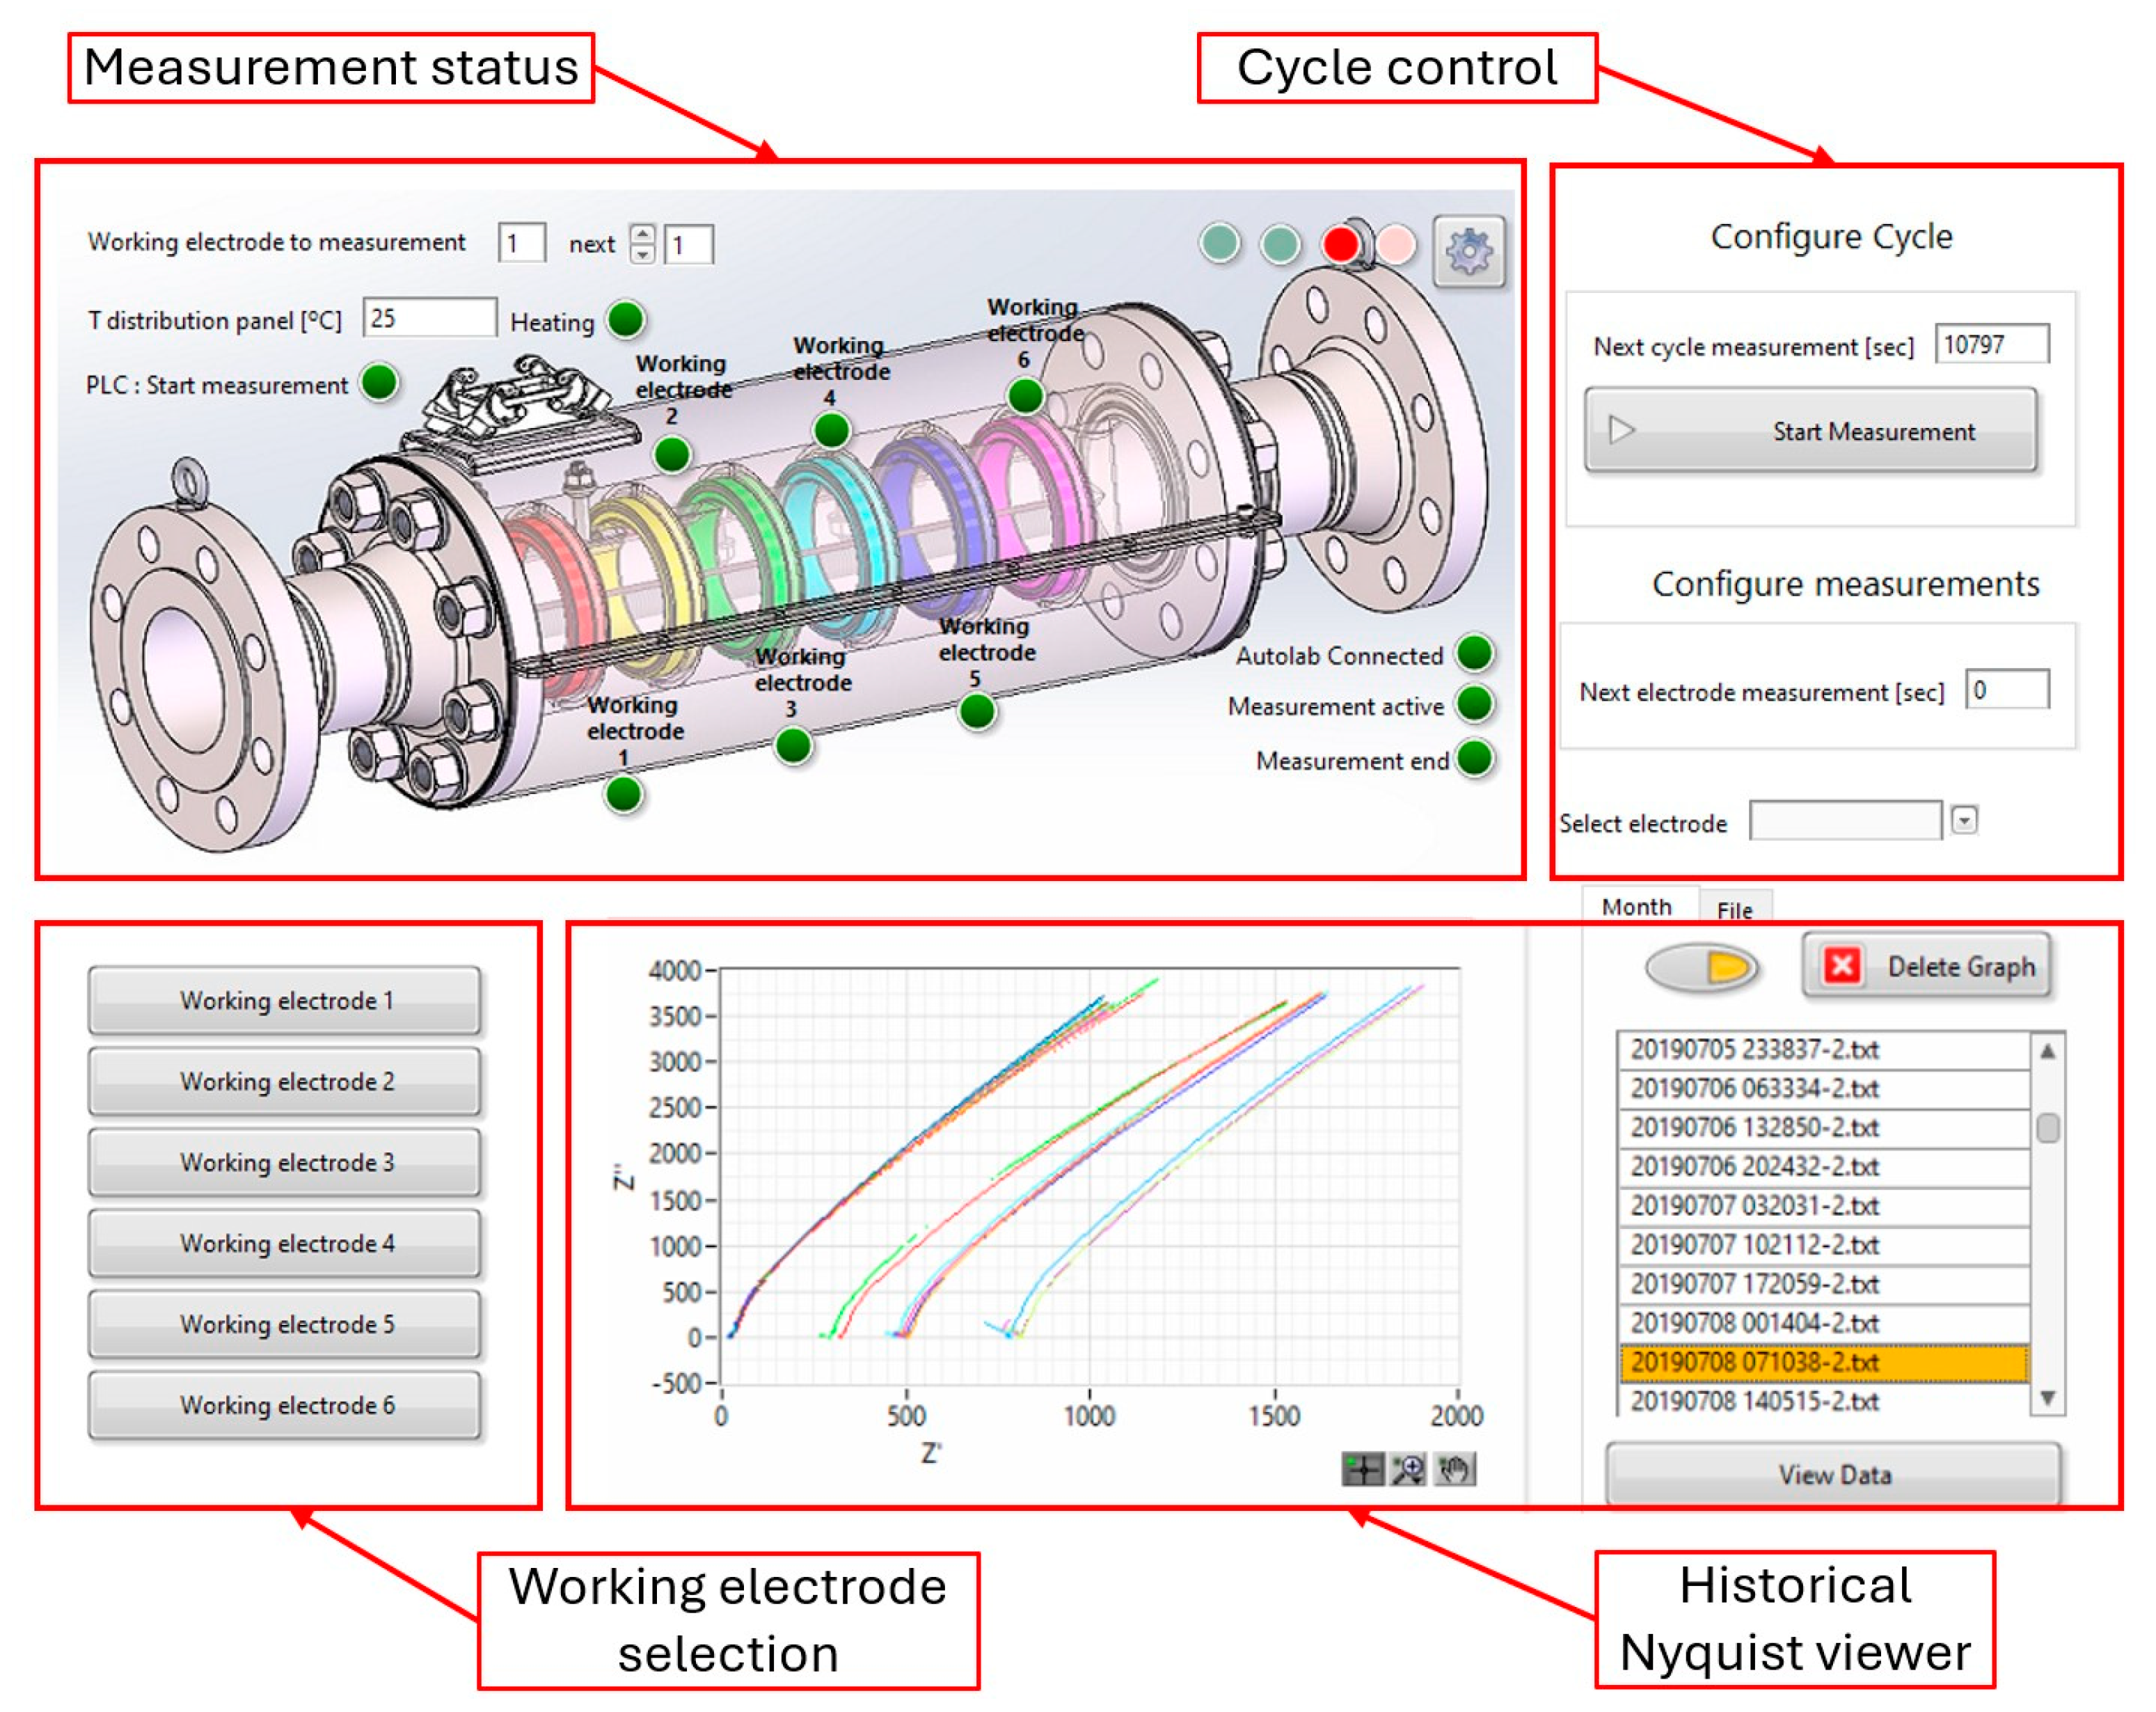
2.3. Corrosion Monitoring System Design

The corrosion monitoring system is designed based on the principles of a conventional three-electrode-configuration cell for electrochemical measurements and it must meet certain requirements. The system requires three electrodes, consisting of a reference electrode (RE), a counter-electrode (CE), and a working electrode (WE). This configuration is selected as the optimum to perform reliable EIS measurements. Additionally, it is multi-material; thus, different alloys can be tested under the same conditions. The design of the system and the selected materials must withstand the harsh operating conditions of the installation environment and the geothermal fluid chemistry. The whole system (the probe and the data acquisition system) should be simple to install to avoid disruptions in the plant operation and these materials should be easily dismantled once the testing campaign is completed.
The sensor operation should be autonomous and unassisted since there are no personnel available at the plants to configure or collect data during its continuous operation. The measurements must be periodically scheduled and transmitted through wireless technology to an online server to be remotely analyzed by the technical staff.
Based on those specified requirements, a conceptual design of the complete system was generated, including both the sensor geometry and the electrode distribution. An outline of the described preliminary design of the probe manufactured is shown in Figure 1.
The designed preliminary design consists of a cylindrical body, divided into different sectors simulating pipe sections. Its internal diameter is equal to that of geothermal piping (27.30 mm). Using these dimensions, the fluid passes through the probe without any load loss due to section changes.
From the electrochemical point of view, finite element method (FEM) simulations of the electric field in the environment of the WE were carried out. The objective was to establish the optimal size of the electrodes and the insulating ring elements, seeking the optimization of two fundamental effects: (i) reduction in the edge effect and (ii) reduction in the non-useful area of the electrode, which can contribute to the distortion of the electrochemical measurements. Taking the electrical field distribution obtained by FEM as a reference, the segments are in the form of rings with an optimal width of 15 mm and they are manufactured using the alloys that have been previously selected (Table 3) on which the electrochemical measurements will be performed (WE). On both sides of each metallic WE, two AISI 316 stainless steel CE rings are placed with the same geometry and 15 mm width. This disposition was selected to obtain a proper distribution of the electric field over each WE during the measurement. The total surface area of the CE (2600 mm2) is twice that of the WE ring (1300 mm2); thus, the current density passing through the CEs will be lower than on the WEs. As the measurement performed on the WE is non-destructive, the lower current density on the CEs corresponds to a non-destructive test.
A platinized titanium screw (4 mm length, 2 mm diameter) is inserted on each sector as RE to stabilize the electrical potential during the EIS measurements (see Figure 1 and Figure 2). The electrode is an inert material that allows measuring the redox potential of the environment (mainly defined by O2 concentration, in the absence of other redox active species), which was reported as the most common kind of electrode in electrochemical technology due to their stability and electrocatalytic activity. Additionally, it was previously demonstrated that the Pt reference electrode performs well in geothermal brine solutions at high pressure and temperature (~250 °C). Unlike conventional reference electrodes (even when modified for high temperatures), the Pt reference electrode is applicable to measurements in complex polluted brines [29].
To avoid electric contact between the cell elements, the electrodes are separated by insulating sections made of polyether ether ketone (PEEK), a technical polymer resistant to high temperatures and mechanical stresses, promoting a tight seal of the assembly. The sealing between the different sectors is made by O-rings. To ensure tightness, the sectors and the O-rings are compressed by mechanical elements (screws and nuts) exerting stress in the longitudinal direction.
Figure 3 shows the final design of the proposed test section structure to be installed in the bypass with a final diameter of 123 mm, considering the incorporation of two protective casings.
During this design process, multiple simulations by the finite element method have been also performed to ensure the correct operation of the mechanical structure, ensuring that the complete system will withstand the working conditions of the site. On one hand, tightness calculations have been carried out for the longitudinal mechanical elements to guarantee good sealing. On the other hand, simulations of the stresses suffered by the PEEK due to the pressure and temperature of the fluid inside the pipe have also been performed, adjusting its thickness to meet the test conditions.
Although PEEK could be the most sensitive material a priori, it was confirmed that PEEK mechanical resistance (as Young Modulus) decreases by only around 5% in the potential operation range (from 22 °C to 100 °C).
The main cylindrical body is protected by a metal casing (duplex stainless steel). This casing was designed to confine the testing materials and withstand the stress of the pressure exerted internally by the geothermal fluid, as shown in Figure 4. A second casing of duplex stainless steel is placed above this to prevent leakages and to protect the electrical connections from the aggressive environment generated in the geothermal plant. To ensure a watertight connection between the test section and the peripheral electric elements, a special connector is used.
The entire system is assembled manually according to the order established in the design to ensure proper operation and the leak tightness of the system. The connection to the test loop is made by stainless steel standard flanges PN16 DN25 (Figure 2 and Figure 4).
To complete the corrosion monitoring system, an electrical panel is also designed and manufactured based on the functional scheme depicted in Figure 5.
The peripherical elements composing the unity are confined in an electrical cabinet to be protected from the corrosive environment. These individual components include a multiplexer, responsible for connecting the different electrodes according to the cell configuration. The system also includes a potentiostat that performs the electrochemical measurements. The potentiostat is connected to a PC on which the measurement software is running. The data obtained are imported and classified in the PC for later processing.
The controller is responsible for managing the activation of the multiplexer and coordinating it with the measurements made by the potentiostat. Its operation is autonomous but supervised by the measurement software running on the control PC. The control PC is responsible for the software execution and the measurement monitoring and it has an interface to visualize the current state of the system, configure the measurements, record the events, and store the measurements. The 3G/LTE modem provides internet connectivity to the measurement system, allowing it to be saved to the cloud as soon as they are registered and it can be downloaded remotely in the office for safekeeping.
The complete system is developed to work unattended and it starts automatically to perform measurements without any human interaction.
The measurement procedure is controlled by a specialized software executed remotely on a PC. These measurements are then transmitted through a 3G modem and periodically supervised by expert staff. The software, developed in LabVIEW® 2020 (National Instruments, Austin, TX, USA), allow communication with the controller and the potentiostat to coordinate the EIS measurements made on the rings. The software has an HMI interface (as shown in Figure 6) that can be accessed remotely or locally. Through the interface, it is possible to perform the following functions: monitor the status of measurements, measurement cycle control, procedure configuration, display of the last measurement of each ring, and representation, individually, or comparatively of the history of the obtained data.

2.4. Electrochemical Impedance Spectroscopy Measurements (EIS)

EIS is a non-destructive technique that has been extensively used for the study of metal corrosion protection. EIS is especially suitable for the study of surfaces having a high electrical or electrochemical impedance and is, therefore, particularly suitable for the degradation evaluation of highly resistive metals or protective organic coatings [30,31,32].
This electrochemical technique was selected to be implemented in the corrosion sensor due to its high sensitivity. It can detect changes in the material/coating long before any visible damage occurs. Additionally, it can also identify changes in the electrolyte resistivity due to the onset of inorganic deposits, which is another critical issue in geothermal systems. Therefore, it is expected that corrosion sensors using this technique will be able to identify corrosion mechanisms and scaling growth in real time, preventing corrosion problems and assuring early implementation of solutions.
EIS measurements were obtained by using a potentiostat PGSTAT20 from Metrohm Autolab® (Utrecht, The Netherlands). Impedance was measured in the frequency range between 100 kHz and 0.01 Hz (seven points per decade) with a selected AC potential perturbation of 50 mV (rms), which was dependent on the testing materials’ resistivity. EIS measurements were executed daily and registered every 4 h to follow the behavior of the metals exposed under real conditions in the pipeline during a period of one year.
Further spectra analysis allowed the formulation of a hypothesis on the electrical behavior of the system and the establishment of an equivalent circuit model. EIS data were commonly analyzed by fitting it to an equivalent electrical circuit model consisting of passive elements such as resistors, capacitors, and inductors. The different impedance parameters involved in the selected EIS model were obtained by a regression procedure based on a simplex strategy. The literature proposes different models of equivalent circuits to interpret the impedance data [33,34]. However, to be useful, the elements in the model should have a physical meaning in the electrochemistry of the system. Thus, this technique is relatively easy to apply but the data extracted from it are not; in most cases, they are directly interpretable and require a deep prior knowledge of the real system. As a simpler way to assess the corrosion resistance of the materials, the impedance modulus (ǀZǀ) at low frequencies, as the polarization resistance (Rp), is employed as a quantitative parameter to determine materials corrosion performance. There is a good linear relationship between average corrosion current and polarization resistance; therefore, higher Rp implies higher corrosion resistance and, in consequence, better barrier properties. Another phenomenon expected in the current study case is the formation of fouling deposition that promotes an identical Rp increment as will be explained in the results section below.

3. Results

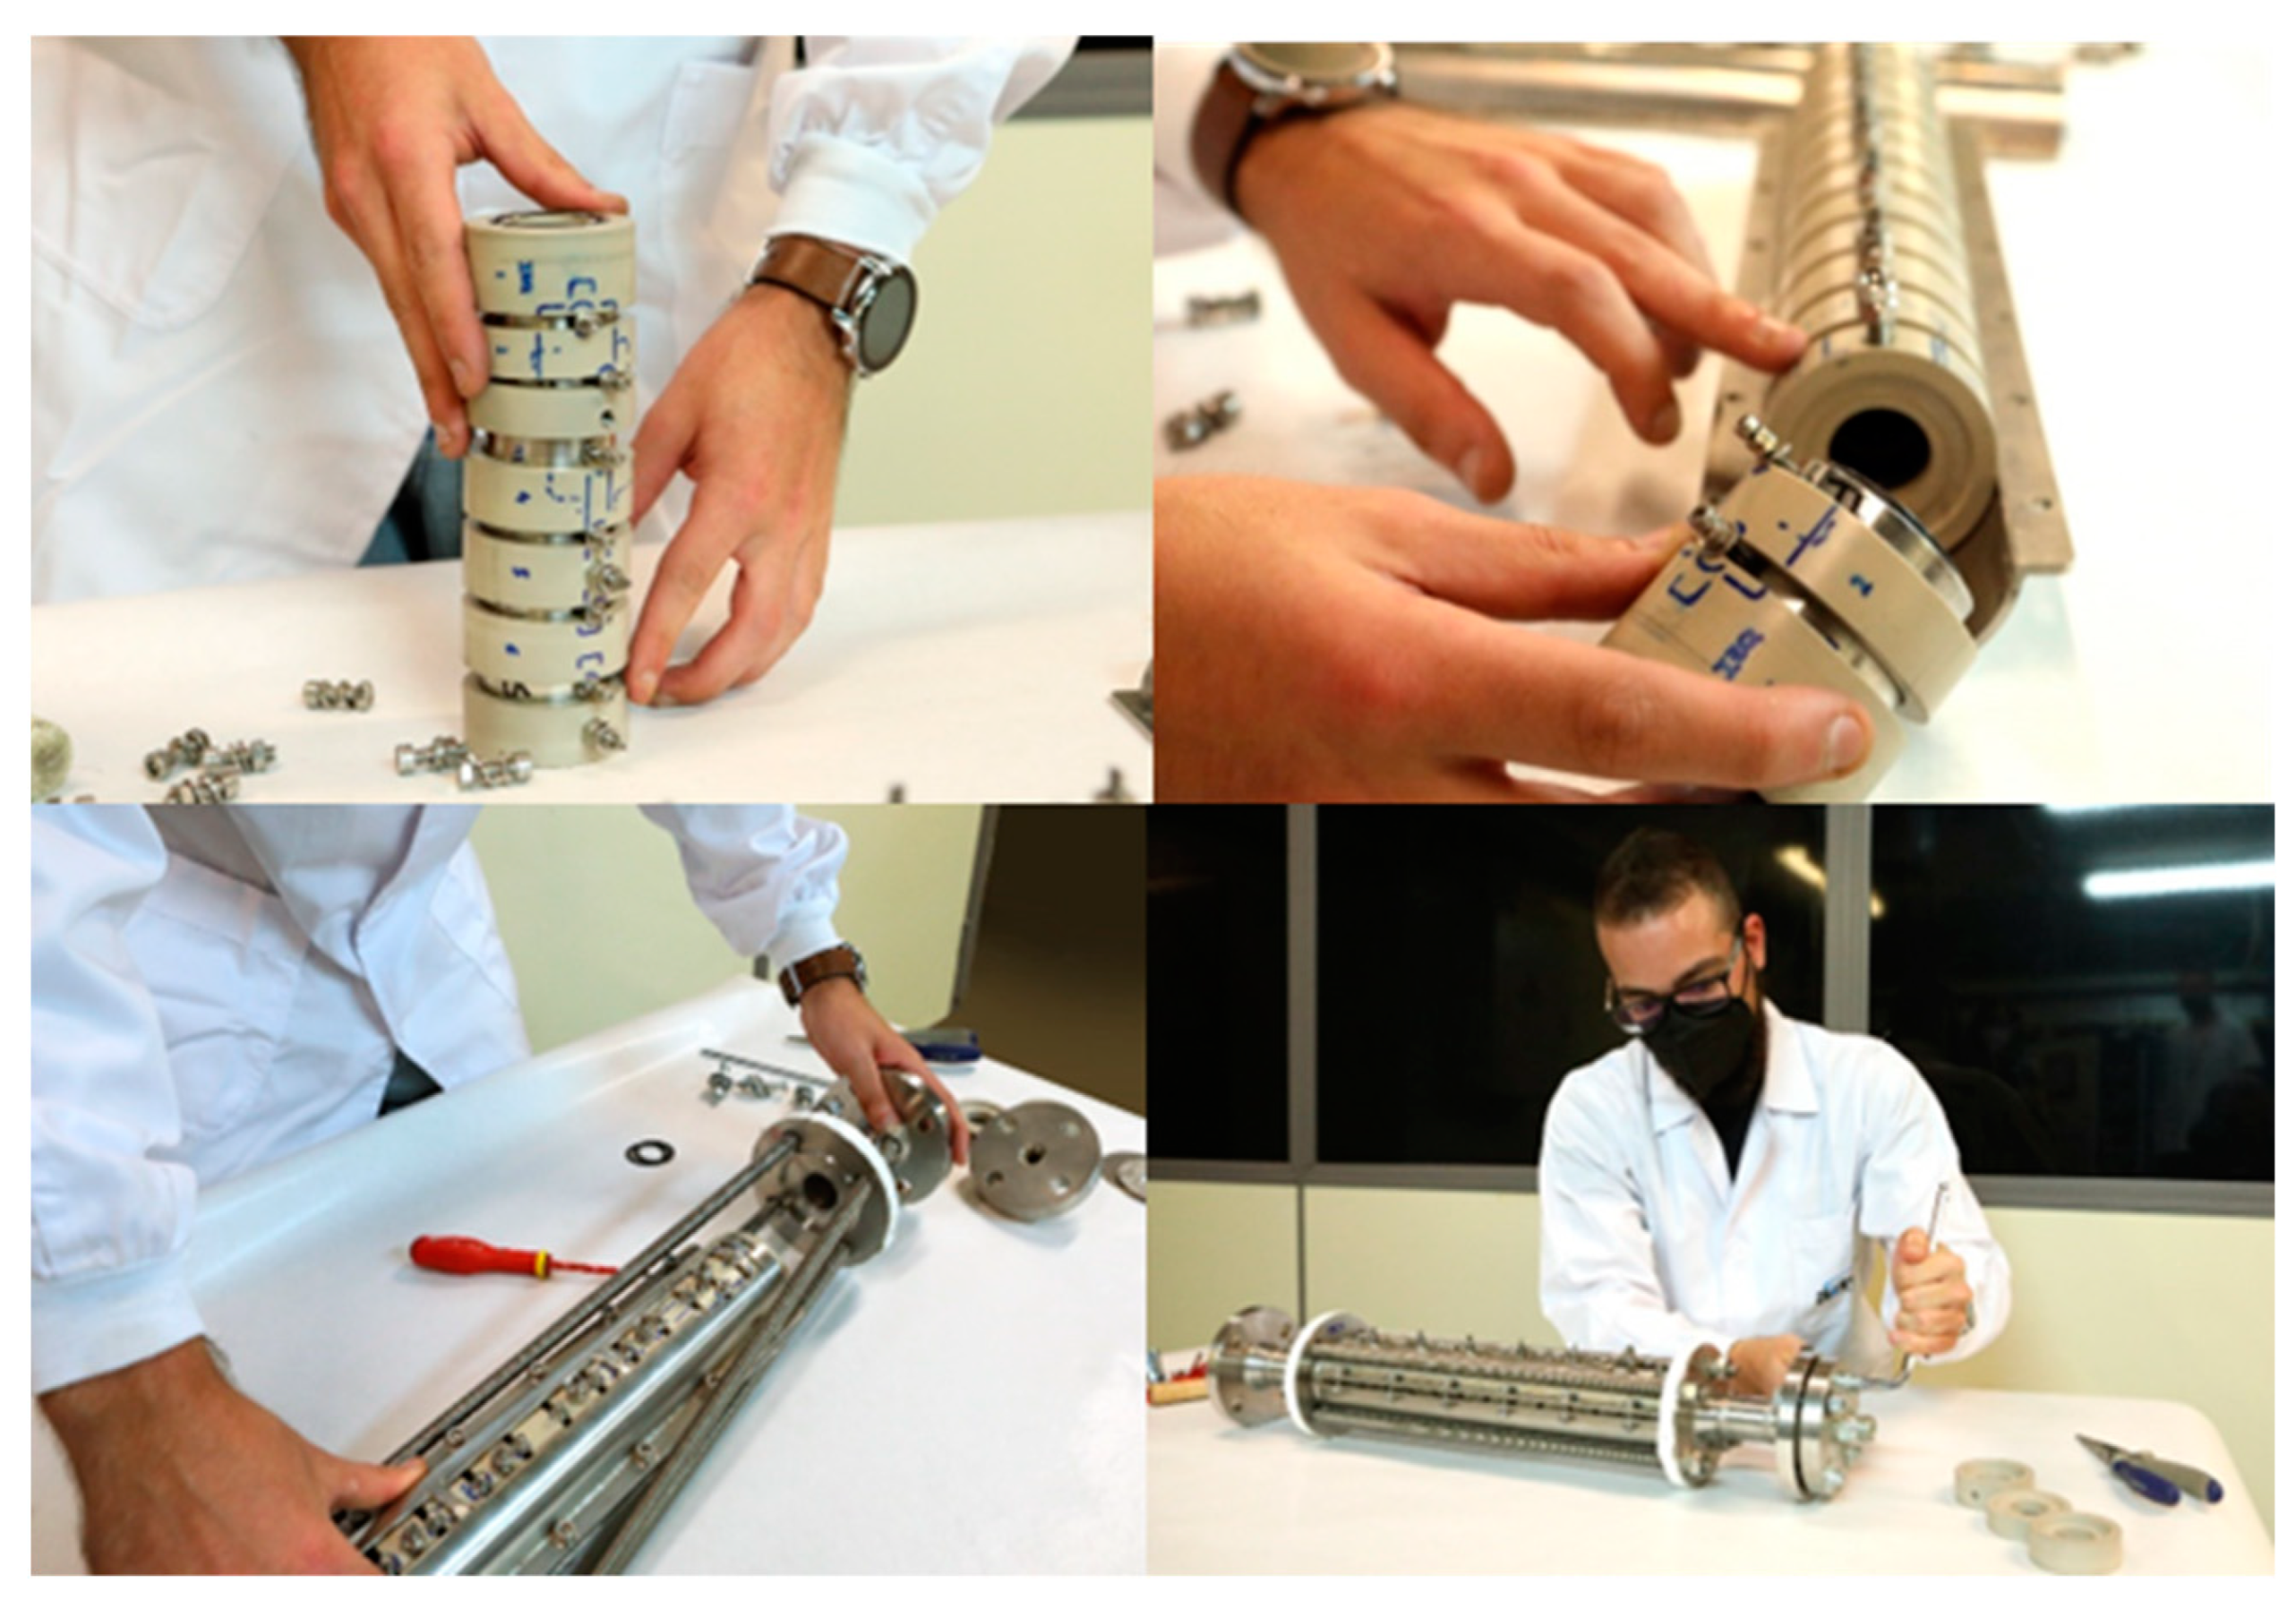
3.1. Assembling, Installation, and Start-Up of the Corrosion Monitoring System

The entire system was manually assembled according to the order established in the design to ensure electrical functionality and leak tightness of the equipment. This assembling procedure is depicted in Figure 7.
The installation in the test loop of the plant was simple. Stainless steel flanges were fitted on both sides of the probe and mechanically attached to the pipeline using screws and nuts (Figure 8, left).
The control cabinet was installed attached to a wall in the surroundings (Figure 8 right and Figure 9) to minimize the resistance induced by cable length.
Auxiliary components are also incorporated into the system to enhance its functionality. These components include electrical protection against transient overvoltages and temperature measurement. The system is designed to cancel the test in case the temperature exceeds 40 °C as this can compromise the proper operation of the potentiostat.

3.2. EIS Measurements

EIS measurements were performed to assess the electrochemical behavior of the different exposed alloys in continuous contact with the brine. The measurement campaign started when the probe bypass was totally filled with the geothermal fluid and it was extended for a year. However, this work covers only the results obtained for the initial first three-month demonstration period (from November 2022 to January 2023), which was considered time enough to validate the EIS-based sensor monitoring technology. Analyzing the obtained impedance spectra, clear differences between corrosion rates of nickel alloys (WE1), stainless steels (WE2, WE3, and WE4), and carbon steels (WE5 and WE6) were identified.
Nyquist plots obtained for WE1 (Inconel 625®), WE2 (SMO254), WE3 (DSS14410), and WE4 (AISI 316) are depicted in Figure 10. The overall impedance presented an identical trend, being characterized by one unique flattened capacitive loop with high impedance values that generally decreased during the experiment running (after 90 days), suggesting a process controlled by a charge transfer mechanism and a de-enhancement of its protective behavior as reported in the literature [35]. Initial impedance values (Z’) were in the range of 1.0·103 (WE1) and 3.0·103 Ωcm2 (WE2, WE3, and WE4), indicating that the materials presented low corrosion rates in this medium at early stages.
For a more detailed analysis and a deeper discussion of the time evolution, EIS was fitted using equivalent circuits. These spectra could be successfully fitted to a standard Randles equivalent circuit (R-RC) (Figure 11) [36]. This circuit is one of the simplest possible models describing processes at the electrochemical interface composed of a first pure resistance, associated with the electrolyte resistance (Re), followed by a resistance in parallel to a capacitance (R1C1). These two elements correspond to the polarization resistance (R1 = Rp) and to the double-layer capacitance (C1).
In particular, Rp refers to the restriction of charge transfer at the interface between the electrode and the electrolyte and it is widely accepted as a quantitative parameter for corrosion resistance evaluation in metallic systems. The corrosion rate is inversely proportional to the Rp [37]; thus, a WE with lower Rp will be corroded easily.
As shown in Figure 11 for WE1, Nyquist plots for a simplified Randles cell is always a semicircle. Re can be found by reading the real axis value at the high-frequency intercept and the real axis value at the low-frequency intercept is the sum of the Rp and the Re. In consequence, the diameter of the semicircle is used for the Rp value estimation as shown in Figure 11.
WE2, WE3, and WE4 presented almost identical values for Rp during the 90-day testing period: around 3.0·103 Ωcm2 as it was compiled in Table 4. In contrast, the WE1 ring presented not only a different tendency (irregular impedance evolution with time and initial increment followed by a resistance stabilization) but also smaller overall impedance magnitudes (1.0·103 Ωcm2). Considering that WE1 is a nickel-based alloy, with a recognized high corrosion resistance [38], an alternative explanation for this effect can be focused on the formation of scaling on the pipe surface. Carbonates-based compounds and dissolved silica particles present in the brine composition could be precipitated and adhered to the inner part of the sections, promoting the formation of an additional layer and a subsequent increase in the Rp for the stainless steel electrodes (WE2, WE3, and WE4). Nevertheless, the presence of nickel in WE1 dramatically reduced this effect, due to the well-known properties of this element in scaling/fouling prevention as reported in the literature [39], decreasing the Rp values.
Further discussion on this matter will be pursued in the future once the measurement campaign is finished and chemical analysis on the sections could be performed to validate the proposed hypothesis.
Figure 12 shows the Nyquist plots obtained for the carbon steels, WE5 (PG265H) and WE6 (K55). As expected, the overall impedance resistances (Z’) increased during the first 60 days due to the formation of an iron-oxide-based-passive film and then decreased slightly, indicating an activation onset of the corrosion process. The lower values recorded for the impedance in comparison with the previous stainless alloys (stabilized in the range of 0.5–0.7·103 Ωcm2) were associated with the inferior protective character of the oxide layer formed on the carbon steel and the faster kinetic of the corrosion process in the presence of brine.
In this case, two resolved loops could be identified in the spectra, corresponding to two-time constants, attributed to the charge transfer (high-frequency domain) and to the corrosion process (medium-low frequency domain), as shown in Figure 13. The interpretation suggested the following for the circuit elements: the high-medium frequencies time constant was correlated with the charge transfer process and it was composed by the charge transfer resistance (R1) in parallel with the double layer capacitance (C1); the low-medium frequencies (R2 and C2) time constant has been associated with the redox processes taking place in the surface film, corresponding to the passive oxide film formed between the electrolyte and the carbon steel substrate. A more detailed description of these parameters can be found elsewhere [14].
In this case, the sum of R1 and R2 was considered for the estimation of Rp for comparison purposes. The formation of a less protective oxide film on the carbon steels, the poorer barrier properties, and the advance of the corrosion events were confirmed by the reduced magnitude of the corrosion resistance (Rp), as shown in Figure 13 and Table 4.
Figure 14 shows the Rp evolution during the first three months. Rp average values are represented for each WE during different weeks. According to the previous results, WE5 and WE6 presented the lowest Rp values, being the K55 the least corrosion-resistant steel.
SMO 254, superduplex, and AISI316 presented the highest impedance values considering almost identical corrosion behavior for the three alloys under the studied conditions. As is well-known, EIS results obtained from the corrosion monitoring sensor revealed more protective and stable surface films formed on the stainless steel surfaces [40] during this first stage.
Table 4 presented the values obtained from an average Rp value (Ωcm2) calculated for the whole three-month period. This parameter evolution allowed the establishment of a ranking of metallic alloys from the most corrosion resistant to the least under these specific aggressive conditions and, in consequence, the validation of the EIS corrosion monitoring sensor technology.
These results were not necessarily constant during the testing time because the nature of the layers over the metal could change and grow or scaling phenomena could appear. For instance, the apparition of single peaks were registered in the resistance values that could be explained by the irregularities in the flowrate: when the flow rate decreased, the impedance increased abruptly, probably due to the formation of deposits on the metal substrates.
The obtained results so far allowed us to establish a scale of materials from the highest corrosion resistant to the lowest under the conditions of the Iceland plant: WP4 (SMO 254) > WP2(AISI 316) > WE3 (Superduplex 2507) > WE1 (INCONEL 625) > WE5 (P265GH) > WE6 (K55)
A deeper analysis will be performed at the end of the testing campaign by including physico-chemical analysis to validate the sensor results and optimize the best combination of material/brine.
However, these results have evidenced that the non-destructive EIS technique is a powerful and valid tool to monitor the degradation status of metallic materials under real conditions and in real time long before any visible damage occurs.

4. Conclusions

A dedicated corrosion monitoring equipment for online and continuous monitoring of metallic alloy degradation in geothermal plants was designed, developed, installed, and validated in a demo site located in Iceland to run under high temperature and pressure conditions for one year.
The corrosion monitoring sensor has continuously recorded impedance measurements to follow the corrosion performance of the exposed alloys in real time by using a non-destructive tool. EIS results and interpretation by electrical equivalent circuits allowed to establish a ranking of alloys performance from the highest corrosion resistant to the lowest one under the real operating conditions of the plant: SMO 254 ≥ AISI 316 ≥ Superduplex 2507 > INCONEL 625 > P265GH > K55.
This work allows us to conclude that the innovative electrochemical sensor can provide real time quantitative data related to the quality of the material used in pipeline installations, estimating the corrosion rate (as Rp) and identifying its cause. This information will allow us to select the best-performing material, optimizing the operating conditions, while maximizing the overall geothermal plant efficiency.
The application of this novel technology will lead to an overall extension of power plant operative life and a reduction in the O&M costs linked to unexpected failures due to corrosion processes, assisting in implementing improved predictive maintenance methodologies of the geothermal assets.
Based on the throughout work, research gaps as well as the corresponding future directions were identified. Despite the great potential of EIS for deriving mechanistic and kinetic information for processes that occur at a corroding interface, complementary studies on machine learning are still required to facilitate the understanding of the obtained results, which requires expert staff to understand and interpret the fitting models and obtain useful and reliable data.
At this point, it is worth mentioning that this corrosion monitoring sensor was nominated as a finalist technology of the Ruggero Bertani European Geothermal Innovation Award in 2021 [41,42].

Author Contributions

Methodology, I.E.; software, J.S. and R.C.; validation, J.S. and R.C.; formal analysis, J.S. and R.C.; investigation, I.E.; data curation, I.E.; writing—original draft preparation, L.F.; writing—review and editing, L.F.; supervision, L.F.; project administration, L.F. All authors have read and agreed to the published version of the manuscript.

Funding

This research has received funding from the European Union’s Horizon 2020 research and innovation program under grant agreement nº 818169.

Data Availability Statement

The raw data supporting the conclusions of this article will be made available by the authors on request.

Conflicts of Interest

The authors declare no conflicts of interest. The funders had no role in the design of the study; in the collection, analyses, or interpretation of data; in the writing of the manuscript; or in the decision to publish the results.

References

  1. Statista. Available online: https://www.statista.com/statistics/495576/geothermal-installed-capacity-worldwide-by-region-forecast/ (accessed on 20 February 2024).
  2. Hassan, M.; Farh, H.; El Amine, M.; Seghier, B.; Taiwon, R.; Zayed, T. Analysis and ranking of corrosion causes for water pipelines: A critical review. Clean Water 2023, 6, 65. [Google Scholar]
  3. Khasani, K.; Kusmono, K.; Utami, P.; Budiarto, R. Corrosion in geothermal facilities: Their causes, effects, mitigation and worldwide cases. AIP Conf. Proc. 2021, 2338, 020007. [Google Scholar]
  4. Penot, C.; Martelo, D.; Paul, S. Corrosion and scaling in geothermal heat exchangers. Appl. Sci. 2003, 13, 11549. [Google Scholar] [CrossRef]
  5. Thomas, R. Titanium in the geothermal industry. Geothermics 2003, 32, 670–687. [Google Scholar] [CrossRef]
  6. Geothermal Emission Control, GA Number 818169. Available online: https://geco-h2020.eu/ (accessed on 20 February 2024).
  7. Bubenik, T. Electromagnetic Methods for Detecting Corrosion in Underground Pipelines: Magnetic Flux Leakage. In Underground Pipeline Corrosion; Woodhead Publishing: Cambridge, UK, 2014; pp. 215–226. [Google Scholar]
  8. Ishkov, A.V.; Dmitriev, S.F.; Katasonov, A.O.; Fadeev, D.A.; Malikov, V.N. Inspection of corrosion defects of steel pipes by eddy current method. J. Phys. Conf. Ser. 2021, 1728, 012006. [Google Scholar] [CrossRef]
  9. May, Z.; Alam, M.K.; Nayan, N.A. Recent Advances in Nondestructive Method and Assessment of Corrosion Undercoating in Carbon–Steel Pipelines. Sensors 2022, 22, 6654. [Google Scholar] [CrossRef]
  10. Komary, M.; Komarizadehas, S.; Tošić, N.; Pérez, I.S.; Turmo, J. Low-cost technologies used in corrosion monitoring. Sensors 2023, 23, 1309. [Google Scholar] [CrossRef]
  11. Shin, D.-H.; Hwang, H.-K.; Kim, H.-H.; Lee, J.-H. Evaluation of commercial sensors for real time monitoring of pipe wall thickness under various operational conditions. Sensors 2022, 22, 7562. [Google Scholar] [CrossRef]
  12. Foorginezhad, S.; Mohseni-Dargah, M.; Firoozirad, K.; Aryai, V.; Razmjoue, A.; Abbassi, R.; Garaniya, V.; Beheshti, A.; Asadni, M. Recent Advances in Sensing and Assessment of Corrosion in Sewage Pipelines. Process Saf. Environ. Prot. 2021, 147, 192–213. [Google Scholar] [CrossRef]
  13. Wright, R.F.; Lu, P.; Lu, F.; Ziomek-Moroz, M.; Ohodnicki, P.R., Jr. Corrosion sensors for structural health monitoring of oil and natural gas infrastructure: A review. Sensors 2019, 19, 3964. [Google Scholar] [CrossRef]
  14. Goldaran, R.; Turer, A. Application of acoustic emission for damage classification and assessment of corrosion in pre-stressed concrete pipes. Measurement 2020, 160, 107855. [Google Scholar] [CrossRef]
  15. Calabrese, L.; Proverbio, E. A Review on the Applications of Acoustic Emission Technique in the Study of Stress Corrosion Cracking. Corros. Mater. Degrad. 2021, 2, 1–30. [Google Scholar] [CrossRef]
  16. Tan, X.; Fan, L.; Huang, Y.; Bao, Y. Detection, visualization, quantification, and warning of pipe corrosion using distributed fiber optic sensors. Autom. Constr. 2021, 132, 103953. [Google Scholar]
  17. Raju, B.; Kumar, R.; Dhanalakshmi, S.; Dooly, G.; Duraibabu, D.B. Review of Fiber Optical Sensors and Its Importance in Sewer Corrosion Factor Analysis. Chemosensors 2021, 9, 118. [Google Scholar] [CrossRef]
  18. Frolund, T.; Klinghoffer, O.; Erndahl Sorensen, H. Pro’s and Con’s of Half-Cell Potentials and Corrosion Rate Measurements. In Proceedings of the 10th International Conference on Extending the Life of Bridges, Concrete + Composites, Buildings, Masonry + Civil Structures, London, UK, 1–3 July 2003; ISBN 0-947644-52-0. [Google Scholar]
  19. Yongjun, T.; Naing, N.A.; Tie, L. Evaluating localized corrosion intensity using the wire beam electrode. Corros. Sci. 2012, 63, 379–386. [Google Scholar]
  20. Heselmans, J.; Hladky, K.; Holdefer, M.; Wessels, R. New Probe Combines ER, LPR, HDA, Floating B-Constant, Electrochem. Noise & Conductivity, Measurements, CORROSION 2013, Orlando, Florida. March 2013. ISBN: 978-1-62748-145-8. Available online: https://toc.proceedings.com/17841webtoc.pdf (accessed on 20 February 2024).
  21. Rajendran, V.; Prathuru, A.; Fernández, C.; Faisal, N.H. Corrosion monitoring at the interface using sensors and advanced sensing materials: Methods, challenges and opportunities. Int. J. Corros. Process. Corros. Control. 2023, 58, 281–321. [Google Scholar] [CrossRef]
  22. Xia, D.-H.; Song, S.-Z.; Behnamian, Y. Detection of corrosion degradation using electrochemical noise (EN): Review of signal processing methods for identifying corrosion forms. Corros. Eng. Sci. Technol. 2016, 51, 527–544. [Google Scholar] [CrossRef]
  23. Xia, D.-H.; Song, S.; Behnamian, Y.; Hu, W.; Cheng, Y.F.; Luo, J.-L.; Huet, F. Review—Electrochemical Noise Applied in Corrosion Science: Theoretical and Mathematical Models towards Quantitative Analysis. J. Electrochem. Soc. 2020, 167, 081507. [Google Scholar] [CrossRef]
  24. Hack, H.P.; Scully, J.R. Defect Area Determination of Organic Coated Steels in Seawater Using Breakpoint Frequency Method. J. Electrochem. Soc. 1991, 138, 33. [Google Scholar] [CrossRef]
  25. Freire, L.; Carmezim, M.J.; Ferreira, M.G.S.; Montemor, M.F. The electrochemical behaviour of stainless steel AISI 304 in alkaline solutions with different pH in the presence of chlorides. Electrochim. Acta 2011, 56, 5280–5289. [Google Scholar] [CrossRef]
  26. Ura-Binczyk, E.; Dobkowska, A.; Andrzejczuk, M.; Roguska, A.; Mazurkiewicz, B.; Solarski, W.; Balcer, M.; Lewandowska, M.; Banas, J. Application of LPR and EIS techniques for on-site corrosion monitoring at the geothermal plant in Central Poland. J. Mater. Corr. 2021, 1, 11. [Google Scholar]
  27. Available online: https://www.power-technology.com/projects/hellisheidi-geothermal-power-plant/ (accessed on 20 February 2024).
  28. Available online: https://www.or.is/en/ (accessed on 20 February 2024).
  29. Sampedro, J.A.; Rosas, N.; Valdez, B. Corrosion of steel by drilling muds in geothermal wells. Corros. Rev. 1999, 17, 253. [Google Scholar]
  30. Rammelt, U.; Reinhard, G. Application of EIS for characterizing the corrosion protective performance of organic coatings on metals. Prog. Org. Coat 1992, 21, 205–226. [Google Scholar] [CrossRef]
  31. Cristoforetti, A.; Rossi, S.; Deflorian, F.; Fedel, M. On the limits of the EIS low-frequency Impedance modulus as a tool to describe the protection properties of organic coatings exposed to accelerated aging tests. Coatings 2023, 13, 598. [Google Scholar] [CrossRef]
  32. Galván-Martínez, R.; Orozco-Cruz, R.; Carmona-Hernández, A.; Mejía-Sánchez, E.; Morales-Cabrera, M.A.; Contreras, A. Corrosion study of pipeline steel under stress at different cathodic potentials by EIS. Metals 2019, 9, 1353. [Google Scholar] [CrossRef]
  33. Orazem, M.E.; Tribollet, B. Electrochemical Impedance Spectroscopy; John Wiley & Sons: Hoboken, NJ, USA, 2008. [Google Scholar]
  34. Freire, L.; Carmezim, M.J.; Ferreira, M.G.S.; Montemor, M.F. The passive behaviour of AISI 316 in alkaline media and the effect of pH: A combined electrochemical and analytical study. Electrochim. Acta 2010, 55, 6174. [Google Scholar] [CrossRef]
  35. Díaz, B.; Joiret, S.; Keddam, M.; Nóvoa, X.R.; Pérez, M.C.; Takenouti, H. Passivity of iron in red mud’s water solutions. Electrochim. Acta 2004, 49, 3039. [Google Scholar] [CrossRef]
  36. Randles, J.E.B. Kinetics of rapid electrode reactions. Discuss. Faraday Society 1947, 1, 11. [Google Scholar] [CrossRef]
  37. Scully, J.R. Polarization resistance method for determination of instantaneous corrosion rates. Corrosion 2000, 56, 199–204. [Google Scholar] [CrossRef]
  38. Available online: https://www.specialmetals.com/documents/technical-bulletins/inconel/inconel-alloy-625.pdf (accessed on 20 February 2024).
  39. Hanssen, B.L.; Siraj, S.; Wong, D.K. Recent strategies to minimize fouling in electrochemical detection systems. Rev. Anal. Chem. 2016, 35, 1. [Google Scholar] [CrossRef]
  40. Abreu, C.M.; Cristóbal, M.J.; Losada, R.; Nóvoa, X.R.; Pena, G.; Pérez, M.C. Comparative study of passive films of different stainless steels developed on alkaline medium. Electrochim. Acta 2004, 49, 3049–3056. [Google Scholar] [CrossRef]
  41. Available online: https://www.egec.org/european-geothermal-innovation-award/ (accessed on 20 February 2024).
  42. Available online: https://www.egec.org/geoinnawards2021-nominees-aimen-technology-center/ (accessed on 20 February 2024).
Figure 1. Detail of the conceptual design of the corrosion monitoring sensor.
Metals 14 00279 g001
Figure 2. Pt/Ti reference electrode used in the corrosion monitoring system (detail).
Metals 14 00279 g002
Figure 3. Final design of the corrosion monitoring sensor.
Metals 14 00279 g003
Figure 4. Outer part of the preliminary design for the three-electrode probe with the special plug for the electrical connections and the flanges.
Metals 14 00279 g004
Figure 5. Block diagram of the functional parts for the measurement equipment planned to acquire the electrochemical data from the corrosion system.
Metals 14 00279 g005
Figure 6. HMI interface of the software developed by AIMEN for the measurements’ control.
Metals 14 00279 g006
Figure 7. Assembly of the corrosion monitoring probe to be installed.
Metals 14 00279 g007
Figure 8. Corrosion monitoring system installed in the Hellisheidi plant: (left) monitoring probe installed in the bypass and (right) detail of the electrical cabinet for the corrosion probe control.
Metals 14 00279 g008
Figure 9. External/internal parts of the electric panel.
Metals 14 00279 g009
Figure 10. Nyquist plots corresponding to the first 90 days of exposition for (A) WE1 (Inconel 625), (B) WE2 (SMO254), (C) WE3 (DSS14410), and (D) WE4 (AISI316).
Metals 14 00279 g010
Figure 11. Distribution of relaxation times (DRT) of WE1 spectrum and Randles circuit for the fitting of the one-time constant identified in the Nyquist plots of WE1. Rp calculation by Nyquist plot diameter.
Metals 14 00279 g011
Figure 12. Nyquist plots corresponding to the first 90 days of exposition for WE5 (PG265H) (left) and WE6 (K55) (right).
Metals 14 00279 g012
Figure 13. DRT for the WE5 spectrum and ladder-type circuit for the fitting of the two-time constants identified in the Nyquist plots of WE5. Rp calculation by Nyquist plot.
Metals 14 00279 g013
Figure 14. Evolution of Rp for the six rings (WE) during November–January.
Metals 14 00279 g014
Table 1. Conditions of the demo site.
LocationBrine Valve House (BVH)
Pressure7.0–10.5 bar-g
Flowrate3514.45 L/h
Pipe inner diameter1″—PN16
T in98.98 °C
Table 2. Characteristics of the brine.
Brine
characteristics
ConductivitypHCO2H2SSiO2Na
0.9–1.1 mS/cm60.02–0.01 mol/kg0.03–0.07 mol/kg0.011 mol/kg0.008 mol/kg
Table 3. Chemical composition (nominal)% of the metallic alloys selected for corrosion testing. * bal. = balanced.
Composition (%)NiCrMoMnNbSiCuCFe
1. INCONEL 625>5820–238–10<0.53–4<0.5 <0.1<5
2. SMO 254 SS18206.1 <0.80.7<0.02bal. *
3. Superduplex 1.44106–824–263–5<1.2 <0.8 <0.03bal. *
4. AISI 31616–1810–142–32 0.75 0.035bal. *
5. PG 265 GH10–1216–182–2.5<2 <0.75 < 0.07bal. *
6. API 5CT K550.20 <1.5 <0.350.200.34–0.39bal. *
Table 4. Average Rp values and deviations for the three first months.
Re Ω·m2Rp WE1
Ω·cm2
Rp WE2 Ω·cm2Rp WE3 Ω·cm2Rp WE4 Ω·cm2Rp WE5 Ω·cm2Rp WE6 Ω·cm2
Mean
(November–January)
4611259220220832210733361.3
Standard deviation3.61151.98242.41202.22203.40142.3472.56
Relative standard
deviation
0.7812.0711.019.719.2019.4220.08
Disclaimer/Publisher’s Note: The statements, opinions and data contained in all publications are solely those of the individual author(s) and contributor(s) and not of MDPI and/or the editor(s). MDPI and/or the editor(s) disclaim responsibility for any injury to people or property resulting from any ideas, methods, instructions or products referred to in the content.

