Article

Modelling the Sorting of Lithium-Ion Battery Components in a Zig-Zag Air Classifier

1
Institute for Mechanical Process Engineering and Mineral Processing, TU Bergakademie Freiberg, 09599 Freiberg, Germany
2
BASF Schwarzheide GmbH, 01986 Schwarzheide, Germany
*
Author to whom correspondence should be addressed.
Current address: Zeppelin Systems GmbH, Graf-Zeppelin-Platz 1, 88045 Friedrichshafen, Germany.
Metals 2024, 14(3), 269; https://doi.org/10.3390/met14030269
Submission received: 27 December 2023 / Revised: 12 February 2024 / Accepted: 22 February 2024 / Published: 24 February 2024

Abstract

:
The recycling of lithium-ion batteries, in particular, has become increasingly important in recent years. Due to the materials contained, such as copper or nickel, the return to the economic cycle is important. To ensure this, binding measures have been introduced by the European Commission. As part of the mechanical recycling of lithium-ion batteries, the zig-zag air classifier is used to separate battery components. One application is the separation of the current conductor foils from each other, which is investigated and modelled here. Existing models deriving from the literature are evaluated for material fractions coming from the recycling of different automotive lithium-ion batteries. Since the separation depends on the geometry of the foil particles, similarities for separation depending on the geometric characteristics of the electrodes are derived. It turns out that the material is too complex for the empirical model. However, the model can be used to evaluate the suitability of the apparatus and the quality of the separation.

1. Introduction

Lithium-ion batteries (LIBs) are an electrochemical storage system [1] and an important component in a multitude of applications from consumer electronics and power tools to electric vehicles. Especially in the transportation sector, LIBs are one key element in reducing carbon emissions [2]. It is predicted that up to 230 Mio. electrical vehicles will exist in 2030 [3]. Overall, the annual amount of end-of-life LIBs will approximately rise to 420 kilotons by 2030 [4]. As LIBs are also a composite of numerous valuable materials, the development of efficient recycling technologies is indisputable. In addition, battery production generates around 40% rejects [5]. These consist mainly of the electrodes, which contain the most valuable materials of the LIB.
A LIB consists of two electrodes (cathode and anode) made of aluminium or copper as current collector foils coated with an active material or graphite [6]. A porous membrane (separator foil) prevents short circuits between the two electrodes on one side and allows ion transport on the other. These functional units of the battery cell are wound together in round or flat jelly rolls, enclosed in a housing made of steel or aluminium [1,7], and filled with an electrolyte, enabling ion transport.
Material supply risks and new regulations by the governments are encouraging the development of recycling technologies. In Europe, recyclers must meet a recycling rate for the whole battery of 65% by 2026 (2031: 70%). In addition, element-specific recycling rates have been set: nickel, cobalt, and copper at 90% (95%) and lithium at 50% (80%) [8]. China defined even higher recycling rates of 98% for cobalt, manganese, and nickel and 85% for lithium until 2025 [9]. One appealing argument for recycling is the reduction of the CO2 footprint by minimizing the need to mine primary raw materials. Therefore, highly developed countries with no national mineral resources will especially focus on this opportunity for diversification of their supply chain.
For the recycling of LIBs, many possible process combinations exist [10,11]. One opportunity is the combination of mechanical and hydrometallurgical treatment. For this process concept, the main operations are comminution and physical sorting regarding the mechanical part and leaching, solvent extraction, and precipitation regarding the hydrometallurgical one. One option to sort battery components is density separation, e.g., by using a zig-zag air classifier (ZZAC) [7,12]. This classifier separates the housing material and/or separator foils from electrode fractions [13,14]. Also, the sorting of delaminated current collector foils was subject to research activities, since the density difference between aluminium and copper generates a separation criterion [15].
The working principle of the ZZAC takes advantage of different settling velocities of particles to separate a mixture thereof. Thus, separation characteristics involve particle density, particle size, and particle shape. Using a characteristic zig-zag-shaped channel, the classifier can be seen as a series of cross-flow separation stages which increase the separation efficiency in comparison to a single cross-flow device or the upstream separator [12]. For more detailed information on the operation and design, see Kaas et al. [12].
One commonly used tool to evaluate separation processes is the partition curve [16]. This curve defines the probability of transferring a material with specific particle properties (e.g., a certain size or material composition) from the feed into the concentrate (e.g., coarse product or the concentrate of a target material). Thus, for each separation principle/separation criterion a different particle property ξ determines the separation, e.g., relevant for sieving is the particle size and, for air classification, the effective settling velocity. Together with the mass recovery Rm,c, the property distribution q ( ξ ) of one product and the feed material or of both products have to be known to calculate the partition curve T(ξ) from the experimental data.
T ξ = q c ( ξ ) q s ( ξ ) R m , c
Generally speaking, for physical separation processes, The mass recovery Rm,c characterises the mass ratio between concentrate c and supply material s.
R m , c = m c m s
To evaluate the separation process, the median cut size ξT and separation efficiency κ can be defined [16]:
T ( ξ T ) = 50 %
κ = ξ 75 ξ 25
In the last decades, several separation models were developed to understand the interactions in the zig-zag air classifier as well as to predict the separation result. A short summary is presented in the following. For more detailed information, see Kaas et al. [12].
First, the models by Kaiser [17], Senden [18] and Rosenbrand [19] can be categorised as stochastic models, particularly for Senden and Rosenbrandt, whose models are based on Markoff chains. Here, the probability of transferring particles from one cross-flow separation stage to the next is one of the key parameters. A main problem of the model of Rosenbrandt [19] is the missing consideration of any back mixing or particle interactions. On one hand, the advantage of these groups of models is their applicability and manageability. On the other hand, a central disadvantage of these models is that they have been verified up to now only with monodisperse spherical material. Further models from Gillandt et al. [20], Hagemeier et al. [21], Friedrich et al. [22], and Bartscher [23] used computational fluid dynamics (CFD) for the modelling of the ZZAC to better understand the interactions of particles with other particles and the walls of the zig-zag channel. The accuracy of the models improved with time and illustrated more accurately the complexity of the classifier, e.g., vortex rolls and interactions of particles. However, much more computing capacity is needed, and the evaluation of the massive data output has to be addressed. At the moment, such models are rarely implemented to monitor and/or control a process or for quality management.
A mechanistic model with good manageability was developed by Tomas and Gröger [24]. This model is an evolution of a model for hydrocyclones [25]. Here the partition curve is directly calculated as follows:
T = 1 1 + V ˙ L V ˙ H 1 v s v T · z
Here, V ˙ L and V ˙ H are the volume rates for the light and heavy fraction, the separation velocity vT, the settling velocity vs, and the number of effective separation stages z. This modelling was already used for recycled materials like building scrap [26] and battery materials [27]. Punt et al. [27] showed flow-sheet simulations involving a ZZAC to separate the separator foil from electrode foils and anode and cathode foils from each other, implementing the model of Tomas and Gröger. In that study, however, the shape of the particles was plate like, and it was not clearly stated whether foils from end-of-life LIBs or production scrap were used. In addition, the study admits that the electrode foils were processed separately in a zig-zag air classifier, indicating an idealised experimental design. Consequently, the mixing state in the classifier could not be validated and the effect of the possible interaction of the cathode and anode foils in the separating chamber during their split into heavy and light fractions is therefore neglected in the approach of Punt et al. [27]. As a result, the separation can be considered as being too idealised, since important influencing factors were disregarded.
Altogether, no investigations exist in battery recycling that consider different foil properties, e.g., foil thickness, cell chemistry and foil deformation due to preceding delamination and or even a spherisation step.
Therefore, in this study, the separation behaviour of different LIB cell types was investigated experimentally to evaluate whether the model of Tomas and Gröger [24] is suitable for modelling the separation of electrode foils in battery recycling.

2. Material and Methods

The data behind the figures and additional data can be found in Data Availability Statement [28].
Five different types of LIB cells were investigated: P1, P2, P6, C2, and C3 (Table 1). More detailed information can be found in Kaas et al. [14]. All of the cells originate from the automotive sector. They differ in their cathode chemistry (LiNi0.8Co0.15Al0.05O2 (NCA), LiFePO4 (LFP), and LiNi1/3Mn1/3Co1/3O2 (NMC)), shape (prismatic and cylindric), and the thickness of their current collector foils.
The LIB cells were deeply discharged and subsequently processed, as shown in Figure 1 [13]. P6 was precrushed with a dual-shaft rotary ripper and a dual-shaft rotary shear (design of TU Bergakademie Freiberg, Freiberg, Germany) [29] due to the dimensions of the cell. Being significantly smaller, P2 needed to be precrushed only in the dual-shaft rotary shear. A fast-rotating, single-shaft rotary shear (Universal Granulator UG300, Andritz MeWa GmbH; Gechingen, Germany) with a 20 mm discharge grid was used for the final liberation of the components of all cell types. More detailed information on this first comminution step can be found in [12,30].
After liberation, the fragments of the LIB cells were dried for 14 days at 22–25 °C in a fume hood to remove any volatile electrolytes. A first black mass was separated by an EML 450 sieve machine (Haver and Boecker OHG; Oelde, Germany) with a cut size of 1 mm. For the separation of the cell housing and separator foil after classification, a 120° angle zig-zag air classifier with 10 separation stages was used (planned and constructed by TU Bergakademie Freiberg, Freiberg, Germany). Then, the remaining electrode mixture was subjected to a high-speed impact rotor mill (Turborotor Görgens G-35S, Dormagen, Germany) to delaminate and spheronise the electrode fragments. Next, a second black mass was screened at 0.5 mm. Afterwards, the electrode fragments were cleaned by manual picking to ensure that no other interfering cell components influenced the separation in the ZZAC.
The cathode and anode fragments of the investigated battery cells are shown in Figure 2a. The separation of aluminium and copper particles was done with the same classifier (Figure 2b) as used for the separation of the separator foil and cell casing. An average air velocity of 4.7 m/s was applied to separate the electrode fragments. The air classifier consists of 10 separation stages. The material is fed into the centre of the sifting channel between stages 6 and 7. Since the classifier applies the suction principle, where the blower is installed downstream, the false air intake is considered to be problematic with this design. This is caused by the non-air-tight material feed. As a result, the air is drawn in not only through the heavy material discharge but also from the middle of the classifier, where the feeding opening is located.
To characterise the particle size and particle shape of the cathode and anode fragments, dynamic image analysis was applied with a CamSizer P4 (Microtrac Retsch GmbH, Haan, Germany). Since this is a 2D image analysis, the equivalent circle diameter was used as a size parameter in the measurements. The foil thickness was determined using the FEI 30 ESEM-FEG (FEI Europe B.V., Eindhoven, The Netherlands) with HighVac mode.
The selected air speed for the separation of the electrode foils in the zig-zag air classifier (4.7 m/s) was determined in other studies [13]. After sifting, the products of the heavy and light fractions were manually picked and separated into cathode and anode fractions.
Up to now, regarding the separation of particle systems in a ZZAC, for classification predominantly, the particle size was used to deduct the partition curve. For the application of the zig-zag air classifier for material separation, however, the separation according to material properties, i.e., solids density, is only feasible for monodisperse and spherical material to avoid additional effects on the separation principle. As already mentioned, the separation characteristic of the zig-zag air classifier is the settling rate, which depends on particle size, particle shape, and particle density as well. For recycled material, all three parameters differ, i.e., have distributed values, which means that plotting the separation curve against particle size neglects important separation characteristics. For this reason, the separation in this study was calculated using settling rate classes for the evaluation, which are as close as possible to the separation criterion. For this purpose, settling velocity distributions of the products were determined in the PETKUS K293 classifier (PETKUS VEB Wutha, Wutha, Germany), which is a standpipe classifier.
A model fit became necessary to connect the experimental data to the model equation. Here, the number of effective separation stages z was used as a fitting parameter in Equation (5). The parameters necessary for modelling and the code can be viewed in [28]. The iterative fitting is performed with a step size of 0.1 in the limits of 1 and 3.5. The value for z is then selected based on the minimum of the squared deviations from the measured values of T to the applied model fit.
To characterise the conformity of the model fit and the experimental data, the parameter χ2 was chosen. Thus, the deviations of T of the model fit to the experimental data were calculated. According to [31], χ2 can be understood as the sum of least squares (squared residuals) which have been “normalized” by the expected value.

3. Results and Discussion

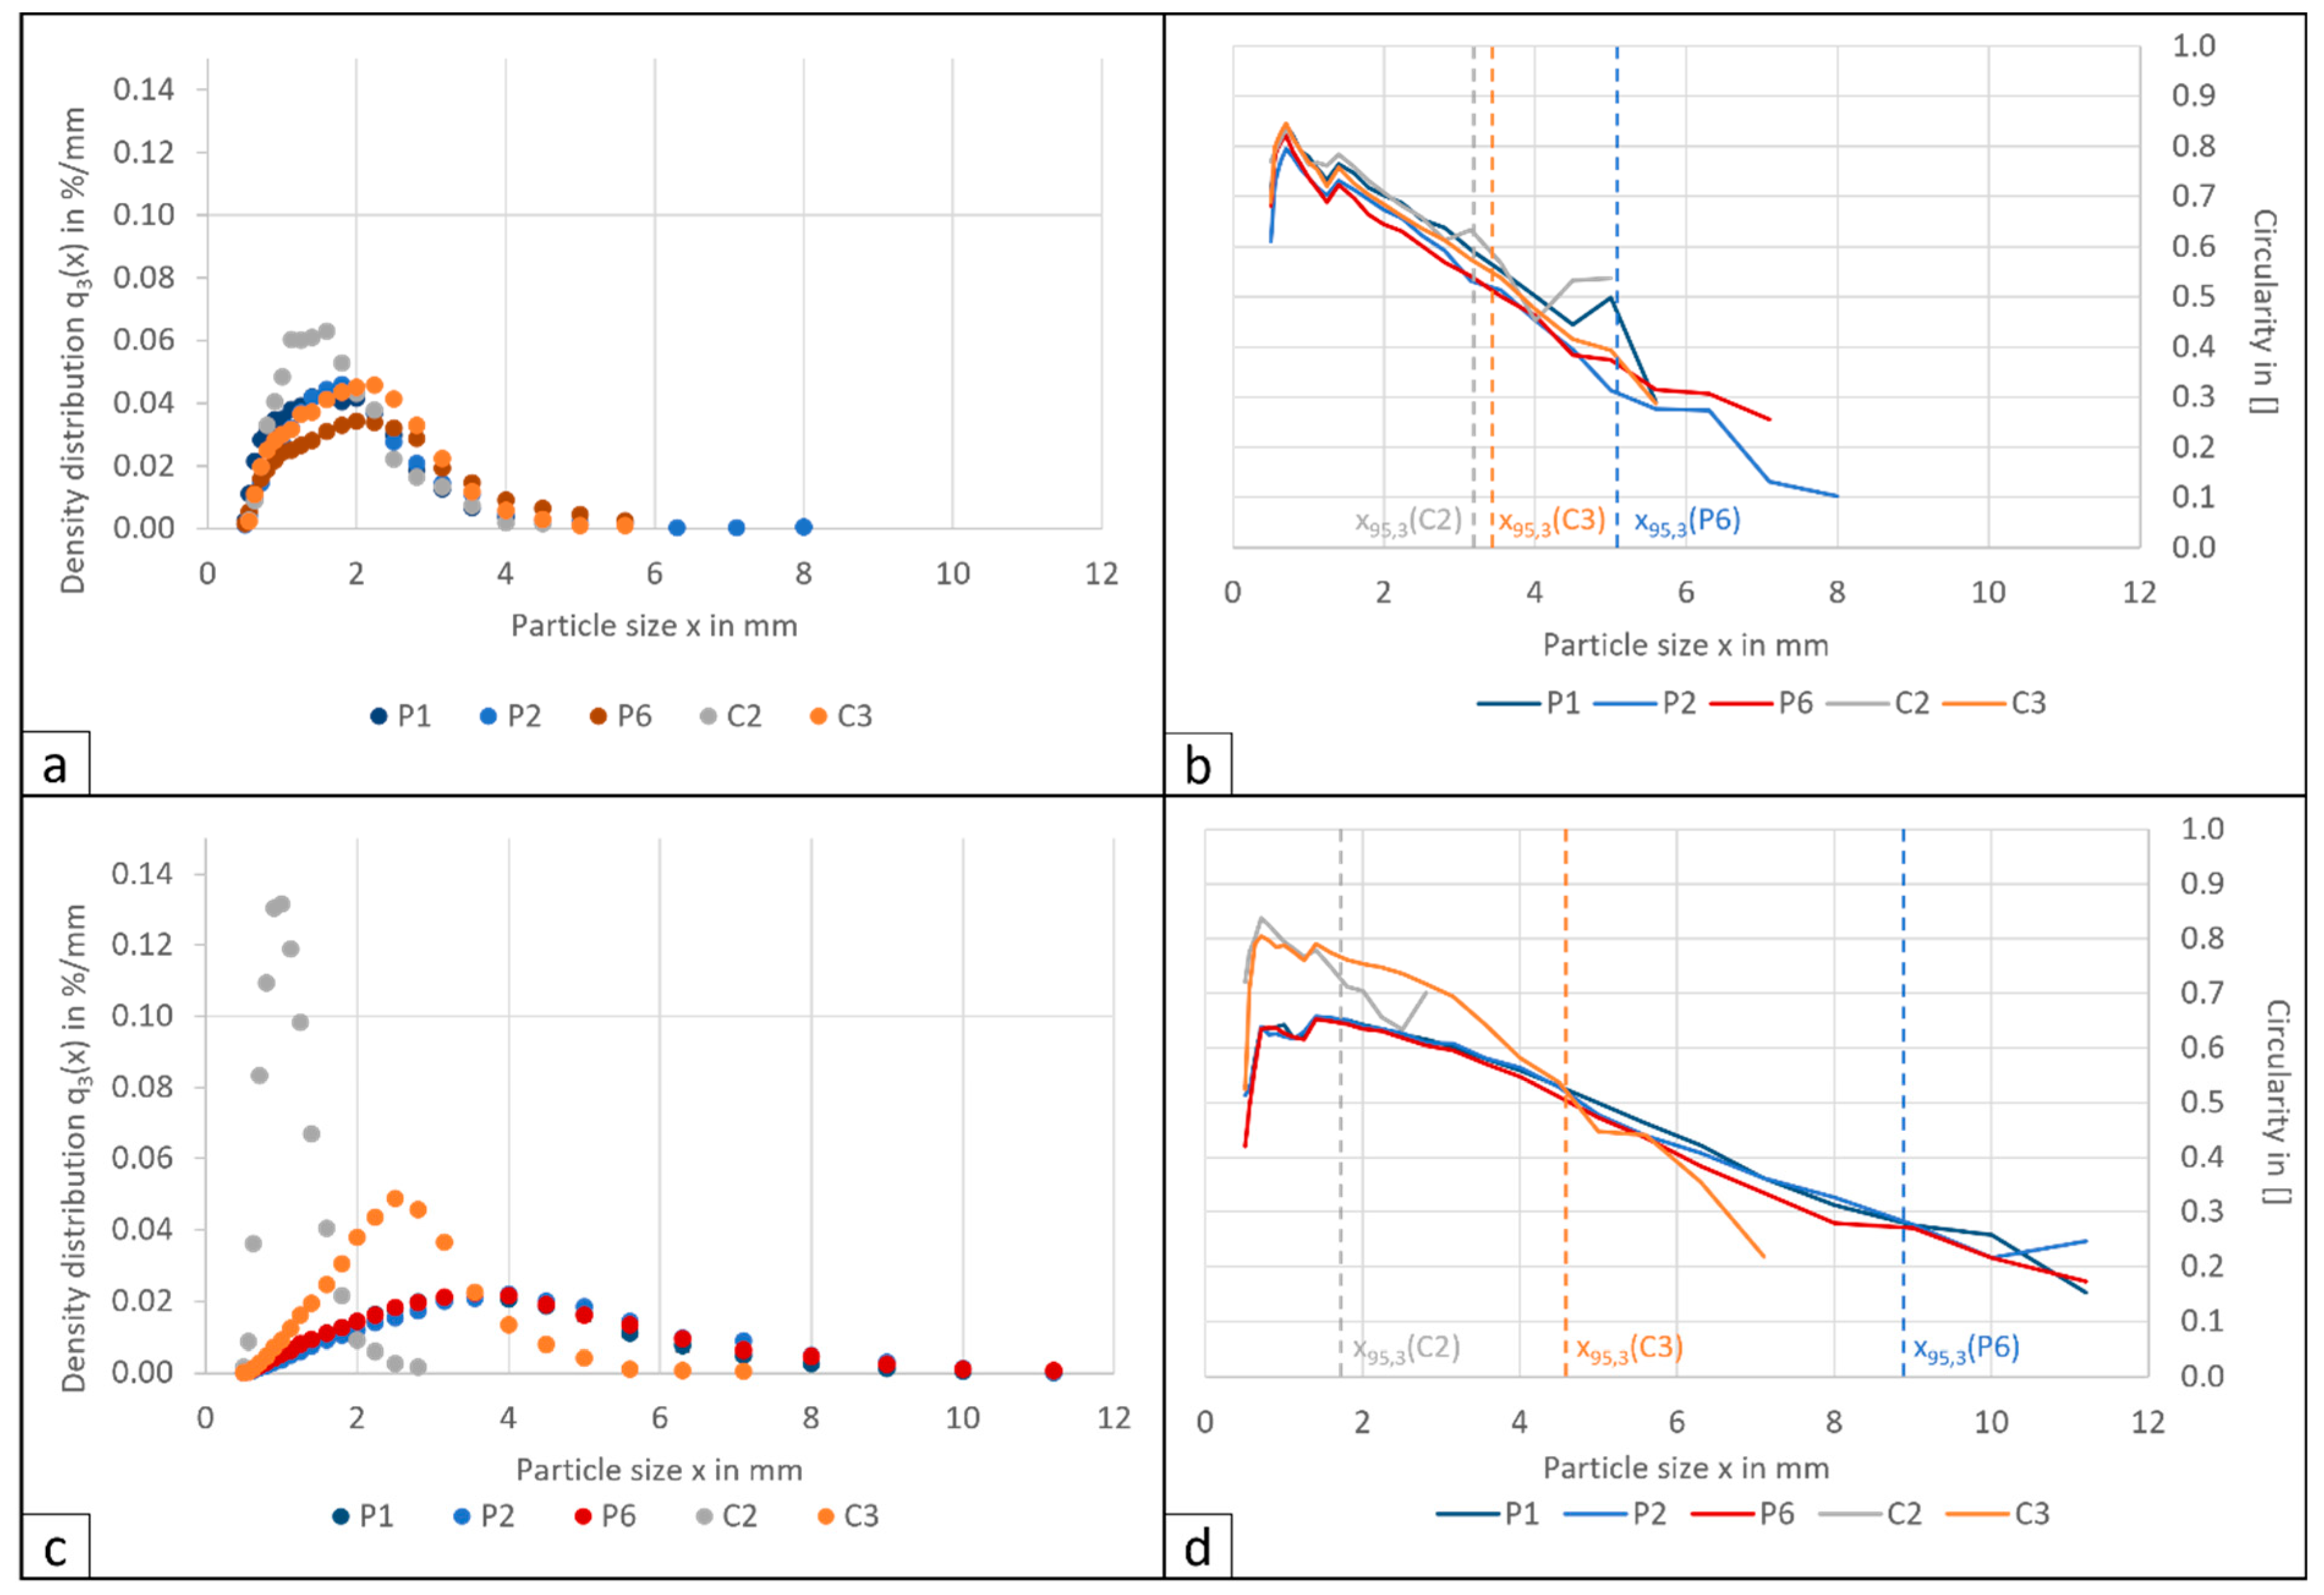
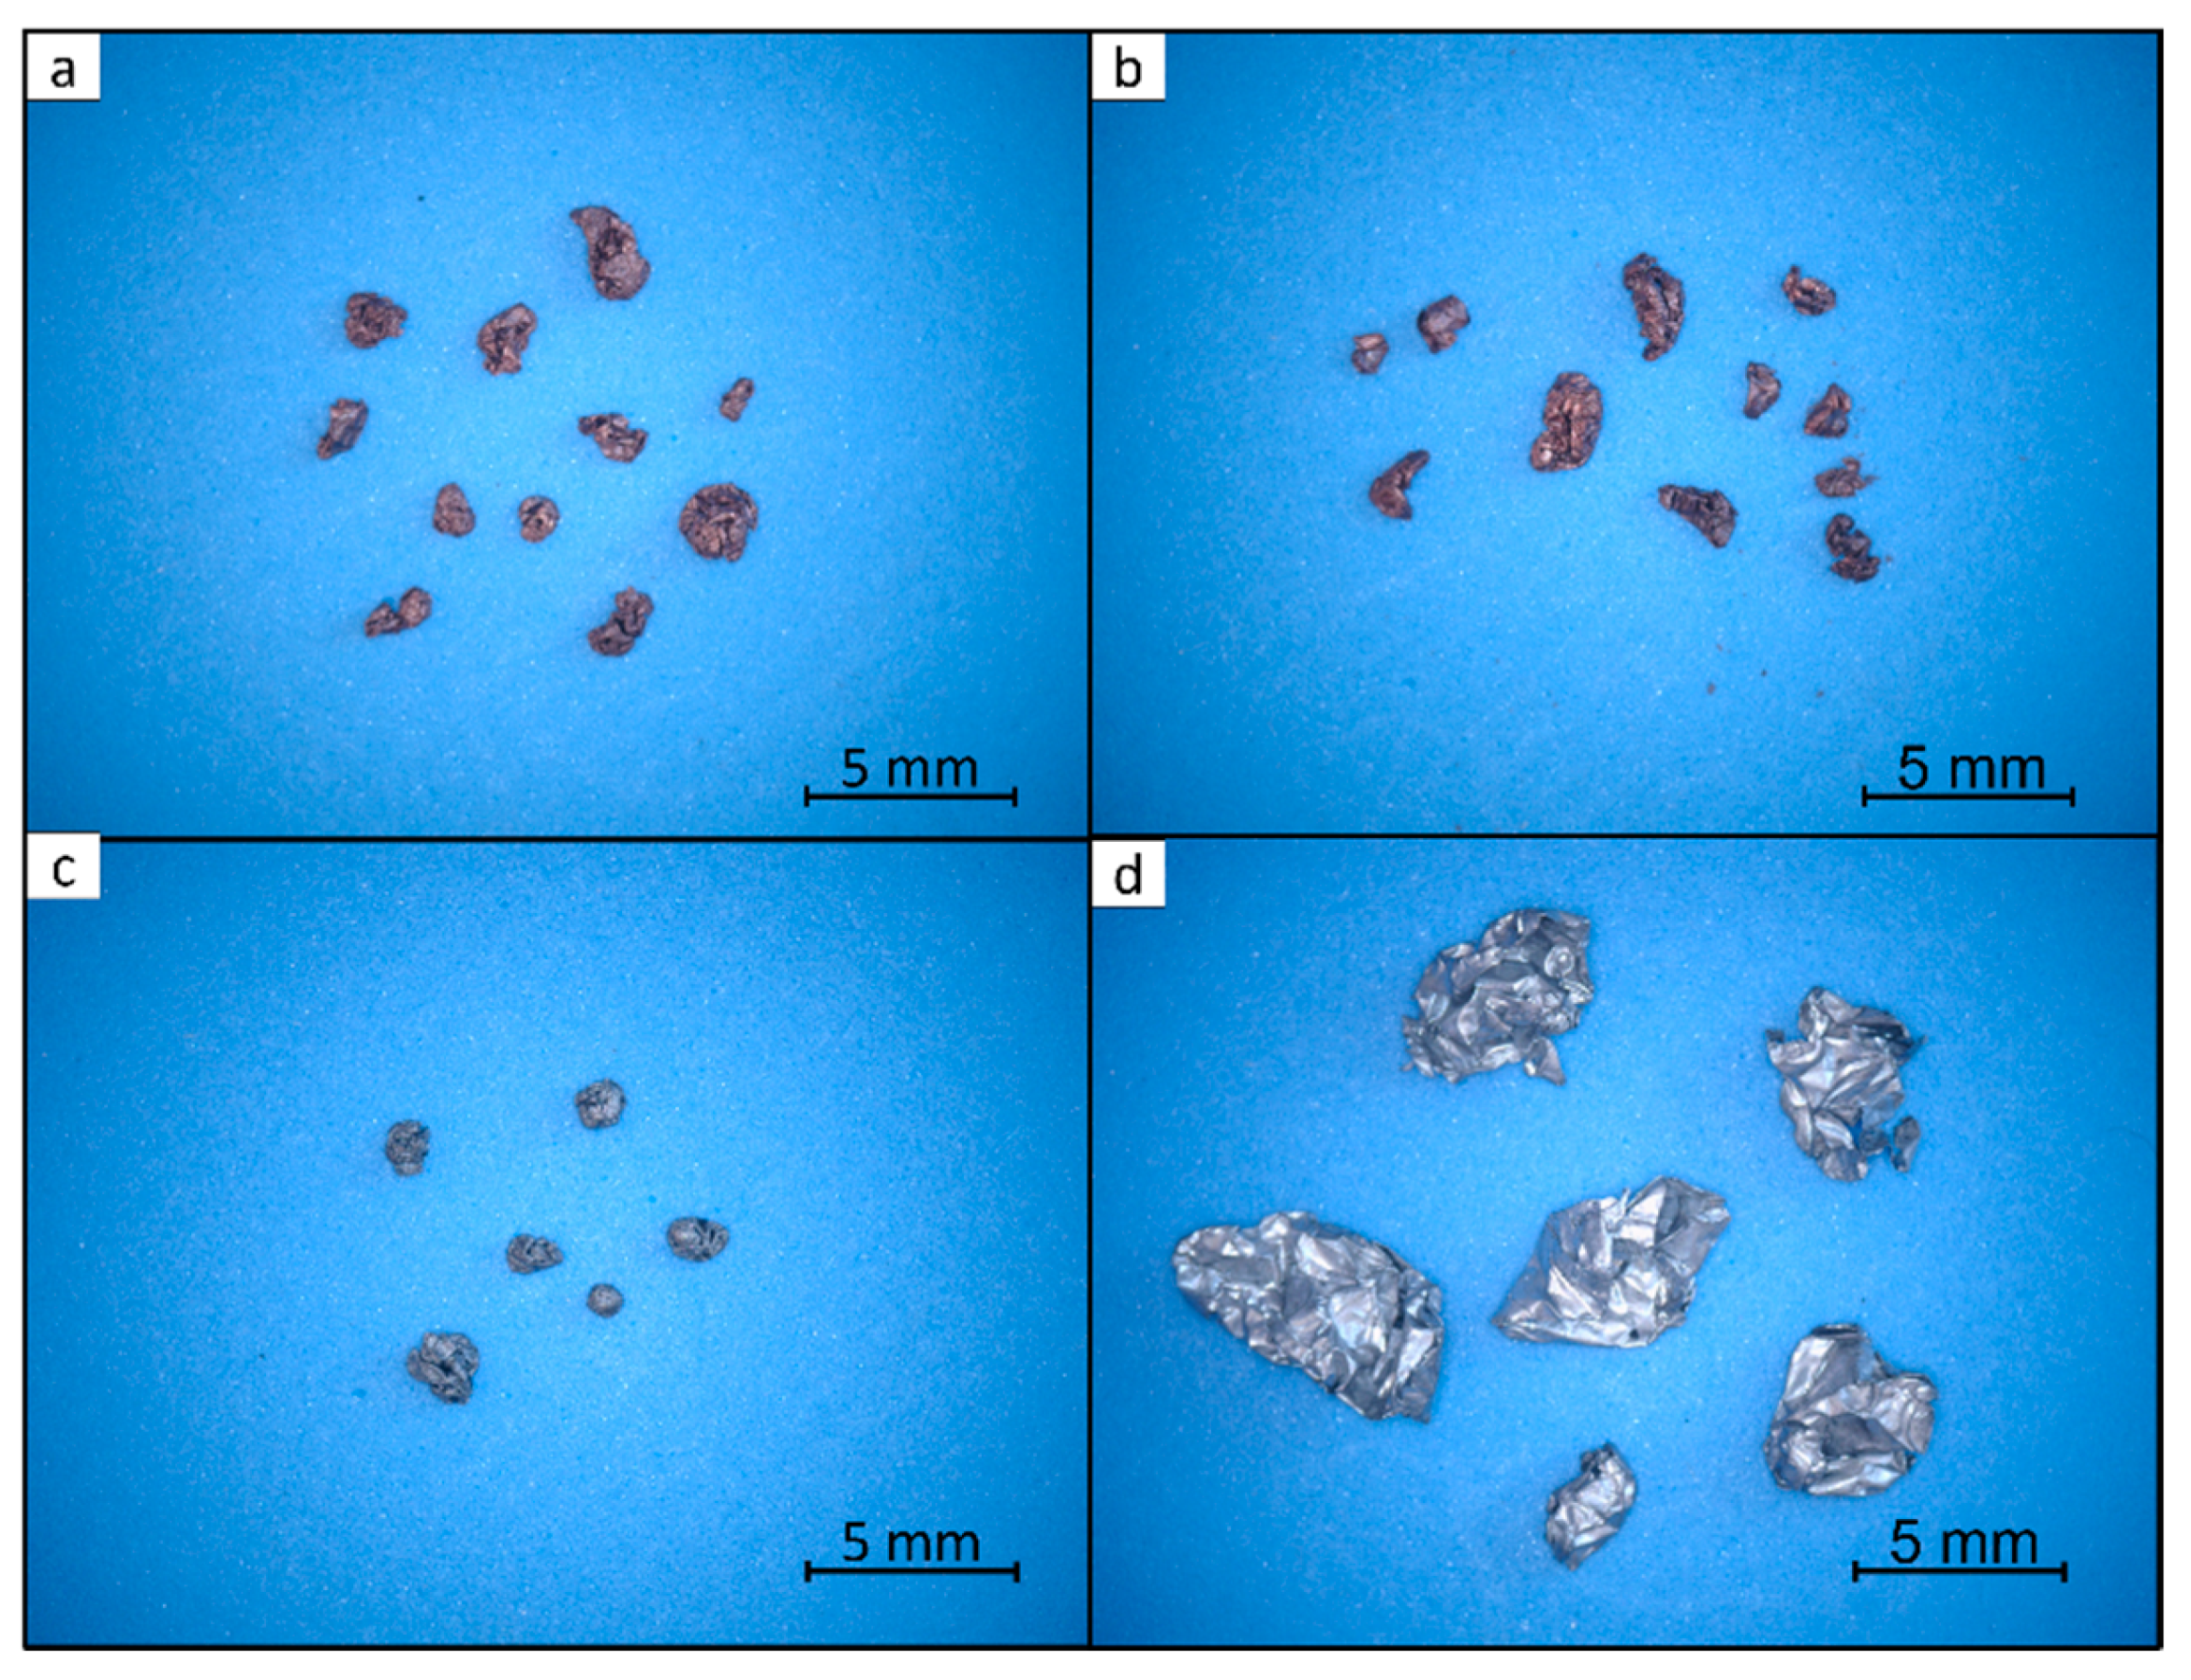
3.1. Characterisation of the Products

To support the discussion regarding multiple particle properties and to understand the separation behaviour of the different materials, the delaminated anode and cathode fragments of each battery were characterised in terms of size and shape. Materials of similar properties in terms of size, shape, and density are suspected to have a similar setting and separation behaviours within the zig-zag air classifier [32]. For plate-like particles, it was shown that especially the thickness, i.e., the smallest dimension, has an influence on the separation behaviour in a ZZAC [33]. The thickness will also influence the deformation behaviour of the foils during the preceding delamination step, which converts the plate-like particles to more compact particles.
Regarding the size distribution (Figure 3a) of the anode material, only C2 deviates in the range of 0.9–1.8 mm from the other cell types and C2, furthermore, does not contain particles above about 5 mm. A possible explanation for this finer and narrower PSD could be the more intense impacts during delamination in the rotor mill. It is possible that some casing particles were not separated during the previous air classification of the foil fraction. As a result, the remaining casing components might function as extra grinding material. The casing material of the C2 is made of steel, unlike all other processed batteries whose casing material is aluminium. Due to the higher density of steel compared to aluminium, a higher stress intensity acts on the foils during collisions in the grinding chamber and typically more energy is required to crush cells with steel housing [13]. Due to the higher stress on the anodes of C2, fragments can be submitted to a size reduction instead of spheroidisation, leading to a smaller overall particle size. However, this is only a conjecture, which must be substantiated by further investigations of the particle collisions inside the mill, e.g., with the Discrete Element Method (DEM) [34], depending on the interacting material types. Here, it can be looked at more closely. Even if there are small differences in the PSD, the other current conductor foils of the anodes show similar size and shape distributions in principle. This is due to the comparable thickness of the foils. As can be seen in Figure 3b, the shape of the examined anode fragments of the battery cells P1, P2, P6, C2, and C3 are approximately the same. This is also reflected in the macroscopic images in Figure 4a,b, where the particles of cell types C2 and P6 are presented, and the particles appear to have a comparable shape. This information supports the robustness of the mechanical recycling approach, since the process design generates no fluctuations in the particle properties, especially of the anode foil material, since it is able to generate a uniform feed material to the Al-Cu separation step.
Focusing on the cathode foil particles (Figure 3c,d), batteries P1, P2, and P6 show similar size and shape distributions. This results from their comparable design characteristics, e.g., the thickness of the foils and similar casing material, as already observed for the anode foil particles. Based on the geometric similarity of the anode and cathode particles of P1, P2, and P6, it is assumed that the separation behaviour is also similar. This is due to the fact that the separation in the ZZAC is largely dependent on shape and size. In contrast to the anode particles, the particle size of the cathode particles of the prismatic cells is more widely distributed, with an xmax of above 10 mm (Figure 3c). Since the circularity is also lower than for the anode particles, a poorer spheroidisation can be assumed. In the case of larger particles, it is evident that the bending of a plate-like foil particle, which is the first step of spheroidisation, only occurred at the edges, but the particles remained predominantly planar (Figure 4d). However, with decreasing particle size, the circularity of the particles increases. Thus, the particles are smaller due to better spherodisation.
In contrast, the high circularity of the cathode foil particles of C2 and C3 (Figure 3d) shows that they have been significantly spheroidised, as it also becomes visible in the microscope images (Figure 4c). The spheronisation leads to a narrow particle size distribution with smaller particle sizes of the two cathode fractions, which clearly differs from the foil particles of the prismatic cells (Figure 3b). Since C3 has the highest foil thickness (19.3 µm) and, thus, the highest material strength, the resistance of these particles to deformation in the mill is also higher than for the cathode particles of P1, P2, and P6. Because of this, a better entanglement and narrower particle size distribution is achieved for the cathode particles of C3. The high circularity as well as the large number of small particles in the C2 cathode could be due to the much smaller thickness (5.4 µm) of the foil. Here, the hypothesis of overlying comminution by steel particles can be referred to. Due to the much smaller thickness of the cathode conductor foil of this cell type compared to the anode (Table 1), a higher degree of comminution occurs, resulting in smaller particles. The entanglement of the particles of the anode and cathode is comparable for C2. Due to the different properties of the cathode particles of C2 and C3, a different separation behaviour for P1–P6 is to be expected. Referring to the literature [33] the better spherification and the resulting more spherical shape, as well as the narrower size distribution, should result in a better separation behaviour for C2 and C3.
Different conclusions can be drawn when comparing the cathode and anode particles of the batteries. In the prismatic cells, the anodes are better spheroidised (95% of the particles have a sphericity above 0.5) and show a finer (x95,3 < 4 mm) and narrower particle size distribution. In contrast, for C2 and C3, the shape distributions of the two corresponding electrode particle fractions are almost the same. Here, for C3, the particle size of the cathode is slightly larger compared to the anode. For C2, the cathode shows a narrower and smaller particle size distribution than the anode. This can be attributed to the thinner cathode foil (Table 1).

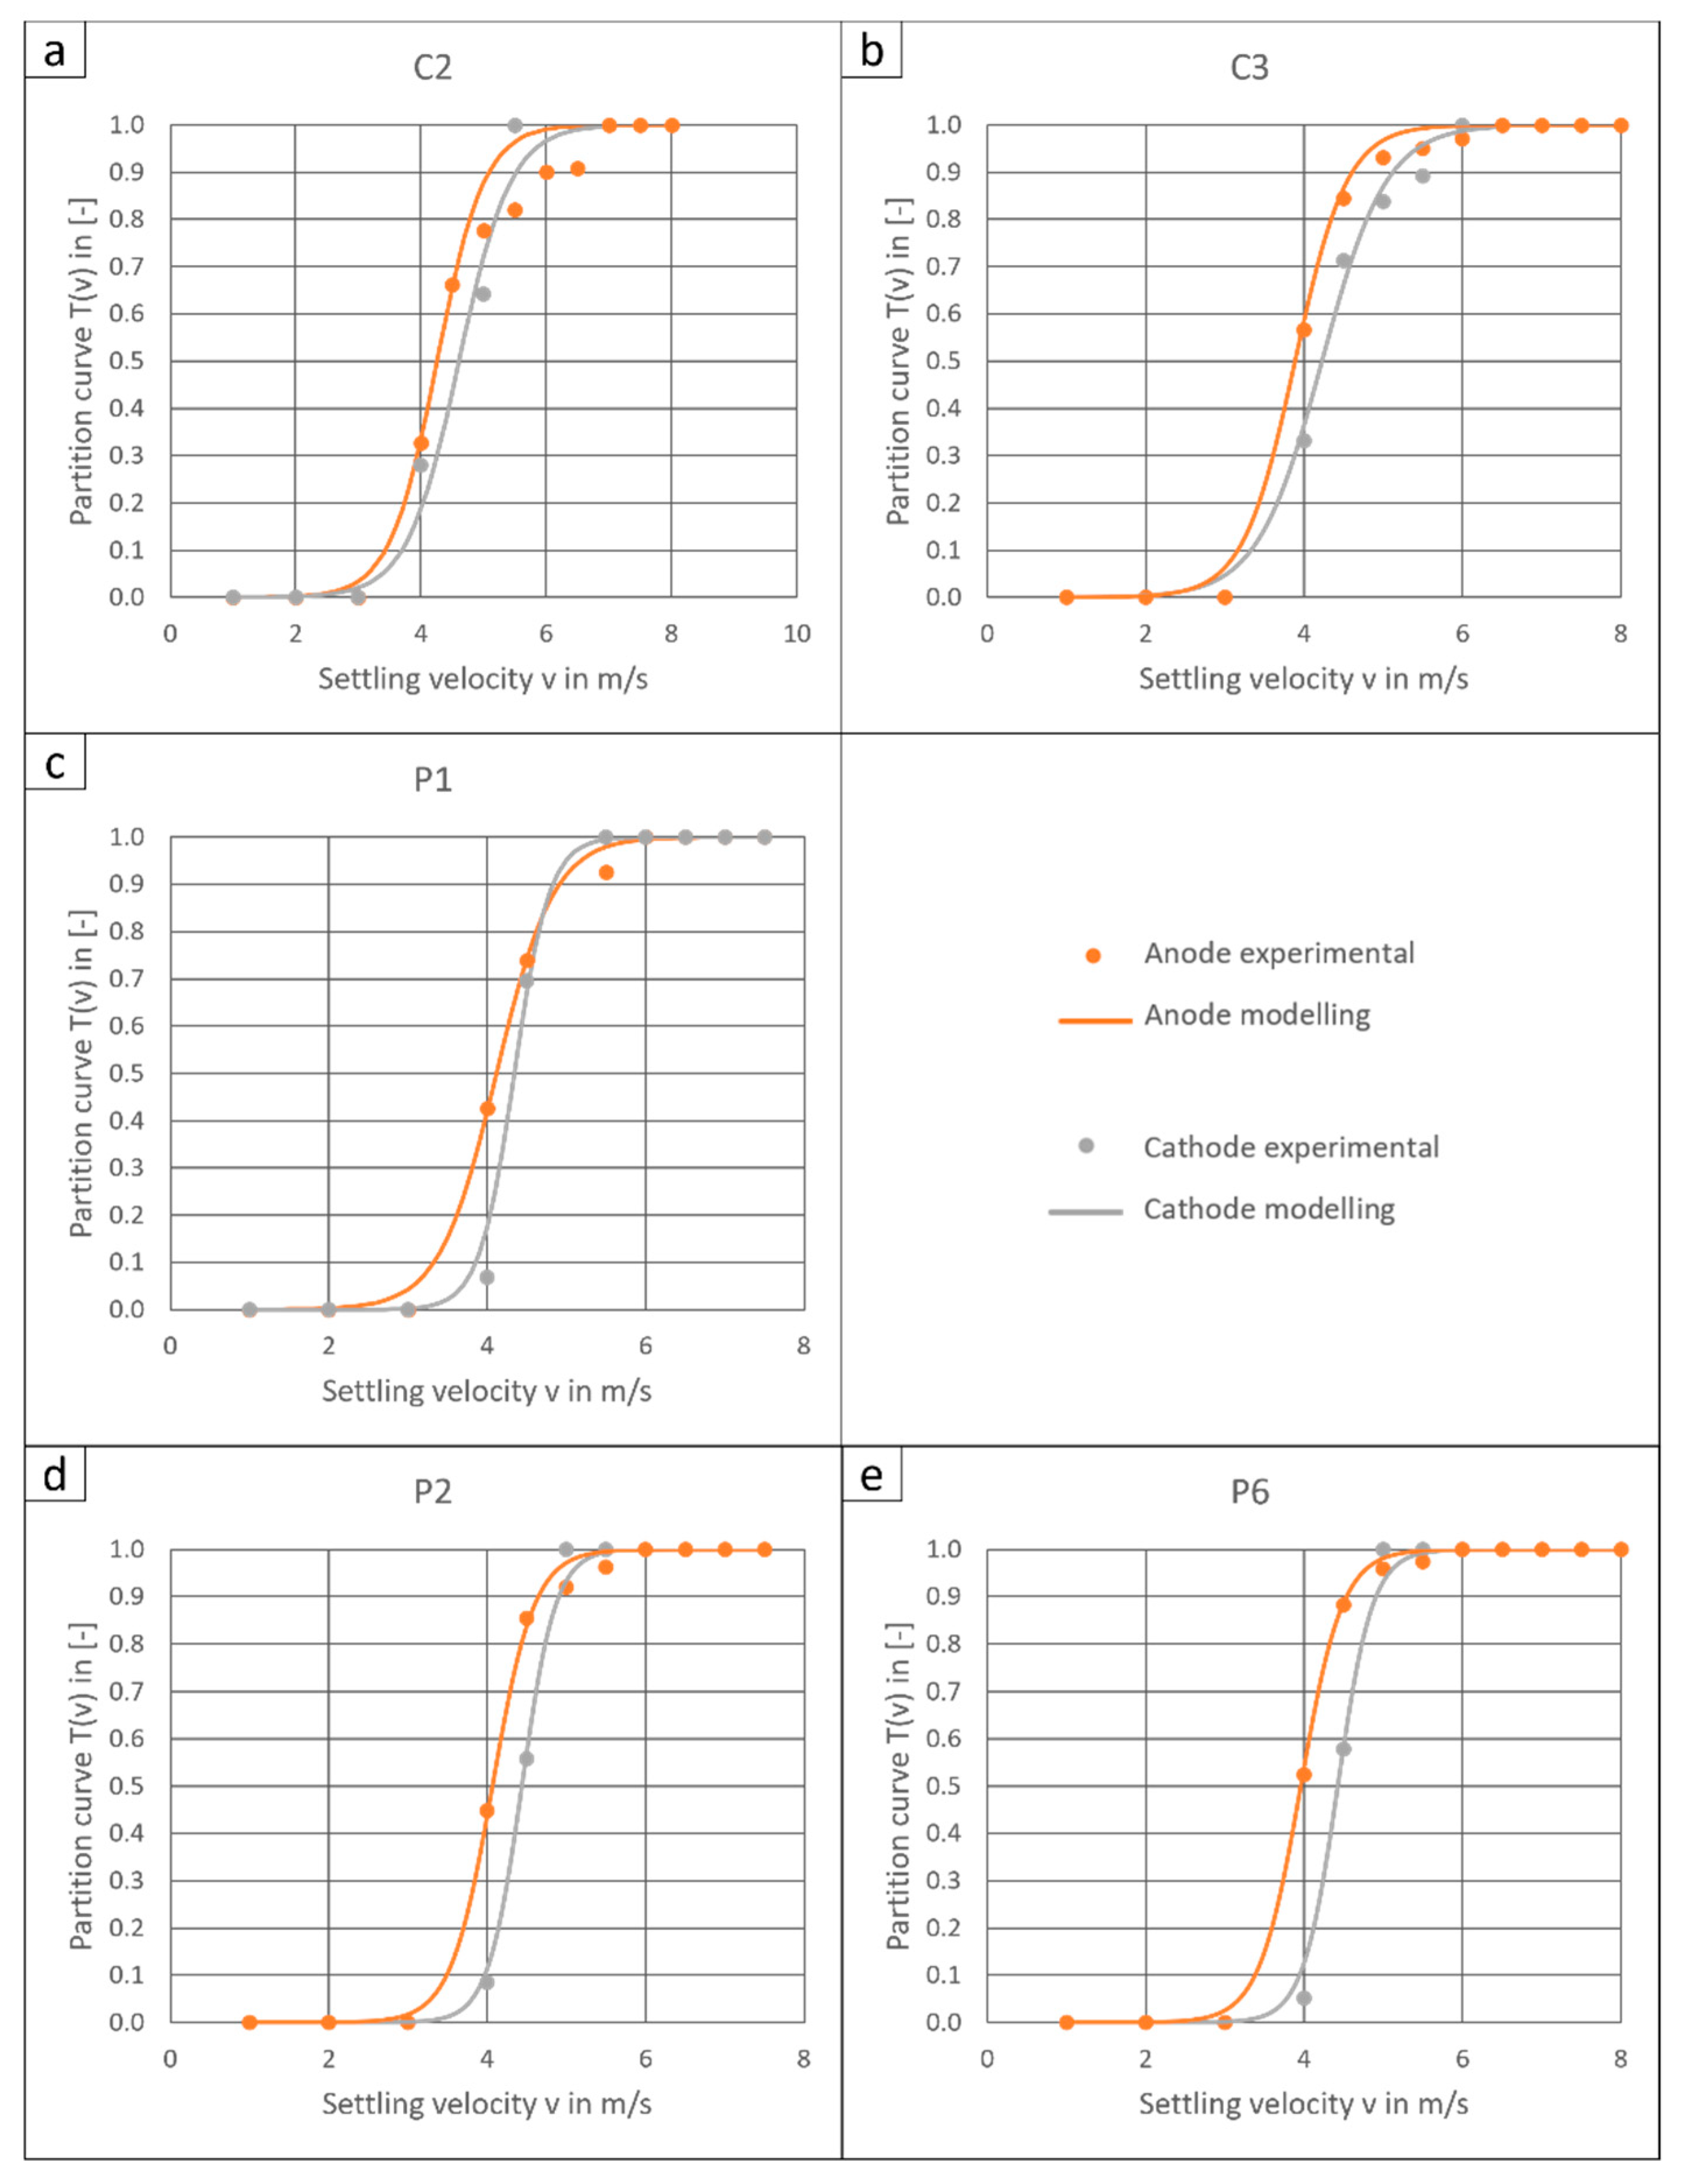
3.2. Experimental Separation Behaviour

Prior to modelling, the separation behaviour of the five electrode mixtures is evaluated. Therefore, the yield and cut velocity of the cathode and anode are shown in Figure 5.
Figure 5a shows the yield of the anode and cathode in the sifting process. With regard to the anode, the values are similar, in the range of 0.85–0.90. Only the yield of the C2 shows a lower value of 0.77. In general, however, this means a good separation of copper into the heavy product after sifting. The results also show that the behaviour of the anode particles is similar for the different battery types. This is due to the same material density, similar film thickness, sphericity, and size (Figure 3), whereby the latter is generated by the upstream crushing and grinding steps. This confirms the previously assumed equal separation behaviour due to the geometric similarity of the anode particles. However, for the cathode foils, clear differences can be seen with regard to the output of the heavy product. For the prismatic cells, only small amounts (Rm,H = 0.05–0.08) of cathode enter the heavy fraction. The low contamination of cathode foil material in the heavy product of the battery cells P1, P2, and P6 indicates a good separation of the electrode foils. However, a different picture emerges when looking at the individual cut velocities (Figure 5b). Comparing the cut velocities of the anode and cathode, which is the median of the separation-velocity distribution, shown in Figure 5b, shows that they differ only slightly with ΔvT = 0.3–0.4 m/s. Concluding that it will depend on the spread of the velocity distribution (Figure 6), whether the materials will be insufficiently separated in the chosen optimal air flow of the zig-zag air classifier. For C2 and C3, this can be seen above all in the cathode being discharged into the heavy product.
In general, the finer and more spherical cathode particles of C2 and C3 (Figure 3d) are more difficult to separate, i.e., showing a reduced quality of the products. This is probably due to the properties of the particle property distributions of the feed, e.g., the significantly finer particles of the cathode. This tendency can also be seen with the anode, but not as strongly. For the cathode of C2, Rm,H = 0.34; the heavy product is clearly contaminated by the cathode material. In addition, in the separation process of C3, the heavy product is ten times more contaminated with cathode particles than in P6 (Figure 5a). This represents the worst separation performance for the electrodes of the investigated batteries.
The poorer separation of the well-spheroidised cathode particles of C2 and C3 is contrary to general statements in the literature [35,36]. This means that the separation efficiency is expected to be better for similar size and shape distributions, since, in this case, the density has the predominant influence. Yet, it must be taken into account that, in the literature, primary raw materials are examined which, for instance, have a compact and nonporous form. With regard to the processing of secondary raw materials, research has so far pursued the idea of spheroidising the materials in order to achieve the same shape. However, this has only been investigated for more narrowly classified material flows [33] or small particles [37]. Although there is no explicit knowledge of the porosity of the particles, it seems logical that this is the reason for the apparently contradictory results. Due to the spheronisation, i.e., the multitude folding of the foils, the apparent density of the particles is changed. This reduces the density difference, resulting in an overlapping of the settling velocity distributions of the aluminium and copper particles. Consequently, the inflow surface and, thus, the size and shape of the particles [38] become more relevant for the separation in the ZZAC. The larger resistances of the planar lighter material of the prismatic cells dominate the separation, and a better separation efficiency is achieved. In future investigations, therefore, an attempt should be made to achieve selective balling of the copper particles by adjusting the precomminution in order to improve the separation result.
Since the cathode and anode particles of P1, P2, and P6 show almost identical behaviour in terms of median cut velocity, a more detailed look is taken at the partition curves. Due to the differences in foil thickness, the conformity of the separations is investigated. In Table 2, the cut velocities v10, v50, and v90 of the partition curves are compared. The values for v10 and v50 are almost identical. Only the v90 value of cell P1 deviates a bit. Altogether, it can be concluded that batteries whose current collector foils show geometric similarity in the initial state, e.g., thickness and shape, show a similar separation behaviour. Thus, the structure of the battery components gives clear hints regarding the recycling behaviour. This has to be investigated more closely to digitise recycling processes and improve modelling and process control.

3.3. Modelling

As shown by Punt et al. [27], electrode foils can be described by the model of Tomas and Gröger [24]. However, in these investigations, untreated electrode foils instead of real recycling products have been investigated, and the separation parameter of the plate-like foils has been particle size instead of settling velocity. The last simplification is especially to be challenged for nonspherical and noncubical materials like foils. Therefore, in this work, the separation is displayed over the settling velocity.
Figure 6 compares experimental data and values of the parametrised Tomas and Gröger [24] model. According to Tomas et al. [39], the model is designed for narrowly classified and spherical particle mixtures. To assess the accuracy of the model fitting, the fitting parameter z (Table 3) must be taken into account. Although the trends of the partition curves can be reproduced well with the model according to the χ2 distribution (Table 3), the fitting parameter z indicates poor correlation.
When comparing the experimental data and the model, z should be close to the value of the real effective separation levels. Due to Equation (5), the agreement between the model and experimental data is also due to the utilisation of the number of effective separation stages z, since this forms the fitting parameter in the equation. The classifier used in the experiments consists of 10 separation stages. Since the feed enters the classifier in between stages 6 and 7, the number of separation stages is halved to obtain the number of effective separation stages for each product [39]. Thus, with an ideal match for the adjustment, z should be five. However, according to Rosenbrand [19], with a zig-zag air classifier, the stages are not all ideally utilised for separation. The upper and the lowest stages are not contributing to the separation. In addition, the design of the feeder of this peculiar classifier reduces the number of effective stages furthermore by one, because the material is not fed slowly into the process area, as via a chute, but is almost thrown into the classifier. Altogether, this reduces the number of separation stages from 10 to 7, so that the effective number of separation stages should theoretically amount to z = 3.5.
In general, no model fit to the experimental separation results comes even close to the value of z = 3.5, as seen in Table 3. One explanation for the generally poor utilisation of the separation stages for the particle systems could be the false air intake in the classifier. This false air results from the feeding of the ZZAC. Since the particles are not fed in an air-tight manner, the air for separation is drawn in not only from the heavy particle outlet but also from the feed point in the centre. Consequently, not all separation stages could be fully utilised in the experiments. To substantiate this assumption, further investigations must follow to examine the load per stage, the utilisation of the individual stages, and the false air intake during the air classification process.
If this cause of error is taken into account, the z-values of the cathodes of the prismatic cells (P1–P6) are acceptable at z = 2.9 (Table 3). In addition, there is a very good similarity of the curves, with χ2 of 0.002–0.005 (Table 3). This means that these particle systems are the only ones that make sufficient use of the individual sifting stages in the ZZAC and that modelling with the selected theoretic approach is, therefore, possible here. With regard to the further particle systems, the behaviour of the batteries, especially of the electrode foils, is very diverse. Although the anodes show approximately the same properties in terms of shape, size, and yield, the utilisation of the separation stages is very different. The best spheroidised particles for the anode and cathode originate from C2. Here, however, the worst results are achieved both for the effective stages z and the conformity of the curve (Table 3). The poor utilisation of only one separation stage reflects the low separation quality of the real experiments (Figure 5). The χ2 of the anode of C2 with 0.047 can be explained by the low sharpness of the separation, as the model was not developed for this purpose. The poorer separation behaviour already observed in the experiments (Figure 5) is also reflected for C3 by the inadequate utilisation of the effective separation stages (z = 1.2–1.3).
However, it can be seen that the lower anode yield in the heavy product (Figure 5a) is also confirmed by the model with a lower utilisation of the separation stages. This is a logical correlation, since the zig-zag air classifier is a series of several cross-flow separations. The more stages are used, the better becomes the separation result. Thus, based on the utilisation of the effective separation stages z, the model also confirms the quality of the separation. This means that the model fit and the use of the model for the anode particles of all batteries with the model of Tomas and Gröger is insufficient. However, the applied model fit provides general information; e.g., it can be used to evaluate the applicability of the classifier and thus its suitability of the particle system regarding separation in the zig-zag air classifier. This trend is also evident for the cathode particles. The lowest yield and, thus, the best utilisation of the classifier channel is seen for the cathodes of the prismatic cells. The C2 and C3 cathode particles have a higher impurity and, thus, are less suitable for separation in the zig-zag air classifier. Interestingly, when z is considered with respect to the shape and size distribution of the cathode particles, it becomes evident again that the more broadly distributed platy particles of the P1–P6 make better use of the classifier. Thus, it makes sense in further investigations to look more closely at the particle motions in the classifier, as in Bartscher [23], for example, for secondary raw materials. In particular, the dependence of the shape and also porosity should be considered for entangled material. On the one hand, the material systems alone should be tested for their complex behaviour in the classifier. This should include shape studies that describe the behaviour of the particles in the different sections of the classifier, in the part of the cross-flow separation as well as the influence of the vortex flows and the main flow in the sections. In addition, the influence of swarm interference due to the different interactions of the shapes must be evaluated. The influence of a compact particle on a porous particle with the same flow area in a turbulent environment should also be investigated specifically for this separation device.
The results of the partition curve show that the particle systems possess a certain sharpness during separation so that the model can be adjusted accordingly. The separation can only be well represented with the model for material that shows a broad shape and size distribution (cathode from P1–P6). However, the model of Tomas and Gröger is insufficient to provide a general view of the separation of mechanically recycled electrode foils, as the comparison of the effective separation levels z shows. For similar material combinations with similar particle properties, the z-values differ between the feed materials. Therefore, it is not possible to generalise the model and to define a common z-value for the material class, which is able to cover all the particles with their slight differences in size shape and density. However, fitting the model using parameter z can be used for another statement, the operational state of the classifier and, thus, the suitability of the zig-zag air classifier for a particle system. For further research, particle discrete models, which include the shape and size distribution, should be considered.

4. Conclusions

The separation behaviour of compacted electrode foils of different battery cells is investigated. Based on the shape and size analysis of the particles, it became clear that the thickness of the foils has an influence on the result of the spheroidisation step. Current collector foils of similar thickness showed similar separation efficiencies and separation behaviour. In particular, the model of Tomas and Gröger is tested to suit for modelling the separation in the zig-zag air classifier. By performing a model fit using the effective separations stages as a fitting parameter, it was proven that the model is not suitable for modelling the different batteries. On the one hand, the required sharpness of separation is sometimes not achieved. Secondly, the complex shape of the particles is highly unlikely to be suitable for the model. A good match could only be achieved with a broad size and shape distribution. However, with the help of the model fit, the effective separation stages could be calculated. This made it possible to estimate how well the zig-zag air classifier is utilised. Due to this, it can be evaluated whether the apparatus is suitable for separating a particle system.
Further investigation is needed regarding the utilisation of the different separation stages and the difference between aluminium and copper particles. The information could be useful to expand the model for battery material. Other separation devices for a broader particle size and particle shape distribution, such as eddy current, should also be investigated. In addition, examinations focus on the simulation of the entire process chain, starting from the material and structural properties of the batteries such as the thicknesses of the electrode foils. By grouping batteries based on these properties, the prediction of the recycling result can be facilitated. Particle discrete tests should be carried out between the individual stages in order to evaluate the quality of the process.

Author Contributions

A.K. developed the idea and the content of the report; A.K. and C.W. conducted the experiments, J.-S.R. and A.K. developed the code for the modelling; A.K. analysed the resulting data and results, and wrote the article; C.W., T.M. and U.A.P. revised the article and improved both the presentation of the results and the structure of the sections; everything took place under the supervision of U.A.P. All authors have read and agreed to the published version of the manuscript.

Funding

This research was funded by the German Federal Ministry for Education and Research (BMBF), as well as the Projektträger Jülich (PTJ), with the projects DIGISORT (Digitalisation of mechanical sorting processes in mechanical battery recycling) 03XP0337 and LOWVOLMON (Monitoring of low-volatile electrolytes in the mechanical recycling process chain) 03XP0354 within the competence cluster for battery recycling (greenBatt).

Data Availability Statement

The data presented in this study are openly available in OpARA at https://opara.zih.tu-dresden.de/xmlui/handle/123456789/5942 (accessed on 21 December 2023) [28].

Acknowledgments

The authors would like to thank the technical and scientific staff of the Institute of Mechanical Process Engineering and Mineral Processing. We especially thank Elvira Kleen for measuring the settling velocity of the particles. We also thank Felix Küster for the instruction of the CamSizer. The authors would like to thank Gert Schmidt of the Institute of Ceramics, Refractories, and Composite Materials for performing the SEM imaging. In addition, thanks to Lakshmanrao Pentela for manual sorting.

Conflicts of Interest

Author Thomas Mütze was employed by the company BASF Schwarzheide GmbH. Author Johannes-Samuel Rabaschus is currently employed by company Zeppelin Systems GmbH. The remaining authors declare that the research was conducted in the absence of any commercial or financial relationships that could be construed as a potential conflict of interest.

References

  1. Korthauer, R. Handbuch Lithium-Ionen-Batterien; Springer: Berlin/Heidelberg, Germany, 2013. [Google Scholar]
  2. Neef, C.; Schmaltz, T.; Thielmann, A. Recycling von Lithium-Ionen-Batterien: Chancen und Herausforderungen für den Maschinen-und Anlagenbau; Fraunhofer-Institut für System- und Innovationsforschung ISI: Karlsruhe, Germany, 2021. [Google Scholar]
  3. Bibra, E.M.; Connelly, E.; Gorner, M.; Lowans, C.; Paoli, L.; Tattini, J.; Teter, J. Global EV Outlook 2021: Accelerating Ambitions Despite the Pandemic; International Energy Agency: Paris, France, 2021; Available online: https://trid.trb.org/view/1925380 (accessed on 4 August 2023).
  4. Schmaltz, T. Recycling of Lithium-Ion Batteries Will Increase Strongly in Europe. Available online: https://www.isi.fraunhofer.de/en/blog/themen/batterie-update/recycling-lithium-ionen-batterien-europa-starke-zunahme-2030-2040.html (accessed on 29 August 2023).
  5. Rittlewski, P.; Grimm, J. ProDiREC–Direktes Recycling von Produktionsausschüssen. Available online: https://www.ipa.fraunhofer.de/de/referenzprojekte/prodirec.html (accessed on 12 August 2023).
  6. Vanderbruggen, A.; Gugala, E.; Blannin, R.; Bachmann, K.; Serna-Guerrero, R.; Rudolph, M. Automated mineralogy as a novel approach for the compositional and textural characterization of spent lithium-ion batteries. Miner. Eng. 2021, 169, 106924. [Google Scholar] [CrossRef]
  7. Rothermel, S.; Winter, M.; Nowak, S. Recycling of Lithium-Ion Batteries: The LithoRec Way. In Recycling of Lithium-Ion Batteries: The LithoRec Way; Kwade, A., Diekmann, J., Eds.; Springer: New York, NY, USA, 2018; pp. 1–31. [Google Scholar]
  8. EU. Proposal for a Regulation of the European Parliament and of the Council Concerning Batteries and Waste Batteries, Repealing Directive 2006/66/EC and Amending Regulation (EU) No 2019/1020; EU: Brussels, Belgium, 2020. [Google Scholar]
  9. Li, W.; Yang, M.; Long, R.; Mamaril, K.; Chi, Y. Treatment of electric vehicle battery waste in China: A review of existing policies. J. Environ. Eng. Landsc. Manag. 2021, 29, 111–122. [Google Scholar] [CrossRef]
  10. Sommerville, R.; Shaw-Stewart, J.; Goodship, V.; Rowson, N.; Kendrick, E. A review of physical processes used in the safe recycling of lithium ion batteries. Sustain. Mater. Technol. 2020, 25, e00197. [Google Scholar] [CrossRef]
  11. Windisch-Kern, S.; Gerold, E.; Nigl, T.; Jandric, A.; Altendorfer, M.; Rutrecht, B.; Scherhaufer, S.; Raupenstrauch, H.; Pomberger, R.; Antrekowitsch, H. Recycling chains for lithium-ion batteries: A critical examination of current challenges, opportunities and process dependencies. Waste Manag. 2022, 138, 125–139. [Google Scholar] [CrossRef] [PubMed]
  12. Kaas, A.; Mütze, T.; Peuker, U.A. Review on Zigzag Air Classifier. Processes 2022, 10, 764. [Google Scholar] [CrossRef]
  13. Wuschke, L. Mechanische Aufbereitung von Lithium-Ionen-Batteriezellen, 1st ed.; Technische Universität Bergakademie Freiberg: Freiberg, Germany, 2018. [Google Scholar]
  14. Kaas, A.; Wilke, C.; Vanderbruggen, A.; Peuker, U.A. Influence of different discharge levels on the mechanical recycling efficiency of lithium-ion batteries. Waste Manag. 2023, 172, 1–10. [Google Scholar] [CrossRef] [PubMed]
  15. Arnberger, A. Entwicklung Eines Ganzheitlichen Recyclingkonzeptes für Traktionsbatterien Basierend auf Lithium-Ionen-Batterien; University of Leoben: Leoben, Austria, 2016. [Google Scholar]
  16. Tromp, K.F. Neue Wege für die Beurteilung der Aufbereitung von Steinkohlen. Glückauf 1937, 73, 125–131. [Google Scholar]
  17. Kaiser, F. Der Zickzack-Sichter-ein Windsichter nach neuem Prinzip. Chem. Ing. Tech. 1963, 35, 273–282. [Google Scholar] [CrossRef]
  18. Senden, M.M.G. Stochastic Models for Individual Particle Behavior in Straight and Zig Zag Air Classifiers. Ph.D. Thesis, Technical University Eindhoven, Eindhoven, The Netherlands, 1979. [Google Scholar]
  19. Rosenbrand, G.G. The separation performance and capacity of zigzag air classifiers at high particle feed rates. Ph.D. Thesis, University Eindhoven, Eindhoven, The Netherlands, 1986. [Google Scholar]
  20. Gillandt, I.; Fritsching, U.; Riehle, C. Zur mehrphasigen Strömung in einem Zick-Zack-Sichter. Forsch. Im Ingenieurwesen 1996, 62, 315–321. [Google Scholar] [CrossRef]
  21. Hagemeier, T.; Glöckner, H.; Roloff, C.; Thévenin, D.; Tomas, J. Simulation of Multi-Stage Particle Classification in a Zigzag Apparatus. Chem. Eng. Technol. 2014, 37, 879–887. [Google Scholar] [CrossRef]
  22. Friedrich, J.; Winkler, T.; Lieberwirth, H. Numerische und experimentelle Untersuchung eines Zickzack-Sichters. Chem. Ing. Tech. 2014, 6, 906–909. [Google Scholar] [CrossRef]
  23. Bartscher, S. Numerische und Experimentelle Untersuchung des Sortiervorgangs im Zick-Zack-Sichter; Shaker Verlag: Düren, Germany, 2019. [Google Scholar]
  24. Tomas, J.; Gröger, T. Assessment of a multistage gravity separation in turbulent air flow. In Handbook of Powder Technology; Elsevier: Amsterdam, The Netherlands, 2001; Volume 10, pp. 761–769. [Google Scholar]
  25. Neeße, T.; Schubert, H. Modellierung und verfahrenstechnische Dimensionierung der turbulenten Querstromklassierung. Chem. Techn. 1975, 27, 529–533. [Google Scholar]
  26. Tomas, J.; Gröger, T. Assessment of multistage turbulent cross-flow aeroseparation of building rubble. In Developments in Mineral Processing; Elsevier: Amsterdam, The Netherlands, 2000; Volume 13, pp. C7-34–C37-43. [Google Scholar]
  27. Punt, F.; Doose, S.; Böttcher, A.C.; Breitung-Faes, S.; Kwade, A. Modeling and Flow Sheet Simulation of Selected Mechanical Recycling Processes for Li-Ion Batteries. Chem. Ing. Tech. 2023, 95, 59–67. [Google Scholar] [CrossRef]
  28. Kaas, A.; Wilke, C.; Rabaschus, J.; Mütze, T.; Peuker, U. Supplementary Material for the Publication “Modelling the Sorting of Lithium-Ion Battery Components in a Zig-Zag Air Classifier”. Available online: https://opara.zih.tu-dresden.de/xmlui/handle/123456789/5942 (accessed on 10 October 2023).
  29. Woldt, D.; Schubert, G.; Jäckel, H.-G. Size reduction by means of low-speed rotary shears. Int. J. Miner. Process. 2004, 74, S405–S415. [Google Scholar] [CrossRef]
  30. Lyon, T.; Mütze, T.; Peuker, U.A. Decoating of Electrode Foils from EOL Lithium-Ion Batteries by Electrohydraulic Fragmentation. Metals 2022, 12, 209. [Google Scholar] [CrossRef]
  31. Taylor, J.R. An Introduction to Error Analysis: The Study of Uncertainties in Physical Measurements; University Science Books: Sausalito, CA, USA, 1997; Volume 20. [Google Scholar]
  32. Schubert, H. Handbuch der Mechanischen Verfahrenstechnik; John Wiley & Sons: Hoboken, NJ, USA, 2012. [Google Scholar]
  33. Böhme, S. Zur Stromtrennung zerkleinerter metallischer Sekundärrohstoffe. In Freiberger Forschungsheft; Deutscher Verlag für Grundstoffindustrie: Leipzig, Germany, 1989; Volume 785. [Google Scholar]
  34. Kushimoto, K.; Suzuki, K.; Ishihara, S.; Soda, R.; Ozaki, K.; Kano, J. Analysis of the particle collision behavior in spiral jet milling. Adv. Powder Technol. 2023, 34, 103993. [Google Scholar] [CrossRef]
  35. Stieß, M. Mechanische Verfahrenstechnik-Partikeltechnologie 1; Springer: Berlin/Heidelberg, Germany, 2008. [Google Scholar]
  36. Schubert, H. Aufbereitung Mineralischer Rohstoffe, Bd. I; VEB Deutscher Verlag für Grundstoffindustrie: Leipzig, Germany, 1989; Volume 4. [Google Scholar]
  37. Straetmans, K.; Brückmann, R. Trockensortierung Mit Einem Zick-Zack-Sichter und Einem Kegelsichter; Freiberger Forschungsheft: Freiberg, Germany, 1999. [Google Scholar]
  38. Bretl, C.; Trunk, R.; Nirschl, H.; Thäter, G.; Dorn, M.; Krause, M.J. Preliminary study of particle settling behaviour by shape parameters via lattice Boltzmann simulations. In High Performance Computing in Science and Engineering’20: Transactions of the High Performance Computing Center, Stuttgart (HLRS) 2020; Springer: Cham, Switzerland, 2020; pp. 245–259. [Google Scholar]
  39. Tomas, J.; Gröger, T. Verfahrenstechnische Bewertung einer mehrstufigen Querstrom-Aerosortierung Mineralischer Stoffe; Univ., Fak. für Verfahrens- und Systemtechnik: Magdeburg, Germany, 2000. [Google Scholar]
Figure 1. Recycling process to produce fragments of current collector foils.
Metals 14 00269 g001
Figure 2. Investigated (a) particles of the different battery cells and (b) zig-zag air classifier.
Metals 14 00269 g002
Figure 3. Particle size distribution of (a) anode and (c) cathode foil fragments and the shape factor circularity as a function of the particle size for (b) anode and (d) cathode of cells P1, P2, P6, C2, and C3.
Metals 14 00269 g003
Figure 4. Anode (a,b) and cathode (c,d) particles for C2 (a,c) and P6 (b,d).
Metals 14 00269 g004
Figure 5. (a) Yield and (b) median cut velocities of experimental partition curves of the anode and cathode of the investigated battery cells.
Metals 14 00269 g005
Figure 6. Comparison of experimental data and modelled partition curves for the anode and cathode of the battery cell (a) C2, (b) C3, (c) P1, (d) P2, and (e) P6.
Metals 14 00269 g006
Table 1. Investigated battery cells, including active materials and foil thickness of the current collectors.
Name P1P2P6C2C3
Active materialNMCNMCNMCNCALFP
Foil thickness Cu [µm]10.5 8.58.48.210.6
Foil thickness Al [µm]14.711.912.65.419.3
Table 2. v10, v50, and v90 of the partition curve of the anode and cathode for the prismatic batteries P1–P6.
AnodeCathode
P1P2P6P1P2P6
v10 in m/s3.23.23.24.04.24.0
v50 in m/s4.14.14.04.34.44.4
v90 in m/s5.44.94.65.24.94.9
Table 3. χ2 and z for the anode and cathode of the investigated batteries.
C2C3P1P2P6
χ2Anode0.0470.0090.0050.0040.002
Cathode0.0260.0120.0120.0060.010
zAnode11.31.21.61.7
Cathode11.22.92.92.9
Disclaimer/Publisher’s Note: The statements, opinions and data contained in all publications are solely those of the individual author(s) and contributor(s) and not of MDPI and/or the editor(s). MDPI and/or the editor(s) disclaim responsibility for any injury to people or property resulting from any ideas, methods, instructions or products referred to in the content.

