Article

Experimental Investigations in the Processing of AISI H11 Powder Blends Enriched with Tungsten Carbide Nanoparticles for the Additive Manufacturing of Tailored Hot Working Tools in the Directed Energy Deposition (DED-LB/M)—Impact of Tungsten Carbide Nanoparticles on Microstructural and Mechanical Characteristics

1
Institute of Photonic Technologies, Friedrich-Alexander-Universität Erlangen-Nürnberg, 91052 Erlangen, Germany
2
Erlangen Graduate School in Advanced Optical Technologies (SAOT), Friedrich-Alexander-Universität Erlangen-Nürnberg, 91052 Erlangen, Germany
3
Department of Engineering and Physics, Karlstad University, SE-651 88 Karlstad, Sweden
*
Author to whom correspondence should be addressed.
Metals 2024, 14(2), 188; https://doi.org/10.3390/met14020188
Submission received: 17 October 2023 / Revised: 2 January 2024 / Accepted: 21 January 2024 / Published: 2 February 2024

Abstract

:
In this study, the DED-LB/M process of AISI H11 tool steel powder blends modified by adding WC nanoparticles (WC-np) in concentrations of 1, 2.5 and 5 wt.-% was the object of scientific investigations. For this, 30-layer cuboid specimens were manufactured. The overall scientific aim was to examine how the WC-np interact with the steel melt and in the end, influence the processability, microstructure and mechanical properties of produced specimens. The examinations were carried out on both as-built and thermally post-processed specimens. An advanced microstructural analysis (SEM, EDS, EBSD and XRD) revealed that due to the high solubility of WC-np in the molten steel, most of the WC-np appear to have dissolved during the ongoing laser process. Furthermore, the WC-np favor a stronger distortion and finer grain size of martensite in the manufactured specimens. An increase in hardness from about 650 HV1 for the H11 specimen to 780 HV1 for the one manufactured using the powder blend containing 5 wt.-% of WC-np was observed in as-built conditions. In the same way, the compression yield strength enhanced from 1839 MPA to 2188 MPA. The hardness and strength increasing effect of WC-np remained unchanged even after heat treatments similar to those used in industry.

1. Introduction

In industry, Directed Energy Deposition using Laser and Metallic Powder (DED-LB/M) is an already established manufacturing process for the repair and maintenance of cost-intensive functional parts. Examples include the repair of worn injection molds or forming tools [1,2,3], or the tip repair of turbine blades [4,5,6]. Besides that, DED-LB/M is industrially used as coating technology for the deposition of wear- and corrosion-resistant coatings on highly stressed functional parts in order to improve their mechanical properties and practical performance (e.g., increased life-time) [5,7,8]. Due to the ongoing improvement in and progression of system technology applied for DED-LB/M and the availability of CAD/CAM software for tool path planning, this laser-based manufacturing process becomes interesting for the Additive Manufacturing (AM) of complete, complex-shaped 3D parts with novel and outstanding characteristics. Therefore, first, several individual weld tracks were deposited parallel to each other in overlap configuration for generating a dense weld track layer. By welding several weld tracklayers on top of each other, a multilayer 3D part can be additively manufactured. However, the production of complete functional parts with application-relevant properties using the DED-LB/M process has so far mainly been carried out in a laboratory environment and has not been transferred to industrial series production by default. A very promising field of application of this technology is tool making [9].
Most studies are concerned with the processing of low-carbon steels. Examples of these are stainless steels [10,11,12] or maraging steels such as, e.g., Fe-19Ni-xAl [13], 1.6358 [14], or 1.2709 [15,16], which are considered to have good weldability due to their low carbon content and are therefore suitable for processing in laser-based Additive Manufacturing. Further works are investigating the processing of more traditional hot work tool steels such as AISI H13 [17,18,19,20] or AISI H11 [21] whose carbon content is between 0.3 and 0.4 wt.-% [22]. These steels are commonly used as materials for injection molds or forging dies in industry. For this purpose, they are usually produced by machining and applying a series of different subtractive manufacturing technologies followed by depositing a functional coating.
The processing of high carbon tool steels in the DED-LB/M process is limited to a few basic investigations [23,24,25,26,27,28]. The evaluation of microstructural and mechanical characteristics of DED-LB/M specimens and coatings made out of the high-speed steel 1.3343 (AISI M2, or AISI M4) was the object of a few scientific investigations carried out in [25,26,27,28]. In the scope of these investigations, the produced tool steel specimens showed promising mechanical properties after carrying out an appropriate thermal post processing similar to industrial application. The AM of complete tools in DED-LB/M for hot forming applications or injection molding is recently mostly limited to scientific trials [29,30,31]. Junker et al. [31] tested a forging from the hot work tool steel 1.2365 (AISI H10) under conditions close to industrial application. In the scope of testing the additively manufactured hot forging tool, it behaves similar to the traditionally fabricated tool standardly applied in series production. For example, the tool life was comparable to that of the series tool [31].
A very promising way for further optimizing and improving properties of tools additively manufactured in DED-LB/M provides the use of customized tool steel powder mixtures prepared prior to the laser process. Therefore, at least one type of nanoscale or microscale additive is added to a microscale matrix powder. For instance, nanoparticle-enriched metal powders, produced via mechanical alloying in a ball mill [32] or in a dry-coating process as presented in [33], offer the potential for the manufacturing of functional parts with enhanced mechanical and practice-relevant properties that overcome the performance of conventionally fabricated ones by far. The application of nanoparticle-enriched powder blends aims to improve mechanical properties via targeted adapting of the chemical composition or changing microstructural properties of manufactured parts, respectively.
The processing of nanoparticle-enriched powder blends using laser-based AM technologies such as Laser Powder Bed Fusion (LPBF) or DED-LB/M was the object of several scientific studies investigating different mixing ratios between nanoscale additives and microscale matrix powders. In this context, the majority of studies focused on the PBF-LB\M process. Thereby, the scientific aim was among others to identify and analyze the influence of the added nanoparticles on both the process ability as well as microstructural and mechanical characteristics of generated structures. A comprehensive overview about investigations carried out in this field can be found in [34].
Gu et al. [35] examined the impact of TiC nanoparticles on the microstructure and tensile strength of the aluminum alloy AlSi10Mg in the PBF-LB\M process. The study could prove that the high-melting TiC additives preferably disperse in the aluminum melt and act as additional crystallization nuclei during the melt pool cooling down and solidifying. This promotes grain refinement and leads to a significant increase in mechanical strength in comparison to the pure AlSi10Mg specimens.
The influence of ZrH2 nanoparticles on the process ability of the high-strength aluminum alloys EN AW 6061 and EN AW 7075 in PBF-LB/M has been investigated in [36]. By modifying the aluminum wrought alloy powders with ZrH2 nanoparticles, the susceptibility to hot-cracking can be lowered to an uncritical level. This can be attributed to the grain refinement induced by the high-melting ZrH2 additives dispersing in the aluminum matrix.
In [37], the processing of the case hardening steel powder 16MnCr5 enriched with C-np or WC micro particles was extensively examined. Through the modification of the 16MnCr5 with 0.3 wt.-% C-np, the hardness increased from about 337 HV5 for the pure 16MnCr5 specimen to about 458 HV5 for the one reinforced with 0.3 wt.-% C-np.
In DED-LB/M, the processing of nanoparticle-reinforced powder blends is limited to a few studies in which the impact of the nanoscale additives on microstructure and resulting mechanical properties is examined. However, the focus of these investigations was mainly put on coating applications with the aim to improve the wear-resistant behavior and increase the life-time of functional parts, e.g., [32,38,39,40,41,42,43].
In [38], the fabrication of TiC/Inconel 625 composites in the DED-LB/M process is extensively studied. In this context, both the mixing ratio between nanoscale additives and the microscale matrix powder as well as the particle size of the TiC nanoparticles varied. Because of grain refinement caused by the high-melting TiC nanoparticles, dispersing in the Inconel matrix, hardness, tensile strength and wear resistance enhanced and improved.
In [32], the influence of Al2O3, TiC and WC on the process ability and microstructural and mechanical characteristics of the steel 1.2365 was the focus of extensive scientific investigations. Depending on the type and amount of nanoparticles added to the steel powder, an increase in hardness and mechanical strength could be observed for coatings deposited, applying powder blends enriched with WC and TiC nanoparticles. Especially, the wear resistance of produced nanoparticle-reinforced 1.2365 structures improved significantly in comparison to the unmodified 1.2365 coatings [32].
In [41], the authors deal with the processing of a bainitic steel powder (bainidur) enriched with C-np and WC micro particles in varying concentration by means of DED-LB/M.
In [33], the DED-LB/M process of AISI H11 powder blends modified by adding C-np in concentrations of up to 0.5 wt.-% was studied. Thereby, the focus was set among others on the influence of the nanoscale carbon additives on Vickers hardness and mechanical properties evaluated in compression tests. Through the induced metallurgical changes (e.g., stronger distortion of martensite, higher amount of hardness and strength increasing precipitations (carbides)), both the hardness and yield strength of manufactured specimens were significantly enhanced compared to the unmodified AISI H11 builds. For instance, there was an increase in yield strength from 1839 ± 61 MPa for the pure AISI H11 specimens to on average 2134 ± 68 MPa for the ones made out of the powder blend containing additionally 0.2 wt.-% C-np.
In the present study, the processing of AISI H11 powder blends enriched with WC- nanoparticles (WC-np) in concentrations of 1, 2.5 and 5 wt.-% in DED-LB/M was the object of scientific investigations. Out of a scientific view, the aims were to investigate the processability and optimization of manufacturing parameters, revealing behavior of WC nanoparticles and their influence on microstructure (retained austenite content, grain size, etc.) and mechanical properties, in particular, the yield strength, before and after carrying out two different heat treatments similar to industrial application.

2. Materials and Powder Properties

2.1. Base Materials

In the present investigations, Argon (Ar)-atomized AISI H11 tool steel powder purchased from TLS Technik GmbH & Co Spezialpulver KG (Bitterfeld-Wolfen, Germany) was used as matrix material. As follows from SEM imaging (Figure 1a,b), the AISI H11 particles had a predominately spherical particle shape and a smooth particle surface. The effective particle diameter of the steel powder ranges from 5 µm to approximately 80 µm, according to particle size distribution studies carried out using a Camsizer system supplied by Retsch GmbH (Haan, Germany). The expected value d50% of the effective particle diameter was determined to be 41.4 µm.
In advance of the production of the WC-np-enriched AISI H11 powder blends, the chemical composition of the H11 powder was analyzed using two different measurement techniques. The content of chromium (Cr), molybdenum (Mo), manganese (Mn) and vanadium (V) was measured by examining the polished cross-section of particles embedded in resin using energy dispersive X-ray spectroscopy (EDS). In order to obtain statistically relevant results, several particles were included in these investigations. The carbon content of the steel powder was determined using the Elementrac CS-i analyzer from Eltra (Haan, Germany). The instrument, based on IR combustion spectroscopy, is predestined for the measurement of small, medium and large amounts of carbon in various metallic alloys.
Table 1 presents the chemical composition of the AISI H11 powder and steel substrates. The concentrations of the carbide formers Cr, V, Mo and Mn are in good agreement with the reference values for AISI H11 given in [22]. Additionally, the carbon content, which has a mean value of 0.345 wt.-%, falls within the limits defined in the material specification of AISI H11 [22].
As nanoscale additives, Tungsten Carbide nanoparticle (WC-np) powder from the company IoLiTec Ionic Liquids Technologies GmbH (Heilbronn, Germany) was purchased; cf. Figure 1c,d. As could be verified using SEM imaging, the particle shape of an isolated WC-np ranges from about 100 nm to approx. 200 nm. According to the powder provider, the particles were the pure WC phase and the chemical purity of the nanoparticle powder was with a value of at least 99.9% (very high).
For conducting the experiments, AISI H11 tool steel plates (h × w × t: 200 mm × 200 mm × 15 mm) were used. The substrates were purchased from the company HSM Stahl (Georgsgmünd, Germany). The substrates’ chemical composition was determined using Optical Emission Spectroscopy (OES). Table 1 presents the results of this measurement. The main alloying elements, Cr, V, Mn, Mo and Si, are consistent with the material specifications of AISI H11 [22]. The carbon content has a mean value of 0.39 wt.-%, which is close to the upper limit of carbon concentration permitted according to [22].

2.2. Preparation of WC-np-Enriched AISI H11 Tool Steel Powder Blends

For the preparation of WC-np AISI H11 powder blends, a multi-stage dry-coating approach was used. The dry-coating process was already developed and successfully evaluated in a previous study in which the processing of carbon black nanoparticles reinforcing AISI H11 powder mixtures was fundamentally proven [33,44]. Subsequently, the sub-processes involved in the dry-coating procedure are listed in bullet points.
To enhance powder flowability and decrease residual moisture, the microscale AISI H11 powder and WC nanoparticle powder were dried in a furnace under an Argon atmosphere at 100 °C for several hours.
Subsequently, the powder species were blended in the desired ratios utilizing a high-precision laboratory scale.
The powder mixtures were prepared via tumbling for at least 3 h using the Turbula-mixing device from Willy A. Bachhof Maschinenfabrik (Mutenz, Switzerland).
In the final stage, the WC-np-enriched AISI H11 powder mixtures underwent a second sieving process using a 100 µm mesh sieve to eliminate larger powder agglomerations that may form between smaller AISI H11 particles and WC-np during the tumbling process. This additional sieving step is crucial for producing WC-np-enriched AISI H11 powder blends with adequate flowability. Note that the second sieving process may result in a loss of WC-np in the prepared powder mixtures, which may cause the final WC-np content to differ slightly from the desired concentration (as shown in Table 2).
The adhesion of the WC-np to the surface of the microscale tool steel particles can be traced back to van der Waals forces (surface tensions) acting between the WC-np and the surface of the microscale AISI H11 particles. As exemplarily shown in the SEM images in Figure 2a–f for the prepared WC-np-enriched powder blends, the applied dry-coating process is applicable for achieving an approximately homogenous distribution of the WC-np onto the surface of the AISI H11 particles. However, small WC-np agglomerates with a mean size of 300 nm, but reaching about 1 µm in size, are formed on the surface of the microscale particles, in particular, with an increasing amount of WC-np added; see, e.g., Figure 2f.
A total of four AISI H11 powder blends with different concentrations of WC-np (1; 2.5; 5; 7.5 wt.-%) were produced in the manner described above. For each mixing ratio, a total of 2 kg of powder was prepared. However, only 0.5 kg could be made per one tumbling process.
After the dry-coating process was completed, the WC-np-enriched AISI H11 powder blends were analyzed using Eltra’s CS-analyzer to determine the actual carbon content. By matching with the carbon content in the pure AISI H11 powder and the theoretically maximum carbon concentration without sieving losses (Ccarbon, ideal), the actual WC content (CWC-np, estimated) in the powder samples can be determined in wt.-% through simple stoichiometric extrapolation. Table 2 presents the measured total carbon content of prepared powder blends and the estimated WC-np content after carrying out the second sieving process.

2.3. Influence of WC–np on Powder Flowability

Prior to the DED-LB/M process, the powder feeding line, which represents the relationship between the powder mass flow and the rotation per minute (rpm) set on the metering plate of the powder feed unit, must be determined individually for each prepared powder mixture. In this way, suitable operating parameters for the powder feeder can be derived in terms of the flowability of the tool steel powder mixture being processed. In addition, the powder feeding line provides initial information on the influence of the WC-np on the flowability. In the case of high flowability, a strict linear relationship between the powder mass flow and the speed of the feeder plate and a small standard deviation of the individual measured values are expected. Conversely, as the flowability of the powder decreases, the measured powder feeding curve tends to deviate from a linear relationship and the standard deviation increases significantly.
By analyzing the powder feed curves shown in Figure A1, it can be seen that there is a linear relationship between the powder mass flow and the number of rotations per minute set on the dosing plate of the powder feeder. It can also be seen that the flowability gradually decreases as the amount of WC-np in the prepared tool steel powder mixture increases. This is evident from the decrease in the slope of the regression lines shown in Figure A1. Only for small amounts of WC-np (≈1 wt.-%) does the flowability of the modified powder mixture appear to be comparable to that of pure AISI H11 steel powder. However, up to and including 5 wt.-% of WC-np, the adjusted powder mass flow is homogeneous and reproducible, which is essential for achieving a stable DED-LB/M process.
For tool steel powder mixtures with a WC-np concentration equal to or greater than 7.5 wt.-%, the powder feeding process becomes inhomogeneous and clogging of the powder feeding line occurs frequently. The poor flowability for these mixtures can be seen in the significantly larger standard deviations of the measured powder mass flows; cf. Figure A1. Therefore, the following investigations will focus exclusively on AISI H11 powder blends enriched with a maximum WC-np concentration of 5 wt.-%.

3. System Technology, Process Parameters and Experimental Methods

We used a 5-axis (x, y, z, A, C) DED-LB/M machine (TLC 3008) from Trumpf GmbH + Co. KG (Ditzingen, Germany). The system is equipped with a cw disk laser (Tru Disk1000) emitting laser light with a maximum output power of 1 kW at a wavelength of 1030 nm. The intensity profile follows a super-Gaussian function, which is typical for this type of laser source. The laser processing head consists of a fiber plug, a movable collimating lens, a fixed focusing lens, a protective glass and a triple-jet powder nozzle. A rotating disc powder feeder with two hoppers is used to feed the metal powder. Helium was used as the carrier gas and the gas flow rate was fixed at 8 l/min. The distance between the powder nozzle and the substrate (working distance, stand-off distance) was set to a constant value of 11.5 mm. For minimizing the effect of oxidation on the processed tool steels, Argon was used as a shielding gas at a constant flow rate of 20 l/min. In addition, all experiments were performed with a constant laser beam diameter of 1.5 mm.
Figure 3 illustrates the experimental procedure used for the layer-by-layer manufacturing of cubic samples consisting of multiple weld track layers. A comprehensive description of the procedure for the Additive Manufacturing of multilayer test specimens can be found in [44]. In a first step, individual weld tracks were deposited on the AISI H11 substrates using different sets of process parameters. Based on the quality and metallurgical properties (e.g., width, height, aspect ratio, dilution zone/welding depth, etc.) of the single weld tracks produced, the range of process parameters for the production of 1-, 4- and 10-layer cuboidal specimens with an edge length of approximately 15 mm was deviated. Among other things, the aspect ratio (width/height) of individual tracks served as a first criterion for the selection of suitable parameters for the production of multi-layer specimens. Furthermore, only parameter combinations were considered that could produce weld tracks with negligible residual porosity and an excellent weld metallurgical bond to the substrate. For producing 1-, 4- and 10-layer specimens, the laser beam power P was varied between 500 and 1000 W in increments of 100 W, and two different powder mass flows (2.7 ± 0.1 g/min; 3.7 ± 0.1 g/min) were investigated for each investigated AISI H11 powder blend. Table 3 gives an overview of process parameter combinations investigated. At this point, it has to be mentioned that the investigated process parameter combinations are also applicable for producing multilayer specimens with promising characteristics from AISI H11 powder mixtures modified through the addition of carbon nanoparticles; see [44].
Figure 4 shows a sketch of the bidirectional deposition strategy applied for the AM process of multi-layered builds. The hatch distance that corresponds to the distance of two parallel aligned and overlapped single weld tracks was adjusted to the half single track width, which was measured via OM in advance.
At this stage, it should be noted that all combinations of process parameters are applicable to the production of almost fully dense multilayer specimens made from both unmodified AISI H11 powder and AISI H11 powder blends enriched with carbon black nanoparticles [18,44].
The 10-layer specimens were later examined for porosity and defect assessment. To this end, the samples were first prepared into polished vertical sections using a standard metallographic procedure involving grinding, lapping and polishing. The next step was to produce spatially resolved microscope images of the full sample cross-sections, which were successively analyzed in terms of pixel brightness. A value for relative density could then be estimated from the ratio of the number of bright pixels to the total number of pixels considered in the evaluation process [44]. Based on the relative density evaluation, the set of process parameters for the production of 30-layer samples was derived from the prepared powder mixtures. As described in detail below, these samples were then used for thermal post-processing, an advanced microstructural analysis and the determination of mechanical properties via compression testing.
In total, eighteen 30-layer specimens were produced for each np-enriched AISI H11 powder blend. Of these specimens, 12 were thermally post-treated using two different heat treatment strategies (S1-HT, S2-HT) close to an industrial use case. A detailed description of the used heat treatments (S1-HT, S2-HT) can also be found in [44]. The remaining six specimens were then further investigated in their as-received condition.
In advance to the thermal post processing, the steel plates on which the builds were deposited were machined to form specimens consisting of the 30-layer test specimen and a cuboidal piece of the tool steel substrate (Figure 3 (right)). To ensure that the thermal boundary conditions for all the specimens during the heat treatments were approximately the same, they had approximately the same mass and a very similar geometry after machining.
In order to identify and investigate the impact of thermal post processing on the resulting microstructural and mechanical characteristics, two different heat treatment strategies were carried out. The first heat treatment strategy investigated (S1-HT) corresponded to a single tempering process in an air atmosphere at a holding temperature of approximately 580 °C for a period of 2 h. This procedure corresponds to the heat treatment already used in [18,44] for the thermal post-treatment of specimens made of carbon-nanoparticle-enriched AISI H11 powder blends.
The second heat treatment (S2-HT) is a two-step process. In the first stage, the specimens are austenitized in an air atmosphere at 1080 °C for 12 min and then quenched in an oil bath. After hardening, the samples are tempered once in the second stage using the same parameters as for S1-HT. S2-HT is very close to the industry standard for the thermal post processing of AISI H11 or similar steels. Furthermore, S2-HT has already been investigated in previous work on the thermal post-treatment of multilayer AISI H11 parts produced in DED-LB/M [18,44]. Optical Emission Spectroscopy (OES) was used to determine the chemical composition of the prepared samples using the Spectro-Lab10 instrument from Spectro AMETEK (Kleve, Germany).
To obtain statistically acceptable results, each prepared specimen was measured three times (Figure 5b). The measured chemical compositions are required, among other things, for the later evaluation and reconstruction of the XRD diagrams using the Rietveld method; see below.
For the microstructure analysis using OM and SEM imaging, the first step was to etch the polished cross-sections of the manufactured samples using a V2A etchant containing HCl, H2O and HNO3. This etchant is particularly suitable for the analysis of martensitic steels and the visualization of grain and fusion boundaries for OM and SEM.
In addition to OM and SEM imaging, EDS area and line scans were carried out to measure the local chemical composition and to obtain an idea of the spatial distribution of the main alloying elements and carbide formers, chromium (Cr), molybdenum (Mo), manganese (Mn), vanadium (V) and tungsten (W), particularly in the interdendritic spaces and at the grain boundaries. Both electron backscatter diffraction (EBSD) and X-ray diffraction (XRD) studies have been carried out to gain an in-depth understanding of how the WC-np added to the AISI H11 powder affect the microstructural properties. The investigations focused on the occurrence of metallurgical phases, in particular, the retained austenite (RA) content, domain (crystallite) size and grain size of martensite and RA.
For EBSD examination, it is necessary to polish the cross-section by applying a fine acidic alumina suspension containing particles about 100 nm in size. The Gemini II field emission scanning electron microscope from Carl Zeiss Microscopy GmbH (Jena, Germany), equipped with an Oxford Technologies EDS detector, was used for SEM imaging, EDS mapping and EBSD investigations.
In contrast to EBSD, which is usually used to analyze small areas, XRD allows larger areas and sections to be examined. In this way, a mean value of the RA content and the crystallite size (domain size) of RA and martensite/ferrite can be obtained by evaluating the diffraction pattern. XRD measurements were performed using a Philips X’Pert MRD (Amsterdam, the Netherlands). For the experiments, the diffraction angle 2θ was varied between 25° and 125° with a step size of 0.03°. A total of three individual measurements were taken for each sample at predefined measurement positions (bottom, center and top) to determine the concentration of RA content as a function of sample height. Each rectangular measuring area had a length, l, of 6 mm and a width, b, of 3 mm; cf. Figure 5a. The RA content as well as the domain size of RA and martensite were obtained based on the Rietveld approximation. This method offers the possibility of modelling and reconstructing the complete diffraction diagrams using the least squares method. The post-processing of the raw data and the evaluation, including all the mathematical and numerical operations necessary for the modelling of the diffraction diagrams, were performed directly in the Bruker Topas software (version 4.2). The diffraction peaks of individual phases are described using pseudo-Voigt functions. In addition, the dependence of the full width at half maximum on the diffraction angle was considered, as suggested in [46,47]. The background in the diffraction diagram was modelled using Chebyshev polynomials. Apart from that, all preferred orientations were reconstructed with spherical surface functions as presented by Järvinen et al. [48].
In the Rietveld method, the diffraction patterns were reconstructed using the same structures used in [44]. The following structures were used:
  • Austenite, space group 225, face-centered cubic (fcc);
  • Ferrite, space group 229, cubic-body-centered (bcc);
  • Martensite, space group 139, tetragonal-body-centered.
As suggested in [44], the crystallite size (domain size) of martensite and RA can be determined by analyzing the influence of the WC-np on the full width at half maximum (FWHM). A broadening of the FWHM of individual peaks is due to either a decrease in domain size or an increase in micro-stress within the crystallites. The RA content and the domain size of RA and martensite were then obtained as model parameters of the Rietveld approach directly in the software.
Hardness measurements were made on polished cross-sections using the HP30S Vickers Hardness Tester from Hegewald & Peschke (Nossen, Germany). The instrument has an automatic x, y linear stage and allows for performing high-spatial-resolution hardness distribution measurements; cf. [44].
Compression tests were conducted following DIN 50106 to investigate the impact of added WC-np on compression properties. The Quasar 100 universal testing machine from Galdabini (Cardano al Campo, Italy) was used for this purpose. As depicted in Figure 5c, the cuboid specimens underwent a series of subtractive manufacturing processes, including wire-EDM, turning and circular grinding, to transform them into cylindrical compression specimens with a diameter of 6 mm and a height of 9 mm. The material testing was conducted under a maximum compression force of 100 kN, which corresponds to the maximum load capacity of the universal testing machine. The compression rate was set to a constant value of 5 mm/min, which is an empirical value. The Y0.2% compressive yield strength, maximum compressive stress and maximum achievable strain were determined by examining and evaluating the recorded stress–strain curves. To ensure statistical significance, five specimens were tested and characterized for each steel powder mixture and heat treatment condition (as-built, S1-HT and S2-HT).
The procedure described above for determining the compressive properties was already used in [44] for carbon-nanoparticle-reinforced AISI H11 specimens.

4. Results and Discussion

4.1. Influence of WC-np on Relative Density and Chemical Composition

Irrespective of the tool steel powder mixture processed and therefore the amount of WC-np added, 10-layer test specimens with a residual porosity of less than or equal to 0.5% could be produced for all combinations of process parameters investigated.
In selecting a suitable set of process parameters for the production of the 30-layer specimens, the geometric dimensional accuracy of the specimens was another criterion in addition to high relative density (ρrel). In order to focus the investigations on the impact of WC-np on microstructure and resulting mechanical characteristics, in the end, all specimens were manufactured with the same set of process parameter combinations. Independently, on the processed AISI H11 powder blend, a promising compromise between high relative density (>99.5%) and an adequate geometric dimensional accuracy of manufactured specimens was achieved at a laser power of 600 W, a feed rate of 400 mm/min and a powder mass flow rate of 2.7 ± 0.1 g/min; cf. polished cross-sections in Figure 6.
Prior to the analysis of microstructure and the determination of mechanical properties, the chemical composition of manufactured 30-layer specimens was obtained by means of Optical Emission Spectroscopy (OES). Table 4 shows the measured chemical compositions of generated tool steel specimens.
Comparing the total carbon content of the powder blends (Table 2) with the carbon concentration of the 30-layer specimens produced using the WC-np-enriched AISI H11 powder blends (Table 4), it is clear that there is a loss of carbon in the DED-LB/M process. The loss of carbon can ultimately be attributed to a loss of WC-np during the transport phase of the powder blends from the powder feeder to the laser-induced melt pool. In particular, larger agglomerates consisting of a few WC particles, as shown in the SEM and ASB images in Figure 2e,f, detach more easily from the surface of the microscale AISI H11 particles during the transport phase than is the case for small isolated WC particles. The reason for this is that the electrostatic force (van der Waals force) responsible for the adhesion of the WC nanoparticles to the surface of the AISI H11 particles decreases significantly with an increasing effective particle diameter and mass of the WC-np agglomerates. On the other hand, carbon loss through evaporation of the WC nanoparticles introduced into the process is excluded due to the high boiling temperature of WC of about 6000 °C.
In order to demonstrate at which point in the powder conveying line the WC particles detach from the surface of the AISI H11 particles, random samples were taken at two predefined positions for each powder mixture investigated. The samples were taken after passing the exit of the powder nozzle and from the powder overspray that accumulates on the substrate surface during the ongoing laser process. The carbon content of the collected samples was then determined using the Elementrac CS-I Analyzer from Eltra GmbH (Haan, Germany). By comparing these readings with the measured carbon content of the starting powders and the produced tool steel samples, it is possible to determine where exactly the loss of WC particles occurs. Table 5 summarizes the results of these investigations.
For all WC-enriched powder blends, the loss of WC-np along the conveying path until the powder particle jet exits the nozzle outlets still appears to be moderate. As can be seen from Table 5, the measured carbon values differ only slightly between the initial powder and the extracted samples (direct after nozzle outlet). Furthermore, the loss of WC-np up to this point is not subject to large variations, as shown by the small standard deviations of the measured carbon contents.
Consequently, the loss of WC-np must occur during the flight phase of the particles from the nozzle exit into the melt pool or during the laser–material interaction. This is confirmed by comparing the measured carbon content after passing the nozzle outlet with the carbon concentration of the collected powder overspray and the fabricated test specimens. For all WC-np-enriched powder mixtures, the measured carbon content of the overspray was noticeably lower than that of the random powder samples taken immediately after the nozzle outlet, and at the same time higher than the measured carbon content of the manufactured specimens. Furthermore, the loss of WC-np enhances with increasing WC-np content added to the AISI H11 powder. However, the loss of WC-np in the ongoing DED-LB/M process appears to be reproducible for all the WC-enriched H11 powder blends investigated, as indicated by the moderate standard deviations of the measured values presented in Table 5.
For a better understanding of the detachment process of the nanoparticles during the flight phase, it is planned to characterize the powder particle jet for the WC-np-enriched blends with a high speed optical camera setup, as proposed and used in [14] for the characterization of the powder jet caustic.

4.2. Influence of WC-np on the Microstructure of Manufactured Specimens

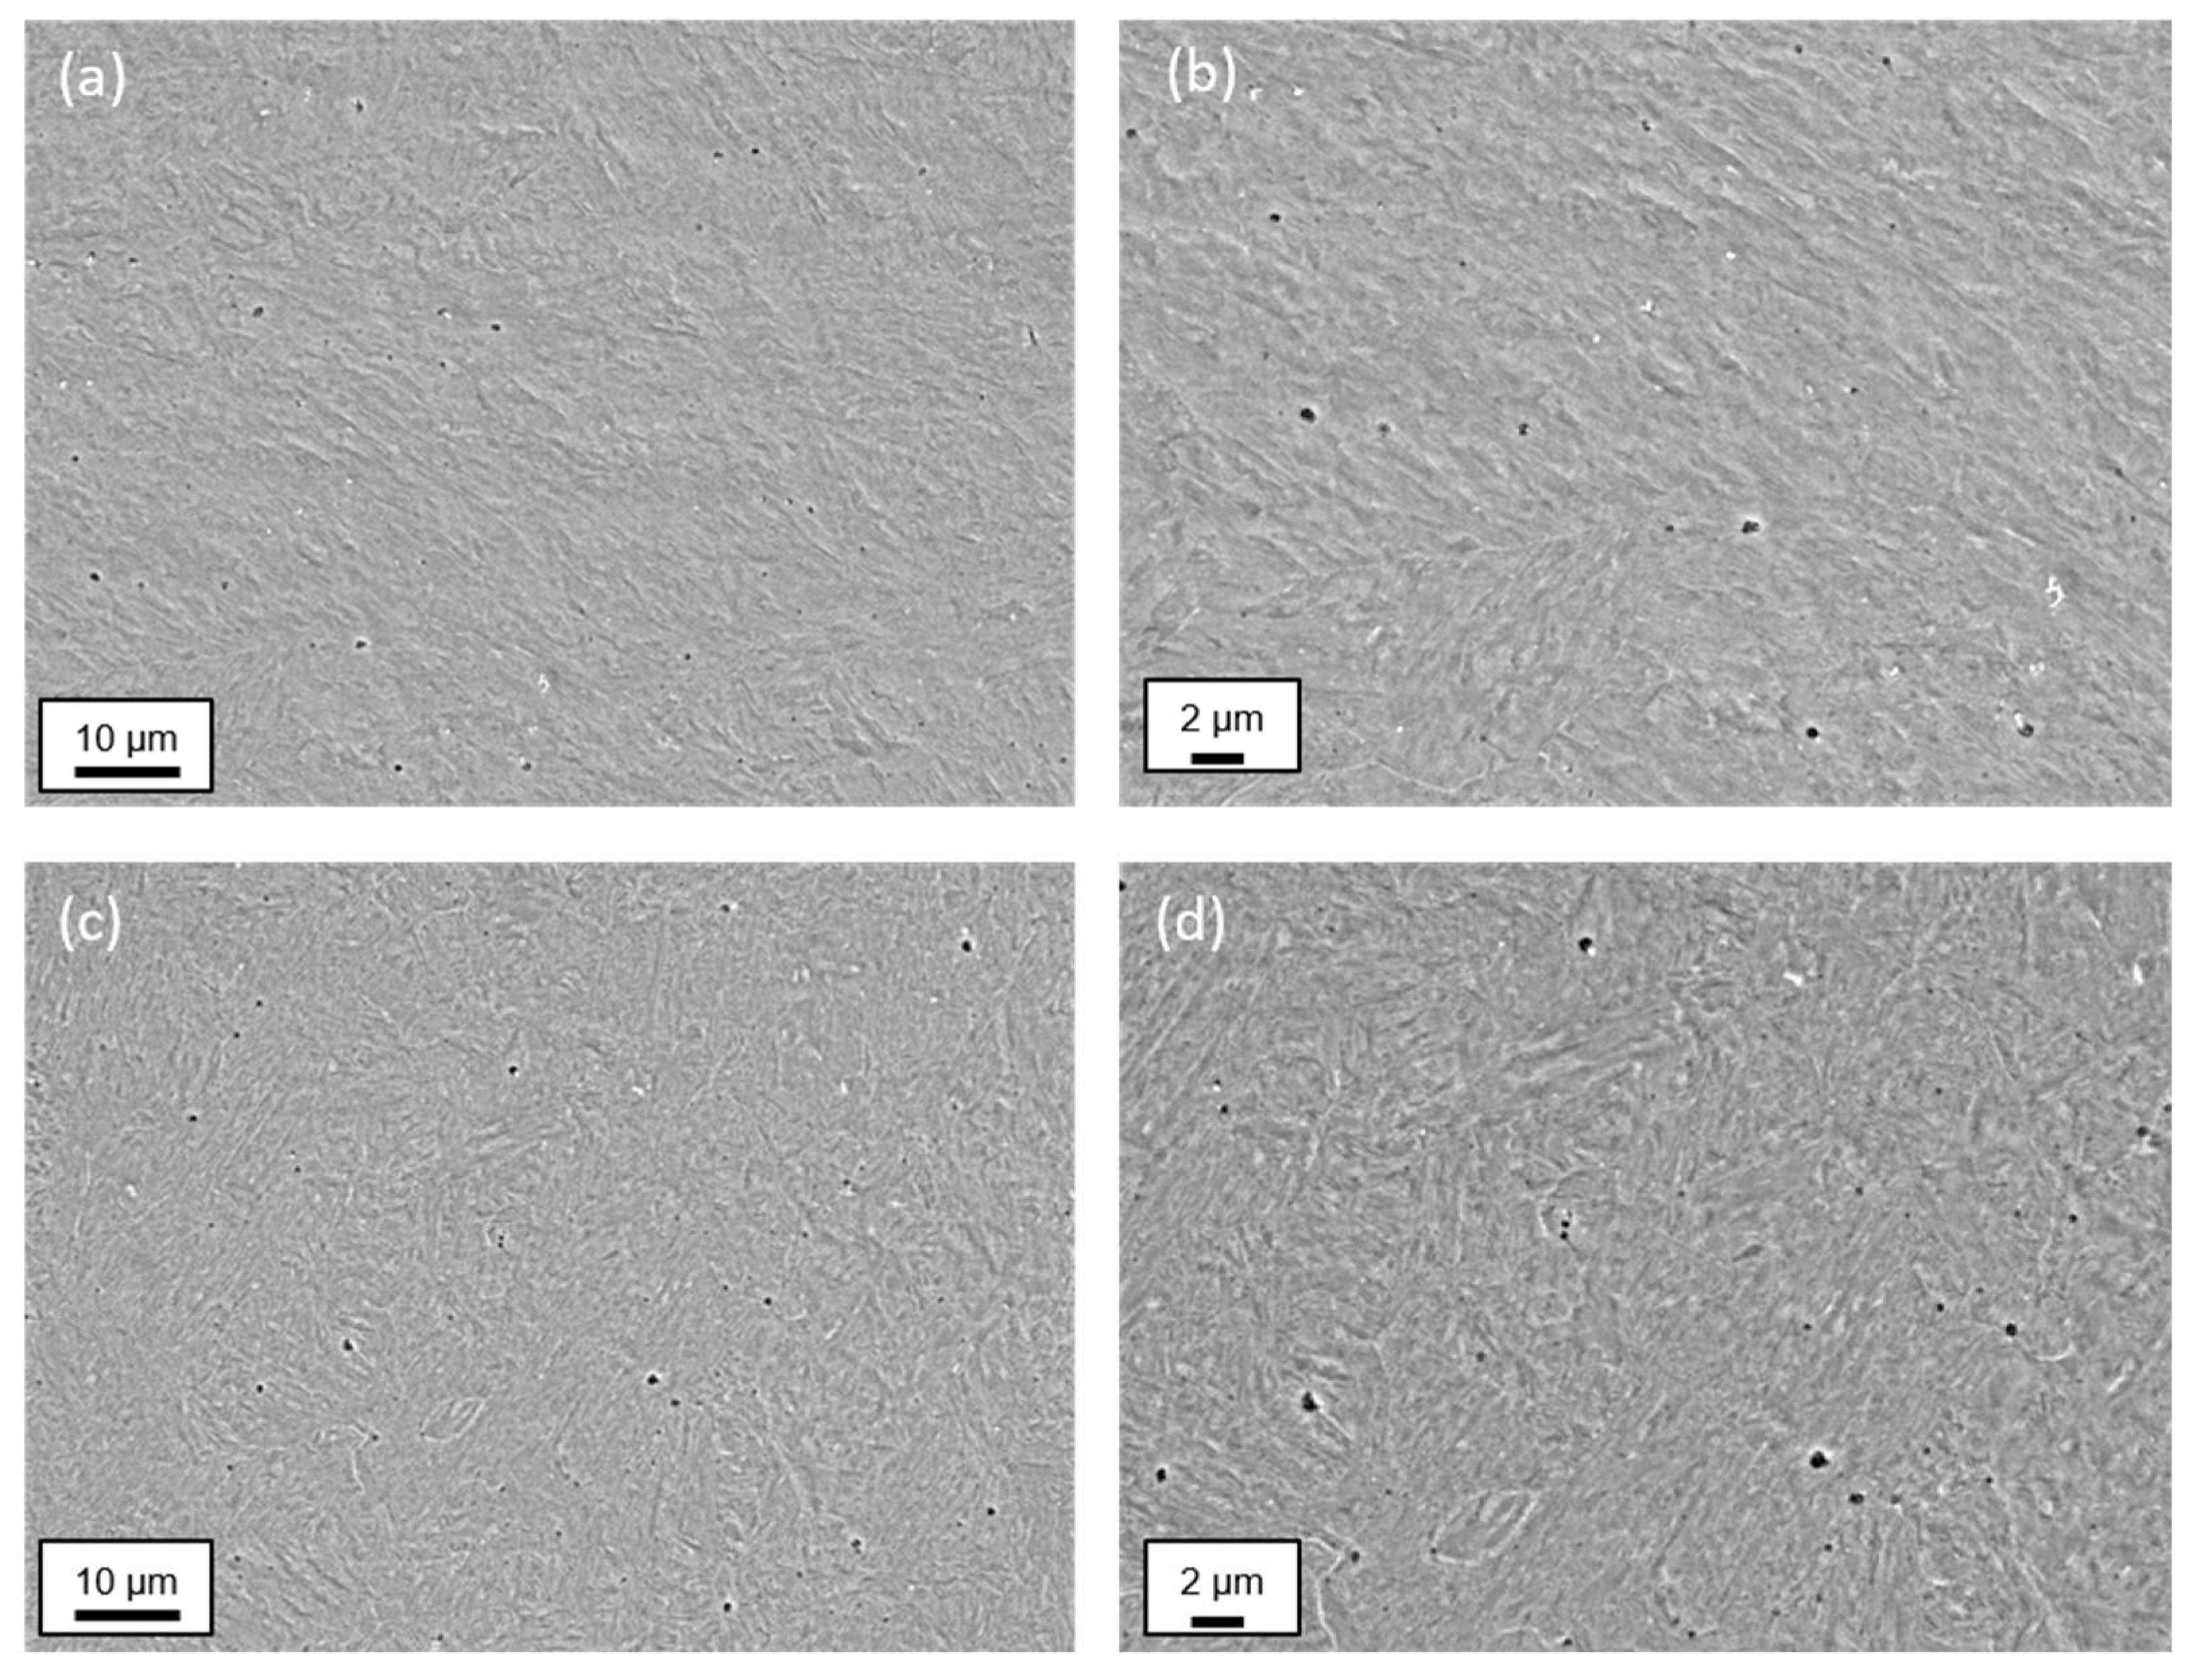
By analyzing chemically etched cross-sections of the generated specimens in as-built conditions using SEM imaging, at the first look, no significant differences of the resulting microstructure with respect to the WC-np content added can be verified; see Figure 7.
Due to the small melt pool volume and the process-specific high cooling rates, a fine-grained and locally inhomogeneous dendritic microstructure formed in both the pure AISI H11 specimen and the specimens made from the WC-np-enriched AISI H11 powder blends. Independent on the powder mixture processed, a fine needle-like internal structure can be seen within the dendrites. This characteristic structure is most likely martensite with an additional small amount of a ferritic phase (e.g., bainitic ferrite) and retained austenite (RA) (see also XRD and EBSD measurements below).
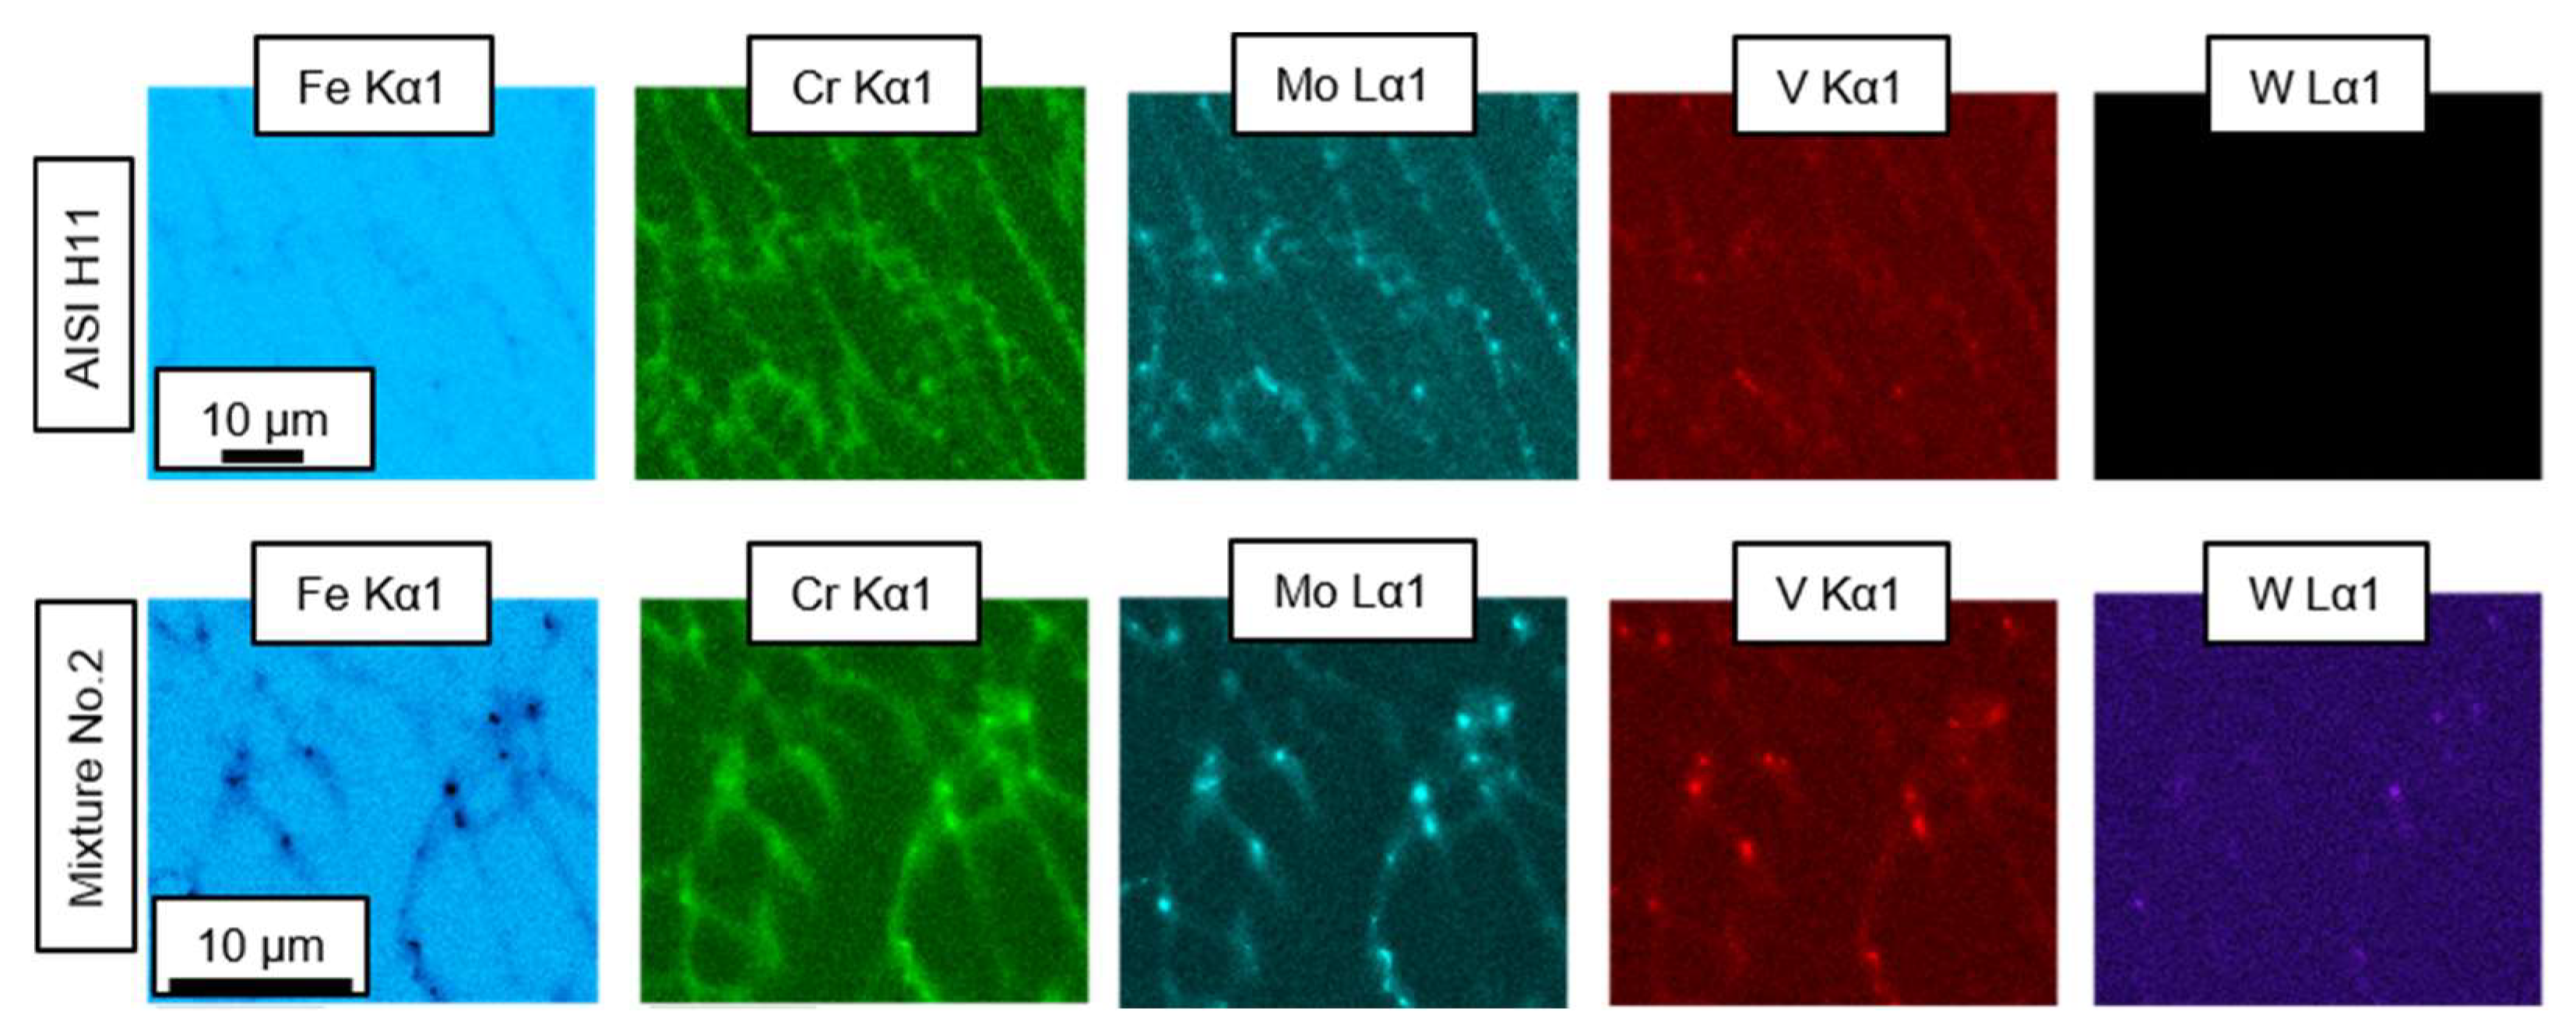
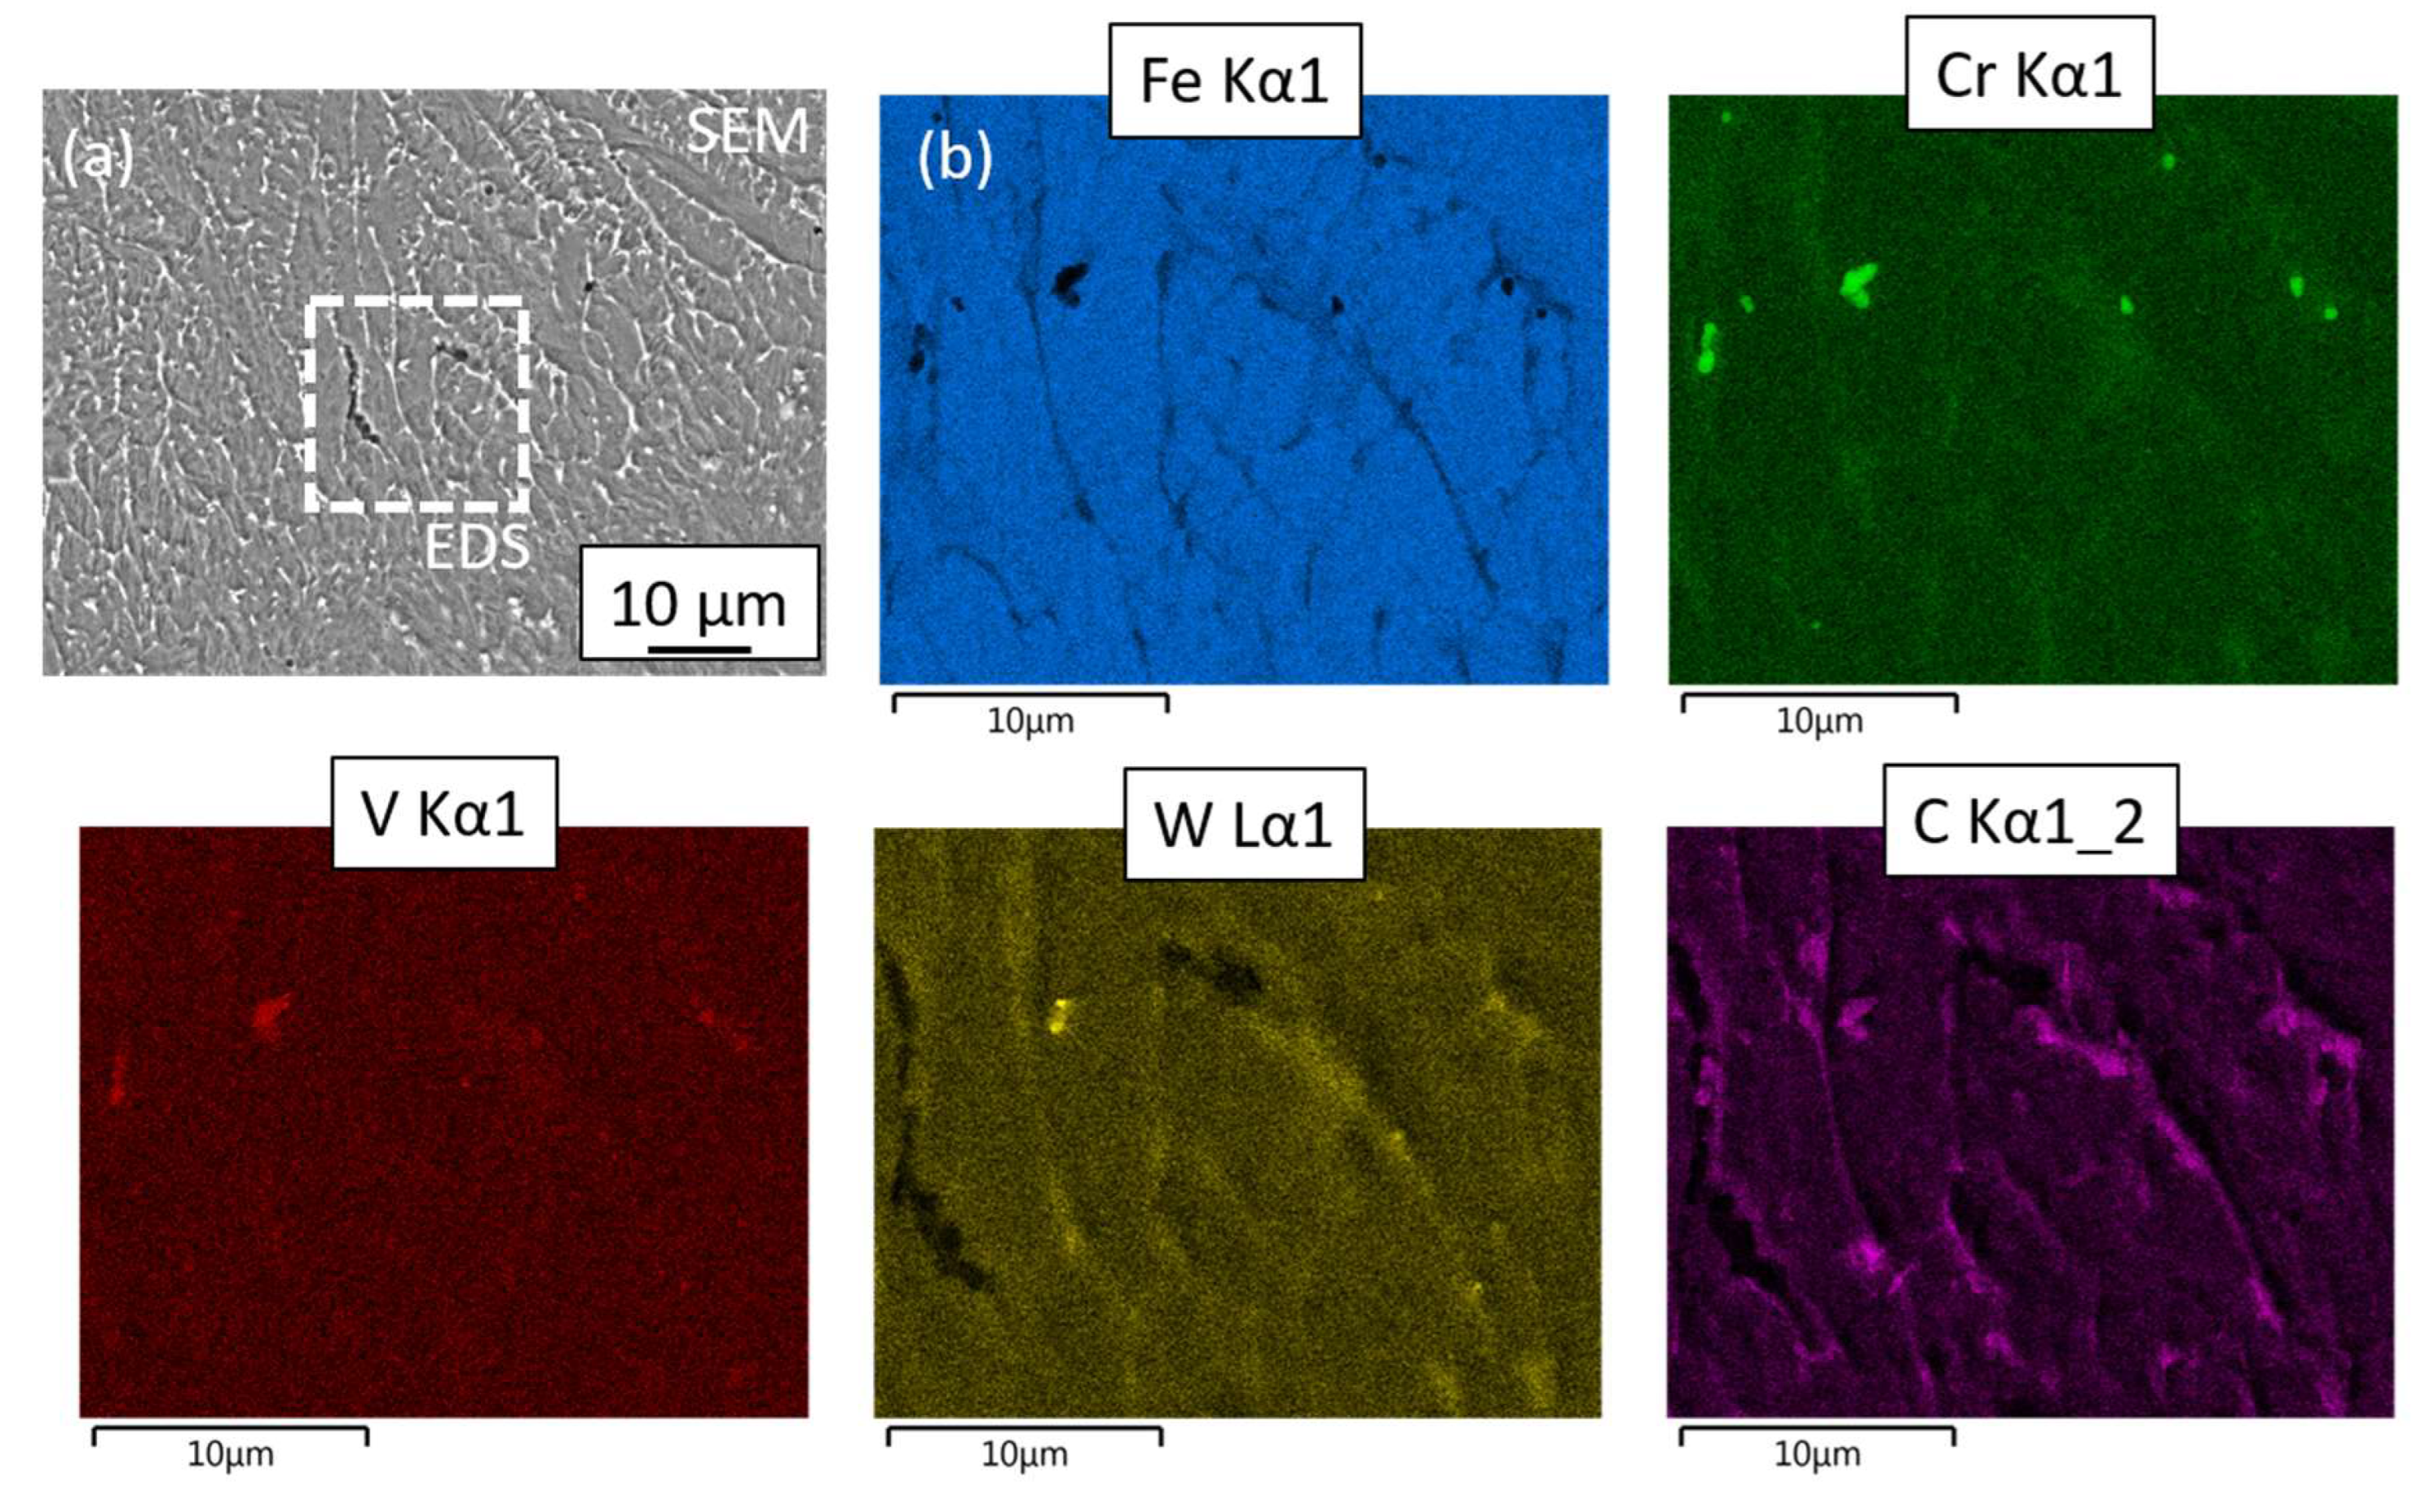
In addition, as demonstrated using EDS area scans, an accumulation of the main alloying elements and carbide formers Cr, Mo, Mn and V was detected in the interdendritic regions or at the grain boundaries independently on the powder mixture examined (see, e.g., Figure 8). In contrast, the iron (Fe) content appears to be reduced and the carbon concentration slightly increased in these areas; cf. Figure A2 and Figure A4. This indicates the formation of hardness- and strength-enhancing carbides, in particular, Cr and Mo mixed carbides of type M7C3 or M23C6 and VC and Mo2C special carbides. These observations are also in good agreement with the results of others who have investigated the processing of AISI H11 or similar hot work tool steels using laser-based Additive Manufacturing processes such as LPBF-M [29] and DED-LB/M [10].
The extensive examination of the samples produced using SEM imaging and EDS mapping revealed only a few local clusters of tungsten (W) and, at the same time, carbon at the grain boundaries (interdendritic spaces), indicating the presence of WC or W2C precipitates; cf. Figure 8, Figure A2 and Figure A4. On the contrary, it appears that most of the tungsten is homogeneously and finely distributed in the steel matrix through solid solution formation; cf. Figure 8, Figure A2 and Figure A4. For the few detected tungsten clusters, the local tungsten content measured using EDS increased compared to the matrix (Figure A2). The tungsten clusters/particles typically have an average size between 300 nm and 1000 nm. They are therefore larger than the originally added WC-np. This points out that these particles are interdendritic WC precipitates formed as the melt pool cools down and solidifies.
According to [27,30,31], the solubility of WC in iron/steel is high. Tungsten Carbide begins to dissolve at temperatures below the solidus temperature of steels. As reported in [31], up to 7% by weight of WC can be dissolved in the iron matrix at a temperature of around 1250 °C. With increasing temperature, the solubility of WC in iron (steel) continues to increase and reaches its maximum when the steel is molten and the melt is heated up using absorbed laser energy. Due to the high solubility of WC in steel, combined with the high surface area to volume ratio of the nanoscale WC additives and the low number of detected tungsten clusters, it can therefore be assumed that most of the initially added WC-np are dissolved in the steel melt during the laser process. After the cooling and solidification of the melt pool, most of the tungsten is homogeneously distributed in the solidified AISI H11 matrix, forming a solid solution. In contrast, it seems that only a small proportion of the dissolved tungsten is re-excreted as interdendritic WC or W2C precipitates (special carbides). This conclusion is also in good agreement with the findings of the authors of [17], who investigated the processing of WC-np-reinforced 1.265 steel powder in DED-LB/M. According to [17], most of the initially added WC-np are dissolved in the steel melt and only a small fraction of the dissolved tungsten is re-precipitated in the form of carbides at the grain boundaries.
Due to the high melting temperature of WC of approximately 2800 °C, it seems unlikely that the overall melt pool temperature is high enough to achieve complete melting of the nanoscale additives. If this had been the case, the evaporation temperature of the alloying element Cr (Tevap = 2482 °C) would have been reached at the same time. This would probably have resulted in a measurable deviation in concentration between the powder material and the manufactured test specimens. However, such a deviation could not be detected within the metrological capabilities. Therefore, melting of the added WC-np in the melt pool does not appear to be the dominant effect.
It should be noted that the individual WC particles are unlikely to dissolve completely in the laser-induced melt pool. There is some likelihood that a small solid core, a few nm in size, of the original WC particle will remain. In addition, it cannot be ruled out that nanoscale WC precipitates are also formed during the solidification of the melt pool due to the high cooling rates inherent in the process. In both cases, these particles would not be detectable due to the lack of resolution of the methods applied. Further investigation, such as Transmission Electron Microscopy (TEM), would be required to detect such small precipitates.
The examination of the microstructure using SEM and OM as a function of specimen height reveals slight local differences in the internal structure for all specimens in the as-built condition (Figure 8 and Figure 9).
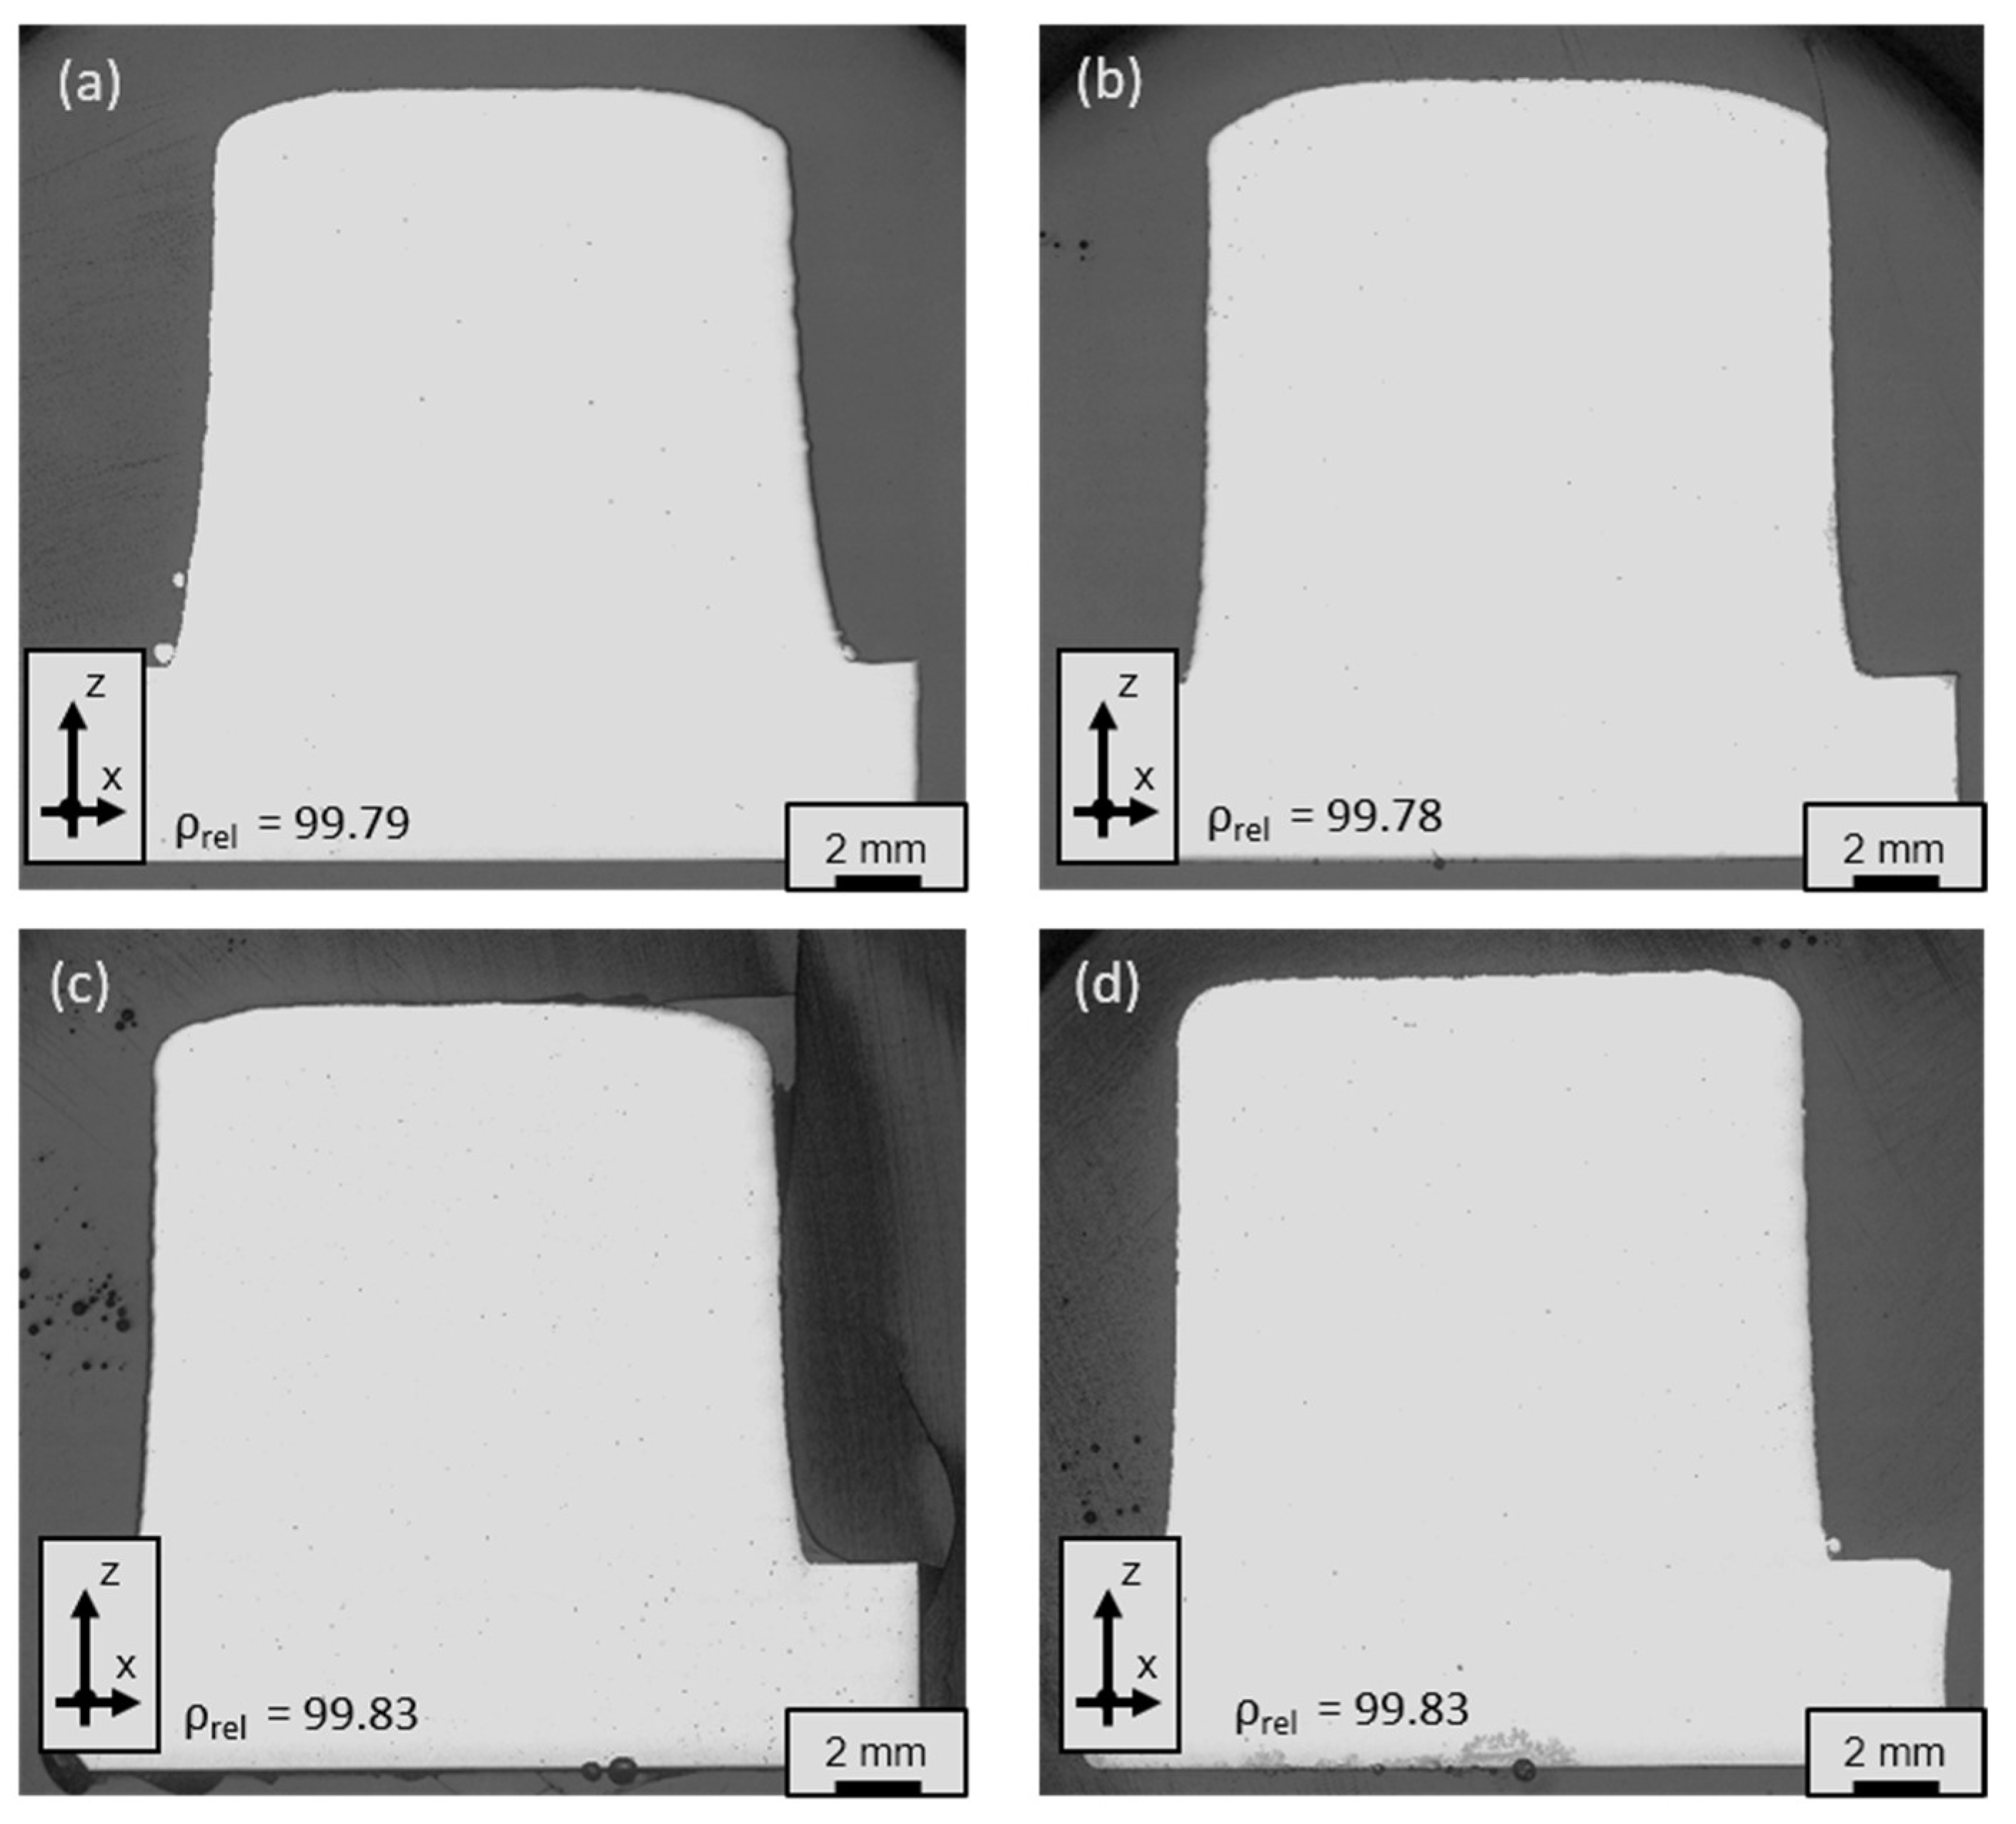
Looking at the low-magnification microscope images of chemically etched specimen cross-sections shown in Figure 9a–d, two characteristic regions appear independently on the investigated tool steel powder mixture. The lower part of the manufactured specimens appears to be over-etched and dark in color. This indicates the presence of multiple re-austenitized, quenched and tempered martensite. In contrast, the middle and top sections appear as bright areas in the microscopic images. This indicates freshly formed martensite. As already reported by others who have investigated the processing of AISI H11 or similar hot work tool steels in DED-LB/M, these layer-dependent microstructural differences result from a kind of in-process heat treatment during the AM process [10,11,18].
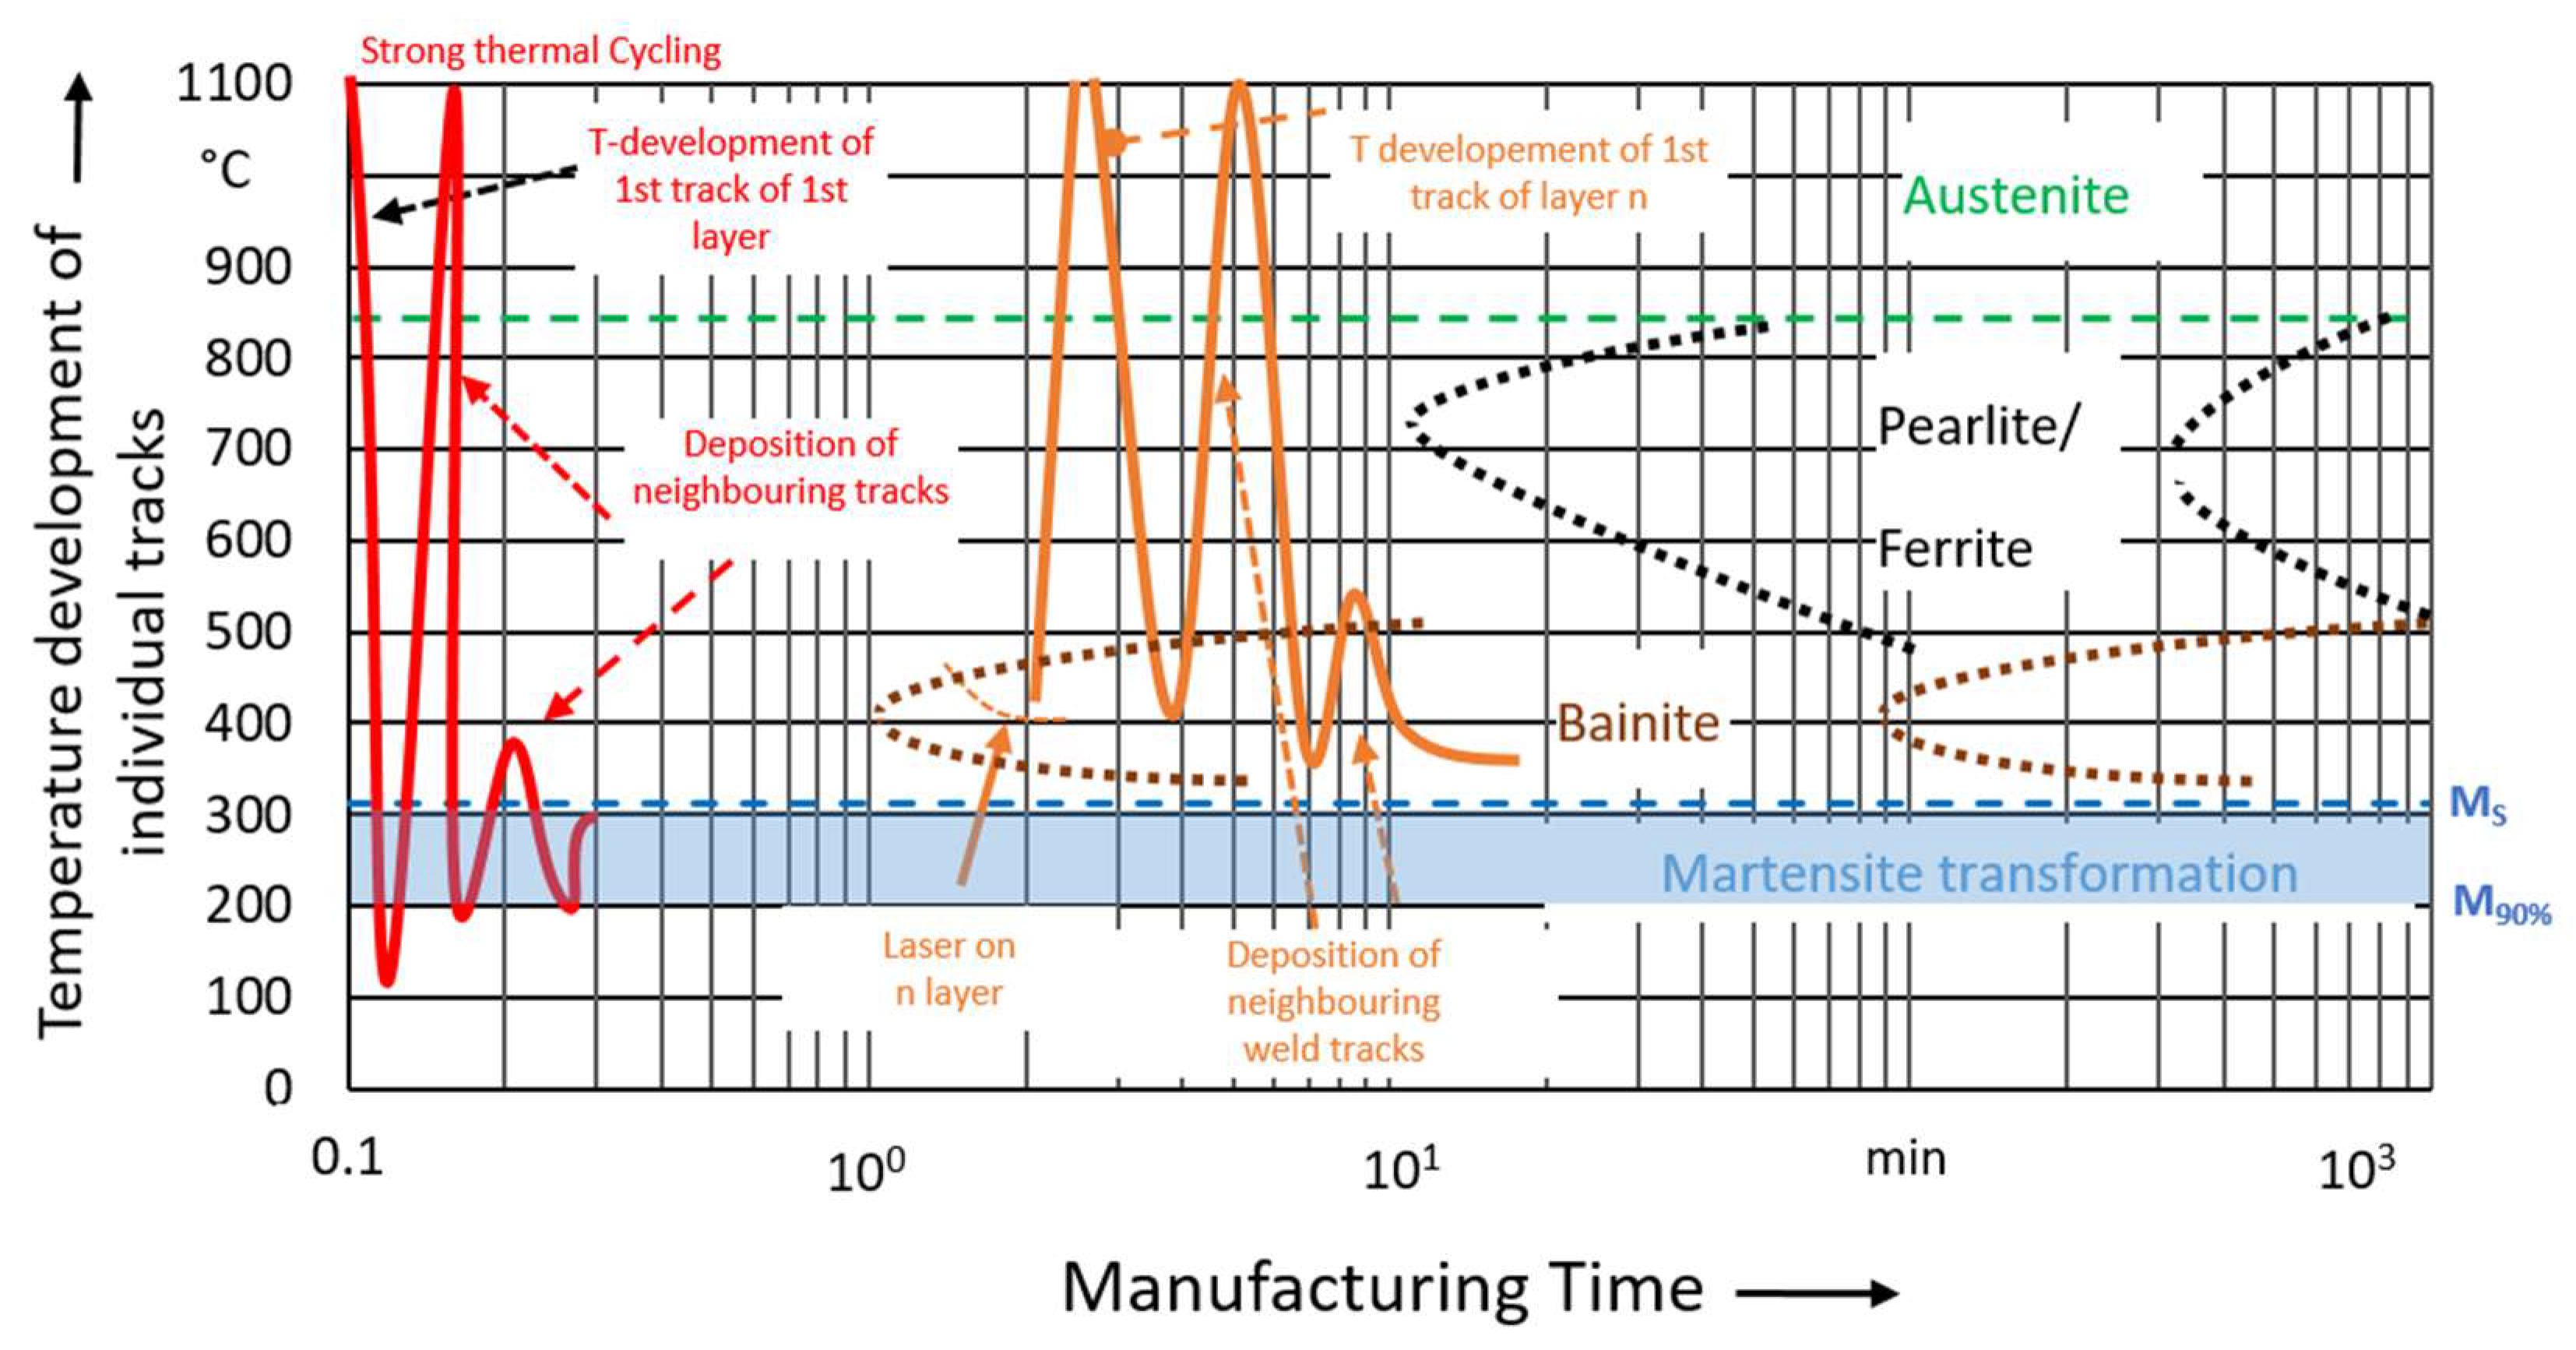
As shown schematically for the red curve in Figure 10, the lower layers of the weld seam are melted, re-austenitized and rapidly cooled down below the martensite starting temperature (Ms) several times at the beginning of the manufacturing process.
As a result, these lower layers are subject to severe thermal cycling. When the AM process progresses, thermal energy is continuously introduced into the built-up structure as weld tracks are deposited next to and on top of each other. The consequences include an increase in the average interlayer temperature and a decrease in the local temperature gradients and cooling rates at the surface. Depending on the set of process parameters, the absorbed laser energy, the deposition strategy and the prevailing thermal and geometrical boundary conditions, the interlayer temperature can reach an average value of the order of or above Ms of the tool steel powder being investigated. Once this occurs, the transformation from austenite to martensite can no longer take place during the ongoing AM process; see the orange curve in Figure 10. Consequently, the phase transformation from austenite to martensite will not take place until the manufacturing process has been completed and the entire sample volume has been rapidly cooled down (quenched) below Ms.
As shown by the orange curve in Figure 10, the process-specific in situ heat treatment means that, in addition to martensite, ferrite or bainite is very likely to be present proportionally in the microstructure. The volume fraction of ferrite (bainitic ferrite) in the microstructure essentially depends on how long the average temperature of the deposited weld track layer remains above the martensite starting temperature. Since the formation of the intermediate bainite structure is based on diffusion processes, a correspondingly long time is required for complete transformation. The production time for a 30-layer steel sample was approximately 45 min. Considering the time–temperature transformation diagram of the starting material AISI H11, as shown schematically in Figure 9, a proportion of ferrite or bainitic ferrite (presumably lower bainite) should be present in the microstructure, at least in the middle part of the specimens. However, due to the limited production time, it can be assumed that the volume fraction of these phases is lower than that of martensite. It should be noted that a quantitative statement about the martensite to ferrite ratio, or the extent to which lower or upper bainite is formed, cannot be made without precise knowledge of the temporal evolution of the average interlayer temperature, which in turn depends on the shape and size of the manufactured component and may vary.
In order to gain an in-depth understanding of how the added WC-np influence the microstructure, XRD and EBSD investigations were carried out. The main objectives were to investigate and identify their effect on the RA content, crystallite (domain) size and grain size of the detected phases.
Figure 11 shows the measured diffraction plots and the Rietveld reconstruction for the lower region of the specimens in the as-built state. Irrespective of the sample examined, the diffraction diagrams could be reconstructed correctly using the Rietveld method; cf. Figure 11b–d.
For all samples, diffraction peaks were detected at the reference positions of RA and ferrite or martensite. On the contrary, no diffraction peaks were detected at the reference positions of alloy-typical carbides. For example, Cr-Mo mixed carbides of type M7C3 or M23C6 are at least semi-coherent with the steel matrix and have a similar lattice structure to martensite and ferrite (α-Fe). Therefore, they cannot be clearly identified in the diffraction patterns as their reflections overlap with those of α-Fe. The primary carbides, VC (cubic) and Mo2C (hexagonal), which are typical of AISI H11, can only be found in small amounts of less than 1%; see chemical composition measurements in Table 4. This is below the detection limit of the XRD setup used. In addition, no peaks could be detected at the reference positions of WC (hexagonal), which would be incoherent with the AISI H11 steel matrix. This indicates either that the concentrations of WC precipitates in the samples analyzed must be less than 1 vol.-% or that the WC particles are extremely small (a few nm in size) and cannot be detected using the measurement technique.
Diffraction peaks at the reference positions of RA and ferrite or martensite were detected for all samples. Conversely, no peaks were identified at the reference positions of alloy-typical carbides. For example, Cr-Mo mixed carbides of type M7C3 or M23C6 are at least semi-coherent with the steel matrix and have a similar lattice structure to martensite and ferrite (α-Fe). Therefore, their reflections overlap with those of alpha-Fe and cannot be clearly identified in the diffraction patterns. The primary carbides, VC (cubic) and Mo2C (hexagonal), which are typical of AISI H11, are only present in small amounts of less than 1 vol.-%. This is below the detection limit of the XRD setup used. In addition, no peaks of WC (hexagonal) could be detected at the reference positions, which would be incoherent with the AISI H11 steel matrix. This indicates either that the concentrations of WC precipitates in the samples analyzed must be less than 1% by volume, or that the WC particles are extremely small (a few nm in size) and cannot be detected using the measurement technique.
As can be seen from a closer consideration of the diffraction diagrams shown in Figure 11b–d, the peaks at the reference positions of ferrite and martensite could not be clearly separated from each other. The reasons for this are the large peak widths and the limited measurement resolution of the XRD equipment. However, it was found that Rietveld regressions better describe the original diffraction patterns when both martensite and ferrite phases are included in the reconstruction. Without considering the ferrite peaks, the Rietveld fit of the spectra deviates significantly from the series data. This indicates that both martensite and ferrite phases are likely to be present in the microstructure of the samples examined.
The observed ferrite reflections most likely indicate the presence of bainitic ferrite, considering that bainite corresponds to dislocation-rich ferrite surrounded by cementite (Fe3C, iron carbide). This would also be consistent with the in-process heat treatment theory described above. A precise quantification of the phase fractions is not possible due to the high correlation between the scaling factors of martensite and ferrite. However, as the reflections of RA are single peaks, see Figure 11b–d, this is not necessary for the determination of the RA content.
Both the unmodified and the WC-np-enriched AISI H11 specimens have the same martensite, ferrite and RA peaks. As it was the case for carbon-nanoparticle-reinforced AISI H11 samples [44], a total of 10 martensite, 5 ferrite and 5 RA peaks were detected and applied to fit and reconstruct the diffraction patterns. Table A1 in Appendix B gives an overview of the martensite, ferrite and RA reflections considered with the corresponding Miller indices.
However, the intensities and full width at half peak (FWHM) of individual reflections seem to be dependent on the concentration of nanoscale WC additions. By analyzing the intensities of RA peaks of the same spatial orientation (same Miller indices), the trend is apparent that a higher WC-np content favors higher RA peak intensities and leads to a stabilization of the high-temperature austenitic phase in the tool steel specimens. In contrast, the peak intensities of martensite and ferrite tend to decrease as the amount of WC-np added increases. These observations can be attributed to the fact that more carbon is present in the WC-enriched samples due to the dissolution of the added WC-np in the molten steel during the laser process. As the additional dissolved carbon acts as a strong austenite former, the formation of austenite is ultimately favored at the expense of ferrite and martensite in the WC-np-enriched samples. A higher total carbon and tungsten content in the steel sample leads to a decrease in both the martensite transformation temperatures and the austenitization temperature. In combination, both effects cause a stabilization and higher concentrations of RA in the WC-np-enriched samples compared to the pure AISI H11 sample.
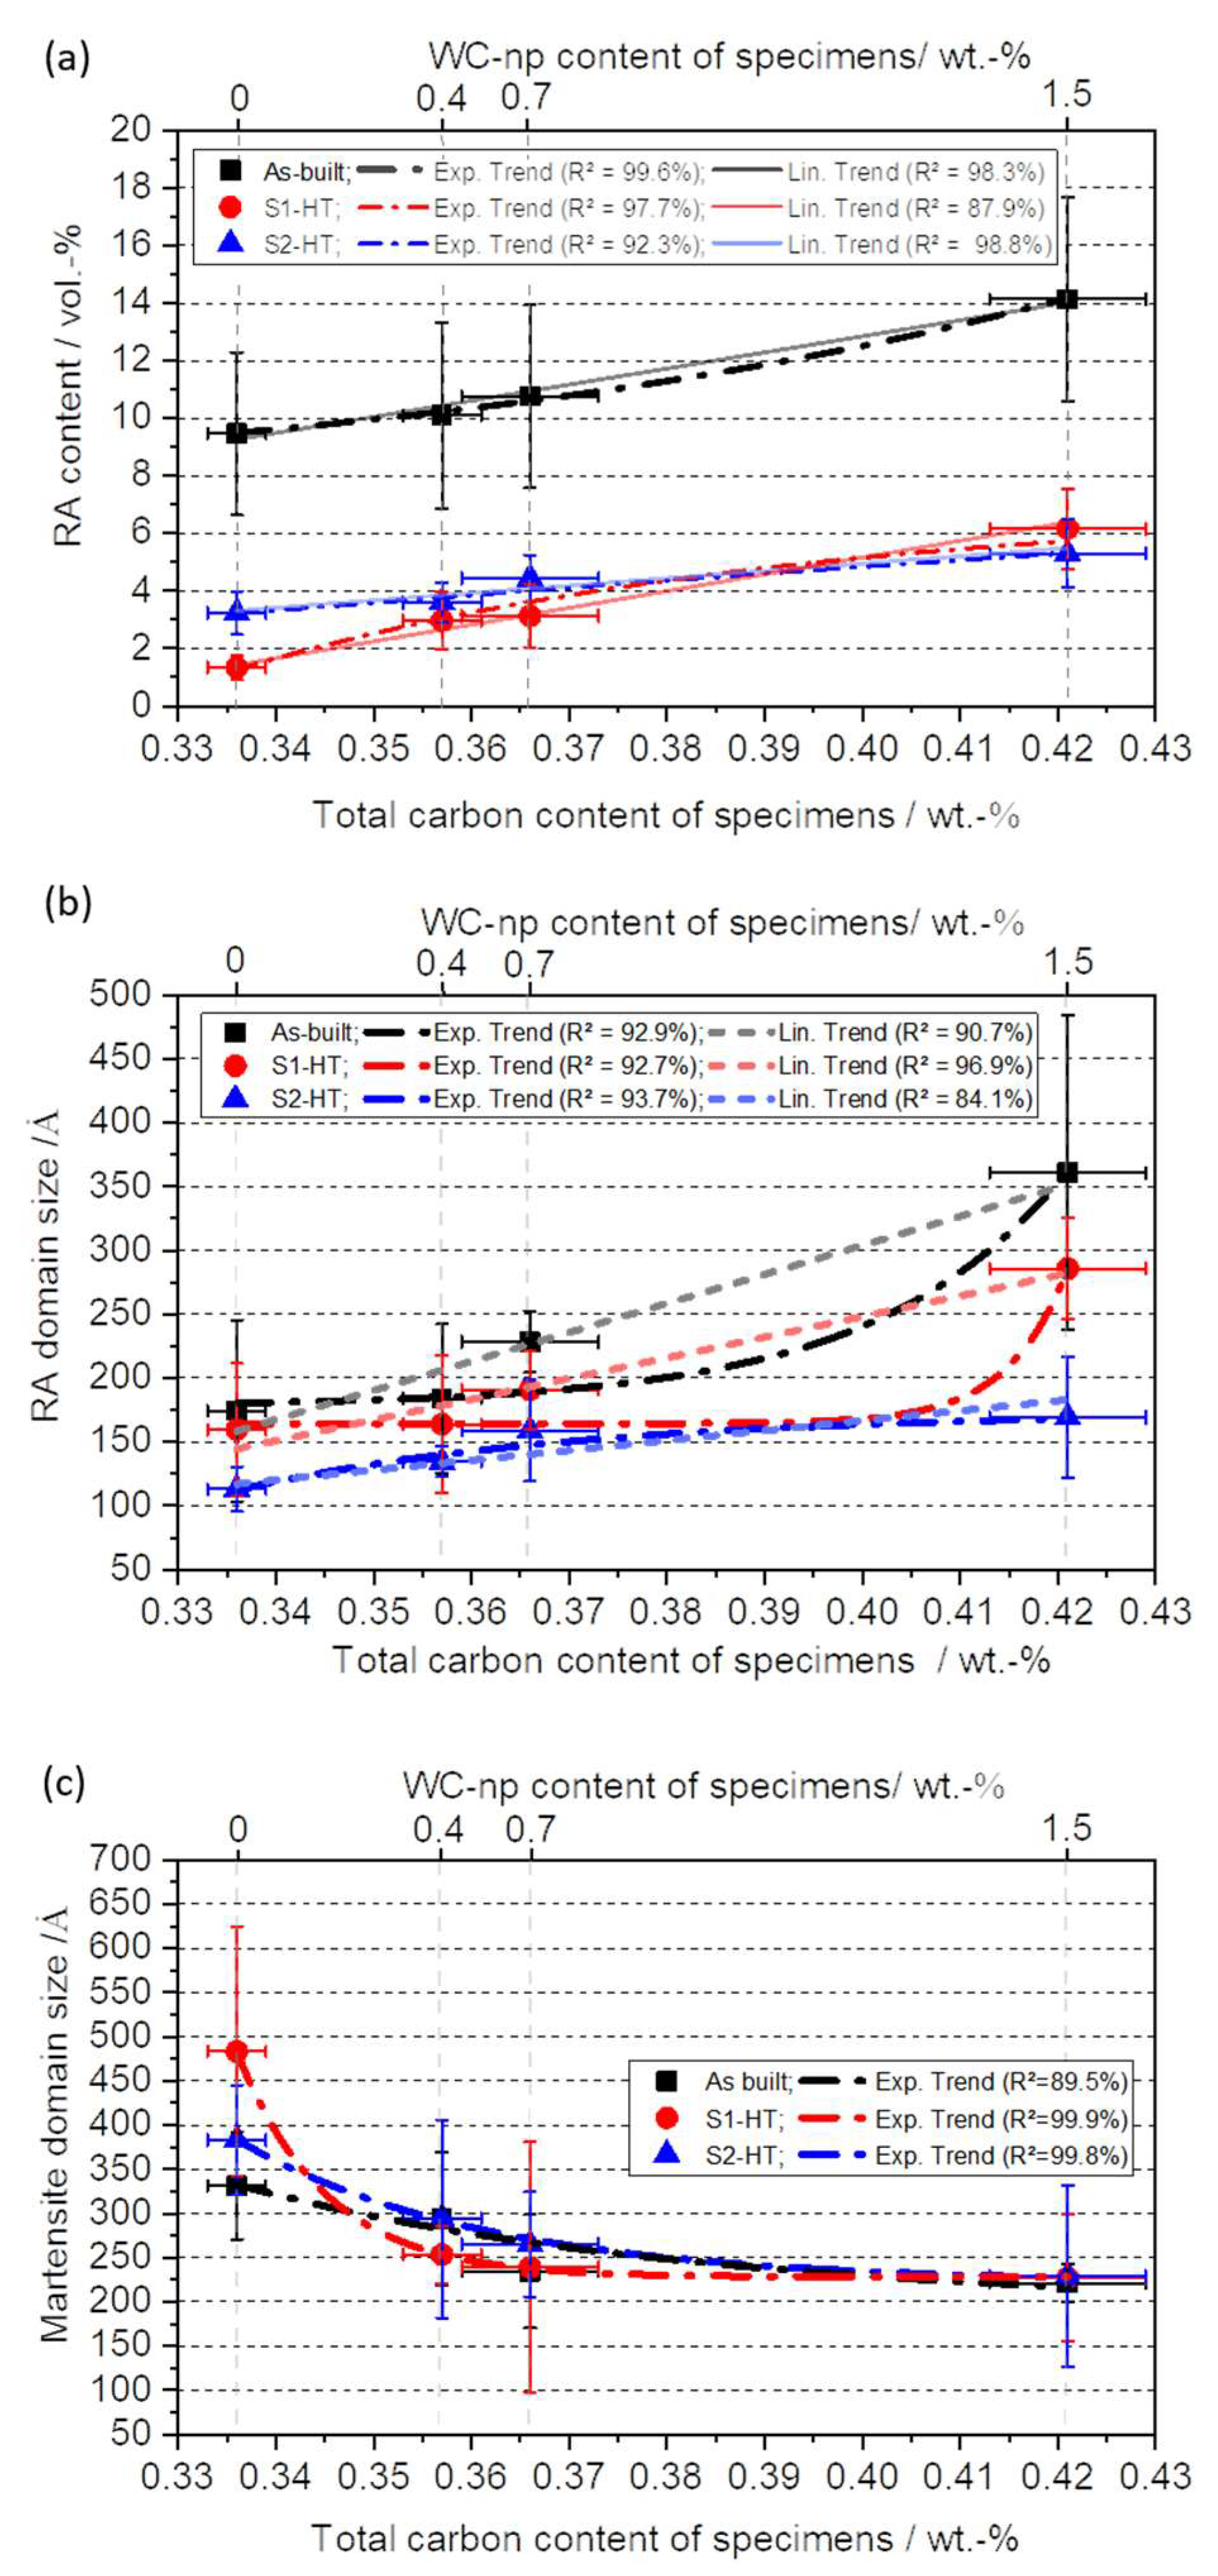
Figure 12a shows the mean values of the RA content for the as-built and heat-treated tool steel specimens with respect to the total carbon content (and estimated WC-np content) of specimens.
The mean value of the RA content of the as-built specimens increases from 9.5 ± 2.8 vol.-% for the pure AISI H11 specimen [44] to 10.1 ± 3.2 vol.-% for the specimen made from powder mixture No. 1 (1 wt.-% of WC-np). For the sample made from mixture No. 2 (2.5 wt.-% of WC-np), the value corresponds to 11 ± 3.5 vol.-% and to a maximum value of 14.1 ± 3.6 vol.-% for the sample made from mixture No. 3 with the maximum total carbon content or WC-np content, respectively. The increase in RA content as a function of total carbon content can be approximated with a linear or exponential trend.
The large standard deviations of the mean RA content, in the order of more than 20%, indicate a dependence of the RA content on sample height or measurement location. The local measurements of RA content shown in Table 6 confirm this assumption. For all samples, the minimum RA content was found for the lower area (bottom). As the height of the specimen increases, the RA content appears to decrease, reaching its minimum in the middle and upper part of the manufactured specimens. The dependence of RA content on the measurement location observed for all the samples studied can be attributed to the in-process heat treatment of the lower weld layers, including severe thermal cycling and multiple re-melting and re-austenitization of the deposited welds, especially at the beginning of the AM process.
Figure 12b,c show the mean values of the domain size of martensite and RA of analyzed tool steel samples as a function of the total carbon content in as-built conditions and after carrying out thermal post processing. The domain size of martensite appears to decrease as the amount of WC-np added to the host powder increases. For the unmodified AISI H11 specimen, the mean value of the domain size of martensite is 330 ± 61 Å [44] and decreases to a smaller mean value of 290 ± 75 Å for the specimen made with powder mixture No. 1 (+1 wt.-% of WC-np). For the specimen made with powder mixture No. 2 (+2.5 wt.-% of WC-np), the mean value of the martensite domain size reaches 234 ± 64 Å. Finally, the smallest value of 220 ± 21 Å is obtained for the specimen with the maximum WC-np content of 5 wt.-% (mixture No. 3). As follows from Figure 12c, the decrease in martensite domain size as a function of total carbon content can be fitted with a first-order exponential decrease.
Contrary to the crystallite size of martensite, the domain size of RA increases with an increasing amount of WC-np added to the AISI H11 host powder. The increase in RA domain size with respect to the total carbon content can be empirically estimated using a linear or exponential model function; see Figure 12b. For the unmodified AISI H11 sample, the mean value of the RA domain size is 175 ± 71 Å [44] and increases slightly to 184 ± 58 Å for the sample made from powder mixture No. 1 (+1 wt.-% of WC-np). As the amount of WC-np added increases, the domain size of RA continues to increase and reaches a mean value of 228 ± 24 Å for the sample manufactured using mixture No. 2 (+2.5 wt.-% of WC-np). The maximum domain size is found for the sample with the highest content of WC-np or total carbon content, respectively. This maximum value is 361 ± 100 Å.
The increase in austenite domain size is due to the increased carbon content resulting from the dissolution of the added WC-np in the melt pool during the ongoing laser process. This is accompanied by a corresponding increase in the volume fraction of retained austenite. Therefore, due to the higher RA content, the likelihood of blocky RA forming in the sample made from the WC-np-enriched powder blends also increases. In contrast, the smaller martensite domain size measurements indicate a finer martensite (ferrite) in the WC-np-enriched AISI H11 samples. Consequently, it can be concluded at this stage that the WC-np tend to favor the formation of finer martensite grains within the dendrites.
However, it is important to note that the domain size measured using XRD does not necessarily equate to the grain size of martensite in the traditional sense. Instead, the domain size refers to the area within a grain where the lattice planes are parallel to each other, resulting in reciprocal lattice vectors with the same orientation (Miller indices). Nonetheless, small domain size values can be a strong indication of the presence of finer grains, unless there is a dominant preferential direction of crystal orientation. To identify and quantify the influence of WC-np on grain size and confirm the results of the XRD studies, EBSD measurements were carried out on the unmodified AISI H11 specimen and the specimen produced with a maximum WC-np content of 5 wt.-% (mixture No. 3). The focus was on the specimens in the as-built condition.
Figure 13a,b show the phase fractions of RA (FCC) and martensite (BCC) and the inverse pole figures for both the specimen made from the pure AISI H11 powder and the one made from powder mixture No. 3 with the maximum WC-np content. The exemplary measurements shown were taken at the center position of both samples.
The AISI H11 sample was not modified. Its RA content was approximately 1.1 vol.-% [44]. However, the sample from mixture No. 3 (5 wt.-% of WC-np) had a significantly higher RA content of 4.3 vol.-%. Further EBSD measurements were conducted in the lower middle and upper regions of the tool steel samples, which confirmed this correlation. These results are in good agreement with the XRD results. The average RA content of the pure tool steel sample was measured to be between 1 and 2 vol.-% [44], while the RA values for the mixture No. 3 (5 wt.-% of WC-np) sample averaged between 4 and 5 vol.-%. The electron backscatter diffraction (EBSD) analysis also revealed a slight tendency for the RA content to vary depending on the location, with higher values in the bottom areas.
By comparing the inverse pole figures of the pure AISI H11 sample with those of the specimen manufactured using mixture No. 3, no preferred directions of crystallite orientation were observed. The crystallites in both samples have more or less the same spatial orientations (Miller indices). The XRD measurements also support this finding, as a clear preferred orientation of the crystallites could not be identified.
However, the WC-np have a tendency to influence the grain size. The specimen made from powder mixture No. 3 (maximum WC-np content) has a finer grain structure compared to the AISI H11 specimen, as shown in Figure 13. To quantify the martensite grain size, the EBSD data were further processed and evaluated. Figure 14a–d display the area-weighted fraction distribution of the cross-sectional martensite grains examined for the pure AISI H11 sample and the one made from mixture No. 3 (5 wt.-% of WC-np). The analysis was conducted for two different threshold angles (low-angle grain boundaries ≤ 10°; high-angle grain boundaries ≤ 15°).
The bar plots in Figure 14 show that adding WC-np to the AISI H11 powder promotes the formation of martensite grains with smaller cross-sections. This is indicated by higher values of the area-weighted fraction for small grain cross-sections, as found for both low angle (≤10°) and high angle (≤15°) grain boundaries. Table 7 summarizes the results of the EBSD grain size analysis, including the number of grains considered and the mean values of the martensite grain cross-sections. The EBSD measurements confirm the results of the XRD analysis, indicating that the added WC-np used to modify the initial AISI H11 hot work tool steel powder favor grain refinement, resulting in a finer martensitic or ferritic structure.
There are probably several overlapping reasons that explain the finer martensitic structure with increasing WC-np content. As discussed at the beginning of this section, due to the high solubility of WC in the molten steel, the majority of the introduced WC nanoparticles appear to initially dissolve partially or completely. This makes more carbon available for the precipitation of hardness- and strength-enhancing carbides during the cooling and solidification of the laser-induced melt pool. In particular, the high-melting special carbides VC and Mo2C of AISI H11 and WC-np, which are likely to be re-precipitated from the melt during solidification in small amounts, favor the formation of a finer microstructure by inhibiting the growth of primary austenite grains. Due to the process-specific high cooling rates, this effect could be further enhanced through the precipitation of very small WC particles of a few nanometers in size. However, to prove this, further investigations using Transmission Electron Microscopy (TEM) would be required.
In addition to the aforementioned reasons, it is probable that not all of the initially added WC-np will dissolve in the molten steel. Consequently, a few nanometer nuclei remain undissolved and are present in the melt. These particles act as additional crystallization nuclei, increasing the rate of crystallization and ultimately favoring the formation of finer martensite by counteracting the expansion of the primary austenite grains.

4.3. Influence of Heat Treatment on Microstructure

The microstructure of the investigated AISI H11 steel powder mixture appears to remain unchanged after S1-HT (one-time tempering at 580 °C for 2 h) when compared to the microstructure of the specimens in as-built conditions. The fine-grained dendritic microstructure showed no significant differences based on the analysis of chemically treated cross-sections of heat-treated specimens using SEM and OM (Figure 15). The dendrites retained their acicular martensitic or ferritic inner structure even after one-time tempering (S1-HT), as shown in Figure 15b–d.
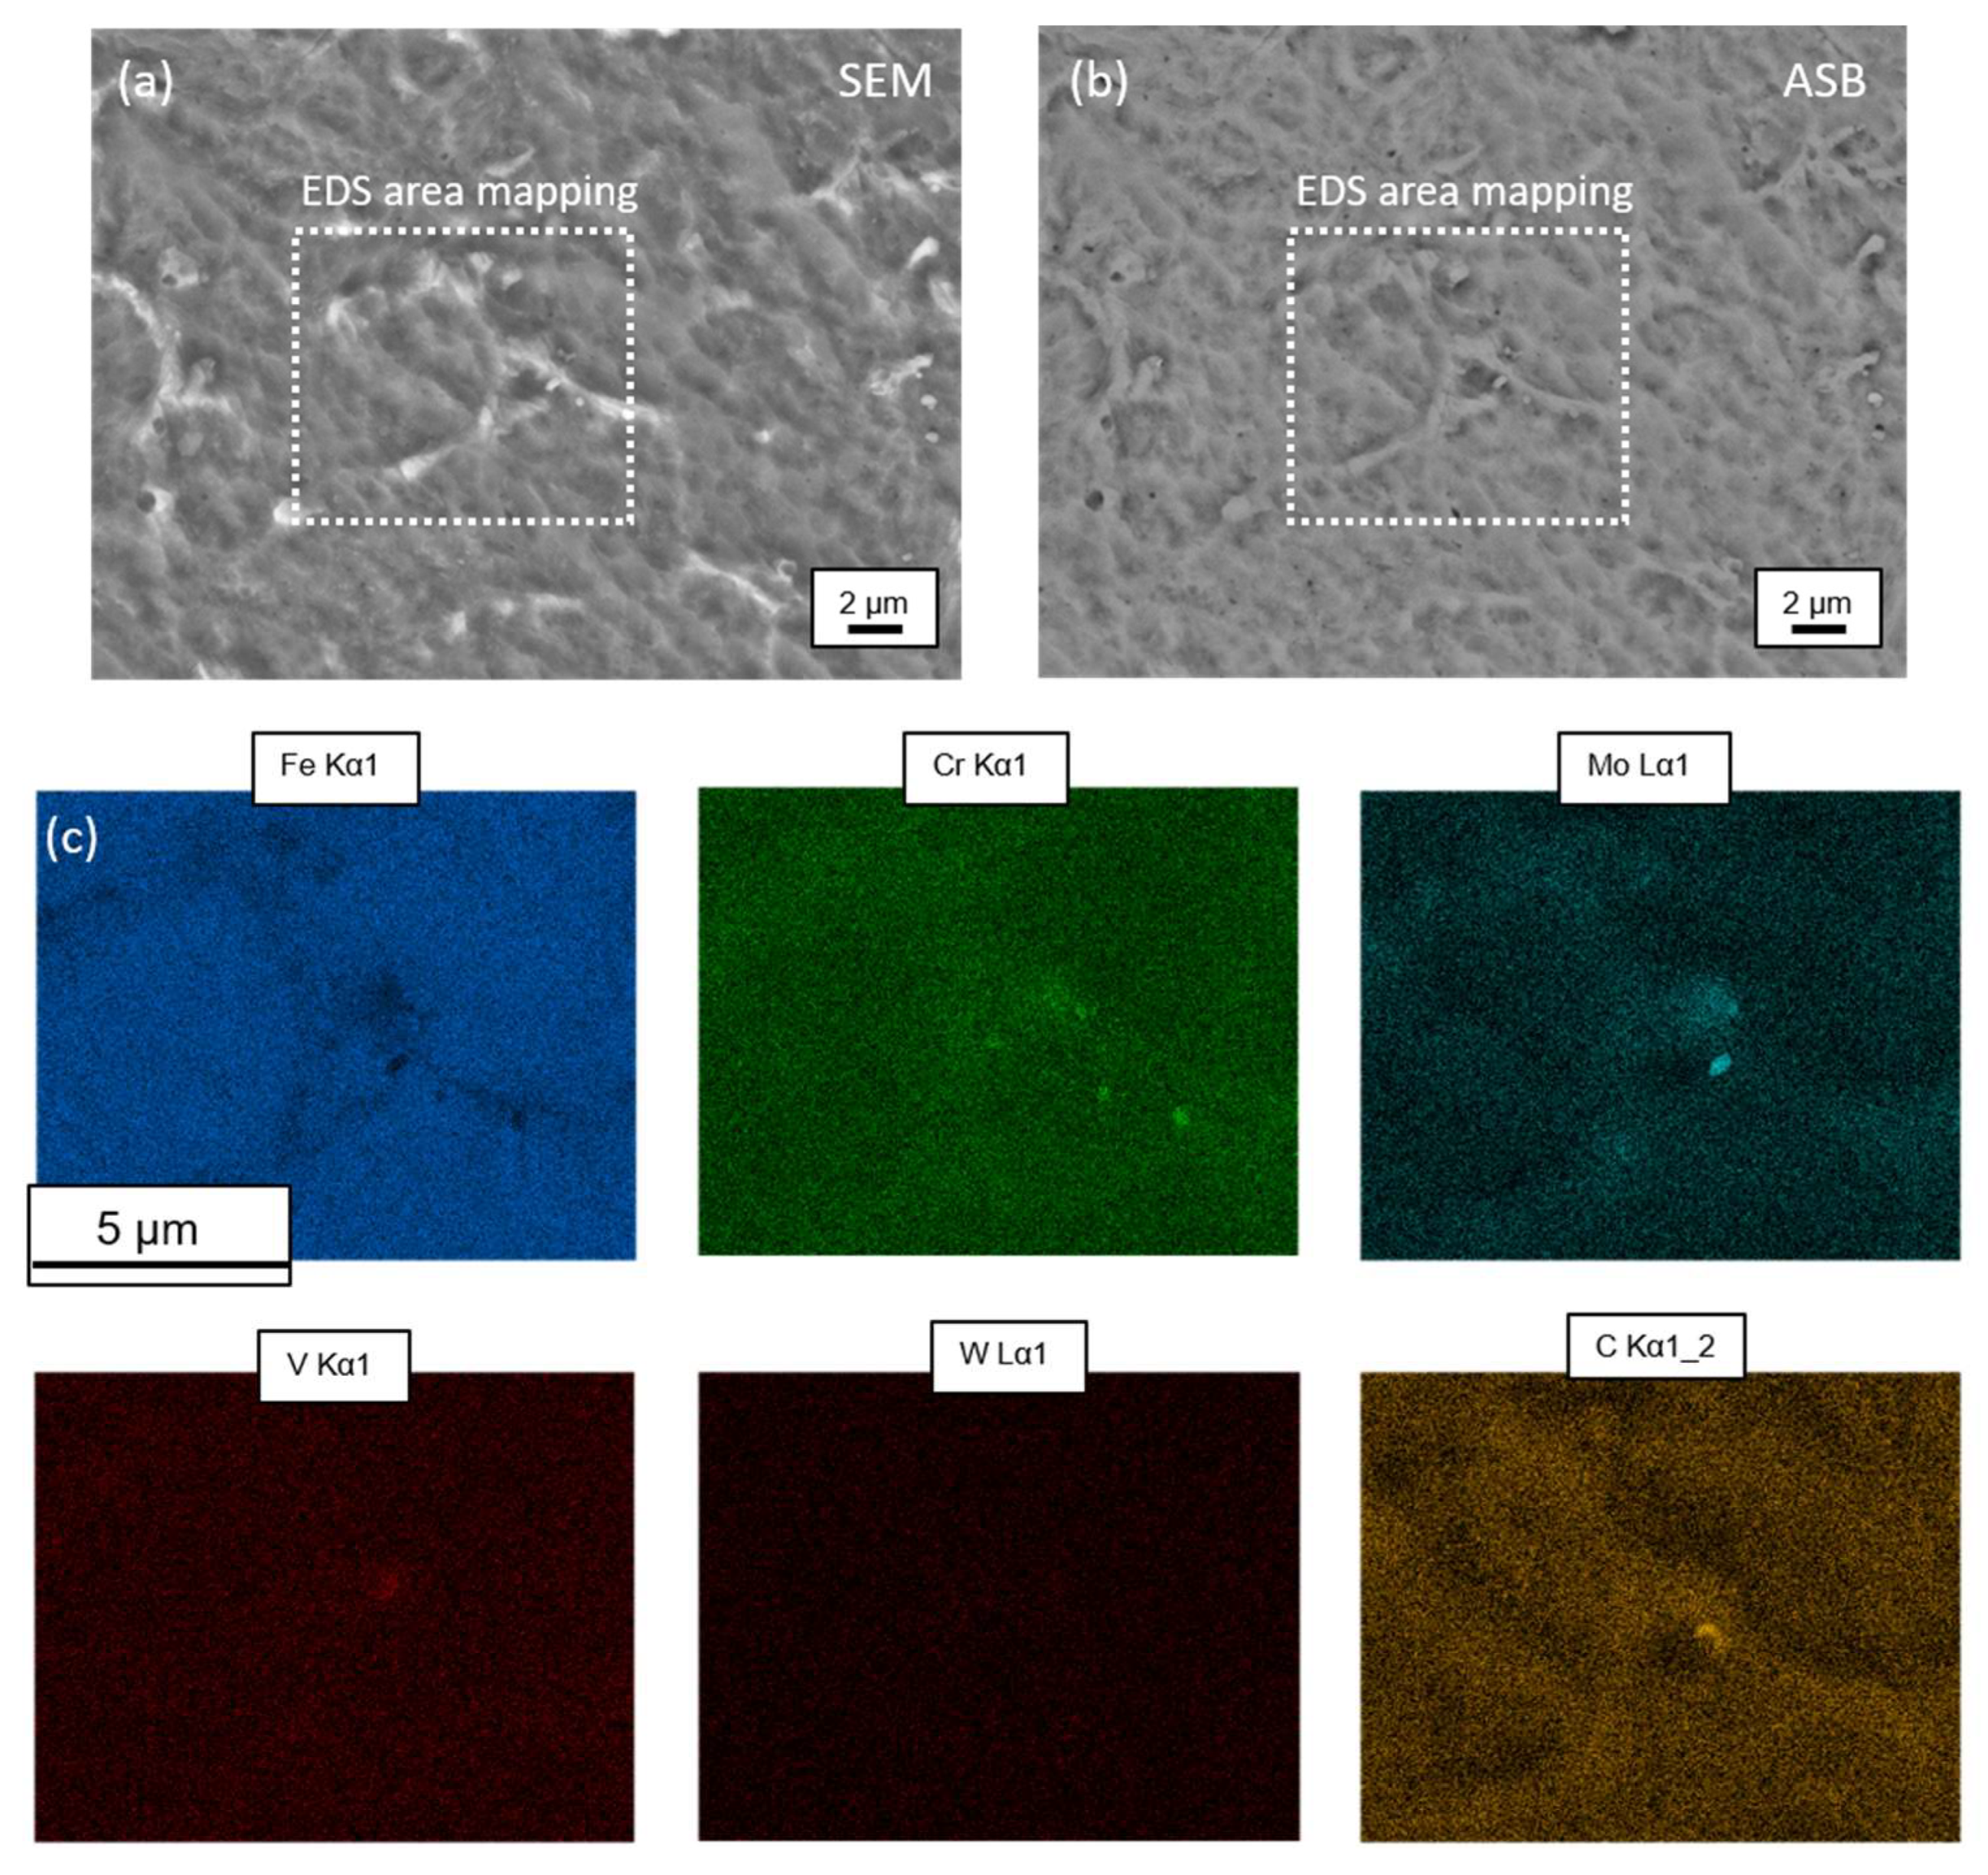
In addition, EDS area mappings (e.g., Figure A5) show that the main alloying elements, Cr, Mo, Mn and V, also tend to be concentrated in the interdendritic spaces, as is the case in the as-built specimens. In addition, the homogeneous distribution of tungsten within the dendrites does not seem to be affected by the implementation of S1-HT.
Nevertheless, the impact of the one-time tempering process (S1-HT) on the resulting microstructure is apparent in the RA content determined using XRD (refer to Table 6 and Figure 12a). There is a decrease in the RA content for all samples. The unmodified AISI H11 specimen was most affected by the one-time tempering, likely due to the parameters selected in accordance with the material specifications for AISI H11 [13].
For the pure AISI H11 specimen, the RA content is 1.3 ± 0.4 vol.-% on average and is reduced by a factor of 7.27 after S1-HT compared to the as-built specimen [44]. The specimen made from powder mixture No. 1 (1 wt.-% of WC-np) has a lower average RA content of 2.9 ± 1 vol.-% after heat treatment. This corresponds to a decrease of about 7 vol.-% compared to the as-built specimens. For the specimen made with powder mixture No. 2 (+2.5 wt.-% of WC-np), the RA content after S1-HT is 3.1 ± 1.1 vol.-%, which is a decrease of 7.5 vol.-% compared to the as-built material. The maximum RA content is found in the sample made from mixture No. 3, which contains the maximum WC-np content of 5 wt.-%. This value is 6.2 ± 1.4 vol.-%, which is a decrease of almost 8 vol.-% compared to the as-built sample.
The RA content of the WC-np-enriched tool steel specimens can be reduced by S1-HT using tempering parameters designed for the thermal treatment of unmodified AISI H11. S1-HT favors diffusion processes that, given sufficient time, result in the transformation of soft RA into a harder mixture of ferrite and cementite (iron carbide). This process leads to a reconfiguration and homogenization of the microstructure. It is important to note that by repeating the tempering process or optimizing the tempering parameters, while considering the exact chemical composition, it may be possible to further reduce the RA content in the specimens produced using the WC-np-enriched AISI H11 powder blends. From the unmodified AISI H11 to the specimens made out of mixture No. 3 with the maximum WC-np concentration, the trend in as-built samples and ones thermally post-processed using S1-HT seems to be the same: an increase in RA domain size with an increasing amount of WC-np or total carbon content, respectively (Figure 12).
However, the domain size of RA decreases for specimens of the same chemical composition after undergoing S1-HT. This decrease appears to be a direct consequence of S1-HT and the decomposition of RA due to its conversion into ferrite and cementite. The unmodified AISI H11 specimen has a domain size of RA that corresponds to a mean value of 159 ± 52 Å, which is only 15 Å smaller than that of the as-built specimen [44]. The average domain size of RA for the specimen made from powder mixture No. 1 (+1 wt.-%) decreased by about 20 Å compared to the non-heat-treated specimen, measuring 164 ± 53 Å. The specimen made from powder mixture No. 2 (2.5 wt.-% of WC-np) also showed a decrease of approximately 40 Å compared to the as-built samples, with a mean value of the RA domain size of 191 ± 30 Å. For the specimen with the highest WC-np content (powder mixture No. 3), the domain size of RA decreased from 361 ± 100 Å in as-built conditions to a mean value of 285 ± 40 Å after S1-HT treatment.
In contrast to the domain size of RA, the domain size of martensite is only marginally affected by S1-HT. The one-time tempering process (S1-HT) does not have a substantial effect on the domain size of martensite compared to the as-built specimens, as shown by the large standard deviations (Figure 12b). The values are approximately of the same order of magnitude; see Figure 12b. However, the relationship between the domain (crystallite) size of martensite and RA and the added WC-np content (total carbon content) is consistent with that of the as-built specimens.
After S2-HT, which consists of a hardening step followed by a single tempering step at 580 °C for 2 h, the microstructure of all specimens resembles a needle-like martensitic or ferritic microstructure, similar to that found in conventionally heat-treated AISI H11 steel. Figure 16a–d show the martensitic microstructure for both the unmodified AISI H11 sample and the sample made from the powder mixture with the maximum WC-np content of 5 wt.-% of WC-np (mixture No. 3). The EDS mapping in Figure A5 shows that the process-inherent dendritic microstructure and the dense carbide network, consisting mainly of Cr and Mo mixed carbides, have been completely dissolved. However, the VC, Mo2C and WC carbides appear to be present, as in the case of one-time tempered or as-built samples. During the austenitization step, the entire specimen is first converted to the high-temperature austenitic phase. Subsequently, the specimen is quenched in an oil bath below the martensite starting temperature (Ms), predominantly converting RA to martensite. The quenching process maintains constant thermal boundary conditions, resulting in similar cooling for all specimens. As a result, layer-dependent differences in microstructure almost disappear, and the microstructure homogenizes after a subsequent one-time tempering process.
As can be concluded from the XRD measurements shown in Figure 12a and Table 6, the RA content decreases significantly after thermal treatment with S2-HT compared to the specimens in the as-built condition. The RA content has average values that are in the order of magnitude of, or only slightly different from, the values obtained after S1-HT. For the specimen made with the pure AISI H11 powder, the mean value of the RA content is equal to 3.2 ± 0.7 vol.-% and increases to 3.6 ± 0.7 vol.-% for the specimen made with mixture No. 1 (1 wt.-% of WC-np). For the sample prepared with mixture No. 2 (2.5 wt.-% of WC-np), the RA content increases to an average of 4.4 ± 0.8 vol.-% and reaches its maximum value of 5.3 ± 1.2 vol.-% for the sample prepared with mixture No. 3, containing the maximum amount of WC-np. Consequently, the effect of the added WC-np on the resulting mean values of the RA content persists after the S2-HT carried out, as is the case for the as-built specimens or for the specimens post-processed using S1-HT.
The XRD measurements presented in Figure 12a and Table 6 indicate a significant decrease in RA content after thermal treatment with S2-HT compared to the as-built specimens. The average values of RA content are similar to or slightly lower than those obtained after S1-HT. The RA content mean value for the pure AISI H11 powder specimen is 3.2 ± 0.7 vol.-% [44]. The RA content increases to 3.6 ± 0.7 vol.-% for the specimen made with mixture No. 1 (1 wt.-% of WC-np). The RA content increases to an average of 4.4 ± 0.8 vol.-% for the sample prepared with mixture No. 2 (2.5 wt.-% of WC-np) and reaches its maximum value of 5.3 ± 1.2 vol.-% for the sample prepared with mixture No. 3, containing the maximum amount of WC-np. Consequently, the effect of the added WC-np on the resulting mean values of the RA content persists after the S2-HT is carried out. This is also observed in the as-built specimens or in the specimens post-processed using S1-HT.
Irrespective of the WC content in the tool steel specimen investigated, a significant reduction in the domain size of RA was observed for all heat-treated specimens compared to the as-built specimens. The values of the RA domain size vary on average between 110 Å and 170 Å in the different materials. The observed low values of the RA domain size can be attributed to the decomposition of RA into ferrite and cementite associated with the one-time tempering process carried out as the last sub-step in the S2-HT. The mean value of the domain size of RA corresponds to 113 ± 17 Å for the unmodified AISI H11 specimen and increases slightly to 134 ± 12 Å for the specimen made from mixture No. 1 (+1 wt.-% of WC-np). For the specimen made with mixture No. 2 (+2.5 wt.-% of WC-np), the value is 159 ± 17 Å and reaches its maximum of about 170 Å for the specimen made with mixture No. 3 (+5 wt.-% of WC-np). The effect of the added nanoscale WC additives on the RA content is still present in the same way as for the samples in as-built conditions and those heat-treated with S1-HT.
Contrary to the domain size of RA, the domain size of martensite decreased with an increasing amount of WC-np added to the AISI H11 powder. The martensite domain size has a mean value of 382 ± 61 Å for the pure AISI H11 sample and decreases to 293 ± 61 Å when only 1 wt.-% of WC-np is added to the AISI H11 powder. The martensite domain size for the sample made from mixture No. 2 (+2.5 wt.-% of WC-np) has a smaller mean value of 265 ± 59 Å. The minimum domain size of martensite was observed for the sample from mixture No. 3 with the maximum WC-np concentration of 5 wt.-%. This value corresponds to 225 Å.
Finally, at this stage, it can be concluded that the addition of the WC-np favors the formation of a finer martensitic or ferritic structure in the manufactured solids even after carrying out different post-heat treatment strategies close to industrial application.
Regardless of the WC content in the tool steel specimen investigated, all heat-treated specimens showed a significant reduction in the domain size of RA compared to the as-built specimens. The average values of the RA domain size varied between 110 Å and 170 Å in the different materials. The small size of the RA domain can be attributed to the decomposition of RA into ferrite and cementite during the one-time tempering process carried out as the last sub-step in the S2-HT. The average domain size of RA is 113 ± 17 Å [44] for the unmodified AISI H11 specimen and slightly increases to 134 ± 12 Å for the specimen made from mixture No. 1 (+1 wt.-% of WC-np). The domain size of the specimen made with mixture No. 2 (+2.5 wt.-% of WC-np) is 159 ± 17 Å, while it reaches a maximum of about 170 Å for the specimen made with mixture No. 3 (+5 wt.-% of WC-np). The effect of the added nanoscale WC additives on the RA content remains the same as for the samples in as-built conditions and those heat-treated with S1-HT.
The domain size of martensite decreased with an increasing amount of WC-np added to the AISI H11 powder, unlike the domain size of RA. The mean martensite domain size of the pure AISI H11 sample is 382 ± 61 Å [44]. When only 1 wt.-% of WC-np is added to the AISI H11 powder, the mean martensite domain size decreases to 293 ± 61 Å. The sample made from mixture No. 2 (+2.5 wt.-% of WC-np) has a smaller mean value of 265 ± 59 Å for the martensite domain size. The minimum domain size of martensite was observed for the sample from mixture No. 3, which had the maximum WC-np concentration of 5 wt.-%. This value corresponds to 225 Å.
Finally, it can be concluded that the addition of WC-np promotes the formation of a finer martensite or ferrite in the manufactured solids, even after undergoing various post-heat treatment strategies close to industrial application.

4.4. Impact of WC-np on Vickers Hardness

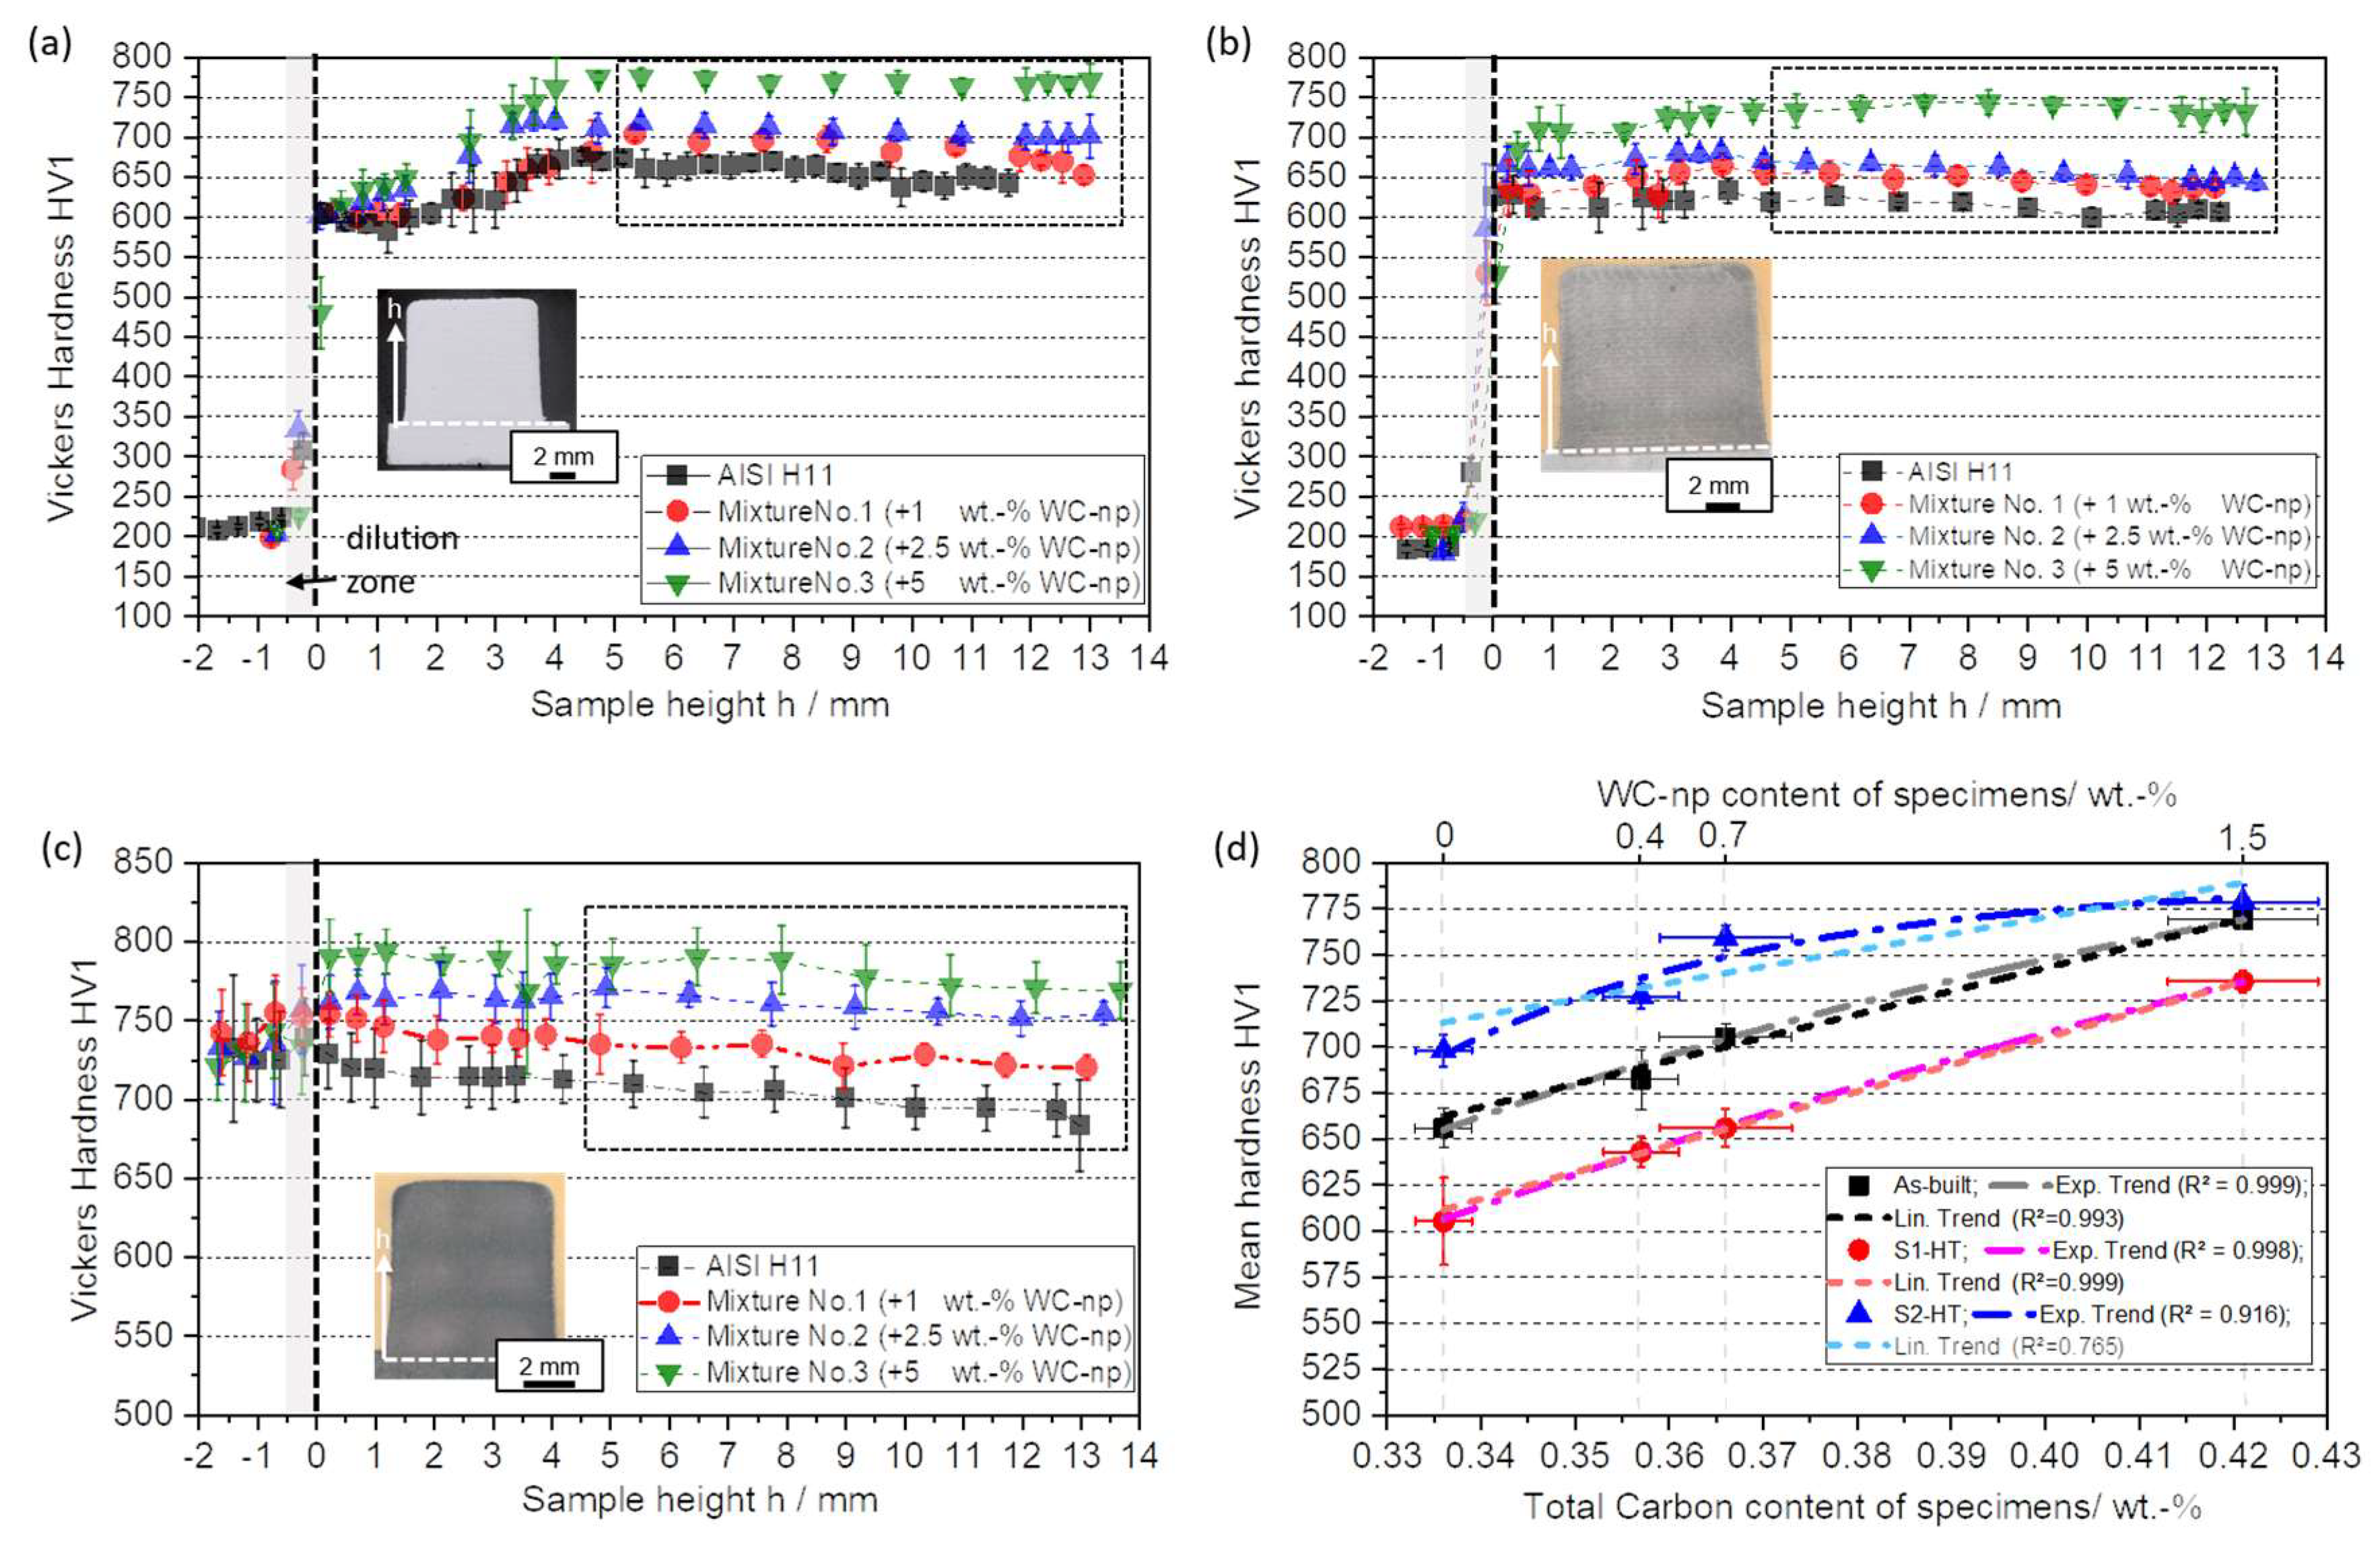
Figure 17a displays the Vickers hardness HV1 measurements plotted against sample height for all 30-layer specimens under as-built conditions. Regardless of the processed tool steel powder mixture, all builds exhibit a characteristic non-linear hardness profile. The lower area consistently exhibits the lowest hardness values. The hardness of the specimen increases as its height increases, resulting in a hardness gradient that reaches a constant maximum level in the middle and upper parts of the specimen (see Figure 17a). These characteristic hardness courses and gradients can be attributed to the in-process heat treatment of the lower layers due to strong thermal cycling during the ongoing layer-by-layer manufacturing process, as described in Section 4.2. The measured hardness profiles correlate well with the specimen height dependence of the RA content (Table 6), providing a plausible explanation for the low hardness in the lower region, the hardness gradient and the constant high hardness in the center and upper part of the manufactured AI-SI H11 specimens.
Comparing the hardness profiles and mean hardness of the manufactured specimens reveals a steady increase in hardness with higher amounts of WC-np used to modify the initial AISI H11 powder (Figure 17a,d). The unmodified AISI H11 specimen has an average hardness of approximately 653 ± 10 HV1 [44] in the middle and upper part of the specimen, while the addition of 1 wt.-% of WC-np increases the hardness to about 682 ± 16 HV1. As the content of WC-np increases, the average hardness also increases. For instance, the sample made from powder mixture No. 2 (2.5 wt.-% of WC-np) corresponds to 705 ± 7 HV1. The maximum hardness of 770 ± 4 HV1 is measured for the specimen made from powder mixture No. 3, which contains the highest concentration of WC-np or total carbon. The mean hardness increase can be estimated through a linear or exponential increase, depending on the total carbon content or WC-NP content of the produced specimens (refer to Figure 17d).
There are several overlapping reasons for the observed increase in hardness as a function of total carbon or WC-np content. First, the higher carbon content in the WC-np-enriched specimens, resulting from the dissolution of the initially added WC-np in the steel melt, promotes a greater distortion of the formed martensite. The induced change in martensite morphology results in an increase in local hardness and strength. In addition, the dissolution of the initially added WC-np may ultimately leave more carbon available for the precipitation of various hardness- and strength-enhancing carbides (e.g., special carbides WC, VC, Mo2C or alloy-specific Cr and Mo mixed carbides). Apart from this, another reason for the observed hardness increase is that the WC-np seem to favor grain refinement and thus the formation of a finer martensitic or ferritic structure within the dendrites.
Figure 17b shows the hardness profiles of 30-layer manufactured specimens as a function of specimen height after post-treatment with S1-HT. Irrespective of the tool steel specimen examined, the hardness gradient between the lower layers and the middle and upper parts of the specimen can be significantly reduced by carrying out S1-HT.
There is an increase in hardness in the lower part compared to the as-received specimens, which can be attributed to the transformation of (soft) RA into a (harder) mixture of ferrite and cementite. Conversely, taking into account the standard deviation, there is a slight decrease in hardness in the upper part compared to the as-built specimens. Finally, the local decomposition of RA caused by the diffusion process associated with the single heat treatment (S1-HT) homogenized the microstructure and more or less completely compensated for the layer-related hardness differences.
The hardness-increasing effect of the added WC-np is maintained even after S1-HT, and there is a clear correlation between the maximum hardness and the total carbon content or WC-np added to the AISI H11 powder. The increase in hardness as a function of carbon content or added WC-np can be well approximated with a linear or exponential trend.
The specimen produced using powder mixture No. 3, which contains the maximum concentration of WC-np or total carbon content, respectively, had a maximum hardness value of 735 ± 6 HV1. This value is slightly lower than the average hardness in the as-built condition (cf. Figure 17d), which is 605 ± 6 HV1 [44] for the pure AISI H11 sample after S1-HT. Therefore, the hardness value is approximately 130 HV1 higher than the average hardness of 605 ± 6 HV1 [44] for the pure AISI H11 sample after S1-HT. The mean hardness value in the middle and upper part of the specimen made with powder mixture No. 2 (2.5 wt.-% of WC-np) was determined to be 656 ± 10 HV1, which is a decrease of approximately 45 HV1 compared to the as-built specimen. Similarly, for the specimen made with powder mixture No. 1 (1 wt.-% of WC-np), the average hardness measured in the middle and upper part was 643 ± 8 HV1, which is a decrease of about 40 HV1 compared to the as-built condition.
Figure 17c displays the Vickers hardness profile based on sample height after thermal post-treatment using S2-HT, which involves a two-step hardening process followed by single tempering (580 °C, 2 h). Similar to the tempered specimens, the local hardness differences resulting from the in-process heat treatment were largely compensated for through the reconfiguration of the microstructure after S2-HT. As a result, the specimen height did not affect the observed level of hardness on the investigated tool steel sample. However, the effect of added WC-np on a hardness increase remained unchanged after S2-HT, as shown in Figure 17c,d.
The maximum hardness was measured for the specimen made with powder mixture No. 3 (+5 wt.-% of WC-np). It assumes an average value of 778 ± 9 HV1 in the middle and upper part of the specimen. This corresponds to an increase of approximately 80 HV1 compared to the unmodified AISI H11 specimen with a mean hardness of 698 ± 9 HV1. For the specimen made from powder mixture No. 2 (2.5 wt.-% of WC-np), the average hardness was determined to be 759 ± 7 HV1, an increase of approximately 60 HV1 compared to the AISI H11 specimen. The average hardness of the sample prepared from powder mixture No. 1 (1 wt.-% of WC-np) is 727 HV1 ± 6 HV1, which is almost 30 HV1 higher than the mean hardness of the pure AISI H11 sample; see Figure 17d.
The maximum hardness measured for the specimen made with powder mixture No. 3 (+5 wt.-% of WC-np) was 778 ± 9 HV1 in the middle and upper part of the specimen. This represents an increase of approximately 80 HV1 compared to the unmodified AISI H11 specimen, which had a mean hardness of 698 ± 9 HV1 [44]. The average hardness of the specimen made from powder mixture No. 2 (2.5 wt.-% of WC-np) was determined to be 759 ± 7 HV1, which is approximately 60 HV1 higher than that of the AISI H11 specimen. The average hardness of the sample prepared from powder mixture No. 1 (1 wt.-% of WC-np) is 727 HV1 ± 6 HV1, which is almost 30 HV1 higher than the mean hardness of the pure AISI H11 sample (see Figure 17d).

4.5. Impact of WC-np on Compression Properties

Regardless of the post-treatment performed, the compressive yield strength significantly increased with the addition of WC-np to the tool steel powder compared to the unmodified AISI H11 specimens. The yield strength increases approximately linearly with increasing total carbon content or WC-np content. Figure 18a shows that under as-built conditions, the Y0.2% increases from 1839 ± 61 MPa [44] for the AISI H11 specimen to 2013 ± 64 MPa for the specimen made with powder mixture No. 1 (+1 wt.-% of WC-np). The concentration of nanoscale WC additives directly correlates with the increase in Y0.2% of the manufactured specimens. For specimens made from powder mixture No. 2 (+ 2.5 wt.-% of WC-np), the average value of Y0.2% is 2046 ± 41 MPa. The specimens made from mixture No. 3 have a maximum mean value of Y0.2% of 2188 ± 26 MPa, which is an increase of almost 350 MPa compared to the pure AISI H11 specimens. This indicates a clear correlation between the maximum achievable yield strength and the concentration of WC-np in the as-built condition. The trend observed for hardness is similar (Section 4.4).
In contrast to the observed increase in Y0.2% and hardness, the addition of WC-np leads to a decrease in ductility. This is shown in Figure 18b, where a noticeable decrease in the maximal strain (ductility) is observed. The maximal strain decreases approximately linearly with increasing carbon content and is therefore inversely related to Y0.2%.
While the maximum strain for the unmodified AISI H11 specimens has a comparatively high mean value of 32 ± 1.3% [44], it decreases with increasing WC-np content to an average of 24 ± 0.3% for the specimens made from powder mixture No. 1 (+1 wt.-% of WC-np). For the specimens made with powder mixture No. 2 (+2.5 wt% of WC-np), the maximum strain was determined to be 22 ± 2.3%. The minimum mean value for the maximum strain of 12 ± 0.7% was determined for the specimen prepared using powder mixture No. 3, containing the maximum WC-np content.
After undergoing a one-time tempering process at 580 °C for 2 h (S1-HT), the microstructure is homogenized by transforming the soft RA into a harder mixture of ferrite and cementite, while simultaneously reducing internal stresses. As a result, the yield strength shows a slight increase. For the pure AISI H11 specimens, Y0.2% has a mean value of 1930 ± 25 MPa [44], which is an increase of approximately 90 MPa compared to the as-built specimens. The mean value of Y0.2% for specimens made with powder mixture No. 1 (1 wt.-%) is 1992 ± 12 MPa. For specimens made with powder mixture No. 2 (2.5 wt.-% of WC-np), it increases to 2068 ± 16 MPa. The maximum Y0.2% observed for specimens made with powder mixture No. 3, containing the maximum WC-np concentration, was also observed after S1-HT, similar to the specimen tested under as-built conditions. This value corresponds to 2251 ± 16 MPa. The Y0.2% increases approximately linearly depending on the total carbon content and remains unchanged.
Irrespective of the concentration of WC-np in the initial powder mixture, the one-time tempering process (S1-HT) significantly improved the ductility of all specimens; see Figure 19b. This is manifested in an increase in the maximum achievable strain compared to the specimens under as-built conditions. The improvement in ductility is likely to be related to a reduction in process-specific internal stress and the decomposition of RA caused by the reconfiguration of the microstructure during the tempering process. As expected, the maximum strain achieved for the unmodified AISI H11 specimens takes on an average value of 40 ± 2.6%, which is 8% higher than in the as-built condition. For the specimens made with powder mixture No. 1 (1 wt.-% of WC-np), a maximum strain of 38 ± 1.5% was determined on average. The maximum strain decreases to an average value of 35 ± 0.6% for the specimens made with powder mixture No. 2 (2.5 wt.-% of WC-np) and reaches its minimum value of 25 ± 3.9% for the specimens made with powder mixture No. 3 (+5 wt.-% of WC-np).
Regardless of the concentration of WC-np in the initial powder mixture, the one-time tempering process (S1-HT) significantly improved the ductility of all specimens, as shown in Figure 18b. This improvement is demonstrated by an increase in the maximum achievable strain compared to the specimens under as-built conditions. The increase in ductility is likely due to a reduction in process-specific internal stress and the decomposition of RA caused by the reconfiguration of the microstructure during the tempering process. The maximum strain achieved for the unmodified AISI H11 specimens is on average 40 ± 2.6% [44], which is 8% higher than in the as-built condition. The strain values for the specimens made with different powder mixtures are as follows: For powder mixture No. 1 (1 wt.-% of WC-np), the maximum strain was determined to be 38 ± 1.5% on average. For powder mixture No. 2 (2.5 wt.-% of WC-np), the maximum strain decreases to an average value of 35 ± 0.6%. Finally, for powder mixture No. 3 (+5 wt.-% of WC-np), the maximum strain reaches its minimum value of 25 ± 3.9%.
After thermal post processing of manufactured test specimens, applying S2-HT, the mean value of Y0.2% of the unmodified AISI H11 is equal to 1859 ± 13 MPa [44]. Considering the standard deviation, this value is close to the Y0.2% for the AISI H11 samples without additional heat treatment. As it is the case for all specimens under as-built conditions and tempered ones, Y0.2% enhances with an increasing content of WC-np even after carrying out S2-HT. For test specimens made out of powder mixture No. 1, Y0.2% takes on a mean value of 1945 ± 22 MPa and increases to 2041 ± 11 MPa for ones from powder mixture No. 2 (+2.5 wt.-% of WC-np). As in the case of the non-heat-treated and one-time-tempered specimens, the maximum Y0.2% was detected for test specimens from powder mixture No. 3 and it corresponds to 2097 ± 28 MPa.
As already proven for specimens in the tempered state, after carrying out S2-HT, the ductility of manufactured specimens improves due to induced microstructural changes compared to as-built specimens; see Figure 18b. The maximal strain for the unmodified AISI H11 samples corresponds to 38 ± 1.1% [44] on average and decreases to a mean value of 33.1 ± 1.1% for specimens made out of mixture No. 1 (+1 wt.-% of WC-np). For builds made from powder mixture 2 (+2.5 wt.-% of WC-np), the ductility continues to decrease and the maximum strain is on average only 33%. A minimum value of about 31% for the maximum strain occurs for specimens made from powder mixture 3 (+5 wt.-% of WC-np), i.e., the highest concentration, 5 wt.-% of WC-np, was added.
At this stage, it can be concluded that the tool steel specimens manufactured and post processed using heat treatments (S1-HT, S2-HT) close to industrial use exhibit high compression yield strength and at the same time improved ductility compared to the specimens under as-built conditions.
In order to determine the role of the WC-np in the forming behavior of the as-manufactured specimens, the strain–stress curves shown in Figure 19a–d were examined in detail, focusing on the plastic deformation region. Irrespective of the tool steel powder blend used, all specimens in the as-built condition show a steep increase in compressive stress during plastic deformation in the compression tests. This course of the strain–stress curves appears to be characteristic of additively manufactured tool steel specimens and is due to strain hardening effects that occur during forming. Others [21,33] who have examined the mechanical properties of tool steel specimens with similar chemical composition produced in DED-LB/M via compression testing have already reported comparable behavior. In particular, the conversion of soft RA to harder martensite due to deformation-induced phase transformation could be a major contributor to strain hardening. Therefore, the strain hardening effect tends to be much more pronounced in the as-built specimens made with the WC-np-enriched powder blends due to the higher RA contents; see also Figure 19a and Table 6.
When the specimens were thermally post-treated using the two strategies studied (S1-HT, S2-HT), the strain hardening effect was significantly weakened due to the decomposition of RA and the homogenization of the microstructure resulting from the heat treatment. As can be seen from the strain–stress curves presented in Figure 19a–d, this is manifested in particular through the reduction in the slopes in the plastic deformation range for tool steel specimens thermally post-treated with S1-HT and S2-HT.

5. Conclusions

In the present work, the processing of AISI H11 tool steel powder blends modified through the addition of WC-np in concentrations of 1, 2.5 and 5 wt.-% in DED-LB/M was investigated. The main results are summarized below:
  • Independently on the amount of added WC-np, nearly fully dense 30-layered specimens with a relative porosity equal to or smaller than 0.5% could be manufactured using a bidirectional deposition strategy and the same set of process parameters.
  • Due to the high cooling rates inherent in the process, all the 30-layer samples produced have an inhomogeneous, fine-grained dendritic microstructure (as-built conditions).
  • A fine needle-like structure was observed in the dendrites, presumably indicating the presence of martensite or ferritic phases with a smaller amount of retained austenite (RA) (as-built conditions).
  • The carbide formers Cr, Mo, Mn and V accumulate in the interdendritic space, indicating the precipitation of alloy-specific mixed and special carbides.
  • In contrast to Cr, Mo, Mn and V, tungsten (W) occurs much less frequently as segregated in the interdendritic space. Rather, tungsten (W) is homogeneously and finely distributed in the steel matrix in the solid solution. This indicates that the initially incorporated WC-np dissolved or melted during the ongoing laser process.
  • It seems that only a small amount of the W dissolved in the molten steel precipitates again as WC particles with a particle size between 300 nm and 1 µm at the grain or dendrite boundaries.
  • Due to the dissolution of the WC-np and associated with this the increased carbon and W content in the WC-np-enriched samples, the RA content increases compared to the unmodified AISI H11 sample.
  • As could be proven using the XRD and EBSD analysis, the WC-np promote grain refinement, leading to a finer martensitic or ferritic structure inside the dendrites in comparison to the unmodified AISI H11 specimen.
  • Due to the in-process heat treatment, in particular, the strong thermal cycling of the lower weld track layers during the AM process, all specimens show a characteristic hardness profile as a function of the sample height with lower hardness values in the bottom region and higher, constant hardness in the middle and top area.
  • Both hardness and compression yield strength significantly enhance with an increasing WC-np content added to the AISI H11 powder. For the specimen made out of powder mixture No. 3 (+5 wt.-% of WC-np), an increase in mean hardness from 650 ± 10 HV1 for the pure AISI H11 to 770 ± 4 HV1 was detected, an increase of about 120 HV1. The yield strength raised from 1839 MPa ± 61 MPa for the pure AISI H11 sample to 2188 MPa ± 26 MPa for the one manufactured from powder mixture No. 3 (+5 wt.-% of WC-np) under as-built conditions.
  • Ductility decreases with an increasing amount of WC-np added to the AISI H11 powder. This is reflected in the compression tests by a decrease in the maximum achievable strain (max. degree of deformation).
  • After carrying out S1-HT (580 °C, 2 h), the decomposition of RA into ferrite and cementite leads to a significant reduction in the RA content and associated with this a homogenization of microstructure. This also affects the hardness, leading to a compensation of the hardness differences along the specimen height.
  • After performing S2-HT, consisting of a hardening step followed by a single tempering (580 °C, 2 h), the microstructure strongly resembles classical martensitic steel after thermal post-processing using a traditional hardening process. A martensitic microstructure is detected independently on the investigated tool steel powder mixture.
  • Whilst the mean hardness and yield strength were only slightly affected by the heat treatments (S1-HT, S2-HT) carried out, the ductility of all specimens improved significantly compared to the as-built specimens.
  • After both heat treatments (S1-HT, S2-HT), the hardness and strength increasing effect caused by the modification of the AISI H11 powder with WC-np is still present in the same way as for as-built specimens.

Author Contributions

Conceptualization, O.H.; methodology, O.H.; investigation, O.H., J.K., J.V., A.W., P.K. and D.N.; writing—original draft preparation, O.H.; writing—review and editing, P.K. and D.N.; supervision, M.S.; project administration, O.H. All authors have read and agreed to the published version of the manuscript.

Funding

The work was performed with the kind support of the School of Advanced Optical Technology (SAOT) of the University Erlangen-Nürnberg. We acknowledge financial support by Deutsche Forschungsgemeinschaft and Friedrich-Alexander-Universität Erlangen-Nürnberg within the funding program “Open Access Publication Funding”.

Data Availability Statement

The raw data supporting the conclusions of this article will be made available by the authors on request.

Conflicts of Interest

The authors declare no conflicts of interest.

Appendix A

Figure A1. Experimentally determined powder mass flow plotted as function of the rpm.
Metals 14 00188 g0a1
Figure A2. (a) EDS mapping (b) and EDS line scan of a specimen made out of mixture No. 3 (+5 wt.-% of WC-np) in as-built conditions (measuring position: middle; measuring distance s for EDS line scan).
Metals 14 00188 g0a2
Figure A3. (a) SEM image, (b) ASB image and (c) elemental EDS area scans for the sample made out of mixture No. 3 (+ 5 wt.-% of WC-np) in as-built conditions (measuring position: top).
Metals 14 00188 g0a3
Figure A4. (a) SEM image and (b) elemental EDS area mappings of a specimen made from mixture No. 1 (1 wt.-% of WC-np) in as-built conditions.
Metals 14 00188 g0a4
Figure A5. Elemental EDS area mappings of a sample manufactured using mixture No. 3 (5 wt.-% of WC-np) after carrying out S1-HT at different measuring positions: top layer (above), 1st layer (below).
Metals 14 00188 g0a5
Figure A6. (a) SEM image, (b) ASB image and (c) elemental EDS area mappings of a sample manufactured using mixture No. 2 (2.5 wt.-% of WC-np) after carrying out S1-HT (measuring position: middle part).
Metals 14 00188 g0a6
Figure A7. (a) SEM-image and (be) Elemental EDS mapping of specimen made out of mixture No. 3 after carrying out S2-HT (measuring position: middle part).
Metals 14 00188 g0a7

Appendix B

Table A1. Martensite, Retained austenite and ferrite peaks considered in the reconstruction/fitting of the experimentally determined XRD spectra using the Rietveld approach (adapted from Ref. [44]).
Martensite (bcc)
No.hklm2θ (°)
1011844.43
2110444.67
3002264.26
4020465.03
5112881.64
62111682.17
7022898.26
8220498.96
90138114.67
100318116.21
Retained Austenite (fcc)
No.hklm2θ (°)
1111843.4
2002650.54
30221274.28
43112490.14
5222895.37
Ferrite (bcc)
No.hklm2θ (°)
10111244.53
2002664.81
32112482.04
40221298.56
503124115.85

References

  1. Ahn, D.G. Directed Energy Deposition (DED) Process: State of the Art. Int. J. Precis. Eng. Manuf. Green Technol. 2021, 8, 703–742. [Google Scholar] [CrossRef]
  2. Saboori, A.; Aversa, A.; Marchese, G.; Biamino, S.; Lombardi, M.; Fino, P. Application of Directed Energy Deposition-Based Additive Manufacturing in Repair. Appl. Sci. 2019, 9, 3316. [Google Scholar] [CrossRef]
  3. Asnafi, N. Tool and Die Making, Surface Treatment, and Repair by Laser-Based Additive Processes. BHM Berg.-Und. Hüttenmännische Monatshefte 2021, 166, 225–236. [Google Scholar] [CrossRef]
  4. Sinha, A.; Swain, B.; Behera, A.; Mallick, P.; Samal, S.K.; Vishwanatha, H.M.; Behera, A. A Review on the Processing of Aero-Turbine Blade Using 3D Print Techniques. J. Manuf. Mater. Process. 2022, 6, 16. [Google Scholar] [CrossRef]
  5. Rittinghaus, S.K.; Schmelzer, J.; Rackel, M.W.; Hemes, S.; Vogelpoth, A.; Hecht, U.; Weisheit, A. Direct Energy Deposition of TiAl for Hybrid Manufacturing and Repair of Turbine Blades. Materials 2020, 13, 4392. [Google Scholar] [CrossRef] [PubMed]
  6. Tarancón, A.; Esposito, V. 3D Printing for Energy Applications; Wiley: Hoboken, NJ, USA, 2021. [Google Scholar] [CrossRef]
  7. Lu, K.; Zhu, J.; Guo, D.; Yang, M.; Sun, H.; Wang, Z.; Hui, X.; Wu, Y. Microstructures, Corrosion Resistance and Wear Resistance of High-Entropy Alloys Coatings with Various Compositions Prepared by Laser Cladding: A Review. Coatings 2022, 12, 1023. [Google Scholar] [CrossRef]
  8. Razumov, N.; Masaylo, D.; Kovalev, M.; Volokitina, E.; Mazeeva, A.; Popovich, A. Structure and Wear Resistance of Composite TiC-NiMo Coating Produced by L-DED on Ti-6Al-4V Substrate. Metals 2023, 13, 1925. [Google Scholar] [CrossRef]
  9. Cao, J.; Brinksmeier, E.; Fu, M.; Gao, R.X.; Liang, B.; Merklein, M.; Schmidt, M.; Yanagimoto, J. Manufacturing of Advanced Smart Tooling for Metal Forming. CIRP Ann. 2019, 68, 605–628. [Google Scholar] [CrossRef]
  10. Alam, M.K.; Edrisy, A.; Urbanic, J.; Pineault, J. Microhardness and Stress Analysis of Laser-Cladded AISI 420 Martensitic Stainless Steel. J. Mater. Eng. Perform. 2017, 26, 1076–1084. [Google Scholar] [CrossRef]
  11. Smith, T.R.; Sugar, J.D.; San Marchi, C.; Schoenung, J.M. Microstructural Development in DED Stainless Steels: Applying Welding Models to Elucidate the Impact of Processing and Alloy Composition. J. Mater. Sci. 2021, 56, 762–780. [Google Scholar] [CrossRef]
  12. Kim, J.S.; Kang, B.J.; Lee, S.W. An Experimental Study on Microstructural Characteristics and Mechanical Properties of Stainless-Steel 316L Parts Using Directed Energy Deposition (DED) Process. J. Mech. Sci. Technol. 2019, 33, 5731–5737. [Google Scholar] [CrossRef]
  13. Kürnsteiner, P.; Wilms, M.B.; Weisheit, A.; Barriobero-Vila, P.; Jägle, E.A.; Raabe, D. Massive Nanoprecipitation in an Fe-19Ni-XAl Maraging Steel Triggered by the Intrinsic Heat Treatment during Laser Metal Deposition. Acta Mater. 2017, 129, 52–60. [Google Scholar] [CrossRef]
  14. Jägle, E.; Sheng, Z.; Kürnsteiner, P.; Ocylok, S.; Weisheit, A.; Raabe, D. Comparison of Maraging Steel Micro- and Nanostructure Produced Conventionally and by Laser Additive Manufacturing. Materials 2016, 10, 8. [Google Scholar] [CrossRef] [PubMed]
  15. Gnaase, S.; Niggemeyer, D.; Lehnert, D.; Bödger, C.; Tröster, T. Comparative Study of the Influence of Heat Treatment and Additive Manufacturing Process (LMD & L-PBF) on the Mechanical Properties of Specimens Manufactured from 1.2709. Crystals 2023, 13, 157. [Google Scholar] [CrossRef]
  16. Aleksandr, K.; Ferdinando, S.; Joel, R.; Joel, C.; Jordan, M.; Thomas, J. Effect of Direct Energy Deposition Parameters on Morphology, Residual Stresses, Density, and Microstructure of 1.2709 Maraging Steel. Int. J. Adv. Manuf. Technol. 2021, 117, 1287–1301. [Google Scholar] [CrossRef]
  17. Bohlen, A.; Freiße, H.; Hunkel, M.; Vollertsen, F. Additive Manufacturing of Tool Steel by Laser Metal Deposition. Procedia CIRP 2018, 74, 192–195. [Google Scholar] [CrossRef]
  18. Telasang, G.; Dutta Majumdar, J.; Padmanabham, G.; Tak, M.; Manna, I. Effect of Laser Parameters on Microstructure and Hardness of Laser Clad and Tempered AISI H13 Tool Steel. Surf. Coat. Technol. 2014, 258, 1108–1118. [Google Scholar] [CrossRef]
  19. Park, J.S.; Park, J.H.; Lee, M.G.; Sung, J.H.; Cha, K.J.; Kim, D.H. Effect of Energy Input on the Characteristic of AISI H13 and D2 Tool Steels Deposited by a Directed Energy Deposition Process. Metall. Mater. Trans. A Phys. Metall. Mater. Sci. 2016, 47, 2529–2535. [Google Scholar] [CrossRef]
  20. Ostolaza, M.; Arrizubieta, J.I.; Lamikiz, A.; Cortina, M. Functionally Graded AISI 316L and AISI H13 Manufactured by L-DED for Die and Mould Applications. Appl. Sci. 2021, 11, 771. [Google Scholar] [CrossRef]
  21. Junker, D.; Hentschel, O.; Schmidt, M.; Merklein, M. Investigation of Heat Treatment Strategies for Additively-Manufactured Tools of X37CrMoV5-1. Metals 2018, 8, 854. [Google Scholar] [CrossRef]
  22. Wegst, M.; Wegst, C. Stahlschlüssel—Key to Steel 2016: Nachschlagewerk; Stahlschlüssel-Verlag Marbach: Marbach am Neckar, Germany, 2016. [Google Scholar]
  23. Boes, J.; Röttger, A.; Mutke, C.; Escher, C.; Weber, S. Microstructure and Properties of a Novel Carbon-Martensitic Hot Work Tool Steel Processed by Laser Additive Manufacturing without Preheating. Steel Res. Int. 2023, 94, 2200439. [Google Scholar] [CrossRef]
  24. Borkovcová, K.; Novák, P.; Merghem, N.; Tsepeleva, A.; Salvetr, P.; Brázda, M.; Rajnovic, D. Processing of Niobium-Alloyed High-Carbon Tool Steel via Additive Manufacturing and Modern Powder Metallurgy. Materials 2023, 16, 4760. [Google Scholar] [CrossRef]
  25. Junker, D. FAU University Press ein Imprint der Universität Erlangen-Nürnberg Universitätsbibliothek. In Qualifizierung Laser-Additiv Gefertigter Komponenten Für Den Einsatz im Werkzeugbau Der Massivumformung; FAU University Press: Boca Raton, FL, USA, 2021. [Google Scholar]
  26. Park, Y.K.; Ha, K.; Shin, K.Y.; Lee, K.Y.; Kim, D.J.; Kwon, S.H.; Lee, W. Wear Resistance of Direct-Energy–Deposited AISI M2 Tool Steel with and without Post-Heat Treatment. Int. J. Adv. Manuf. Technol. 2021, 116, 3917–3931. [Google Scholar] [CrossRef]
  27. Baek, G.Y.; Shin, G.Y.; Lee, K.Y.; Shim, D.S. Effect of Post-Heat Treatment on the AISI M4 Layer Deposited by Directed Energy Deposition. Metals 2020, 10, 703. [Google Scholar] [CrossRef]
  28. Ha, K.; Moon, Y.H.; Kim, T.H.; Baek, G.Y.; Lee, K.Y.; Shim, D.-s.; Lee, W. Phenomenological Modeling of Distortions and Residual Stresses in Direct Energy Deposition of AISI M4 High Speed Tool Steel on D2 Substrate. Met. Mater. Int. 2023, 29, 1399–1420. [Google Scholar] [CrossRef]
  29. Lalegani Dezaki, M.; Serjouei, A.; Zolfagharian, A.; Fotouhi, M.; Moradi, M.; Ariffin, M.K.A.; Bodaghi, M. A Review on Additive/Subtractive Hybrid Manufacturing of Directed Energy Deposition (DED) Process. Adv. Powder Mater. 2022, 1, 100054. [Google Scholar] [CrossRef]
  30. Traxel, K.D.; Bandyopadhyay, A. First Demonstration of Additive Manufacturing of Cutting Tools Using Directed Energy Deposition System: StelliteTM-Based Cutting Tools. Addit. Manuf. 2019, 25, 460–468. [Google Scholar] [CrossRef]
  31. Junker, D.; Hentschel, O.; Schramme, R.; Schmidt, M.J.J.; Merklein, M. Performance of hot forging tools built by laser metal deposition of hot work tool steel X37CrMoV5-1. In Proceedings of the Laser in Manufacturing Conference; 2017. Available online: https://www.wlt.de/lim/Proceedings2017/Data/PDF/Contribution119_final.pdf (accessed on 13 December 2023).
  32. Sörn Ocylok. Herstellung Und Eigenschaften Nanopartikulär Verstärkter Beschichtungen Durch Laserauftragschweißen Zum Verschleißschutz von Schmiedegesenkene, RWTH Aachen. Available online: https://publications.rwth-aachen.de/record/573622/files/573622.pdf (accessed on 13 December 2023).
  33. Hentschel, O.; Siegel, L.; Scheitler, C.; Huber, F.; Junker, D.; Gorunow, A.; Schmidt, M. Processing of AISI H11 Tool Steel Powder Modified with Carbon Black Nanoparticles for the Additive Manufacturing of Forging Tools with Tailored Mechanical Properties by Means of Laser Metal Deposition (LMD). Metals 2018, 8, 659. [Google Scholar] [CrossRef]
  34. Gu, D. Laser Additive Manufacturing of High-Performance Materials; Springer: New York, NY, USA, 2015. [Google Scholar]
  35. Gu, D.; Wang, H.; Chang, F.; Dai, D.; Yuan, P.; Hagedorn, Y.C.; Meiners, W. Selective Laser Melting Additive Manufacturing of TiC/AlSi10Mg Bulk-Form Nanocomposites with Tailored Microstructures and Properties. Phys. Procedia 2014, 56, 108–116. [Google Scholar] [CrossRef]
  36. Martin, J.H.; Yahata, B.D.; Hundley, J.M.; Mayer, J.A.; Schaedler, T.A.; Pollock, T.M. 3D Printing of High-Strength Aluminium Alloys. Nature 2017, 549, 365–369. [Google Scholar] [CrossRef]
  37. Bartels, D.; Novotny, T.; Hentschel, O.; Huber, F.; Mys, R.; Merklein, C.; Schmidt, M. In Situ Modification of Case-Hardening Steel 16MnCr5 by C and WC Addition by Means of Powder Bed Fusion with Laser Beam of Metals (PBF-LB/M). Int. J. Adv. Manuf. Technol. 2022, 120, 1729–1745. [Google Scholar] [CrossRef]
  38. Gu, D.; Cao, S.; Lin, K. Laser Metal Deposition Additive Manufacturing of TiC Reinforced Inconel 625 Composites: Influence of the Additive TiC Particle and Its Starting Size. J. Manuf. Sci. Eng. Trans. ASME 2017, 139, 041014. [Google Scholar] [CrossRef]
  39. Lv, W.J.; Yang, X.S.; Ji, Y.Q.; Zhou, Y.Z.; Li, J.F.; Liu, X.; Wang, D.; Wang, Y.; Le, G.M.; Zhao, S.X. Effects of TiC Nanoparticle Additions on Microstructure and Mechanical Properties of FeCrAl Alloys Prepared by Directed Energy Deposition. J. Nucl. Mater. 2021, 554, 153094. [Google Scholar] [CrossRef]
  40. Zheng, G.; Rey, P.; Laqua, R.; Salgueiro, M.; Jakumeit, J. Modelling and Validation of Laser Based DED Processes Reinforced with Nanoparticles in View of the Effect of Wetting. IOP Conf. Ser. Mater. Sci. Eng. 2023, 1281, 012004. [Google Scholar] [CrossRef]
  41. Bartels, D.; Rohdenburg, J.; Mohr, A.; Rothfelder, R.; Schmidt, M. Laser Metal Deposition of Carbide-Reinforced Low-Alloyed Steel Bainidur AM. Procedia CIRP 2022, 111, 237–240. [Google Scholar] [CrossRef]
  42. Doñate-Buendia, C.; Kürnsteiner, P.; Stern, F.; Wilms, M.B.; Streubel, R.; Kusoglu, I.M.; Tenkamp, J.; Bruder, E.; Pirch, N.; Barcikowski, S.; et al. Microstructure Formation and Mechanical Properties of ODS Steels Built by Laser Additive Manufacturing of Nanoparticle Coated Iron-Chromium Powders. Acta Mater. 2021, 206, 116566. [Google Scholar] [CrossRef]
  43. Chao, Q.; Mateti, S.; Annasamy, M.; Imran, M.; Joseph, J.; Cai, Q.; Li, L.H.; Cizek, P.; Hodgson, P.D.; Chen, Y.; et al. Nanoparticle-Mediated Ultra Grain Refinement and Reinforcement in Additively Manufactured Titanium Alloys. Addit. Manuf. 2021, 46, 102173. [Google Scholar] [CrossRef]
  44. Hentschel, O.; Kohlstruck, J.; Krakhmalev, P.; Nikas, D.; Schmidt, M. Processing of Carbon Nanoparticle-Enriched AISI H11 Tool Steel Powder Mixtures in DED-LB/M for the AM of Forging Tools with Tailored Properties (Part II): Influence of Nanoscale Carbon Additives on Microstructure and Mechanical Properties. Alloys 2023, 2, 288–320. [Google Scholar] [CrossRef]
  45. Hentschel, O.; Krakhmalev, P.; Fredriksson, G.; Olsèn, J.; Selte, A.; Schmidt, M. Influence of the In-Situ Heat Treatment during Manufacturing on the Microstructure and Properties of DED-LB/M Manufactured Maraging Tool Steel. J. Mater. Process. Technol. 2023, 315, 117928. [Google Scholar] [CrossRef]
  46. Thompson, P.; Cox, E.; Hastings, J.B. Rietveld Refinement of Debye-Scherrer Synchrotron X-Ray Data from A1203. J. Appl. Cryst. 1987, 20, 79–80. [Google Scholar] [CrossRef]
  47. Niu, L.; Hojamberdiev, M.; Xu, Y. Preparation of in Situ-Formed WC/Fe Composite on Gray Cast Iron Substrate by a Centrifugal Casting Process. J. Mater. Process. Technol. 2010, 210, 1986–1990. [Google Scholar] [CrossRef]
  48. Jarvinen, M. Application of Symmetrized Harmonics Expansion to Correction of the Preferred Orientation Effect. J. Appl. Crystallogr. 1993, 26 Pt 4, 525–531. [Google Scholar] [CrossRef]
Figure 1. SEM images of (a,b) AISI H11 tool steel powder and of (c,d) agglomerations of the WC nanoparticles at different magnifications.
Metals 14 00188 g001
Figure 2. SEM images of the prepared WC-np-enriched H11 powder blends: (a,b) mixture No. 1 (+1 wt.-% of WC-np), (c,d) mixture No. 2 (+2.5 wt.-% of WC-np) and (e) SEM- and (f) angular-selective basckscattering (ASB) image of mixture No. 3 (+5 wt.-% of WC-np).
Metals 14 00188 g002
Figure 3. Experimental approach for Additive Manufacturing of 30-layer tool steel samples (from left to right): vertical cross-section single track; cuboid samples with 1, 4 and 10 weld track layers; specimen made out of 30 layers before machining and a polished cross-section of 30-layer specimen applied for density and defect assessment.
Metals 14 00188 g003
Figure 4. Sketch of bidirectional deposition strategy applied for generating multilayer tool steel samples (Reprinted from Ref. [45]).
Metals 14 00188 g004
Figure 5. Schematical illustration of the measuring alignment for (a) XRD examinations, (b) OES (Reprinted from [44]) and (c) machined cylindrical specimen for compression testing (Reprinted from Ref. [44]).
Metals 14 00188 g005
Figure 6. Polished cross-sections for density assessment of (a) the pure AISI H11 sample (ρrel = 99.79%), reprinted from Ref. [44] and the specimens made out of (b) mixture No. 1 (+1 wt.-% of WC-np) (ρrel = 99.78%), (c) mixture No. 2 (+1 wt.-% of WC-np) (ρrel = 99.83%) and (d) mixture No. 3 (+5 wt.-% of WC-np) (ρrel = 99.83%).
Metals 14 00188 g006
Figure 7. SEM images of etched sample cross-sections at different positions: (a) pure AISI H11, (b) mixture No. 1 (+1 wt.-% of WC-np), (c) mixture No. 2 (+2.5 wt.-% of WC-np) and (d) mixture No. 3 (+5 wt.-% of WC-np).
Metals 14 00188 g007
Figure 8. Elemental EDS-area mappings at the top layer of the pure H11 sample (above) and the one made out of mixture 2 (2.5 wt.-% of WC-np) (below).
Metals 14 00188 g008
Figure 9. Merged microscopic images of the etched cross-sections: (a) AISI H11 [44], (b) powder mixture No. 1, (c) powder mixture No. 2 and (d) powder mixture No. 3.
Metals 14 00188 g009
Figure 10. Illustration of the in-process heat treatment and thermal cycling of lower weld track layers and of the development of interlayer temperature (according to the Time–Temperature–Transformation (TTT) curve of AISI H11 adapted from Refs. [22,44]).
Metals 14 00188 g010
Figure 11. (ad) Experimentally determined and reconstructed diffraction diagrams of tool steel samples in as-built conditions (measuring position: bottom; diffraction pattern for the pure AISI H11 (black curves) adapted from Ref. [44]).
Metals 14 00188 g011
Figure 12. Outcomes of XRD examinations: (a) mean value of RA content (n = 3) and mean value of domain (crystallite) size of (b) RA and (c) martensite of analyzed AISI H11 specimens plotted as function of the total carbon content from Table 4 for specimens in as-built conditions and after carrying out S1-HT and S2-HT (results for the pure AISI H11 adapted from Ref. [44]).
Metals 14 00188 g012
Figure 13. EBSD analysis including the phase fraction of RA and martensite and the inverse pole figures of specimens made out of (a) the pure AISI H11 (adapted from Ref. [44]) and (b) mixture No. 3 (+5 wt.-% of WC-np) in as-built conditions (measuring position: center).
Metals 14 00188 g013
Figure 14. Results of grain size analysis carried out by means of EBSD: (a,b) pure AISI H11 specimen (adapted from Ref. [44]) and the specimen manufactured using (c,d) powder mixture No. 3 (+5 wt.-% of WC-np).
Metals 14 00188 g014
Figure 15. (a) Microscope image of the etched cross-section of the sample made from mixture No. 3 after carrying out S1-HT, and SEM images of the sample at different positions: (b) bottom, (c) center and (d) top.
Metals 14 00188 g015
Figure 16. SEM images of microstructure at different magnifications: (a,b) pure H11 and (c,d) sample manufactured using mixture No. 2 (+2.5 wt.-% of WC-np).
Metals 14 00188 g016
Figure 17. Vickers hardness profiles of 30-layered tool steel samples were analyzed in three conditions: (a) as-built, (b) after S1-HT treatment and (c) after S2-HT treatment. (d) Mean hardness of the middle and top sections of the specimens plotted against the total carbon content (results for the pure AISI H11 adapted from Ref. [44]).
Metals 14 00188 g017
Figure 18. Mean values of (a) compression yield strength and (b) of max. strain plotted as function of the total carbon content for both specimens in as-built conditions as well as ones treated with thermal post processing (S1-HT and S2-HT) (results for the pure AISI H11 adapted from Ref. [44]).
Metals 14 00188 g018
Figure 19. Outcome of compression test: stress–strain curves for specimens in as-built conditions and ones thermally post-processed using S1-HT and S2-HT: (a) pure AISI H11 (adapted from Ref. [44]), (b) mixture No. 1 (1 wt.-% of WC-np), (c) mixture No. 2 (2.5 wt.-% of WC-np) and (d) mixture No. 3 (5 wt.-% of WC-np).
Metals 14 00188 g019
Table 1. Nominal chemical composition of the AISI H11 powder and hot work tool steel substrate (adapted from Ref. [44]).
Material
AISI H11
C (wt.-%)
(n = 5)
Si (wt.-%)
(n = 5)
Cr (wt.-%)
(n = 5)
Mo (wt.-%)
(n = 5)
V (wt.-%)
(n = 5)
powder0.345 ± 0.050.98 ± 0.035.23 ± 0.061.31 ± 0.040.31 ± 0.07
substrate0.390.95.091.290.33
ref. [22]0.33–0.410.9–1.24.8–5.51.1–1.40.25–0.5
Table 2. Measured carbon content and stoichiometrically calculated WC-np content (CWC-np, estimated) of prepared WC-np-enriched AISI H11 powder blends.
C-ContentsAISI H11 [44]

(n = 4 × 5)
Mixture No. 1
+1 wt.-% of WC-np
(n = 4 × 5)
Mixture No. 2
+2.5 wt.-% of WC-np
(n = 4 × 5)
Mixture No. 3
+5 wt.-% of WC-np
(n = 4 × 5)
Ccarbon, ideal
(wt.-%)
0.3450.4050.4950.645
Ccarbon, measured (wt.-%)0.345 ± 0.0020.402 ± 0.0030.479 ± 0.0030.613 ± 0.003
CWC-np, estimated (wt.-%)---0.992.44.75
Table 3. Process parameter combination applied for manufacturing of 1-, 4- and 10-layer test specimens.
Laser Power, P (W)Power Step, ∆P (W)Beam Diameter, 2 w
(mm)
Feed Rate,
frate
(mm/min)
Powder   Mass   Flow ,   m ˙ (g/min) Transport   Gas ,
V ˙ H e
(l/min)
Protection   Gas ,
V ˙ A r
(l/min)
500–10001001.54002.7± 0.1; 3.7± 0.1820
Table 4. Chemical composition of 30-layer tool steel specimens measured by means of OES.
ElementsReference AISI H11 [22]AISI H11
(n = 3 × 3)
[44]
Powder mixture No. 1
+1 wt.-% of WC-np
(n = 3 × 3)
Powder mixture No. 2
+2.5 wt.-% of WC-np
(n = 3 × 3)
Powder mixture No. 3
+5 wt.-% of WC-np
(n = 3 × 3)
C (wt.-%)0.33–0.410.336 ± 0.0030.357 ± 0.0040.366 ± 0.0070.421 ± 0.008
Si (wt.-%)0.80–1.200.933 ± 0.0090.941 ± 0.0060.941 ± 0.0020.922 ± 0.023
Mn (wt.-%)0.25–0.500.382 ± 0.0050.379 ± 0.0040.377 ± 0.0040.330 ± 0.034
Cr (wt.-%)4.80–5.505.100 ± 0.0265.08 ± 0.0145.083 ± 0.0065.077 ± 0.032
Mo (wt.-%)1.10–1.501.177 ± 0.0151.175 ± 0.0071.167 ± 0.0151.173 ± 0.031
V (wt.-%)0.30–0.500.378 ± 0.0030.375 ± 0.0010.374 ± 0.0020.375 ± 0.039
W (wt.-%)------0.378 ± 0.0060.659 ± 0.0221.463 ± 0.071
Table 5. Measured carbon contents for analyzing the detachment of the WC-np during the powder feeding phase.
Ccarbon (wt.-%)AISI H11

(n = 4 × 5) [44]
Powder Mixture No. 1
+1 wt.-% of WC-np
(n = 4 × 5)
Powder Mixture No. 2
+2.5 wt.-% of WC-np
(n = 4 × 5)
Powder Mixture No. 3
+5 wt.-% of WC-np
(n = 4 × 5)
Powders
(initial)
(wt.-%)
0.34 ± 0.0020.402 ± 0.0030.479 ± 0.0030.613 ± 0.003
Powders
(direct after nozzle outlet)
(wt.-%)
-----0.397 ± 0.0060.459 ± 0.0130.598 ± 0.013
Powder oversprays
(wt.-%)
-----0.385 ± 0.0090.413 ± 0.0130.441 ± 0.015
Specimens
(wt.-%)
0.336 ± 0.0030.357 ± 0.0040.366 ± 0.0070.421 ± 0.008
CWc-np, specimens (wt.-%)-----0.40.71.5
Table 6. Local RA content determined using XRD and Rietveld approximation at different measuring positions (bottom, middle and top) for specimens in as-built conditions and heat-treated ones.
AISI H11 [44]Mixture No. 1
(+1 wt.-% of WC-np)
Mixture No. 2
(+2.5 wt.-% of WC-np)
Mixture No. 3
(+5 wt.-% of WC-np)
RA-c in vol.-%RA-c in vol.-%RA-c in vol.-%RA-c in vol.-%
As-builtTop7.57.98.512.6
Center8.28.69.414.3
Bottom12.713.814.415.5
Mean (n = 3)9.5 ± 2.810.1 ± 3.210.8 ± 3.214.1 ± 3.5
S1-HTTop1.22.22.45
Center1.42.62.65.8
Bottom1.84.14.47.7
Mean
(n = 3)
1.5 ± 0.32.9 ± 13.1 ± 0.86.2 ± 1.4
S2-HTTop2.42.83.54
Center3.53.94.95.6
Bottom3.84.156.3
Mean
(n = 3)
3.2 ± 0.83.6 ± 0.74.4 ± 0.85.3 ± 1.2
Table 7. Summary of grain size analysis: area mean and area weighted for the pure AISI H11 sample and the one manufactured using mixture No. 3 (+5 wt.-% of WC-np) in as-built conditions.
MaterialThreshold Angle (°)Grain
Count
Area Mean
(µm²)
Area Weighted
(µm²)
AISI H11 [44]5–1031021.413.2
10–1527771.615.5
mixture No. 3
(+5 wt.-% of WC-np)
5–1050210.864.81
10–1545840.955.65
Disclaimer/Publisher’s Note: The statements, opinions and data contained in all publications are solely those of the individual author(s) and contributor(s) and not of MDPI and/or the editor(s). MDPI and/or the editor(s) disclaim responsibility for any injury to people or property resulting from any ideas, methods, instructions or products referred to in the content.

