2. Materials and Methods
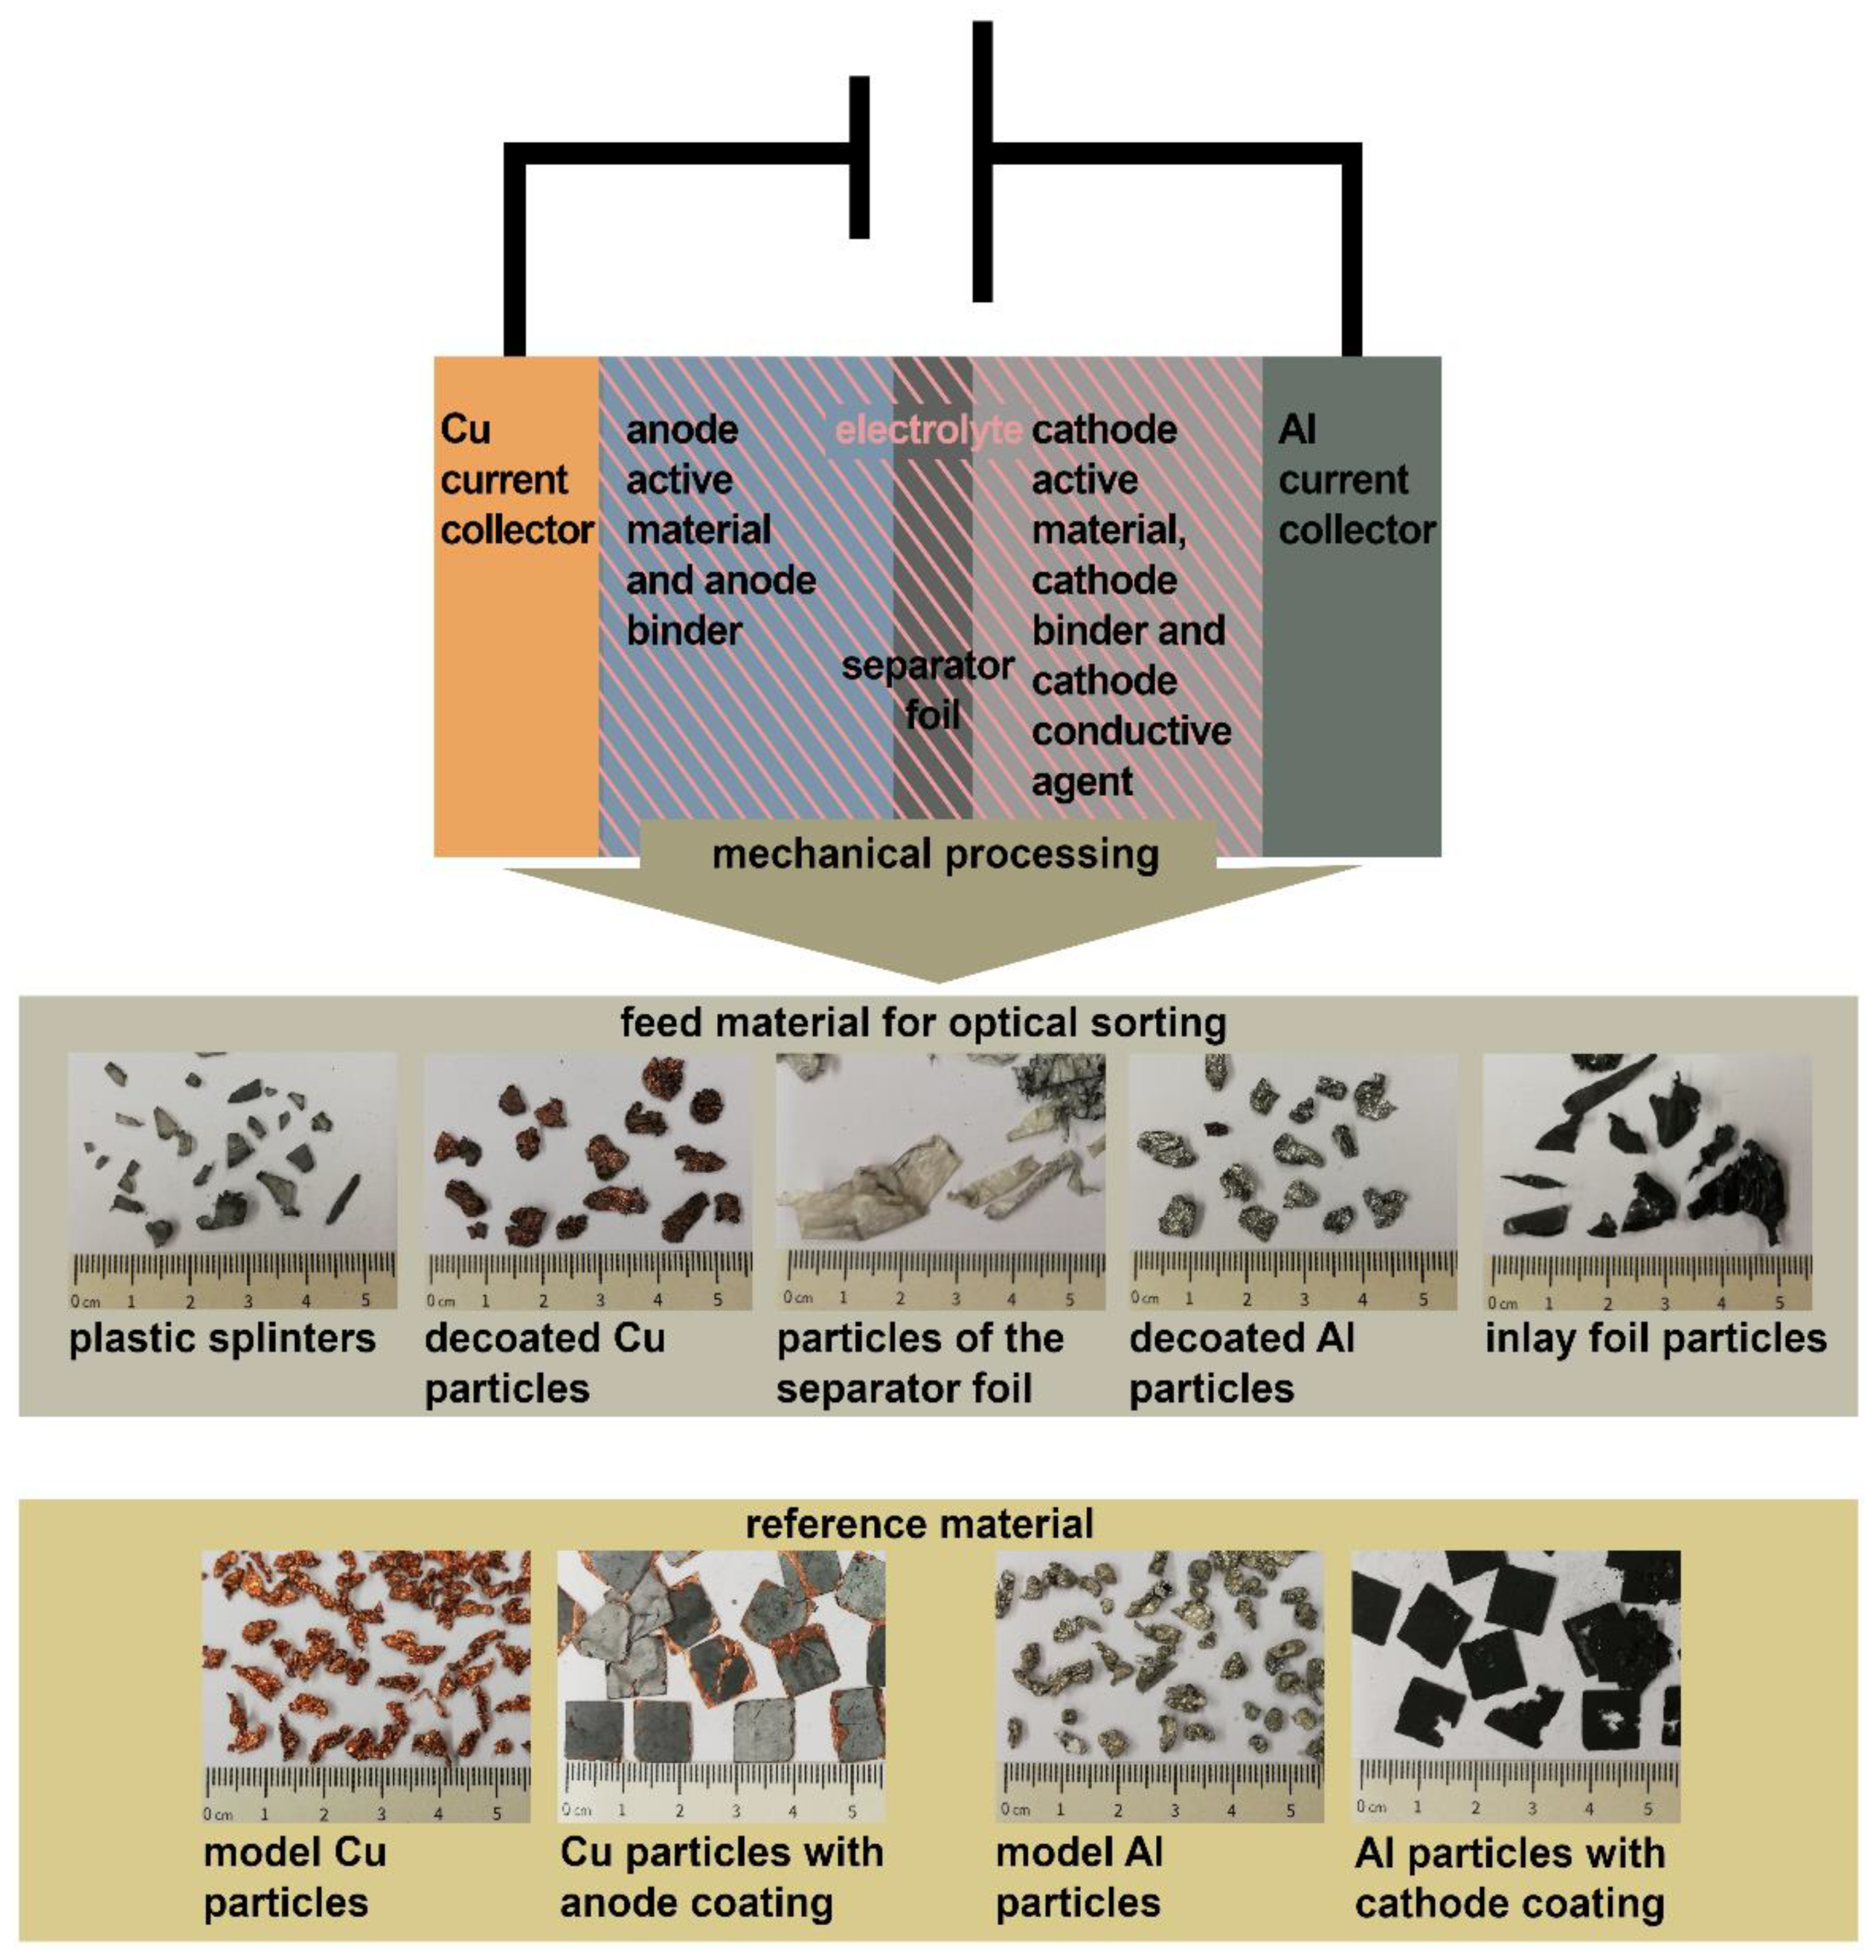
The feeding material for optical sorting (cf.
Figure 1) originates from an end-of-life automotive primary battery cell (Samsung SDI, Yongin-si, Republic of Korea; capacity: 94 Ah). This means that the cell had been subjected to several charge and discharge cycles. Prior to mechanical recycling, the cell was discharged using a resistor. The applied mechanical recycling can be split into two processes each consisting of a comminution, a classification, and a sorting step.
For the first comminution, a low-speed axial gab rotary shear (developed and built by TU Freiberg (Freiberg, Germany) 1994) was used as pre-comminution to open up the battery. To finalize the first comminution, a granulator (MeWa Andritz Universal Granulator UG 300; Hechingen, Germany) with a 20 mm grid was used. More detailed information can be found in Bischoff et al. [
19]. Afterward, the processed cell was dried for 14 days at 24 °C in a fume cupboard to remove the volatile electrolyte components. After the drying, the first black mass was separated using a 1 mm screen. The further processed electrode fraction was gained by separating the separator foil and the cell housing in a Zig-zag air classifier.
In the second step of the process, a high-speed impact mill (Turborotor Görgens G-35S, Dormagen, Germany) was used for the second comminution in order to further delaminate the electrode foils. After the comminution, the remaining second black mass was removed by screening at 0.5 mm. The fraction larger than 0.5 mm forms the examined mechanical decoated material.
In order to analyze the effect of residual coating on the spectral signature of the Al and Cu particles, the pristine reference material “model Al particles” and “model Cu particles” (cf.
Figure 1) was used. The model particles were made of uncoated Al and Cu foils of the same thickness as the current collector foils and subjected to the same mechanical recycling process as the material for the optical sorting. To collect information about the original coating, the battery cell was cut open. The jelly rolls were unrolled and the anode and cathode foil were dried for 14 days at ambient temperatures. Afterward, the foils were cut to pieces. As a result, “Cu particles with anode coating” or “Al particles with cathode coating” (cf.
Figure 1) were created. The anode coating consists of anode active material, i.e., graphite, and the anode binder, which is a mixture of carboxymethyl cellulose and styrene butadiene rubber. The components of the cathode coating are the cathode active material, i.e., lithium nickel manganese cobalt oxide (NMC), cathode binder, which consists of polyvinylidene fluoride and solvent, and cathode conductive agent, i.e., carbon black.
The sample set was characterized by a selection of optical sensors. Firstly, the point spectrometric sensors Spectral Evolution PSR-3500 (Spectral Evolution, Lawrence, MA, USA) and Agilent 4300 Handheld FTIR (Agilent Technologies, Santa Clara, CA, USA) were chosen to set a detection baseline over a wide wavelength range. These two sensors are mobile, handheld devices that reach a high spectral resolution. Based on the spectral library curated from the point spectroscopic measurements, the line scanners, i.e., push broom scanners, Specim Fenix (Specim, Spectral Imaging Ltd., Oulu, Finland) and Specim FX10 (Specim, Spectral Imaging Ltd., Oulu, Finland), as well as the image sensor Cubert Ultris X20 (Cubert GmbH, Ulm, Germany) were chosen as the optical sorting also requires spatial information on the particles. Properties and measurement setup parameters of all applied sensors are listed in
Table 1. All reflectance data are given relative to an approximately constant reflectance of a reference panel. Due to the use of the Zenith Polymer (SphereOptics GmbH, Herrsching, Germany) reference with 60% diffuse reflectance, each data point obtained from the Spectral Evolution PSR-3500 had to be multiplied by 0.6.
The point measurement data originating from the Spectral Evolution PSR-3500 and Agilent 4300 Handheld FTIR were read and plotted with the help of the Python toolbox hylite (version 1.2,
https://github.com/hifexplo/hylite, Freiberg, Germany) [
20]. Upon the different measurement locations on the sample material, the most representative spectral information of each sample was identified by minimizing the mean Euclidean distances to all other spectra.
The setups presented in
Figure 2 were used to acquire the HSI data from the push broom scanners Specim Fenix and Specim FX10 as well as the snapshot camera Cubert Ultris X20. The Specim FX10 and Specim Fenix sensors detect a line of pixels and are therefore mounted above a conveyor belt moving the samples to add a second dimension, whereas the Cubert Ultris X20 detects a square area of the sample plane. The sample planes of both setups are illuminated uniformly by halogen light bulbs.
The HSI data acquisition was performed using the software Lumo Scanner 2019 [
21] (Specim FX10), Lumo Recorder 2019 [
22] (Specim Fenix), and Cubert Utilities 2.9.1 CORE/TOUCH [
23] (Cubert Ultris X20). The required radiometric and geometric corrections and basic visualizations were carried out with the help of the Python toolbox hylite [
20]. For further analysis of the hyperspectral data, ENVI™ 5.1 [
24] was used. In order to perform statistical analysis, pixels of the HSI were grouped into regions of interest in accordance with the shape of the sample particles. The arithmetic mean gained from this procedure was compared to the most representative point measurement.
3. Results
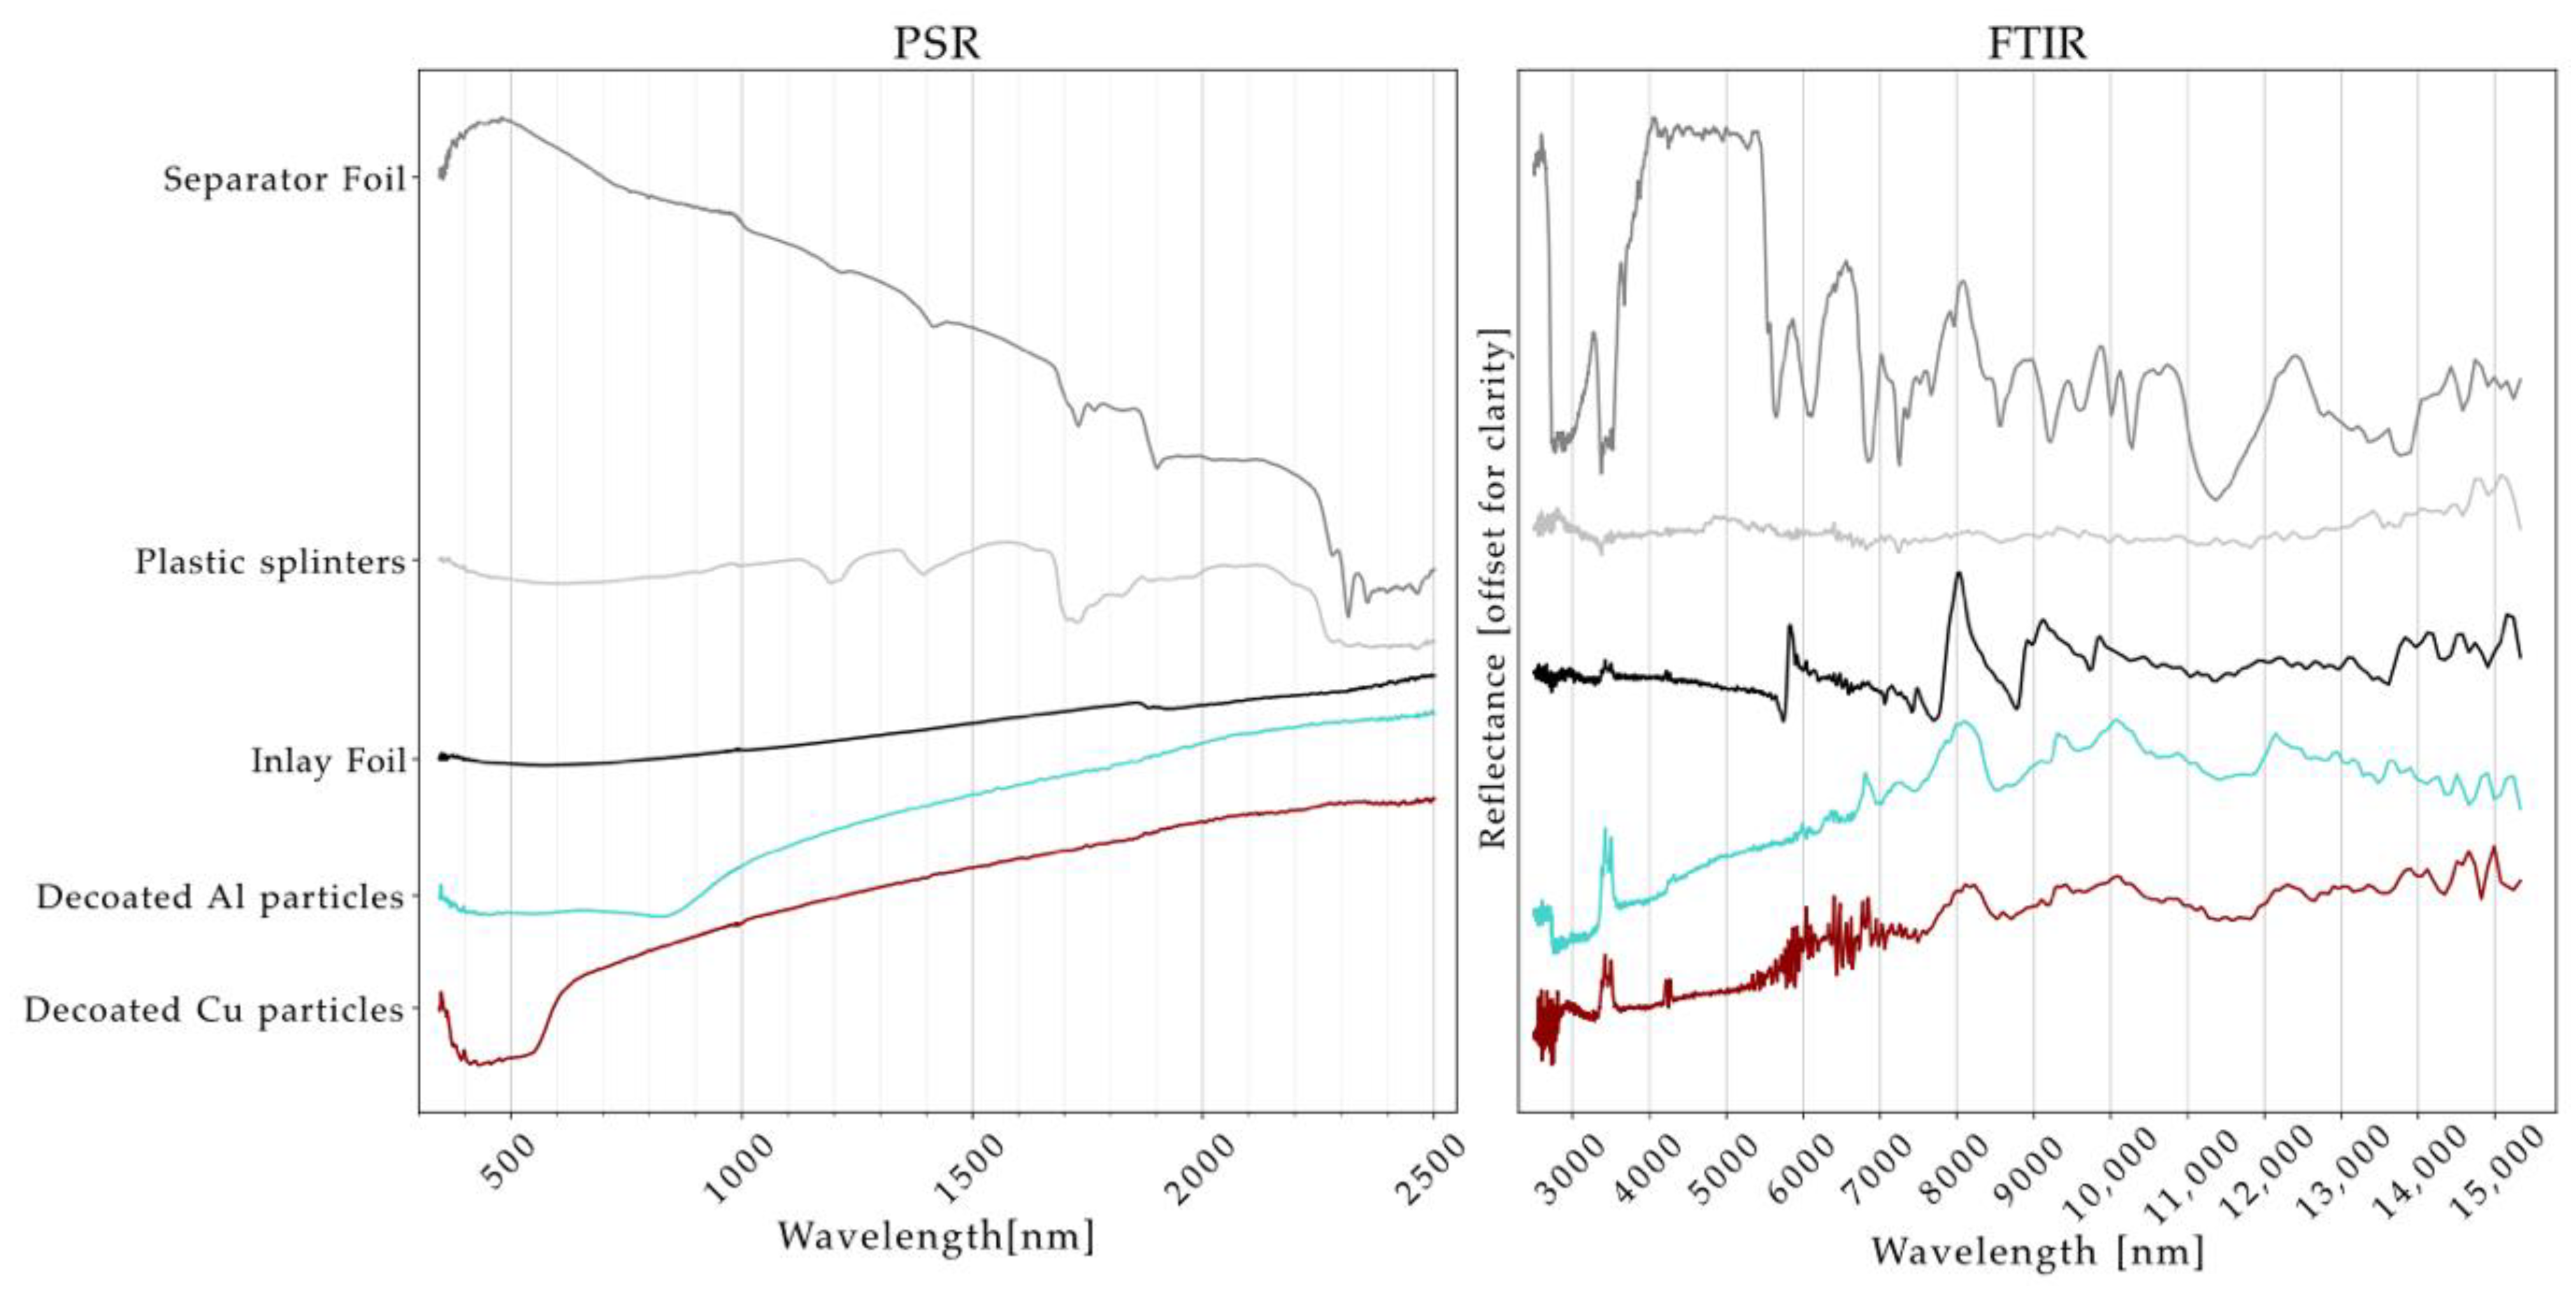
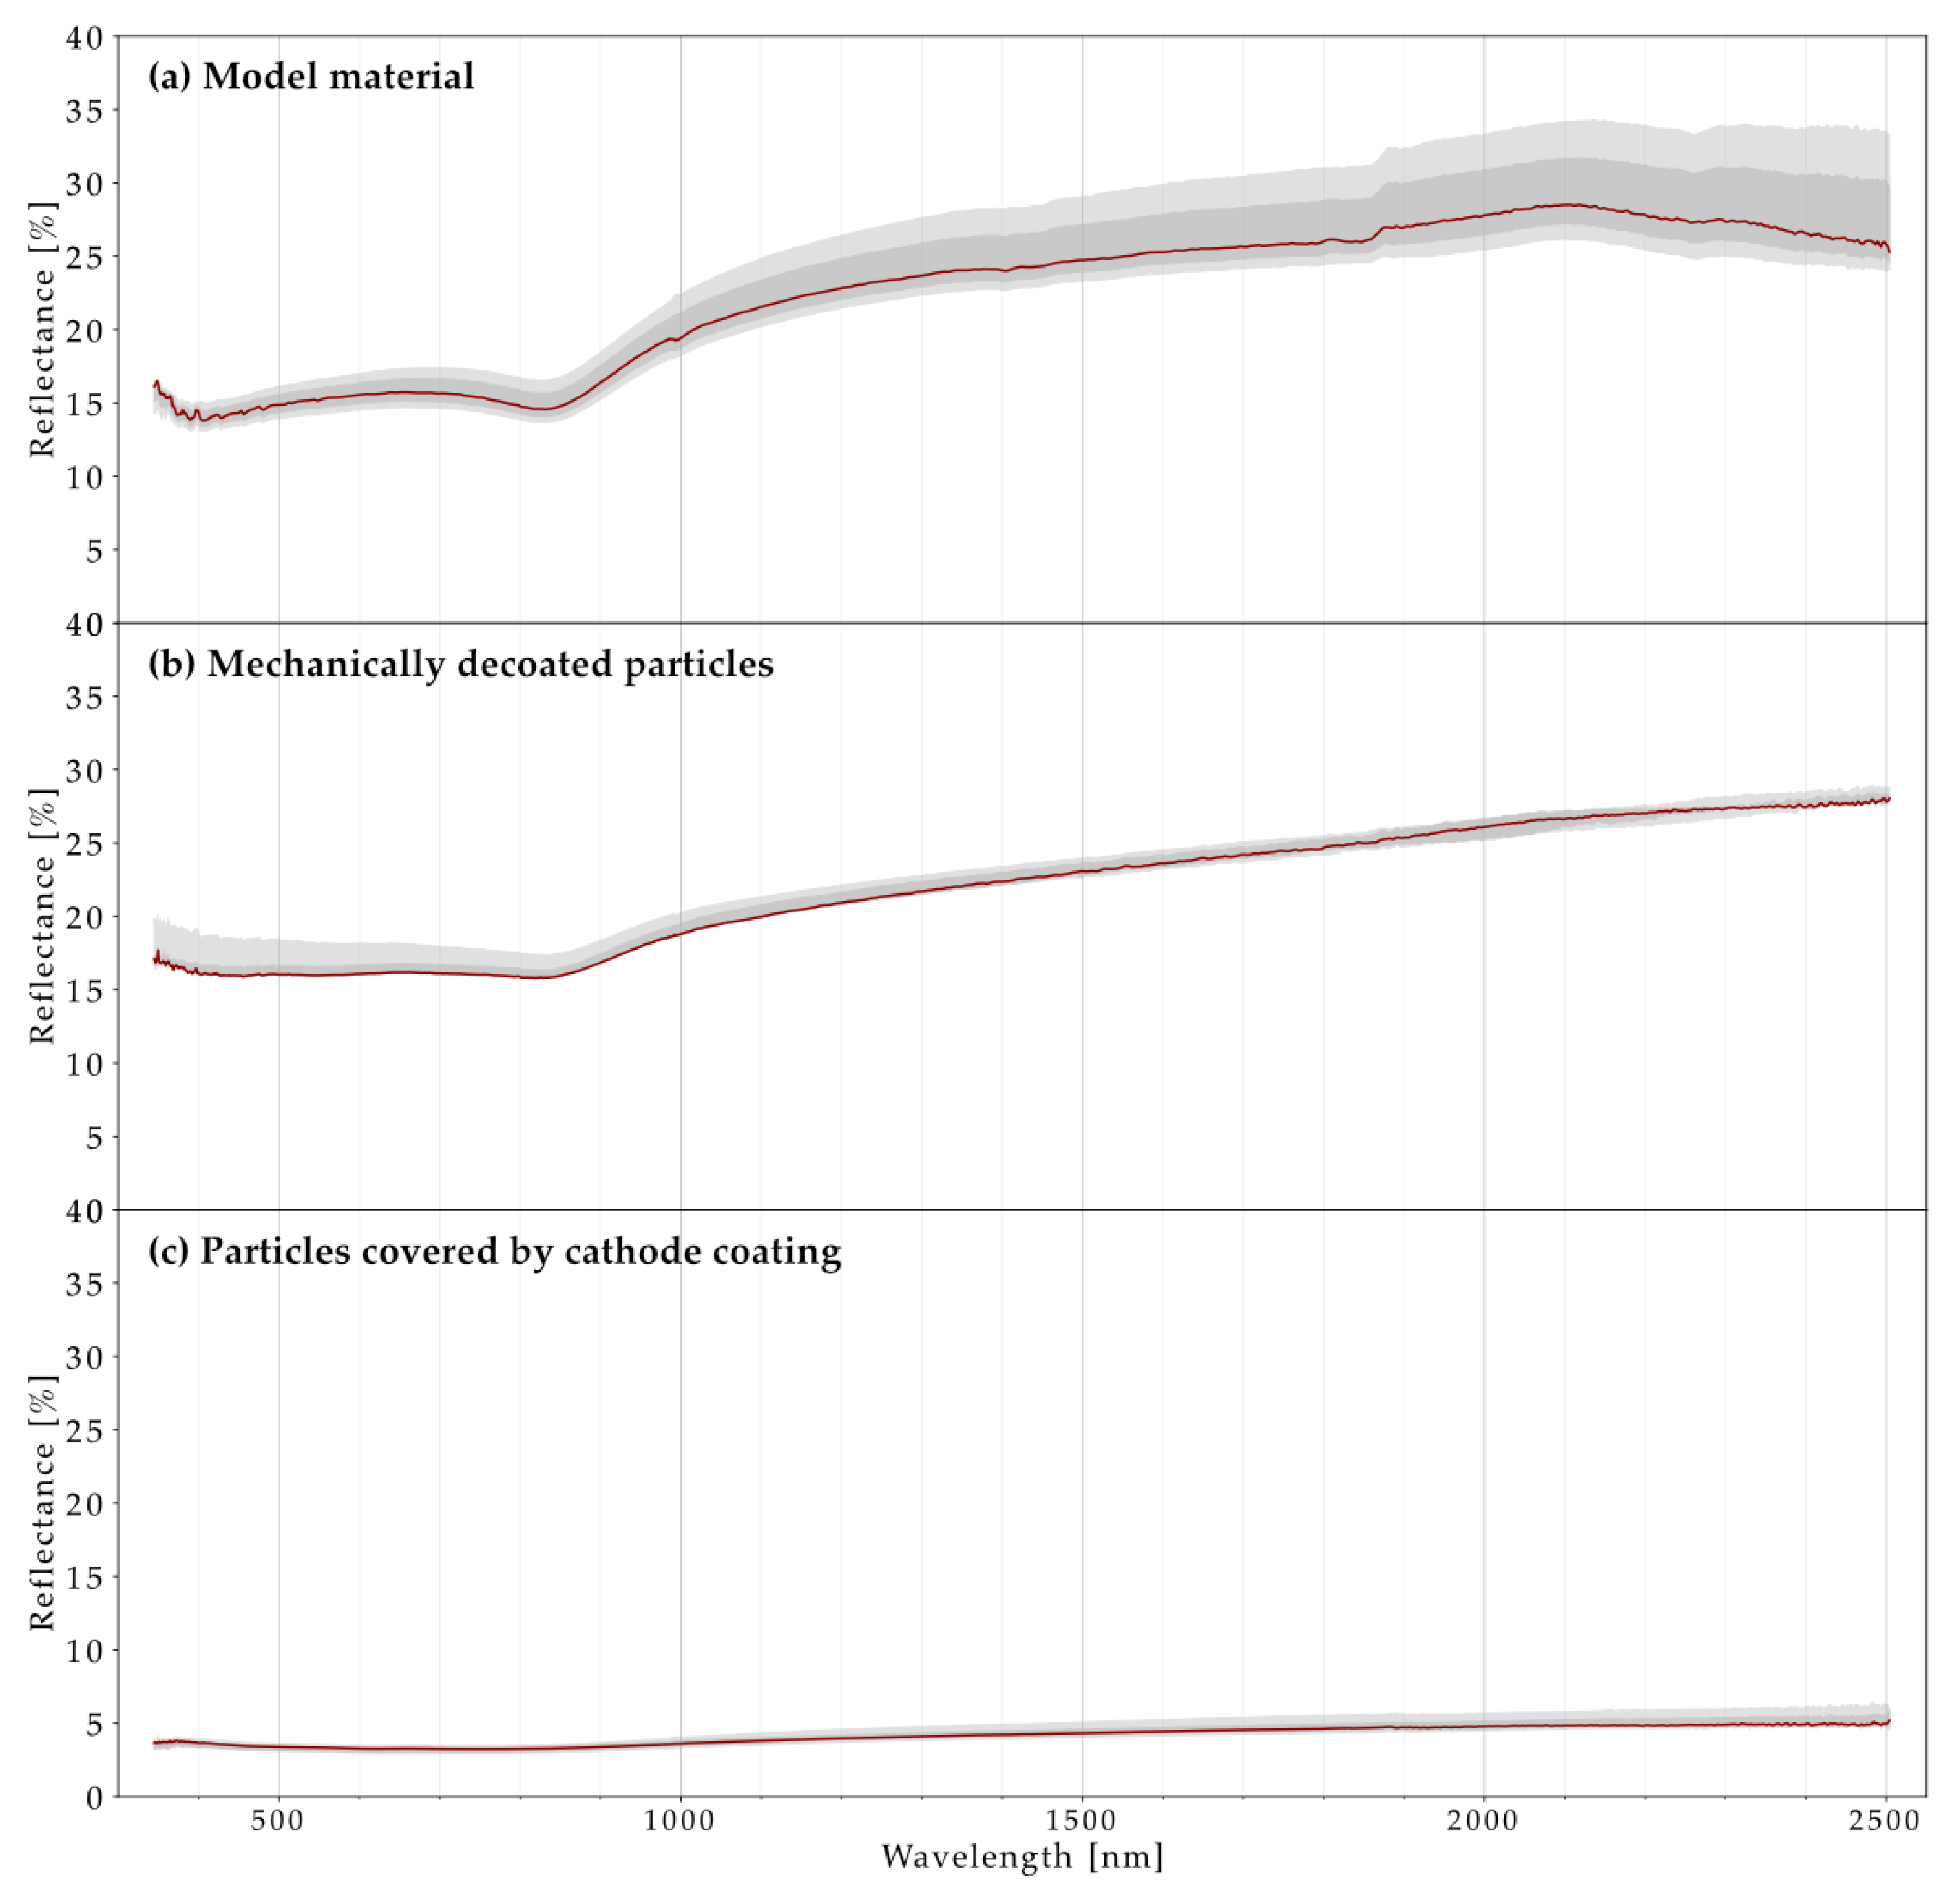
The point measurements performed with the Spectral Evolution PSR-3500 are presented in
Figure 3 and reveal the effects of different spatial points of analysis on the sample material and different stages of treatment for Cu. The model Cu particles in
Figure 3a and the decoated Cu particles in
Figure 3b share similar spectra in the visible to short-wave infrared (V-SWIR) spectral range and are quite homogeneous at different points. In accordance with the work published by Svito et al. [
25], a significant step to higher reflectance between 560 and 640 nm, which is assigned to electron transitions from the d to s band and a moderate monotonic rise of reflectance at larger wavelengths are observed in
Figure 3a,b.
In contrast to the relatively low quantile distances for reflectance signals in
Figure 3a,b, the spectra of Cu particles with anode coating in
Figure 3c show higher spectral variation according to the surface condition with different thicknesses and a fragmented state of anode coating, see
Figure 1. Some spectra corresponding to completely coated sample locations do not resample the reflection edge visible in
Figure 3a,b at all, as the main component of the anode coating, i.e., graphite, has a constant low reflectance within the V-SWIR range. The higher the coating coverage, the less comparable the spectral signature of the Cu particles with anode coating becomes since the signature of the coating dominates and prevents the detection of the Cu below.
An analogue analysis was performed for model Al particles, decoated Al particles, and Al particles with cathode coating. From the results, which are included in
Appendix A Figure A1, one can similarly conclude that the constant low reflectance of the cathode coating, mainly containing NMC, affects the spectra significantly, while residuals of the cathode coating on the decoated Al particles do not cover the characteristic spectral features of Al. Therefore, only the feed material for the optical sorting (cf.
Figure 1) including the decoated Al and Cu particles are considered in further results. On a side note, the small features in
Figure 3 and
Appendix A Figure A1 at 1000 nm and 1900 nm are artifacts caused by the detector shift of the Spectral Evolution PSR-3500.
A spectral library of the visible up to the long-wave infrared spectral range is presented in
Figure 4 in order to highlight the main material-specific spectral differences available for optical discrimination of the feed material. In the V-SWIR range, the decoated Al particles are characterized by a reflectance minimum at 830 nm followed by a steeper slope, attributed to interband transitions [
26]. This spectral characteristic is clearly distinguishable from the step between 560 and 640 nm observed for the reflectance of the decoated Cu particles, whereas the Al and Cu spectra are found to be very similar in the short- to long-wave infrared (S-LWIR) range.
The recurring sharp features at around 3500 nm and 4300 nm are associated with humidity and carbon dioxide, respectively, and caused by ambient air between the sample and the Agilent 4300 Handheld FTIR sensor. The contact between the sample and the sensor is not as close as between the reference coarse gold cap and the sensor. Thus, these features are not detected in the reference measurements and are not subtracted from the sample measurements.
The characteristic spectral features of Al and Cu differ also significantly from the non-metallic sample material in the feed material stream. The V-SWIR and S-LWIR spectra of these non-metallic components were compared to the work published by Vázquez-Guardado et al. [
27]. The authors of that study investigated 12 common plastics by FTIR reflectance spectroscopy to discover their spectral fingerprints. Based on spectral features at 5832 nm, 8033 nm, 9125 nm, and 9864 nm (peaks), as well as at 5745 nm, 7687 nm, 8768 nm, and 9721 nm (valleys), the inlay foil was identified as polyethylene terephthalate (PET). The plastic splinters are made of polypropylene (PP) according to the peaks at 1342 nm, 7023 nm, 7310 nm, and 9316 nm as well as the valleys at 1193 nm, 1395 nm, 1706 nm, 1726 nm, 3370 nm, 6827 nm, 7251 nm, and 8572 nm. Finally, the separator foil is composed of different plastics including polyethylene terephthalate, polypropylene, and polyvinyl chloride (PVC). This is also quite evident considering that the V-SWIR reflectance spectrum of the separator foil shares similar features with the V-SWIR spectrum of the plastic splinters, whereas the S-LWIR spectrum of the separator foil shows some similar spectral features compared to the inlay foil.
To evaluate and investigate the potential for industrial implementation, the analysis of the feed material was upscaled to his, which provides a continuous mapping of material streams including spatial information. In
Figure 5, reflectance spectra in the wavelength range of 400 to 1000 nm from the Specim Aisa Fenix, Specim FX10, and Cubert Ultris X20 sensors averaged over the respective sample area are compared to the representative spectra from point measurements using the Spectral Evolution PSR-3500.
For the plastic samples (separator foil, plastic splinters, and inlay foil), no spectral features were observed in the wavelength range of 400 to 1000 nm, as the fingerprints are all in the S-LWIR range. This clarifies that the small features detected by the HSI sensors can be likely attributed to noise. In particular, the reflectance spectra from the Cubert Ultris X20 sensor show a high signal scatter. This might be caused by a lower signal-to-noise ratio (S/N), spectral resolution, and uneven illumination because of different geometric positions of the sample material.
However, the discriminative features, a minimum at around 830 nm followed by a steeper slope for the decoated Al particles and a step at around 580 nm for the decoated Cu particles, are reproduced by all HSI measurements. Furthermore, the HSI reflectance spectra of separator foil, plastic splinters, and inlay foil obtained from the Specim Fenix as well as from the Specim FX10 do not resemble the spectral characteristics of the Al and Cu particles. On the contrary, the HSI reflectance spectra of the inlay foil and the decoated Al particles recorded by the Cubert Ultris X20 are similar.
4. Discussion
In this work, a multitude of different reflectance sensors was applied to the same sample set (cf.
Figure 1), which is required to identify an adequate selection of sensor technology for a sensor-based optical sorting of shredded Li-ion battery components being present in a corresponding recycling material stream.
The point measurements performed by the Spectral Evolution PSR-3500 revealed characteristics for the Al and Cu samples, i.e., the reflectance minimum at 830 nm followed by a steeper slope in the case of Al and the reflection edge between 560 and 640 nm for Cu, in the 400–1000 nm spectral range, that were reliably detected for the decoated Al and Cu particles. Thus, the removal of the respective coatings from the Al and Cu current collectors by mechanical processing was realized from a spectroscopist’s perspective. In particular, this allows for the monitoring of mechanical sorting processes. Meanwhile, the varying observability of the spectral characteristics of both Al and Cu particles with coating proves the negative impact of the coating. Therefore, it can be beneficial to apply the Adhesion Neutralization via Incineration and Impact Liberation (ANVIIL) process to the cathode material. In this very efficient process, which, however, is for now only available on the laboratory scale, the adhesion between cathode coating and Al current collector is reduced due to the thermal decomposition of the polyvinylidene fluoride binder and an air-jet-separator is able to detach the cathode coating powder [
28].
Additionally, the point measurements carried out using the Agilent 4300 Handheld FTIR offer the possibility to differentiate between the plastic components separator foil, inlay foil, and plastic splinters. Since the corresponding wavelength range contains spectral fingerprints of the plastic components, it was possible to identify the polymer types. Although the Agilent 4300 Handheld FTIR cannot distinguish between decoated Al and Cu particles, there is still a reliable difference between the plastic and metal components in the reflectance spectra. Transferring this sensor in an application scenario, the influences of ambient air humidity and CO2 causing noise and the sharp features at around 3500 nm and 4300 nm associated with humidity and carbon dioxide would be unavoidable. Consequently, it is necessary to select a sensor that is more robust under application conditions.
Furthermore, the requirement of spatial information on the components under investigation made an upscaling to HSI inevitable. In this work, three different HSI sensors in the relevant spectral range of 400–1000 nm were applied to the sample set. All of them are based on CMOS detectors, the reflectance was given relative to the SphereOptics Zenith Polymer
® (>99%) reference, and the sample plane was illuminated uniformly by halogen light bulbs, see
Table 1 and
Figure 2. However, as the sample material consists of three-dimensional particles shaped by mechanical processing, the measurement points are not exactly situated in the sample plane and overlap and shade each other. Despite this minor inhomogeneity of illumination, the characteristic spectral features of both decoated Al and Cu particles were reliably registered.
The applied HSI sensors differ in their spatial and spectral resolution with the Specim Fenix having the highest px size in the sample plane (1.5 mm) and the Cubert Ultris X20 having the most unfavorable spectral resolution (10 nm) in the range of 400–1000 nm. The required spatial resolution is determined by the minimum particle size and was sufficient in all HSI measurements. We highlight that within a real recycling scenario, particle sizes below the spatial resolution of the camera might occur, resulting in mixed pixel spectra, either between particle and background or between overlapping particles. A neutral background and the application of advanced spectral unmixing techniques, such as those developed and presented by Chouhan et al. [
29] within the same project, help to mitigate this issue. The low spectral resolution and S/N of the Cubert Ultris X20 were not adequate to discriminate between the decoated Al particles and the inlay foil. An appropriate error correction, a longer exposure time, or an accumulation of measurements might improve this discrimination. For application, Cu recovery is of great importance because of the EU regulation 2023/1542 [
2], and this was correctly detected by all three HSI sensors.
Apart from that, the Cubert Ultris X20 offers an advantage that is particularly based on the short exposure time, i.e., crucial for application to a continuous particle flow, its speed. Considering its frame rate of 4 Hz, its px size in the sample plane of 0.8 mm, and its scanning area of 410 px × 410 px, the Cubert Ultris X20 covers 430,336 mm2 of the sample plane per second, which is almost 20 times as much as the Specim Fenix does and more than 24 times as much as the Specim FX10 does. There is still potential to develop small, simple, and fast sensors, which still reach a sufficient spectral resolution and S/N.
Two different application scenarios shall be introduced, (i) a conveyor belt and (ii) an air-classification setup. The former operates similarly to the setup of the Specim Fenix and Specim FX10 sensors in
Figure 2. A line scanner is mounted above a moving conveyor belt. The belt material has a known, preferably constant, low reflectance. The focus is always on one plane with a constant distance between the sensor and the sorting material. The conveyor speed has to be fixed based on the frame rate of the sensor in order to have only small overlapping areas in the investigated space. Overlapping of particles in the plane can be minimized by a vibrating plane that arranges the sorting material in the first place and rearranges rejected, not sortable, or unregistered particles.
In the air-classification setup, the sensor is used for process monitoring to check the ascending particles in line in order to adjust the air velocity accordingly. The fast and unpredictably moving particles are only accessible with the speed of a snapshot camera, e.g., Cubert Ultris X20. The overlapping of particles in the sight of the sensor has to be tackled by detecting the movement of the particles and recognizing them again after the overlapping. Background signals can be removed more easily using the spatial information of the particle tracking. The frame rate of the sensor has to fit the speed of the particles in the zig-zag-sifting. A further issue will potentially occur because of the varying distances of the particles to the sensor. It will be a challenge to keep all particles in focus and under constant illumination. Therefore, it would also be possible to only measure in an area with sufficient focus and illumination and to just wait for the particles to cross this defined area to register them.
Reviewing the discrimination of separator foil, inlay foil, and plastic splinters by the Agilent 4300 Handheld FTIR, it would be possible to additionally sort according to different types of plastics in order to offer an alternative to the common thermal recycling. It would also be possible to add a point sensor that selectively monitors the optical sorting with better accuracy based on spectral resolution and S/N.
In order to manage the high data volume, suitable machine-learning algorithms have to be implemented. The work of Chouhan et al. [
29] used a novel approach of performing hyperspectral unmixing via autoencoder for sorting shredded Li-ion battery components. Their approach was applied to HSI data and detected Cu and Al particles and distinguished both from separator foils present.
Author Contributions
Conceptualization, S.L. and J.R.; methodology, S.L. and A.K.; investigation, J.R., S.L. and A.K.; resources, S.L., C.R., U.A.P., R.G. and J.H.; data curation, J.R. and S.L.; writing—original draft preparation, J.R. and A.K.; writing—review and editing, J.R., S.L., A.K., M.F., C.R., U.A.P., J.H. and R.G.; visualization, J.R. and S.L.; supervision, S.L., C.R., U.A.P., R.G. and J.H.; project administration, S.L., C.R., U.A.P., R.G. and J.H.; funding acquisition, S.L., C.R., U.A.P., R.G. and J.H. All authors have read and agreed to the published version of the manuscript.
Funding
This study is financially funded by the Federal Ministry of Education and Research of Germany in the framework of the Competence Cluster Recycling & Green Battery (greenBatt) under BMBF grant No. 03XP0337. The Helmholtz Institute Freiberg for Resource Technology is gratefully thanked for supporting and funding this project.
Data Availability Statement
The data presented in this study are available on request from the corresponding author.
Acknowledgments
The authors would like to acknowledge the fruitful cooperation and discussion within the project DIGISORT. In particular, we would like to thank Yuleika Madriz for her skillful technical assistance in performing the measurements.
Conflicts of Interest
The authors declare no conflicts of interest.
References
- Doose, S.; Mayer, J.K.; Michalowski, P.; Kwade, A. Challenges in Ecofriendly Battery Recycling and Closed Material Cycles: A Perspective on Future Lithium Battery Generations. Metals 2021, 11, 291. [Google Scholar] [CrossRef]
- EUR-Lex. Available online: http://data.europa.eu/eli/reg/2023/1542/oj (accessed on 17 December 2023).
- Heimes, H.; Kampker, A.; Offermanns, C.; Kreisköther, K.; Kwade, A.; Doose, S.; Ahuis, M.; Michalowski, P.; Michaelis, S.; Rahimzei, E.; et al. Recycling von Lithium-Ionen-Batterien. 2021. Available online: https://www.researchgate.net/publication/354652993_Recycling_von_Lithium-Ionen-Batterien (accessed on 21 December 2023).
- Vekic, N. Lithium-Ionen-Batterien für die Elektromobilität: Status, Zukunftsperspektiven, Recycling Thinktank Industrielle Ressourcenstrategien. 2020. Available online: https://www.researchgate.net/publication/343635827_LITHIUM-IONEN-BATTERIEN_FUR_DIE_ELEKTROMOBILITAT_STATUS_ZUKUNFTSPERSPEKTIVEN_RECYCLING_THINKTANK_Industrielle_Ressourcenstrategien (accessed on 21 December 2023).
- Diekmann, J.; Hanisch, C.; Froböse, L.; Schälicke, G.; Loellhoeffel, T.; Fölster, A.; Kwade, A. Ecological Recycling of Lithium-Ion Batteries from Electric Vehicles with Focus on Mechanical Processes. J. Electrochem. Soc. 2016, 164, A6184. [Google Scholar] [CrossRef]
- Diekmann, J.; Rothermel, S.; Nowak, S.; Kwade, A. Chapter 2 The LithoRec Process. In Recycling of Lithium-Ion Batteries: The LithoRec Way. Sustainable Production, Life Cycle Engineering and Management, 1st ed.; Kwade, A., Diekmann, J., Eds.; Springer International Publishing: Cham, Switzerland, 2018; Volume 1, pp. 33–38. [Google Scholar]
- Diekmann, J.; Hanisch, C.; Loellhoeffel, T.; Schälicke, G.; Kwade, A. Ecologically Friendly Recycling of Lithium-Ion Batteries—The LithoRec Process. ECS Trans. 2016, 73, 1–9. [Google Scholar] [CrossRef]
- Kaas, A.; Mütze, T.; Peuker, U.A. Review on Zigzag Air Classifier. Processes 2022, 10, 764. [Google Scholar] [CrossRef]
- Borengasser, M.; Watkins, R.L.; Hungate, W.S. Hyperspectral Remote Sensing: Principles and Applications, 1st ed.; Taylor & Francis Series in Remote Sensing Applications; CRC Press: Boca Raton, FL, USA, 2008. [Google Scholar]
- Manolakis, D.G.; Lockwood, R.B.; Cooley, T.W. Hyperspectral Imaging Remote Sensing: Physics, Sensors, and Algorithms, 1st ed.; Cambridge University Press: Cambridge, UK, 2016. [Google Scholar]
- Sensor and Camera Requirements for Hyperspectral Imaging. Vision Systems Design. 2020. Available online: https://www.vision-systems.com/cameras-accessories/article/14181365/hyperspectral-imaging-sensor-and-camera-requirements (accessed on 21 December 2023).
- Kutila, M.; Viitanen, J.O.; Vattulainen, A. Scrap Metal Sorting with Colour Vision and Inductive Sensor Array. In Proceedings of the International Conference on Computational Intelligence for Modelling, Control and Automation and International Conference on Intelligent Agents, Web Technologies and Internet Commerce (CIMCA-IAWTIC’06), Vienna, Austria, 28–30 November 2005; Volume 2, pp. 725–729. [Google Scholar]
- Pfandl, K.; Küppers, B.; Scheiber, S.; Stockinger, G.; Holzer, J.; Pomberger, R.; Antrekowitsch, H.; Vollprecht, D. X-ray fluorescence sorting of non-ferrous metal fractions from municipal solid waste incineration bottom ash processing depending on particle surface properties. Waste Manag Res. 2020, 38, 111–121. [Google Scholar] [CrossRef]
- Kroell, N.; Chen, X.; Greiff, K.; Feil, A. Optical sensors and machine learning algorithms in sensor-based material flow characterization for mechanical recycling processes: A systematic literature review. Waste Manag. 2022, 149, 259–290. [Google Scholar] [CrossRef] [PubMed]
- Vrancken, C.; Longhurst, P.; Wagland, S. Critical review of real-time methods for solid waste characterisation: Informing material recovery and fuel production. Waste Manag. 2017, 61, 40–57. [Google Scholar] [CrossRef] [PubMed]
- Li, L.; Maftouni, M.; Kong, Z.J.; Li, Z. An Automated Recycling Process of End-of-Life Lithium-Ion Batteries Enhanced by Online Sensing and Machine Learning Techniques. In REWAS 2022: Developing Tomorrow’s Technical Cycles; Springer: Berlin/Heidelberg, Germany, 2022; Volume 1, pp. 475–486. [Google Scholar]
- Mämpel, C. Recycling von Lithium-Ionen-Batterien aus Elektromobilen. Bachelor’s Thesis, TU Bergakademie Freiberg, Freiberg, Germany, 2013. [Google Scholar]
- Varisort Compact—Multi-Sortiersystem für die Recyclingindustrie. 2013. Available online: https://www.sesotec.com/sites/593fc2aac25e5b0640a20ff8/content_entry59e75c78ffe9ecdb05f0bdf9/5a97c525ffe9ec732a731495/files/varisort-compact-pr-en.pdf (accessed on 21 December 2023).
- Bischoff, P.; Kaas, A.; Schuster, C.; Härtling, T.; Peuker, U.A. Fast and Efficient Evaluation of the Mass Composition of Shredded Electrodes from Lithium-Ion Batteries Using 2D Imaging. J. Imaging 2023, 9, 135. [Google Scholar] [CrossRef] [PubMed]
- Thiele, S.T.; Lorenz, S.; Kirsch, M.; Contreras Acosta, I.C.; Tusa, L.; Herrmann, E.; Möckel, R.; Gloaguen, R. Multi-scale, multi-sensor data integration for automated 3-D geological mapping. Ore Geol. Rev. 2021, 136, 104252. [Google Scholar] [CrossRef]
- Lumo Scanner 2019; Spectral Imaging Ltd.: Oulu, Finland, 2019.
- Lumo Recorder 2019; Spectral Imaging Ltd.: Oulu, Finland, 2019.
- Cubert Utilities 2.9.1 CORE/TOUCH; Cubert GmbH: Ulm, Germany.
- ENVITM 5.1; Exelis Visual Information Solutions: Boulder, CO, USA.
- Svito, I.A.; Korolik, O.V.; Mazanik, A.V.; Fedotov, A.K.; Saad, A.M.; Luhin, V.G.; Koltunowicz, T.N.; Zukowski, P. Copper-silicon dioxide nanocomposites: Structure and electron transport. J. Alloys Compd. 2017, 726, 417–423. [Google Scholar] [CrossRef]
- Hunklinger, S. Festkörperphysik, 5th ed.; De Gruyter Oldenbourg: Berlin, Germany; Boston, UK, 2018; pp. 595–645. [Google Scholar]
- Vázquez-Guardado, A.; Money, M.; McKinney, N.; Chanda, D. Multi-spectral infrared spectroscopy for robust plastic identification. Appl. Opt. 2015, 54, 7396–7405. [Google Scholar] [CrossRef] [PubMed]
- Hanisch, C.; Loellhoeffel, T.; Diekmann, J.; Markley, K.J.; Haselrieder, W.; Kwade, A. Recycling of lithium-ion batteries: A novel method to separate coating and foil of electrodes. J. Clean. Prod. 2015, 108, 301–311. [Google Scholar] [CrossRef]
- Chouhan, S.; Rasti, B.; Ghamisi, P.; Lorenz, S.; Fuchs, M.; Gloaguen, R. Hyperspectral Unmixing Using Convolutional Autoencoder for Metal Detection in Lithium-Ion Battery Recycling Applications. In Proceedings of the 2022 12th Workshop on Hyperspectral Imaging and Signal Processing: Evolution in Remote Sensing (WHISPERS), Rome, Italy, 13–16 September 2022; pp. 1–5. [Google Scholar] [CrossRef]
| Disclaimer/Publisher’s Note: The statements, opinions and data contained in all publications are solely those of the individual author(s) and contributor(s) and not of MDPI and/or the editor(s). MDPI and/or the editor(s) disclaim responsibility for any injury to people or property resulting from any ideas, methods, instructions or products referred to in the content. |
© 2024 by the authors. Licensee MDPI, Basel, Switzerland. This article is an open access article distributed under the terms and conditions of the Creative Commons Attribution (CC BY) license (https://creativecommons.org/licenses/by/4.0/).


 ,
, 


