Article

Rapid Alloy Development Using Calphad Simulation and Powder Blends in Direct Energy Deposition

by
Marie-Noemi Bold
1,*,
Iris Raffeis
2,*,
Frank Adjei-Kyeremeh
2,
Johannes Henrich Schleifenbaum
1 and
Andreas Bührig-Polaczek
2
1
Digital Additive Production, RWTH Aachen University, Campus-Boulevard 73, 52074 Aachen, Germany
2
Foundry Institute, RWTH Aachen University, Intzestraße 5, 52072 Aachen, Germany
*
Authors to whom correspondence should be addressed.
Metals 2024, 14(1), 79; https://doi.org/10.3390/met14010079
Submission received: 30 November 2023 / Revised: 20 December 2023 / Accepted: 27 December 2023 / Published: 9 January 2024
(This article belongs to the Section Powder Metallurgy)

Abstract

:
The ongoing commercialization of additive manufacturing (AM) has necessitated the need to tailor alloy chemistry as well as exploit AM process particularities such as freedom of design, print geometry and high cooling rates to meet functional application requirements. Alloys such as hot-work tool steels, including H11, are well suited for machining and tooling applications. In this work, the authors investigated and compared high-speed direct energy deposition with laser beam source (HS DED-LB/M) processability of a reference H11 alloy and its modified form (H11m). The modification of the alloy was intended to minimize the amount of retained austenite (RA) in as-built microstructure and reduce post-heat treatment steps. The investigative approach included Calphad simulation, rapid alloy blending (modified powder) and process parameter optimization to produce dense parts for microstructure characterization and mechanical properties testing. The results show that while H11 achieved a high relative density > 99.85%, H11m still had cracks parallel to the building direction. The amount of RA was equally reduced from 4.08% in H11 to 1.23% in the H11m. H11 had a comparatively superior average microhardness (591 HV0.5) to H11m (561.5 HV0.5), which can be attributed to the more carbide presence. The martensitic strengthening effect between H11 and H11m can be described as similar.

1. Introduction

Conventional die-making methods are not only costly and time-consuming, but they also have additional drawbacks such as limitations on cooling channel designs and the geometric accuracy of channels and mold cavities, which have an impact on heat dissipation, internal thermal stress and mold life in general [1]. Such limitations can be addressed by utilizing design and manufacturing possibilities of additive manufacturing (AM) which are classified under seven main technology categories by ISO/ASTM 52900 [2]. Among AM processes, laser powder bed fusion (PBF-LB/M) and laser-based direct energy deposition (DED-LB/M) are among the most prevalent [3].
Due to the design freedom of geometry and the ability to shorten lead times, the laser powder bed fusion (PBF-LB/M) approach presents itself as a novel production route for die fabrication that can address these traditional manufacturing challenges [4].
The spectrum of processable materials is impacted by process-inherent particularities such as extremely rapid heating and cooling rates and repeated heating cycles. Rapid cooling rates prevent excessive segregation, allowing some materials with high segregation levels to be utilized effectively in PBF-LB/M [5,6,7]. However, crack prone hot-work tool steels may be difficult to manufacture using PBF-LB/M as a result of thermal stresses and rapid cooling with phase transformations. Hot-work tool steels provide the required hardness for the applications through a hard martensitic matrix and carbide precipitates. In some alloys a certain amount of austenite is retained which will soften the matrix and needs to be transformed into martensite in the post-heat processing steps. Carbide formers in the investigated H11 (1.2343) steel are Mo, Cr and V. Chrome-molybdenum steels like H11 are manufacturable by PBF-LB/M using a preheated platform, not only to decrease thermal stress, but also to minimize the amount of retained austenite [8]. If manufactured without a pre-heated platform, the processing window is very narrow [9]. Other possibilities of minimizing the amount of RA are adapted alloy compositions or AM processes with lower cooling rates such as (HS) DED. As a result, there is a demand for customized lean and low cost hot-work tool steel alloys that are more crack resistant.
One of the means of alloy customization is via rapid alloy development using dry mixed powder blends. This has proven to increase flexibility regarding alloy composition compared to investigating pre-alloyed powders which have lead times of several weeks or months and are expensive due to customized atomization [7,10,11,12,13,14,15]. However, in PBF-LB/M processes, material needs to be supplied batch-wise so that only one alloy can be printed in each build job. This slows down experimental testing by increasing testing time and material needed for alloy testing [16,17]. Computational tools such as Calphad-based ThermoCalc is well documented in literature as a complementary tool for alloy development [18,19]. They are beneficial towards providing understanding of compositional relationship of alloys to phase formations and transformations, crack susceptibility, melting points, liquidus and solidus temperatures, solidification intervals and critical temperature ranges along the path of solidification in both equilibrium and non-equilibrium conditions [20].
Powder-based direct energy deposition (DED) processes offer the possibility of in situ mixing of powders and therefore allow rapid changing and adaption of alloy composition while also reducing the amount of powder feedstock needed [17,21,22].
High-speed DED with a laser beam and metallic powder (HS DED-LB/M) (often referred to as extreme high-speed laser application, EHLA) leads to melting of the powder in flight and a rapid cooling upon impingement of the metal on the substrate. This results in a high cooling rate (104 to 106 K/s) similar to PBF-LB/M processes which are an important feature for alloy development since cooling rates strongly influence the resulting microstructure and therefore part properties [17,23,24,25,26,27,28]. This makes HS DED an attractive candidate for a fast and resource-efficient emulator for other melt-based processes [26,29]. Since sustainability is a topic of increasing importance [30], the applicability of HS DED-LB/M as an emulator should be investigated. Existing research on (non-high-speed) DED-LB/M processes (also referred to as laser metal deposition—LMD) has shown that cooling rates and microstructure vary from PBF-LB/M samples so that these processes cannot be applied as an emulator for PBF-LB/M [14,22,31]. However, first results on HS DED show similarities in dendrite arm spacing and hardness, suggesting similar cooling rates [17,32].
In this work, HS DED-LB/M processing of a reference H11 and a modified version (H11m) using dry-mixing of powders is investigated and samples evaluated regarding relative density, microhardness and microstructure. The modification of the alloy was targeted by minimizing the amount of retained austenite (RA) in as-built microstructure and reducing the need of post-heat treatment steps.

2. Materials and Methods

Commercial H11 powder received from Thyssenkrupp GmbH was used as a reference alloy, while a modified composition (H11m) was obtained by dry-blending according to the composition shown in Table 1 with the help of a powder drum mixer. The goal of the modified alloy was to produce a lean H11 alloy with a reduction in the quantitative amounts of carbide formers while adding austenite stabilizing elements such as Ni and Mn to widen the temperature range of the melt for austenite formation, e.g., with a higher start temperature. The chemical composition of both powders, H11 and H11m, were determined using the inductively coupled plasma optical emission spectroscopy (ICP-OES). Particle size analysis, which was carried out with a Retsch GmbH CAMSIZER X2, recorded the d50, sphericity, aspect ratio of 30.80 µm, 0.808, 0.895 for H11m and 30.1 µm, 0.913 and 0.908 for H11, respectively. The phase simulations of both alloy compositions were performed with the Calphad-based software ThermoCalc version 2022 using the TCFE10 database. Calculations based on the Scheil non-equilibrium solidification model was performed to investigate how the modification of the reference alloy (H11) with Ni and Mn in the modified alloy (H11m) influences the phase stability of the FCC, the solidification path (melting point, liquidus and solidus temperatures) and carbide formation.
The HS DED-LB/M samples were manufactured on a pE3D tripod handling system designed by Ponticon GmbH. The tripod handling system allows for high accelerations up to 5 g which are necessary to achieve process speeds of up to 200 m/min in the build chamber. The laser beam source was a diode laser LDF 8000-30 (wavelength λ = 900–1080 nm) with a maximum output power of 8 kW by Laserline GmbH. The optical system is a OTZ zoom optic by Laserline GmbH, Mülheim-Kärlich, Germany. Cuboids (10 × 70 × 2–4 mm3, W × L × H) were built onto low-alloyed steel substrates. Process speed and laser power of the produced HS DED-LB/M samples are given in Table 2, with the process parameters of the H11 sample being the reference to produce samples with the modified H11. The other process parameters were fixed across all samples. Track displacement was 0.35 mm, powder mass flow was 18.7 g/min, carrier and shielding gas flow were 8 and 14 L/min, respectively, laser spot diameter was 1.2 mm and the number of layers was 40. Argon was used as a carrier and local shielding gas. The applied scanning scheme is unidirectional in the x-direction (long dimension of the cuboids, see Figure 1b) to account for the needed acceleration/deceleration path and to reduce the amount of powder wasted during the acceleration/deceleration periods. All layers were printed in the same way. Figure 1d shows the interaction between laser beams and the powder particles. In HS DED-LB/M, powder particles are generally melted in-flight and solidify upon impinging onto the substrate.
Specimens for microstructure and hardness analysis were cut with a cut-off machine on a plane parallel to the build-up direction, see Figure 1a. Relative density was measured using a VHX-6000 digital microscope by Keyence Corporation, Osaka, Japan. Microstructural characterizations were conducted with a scanning electron microscope (SEM) by Carl Zeiss AG, Oberkochen, Germany, and the field emission gun with Inca X-sight energy dispersive spectroscopy (EDS)/electron backscatter diffraction (EBSD) detectors by Oxford Instruments, Abingdon, UK. Hardness measurements (HV0.5) were performed on an automatic hardness tester Qness 60 A+ Evo by ATM Qness GmbH, Mammelzen, Germany. Three rows of five indentations were placed on each sample, see Figure 1c. Hardness and SEM analyses were performed on individual samples.

3. Results

3.1. Powder Particle Characterization

The technical properties of the H11 powder such as particle size distribution (PSD) as well as flowability, which was estimated on the basis of Hausner ratio, have been well reported in our previous publication [8]. Figure 2 shows the inverse pole figure map (Figure 2a), band contrast image (Figure 2b,c), phase-map (Figure 2d) as well as energy dispersive spectroscopy (EDS) map (Figure 2e) of the cross-section of powder particles of H11. While martensite and retained austenite (1.45% RA) can already be seen formed in the powder particle (Figure 2d), microsegregations of vanadium (V) and molybdenum (Mo) in the interdendritic regions after the gas atomization process can also be observed. Under gas atomization process conditions, high cooling rates in the order of 104–106 K/s [33] lead to a non-equilibrium solidification and a metastable microstructure. Phase transformation and microsegregational behavior during the droplet solidification may be predictive of the same during the highly non-equilibrium AM processes such as PBF-LB/M and HS DED-LB/M.

3.2. Scheil-Simulation

Figure 3 shows the classical Scheil phase simulation plot of both H11 and H11m superimposed on each other, simulated based on the composition as described on Table 1. It can be deduced from the reference H11 alloy that the formation of δ-ferrite (BCC_A2) starts at 1468 °C and ends at 1405 °C. Between 1405–1265 °C, the γ-austenite (FCC_A1) and δ-ferrite form at the same time, followed by the temperature interval in which only γ forms (1256–1245 °C). During the last stages of the solidification, M6C, M7C3, MC- cementite carbides are expected to be formed in the austenitic matrix. In the H11m alloy with less Cr (5.61 wt.%), Mo (1.19 wt.%) and V (0.41 wt.%), not only is there a lower solidification interval but also a reduction in the amount of carbide buildup. Only M7C3 carbides are expected from the Scheil calculations. While the δ-ferrite (1454–1439 °C) forms at a shorter temperature range, γ and δ-ferrite together form within a wider temperature of between 1439–1271 °C compared to the reference alloy. Similarly, the γ-austenite only forms earlier at a higher temperature of 1271 °C and is more stable over a wide temperature range until 1228 °C compared to the reference alloy.

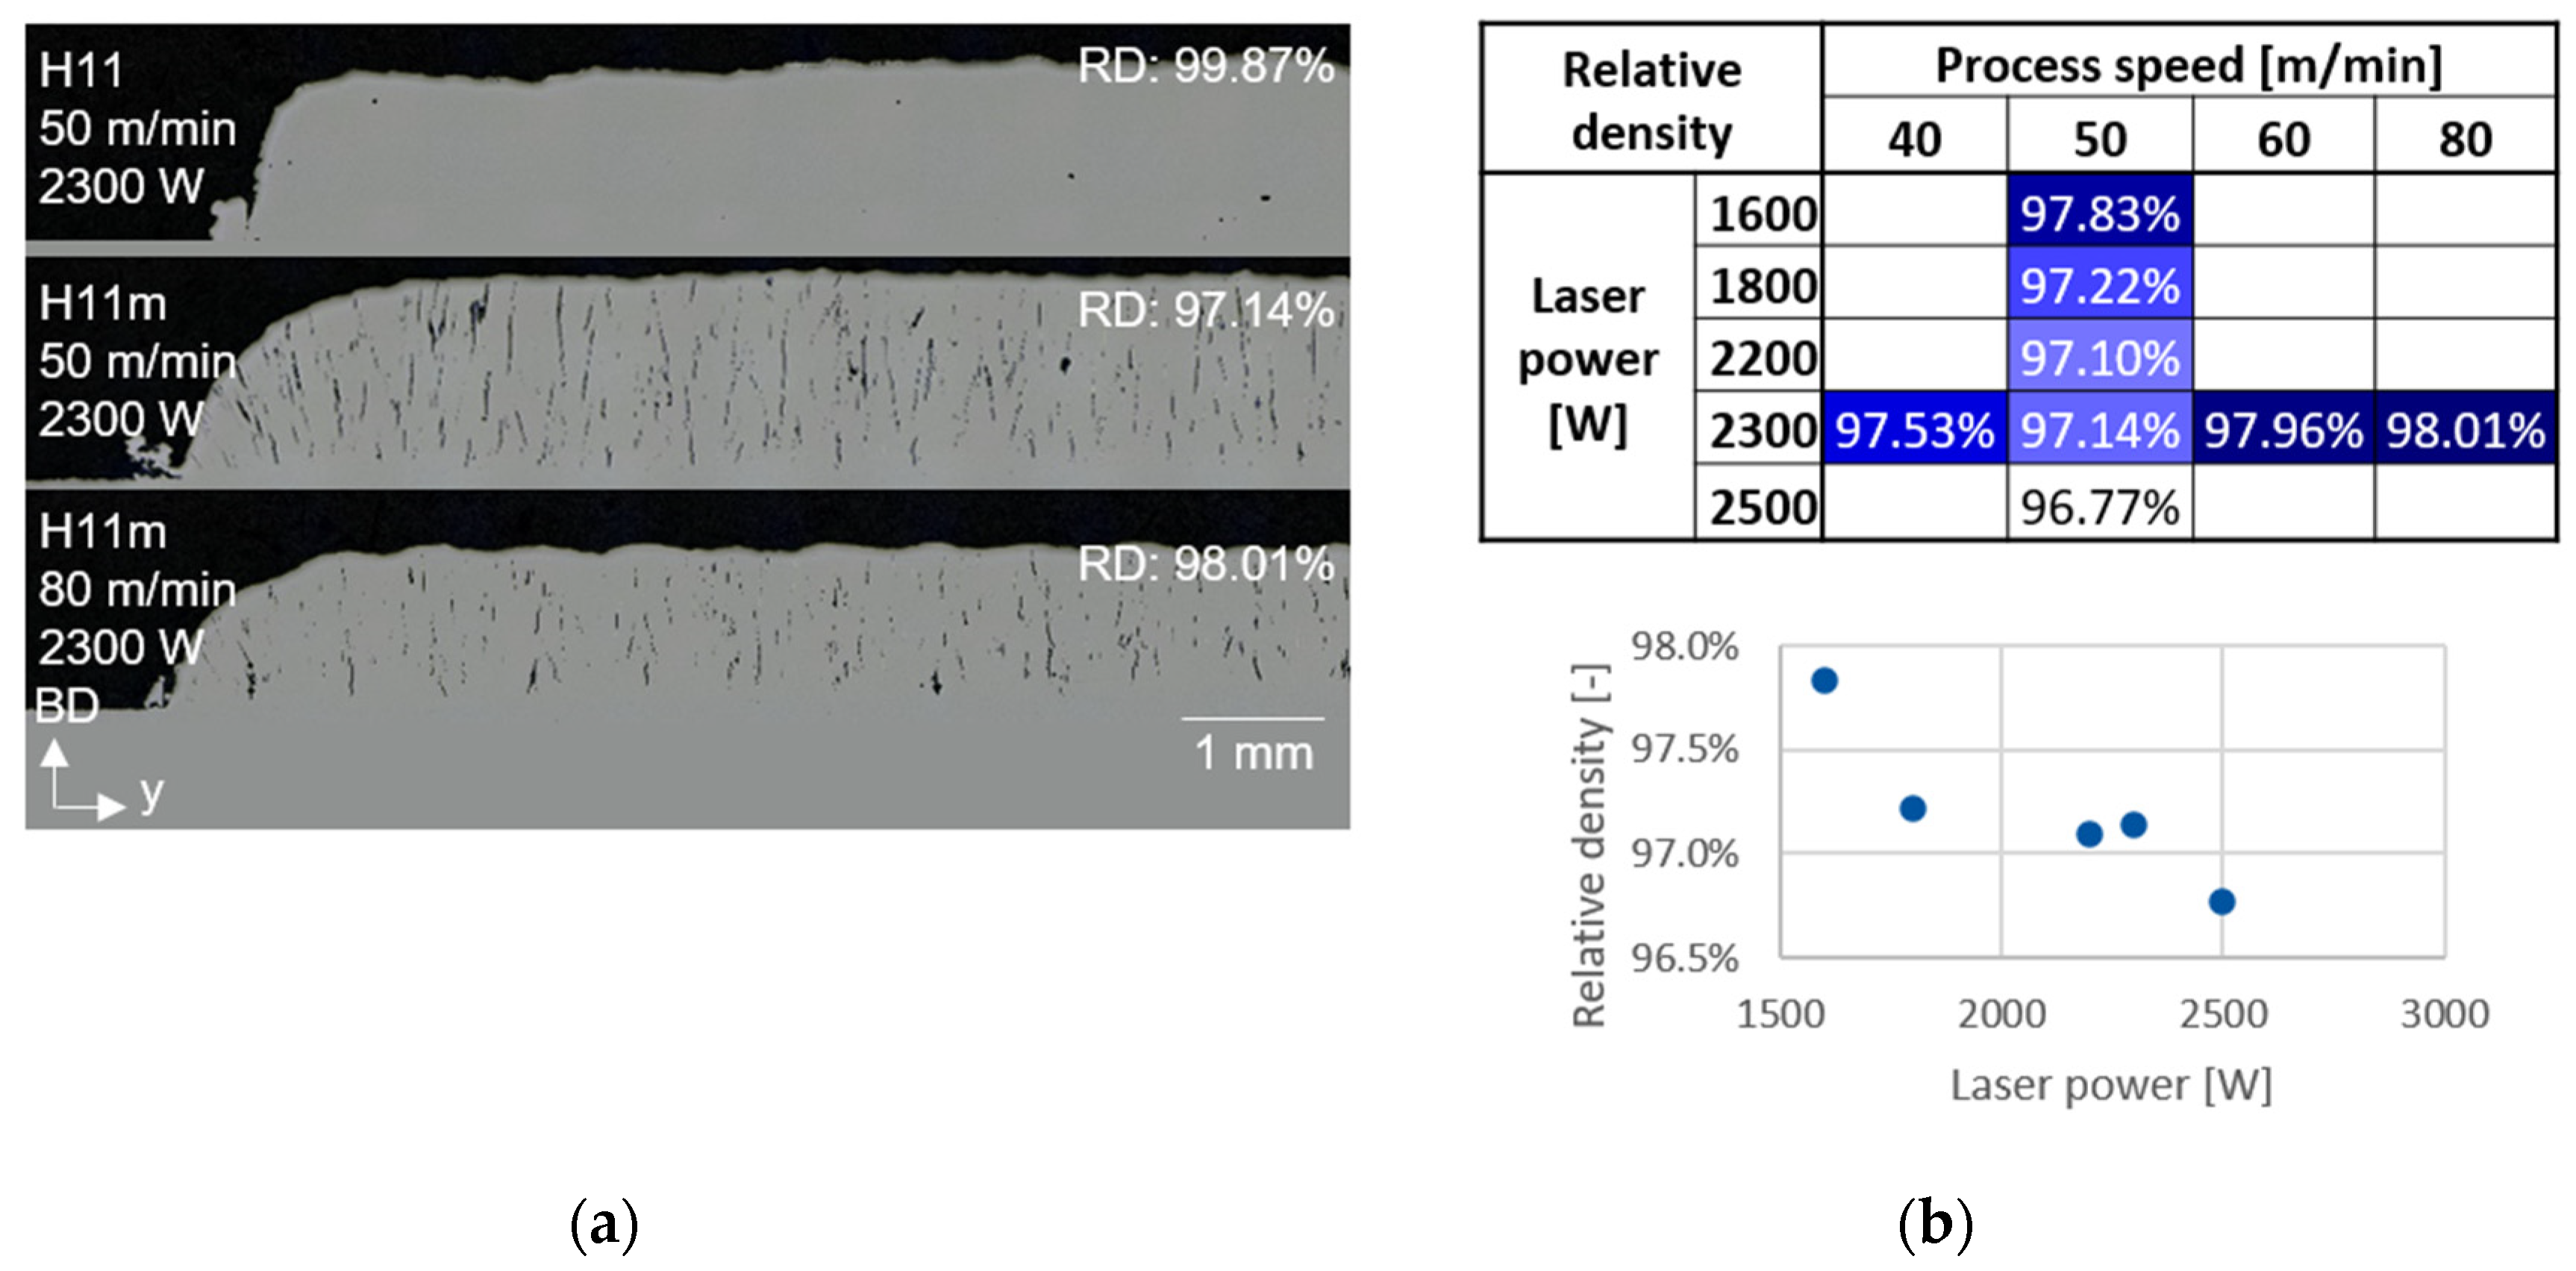
3.3. Process Parameters and Relative Density

The unetched embedded cross-sections of selected samples (H11 reference sample; H11m with the same parameter set; H11m sample with the highest relative density) are shown in Figure 4b. Extensive crack propagation parallel to the building direction can be observed in samples manufactured from H11m. Cracks make up the bulk of defects, while gas pores are few.
Relative densities based on images obtained by light optical microscopy were determined as shown in Figure 4b. For this purpose, the images were binarized to analyze the relative area occupied by pores and cracks. The reference sample (H11) has a relative density of 99.87%. The maximum relative density of samples produced with the modified alloy was 98.01%. Reduction in the laser power starting from the reference parameter set (2300 W) resulted in an increase in relative density to 97.83% at 1600 W, the increase in laser power led to a decrease in relative density (96.77% at 2500 W). Increasing the process speed resulted in higher relative densities up to 98.01% at 80 m/min process speed. This is the highest relative density observed in the sample pool manufactured with the modified alloy.

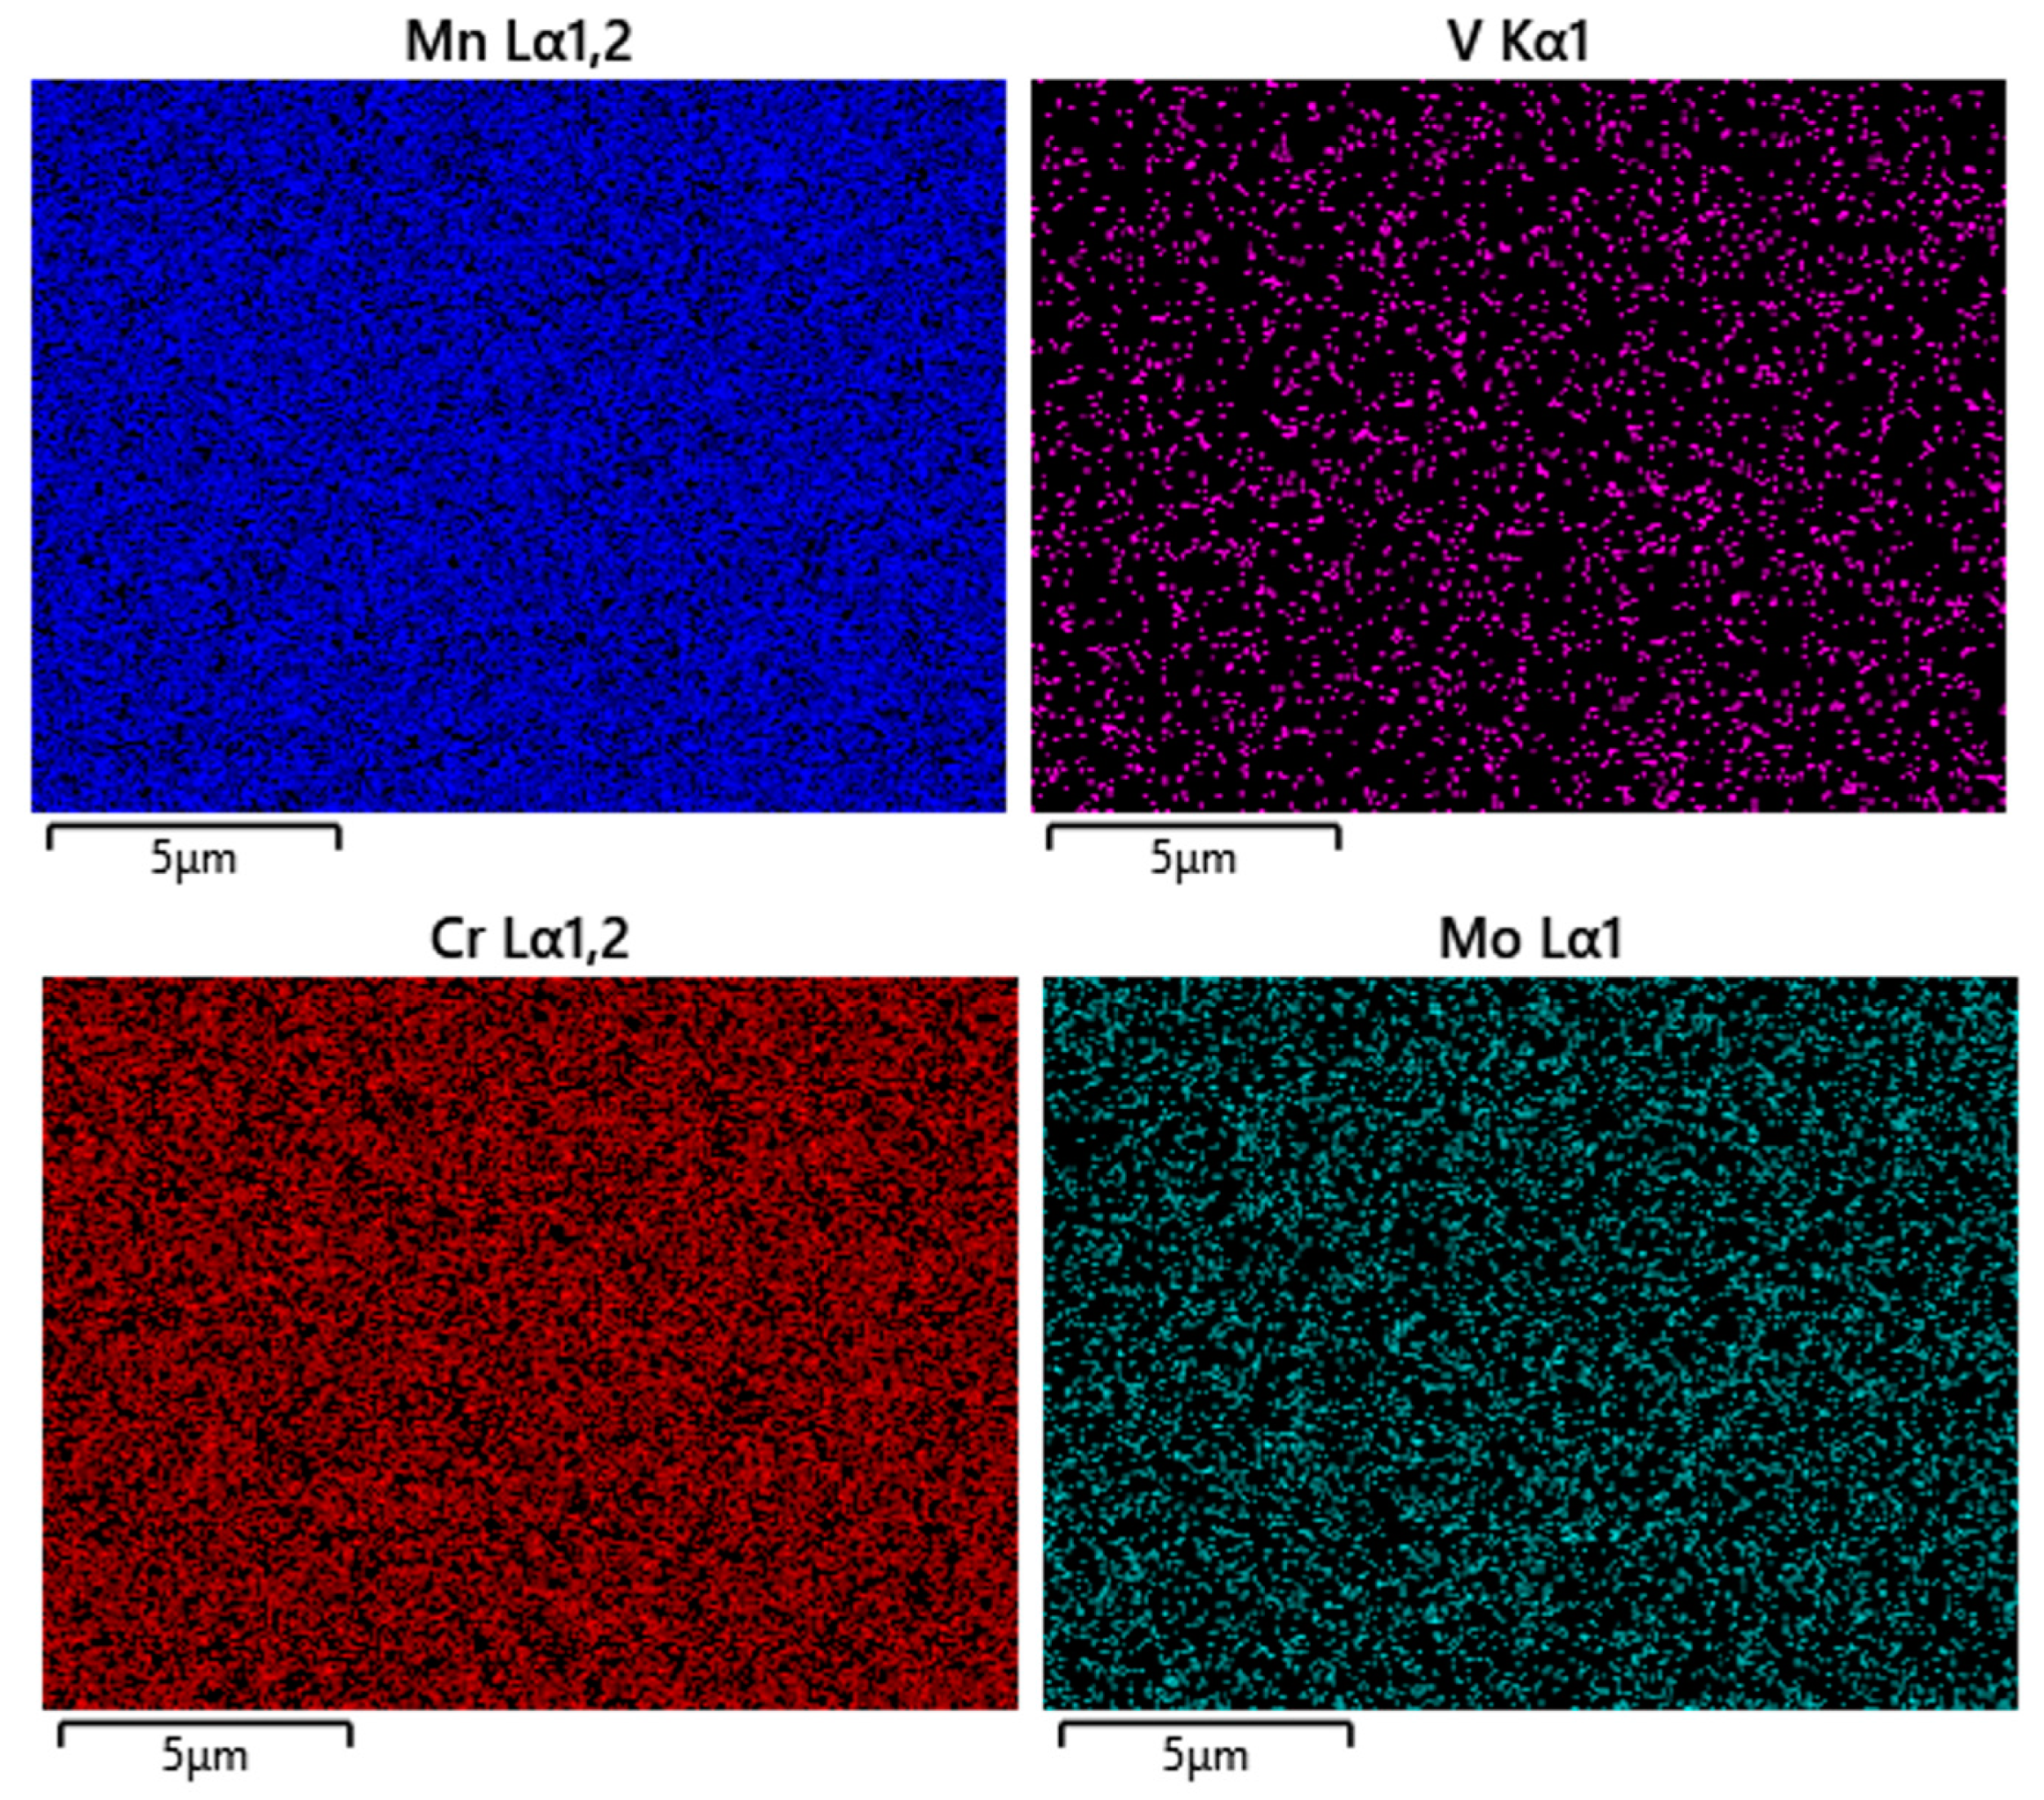
3.4. Microstructure, Segregation and Phase Characterization of HS DED-LB/M-Samples

Etched (Nital 5%) microstructures of both H11 (2300 W, 50 m/min) and H11m (2300 W, 50 m/min) alloys are shown in the light optical micrographs (LOM) in Figure 5. While in the reference alloy, the elongated cell structures are seen to be truncated at the melt pool boundary and strong epitaxial growth of cell structures can be observed in the modified alloy. Epitaxial growth typically takes its driving force from large thermal gradients which drive grain and subgrain structures to outgrow others when there is no barrier to nucleation [34,35]. As a result of directional solidification along the building direction of the HS DED-LB/M process, cell structures of cubic materials typically have a preferential growth along the <100> direction, which is the direction of heat flow. As more layers are built upon each other, these cell structures align themselves along the direction of heat flow, most particularly at the centerline of the melt pool where the heat flow is expected to be most intense. If there is no nucleation barrier or slowdown of the intensity of thermal gradient, strong epitaxial growth of the cell structures can be observed as seen in the modified alloy. One requirement (among others) for epitaxial growth is a melt pool without disturbances through turbulent melt pool movement and a local homogeneous element distribution. The strong epitaxial effect in the modified alloy can be presumed to have been exacerbated by the amount of Ni and the lower amount of carbide formers in the H11m.
In Figure 6, as shown below, the cell structures are characterized in both alloys using scanning electron microscopy. In Figure 6a–c, the truncating of the cell structures at the melt pool boundary, the interconnected cell network at the top of the samples and the seeming coarsening and disintegration of the cell network at the bottom of the sample can be observed (attributed to the heat flux intensity at the bottom). Similar growth behavior in the cell structures can be seen in the modified alloy in Figure 6c,d, except with the epitaxial growth in Figure 6d. In both alloys, nanosized carbides can be observed both in the matrix and on the cell boundaries.
Figure 7 shows H11m-EDS- images of the elements nickel (Ni), vanadium (V), chromium (Cr) and molydenum (Mo) detected and mapped. As shown in Figure 7, Nickel was not homogenously distributed in the matrix, almost no microsegregation of V is seen, and for the elements Cr and Mo micro segregations were not detected on the cell boundaries with this examination method.
In Figure 8, EDS images show the more homogeneous element distribution of H11 reference alloy in contrast to H11m. Locally, almost indetectable small enrichments of V and Mo can be detected. Since the reference alloy is a pre-alloyed composition and is expected to have a better homogeneity than the rapidly blended H11m alloy, a more homogeneous elemental distribution could be expected.
EBSD-phasemaps shown in Figure 9 highlight varying quantitative amounts of FCC in both the H11 and H11m alloys. While the reference alloy H11 showed about 4.08% of austenite, the austenite amount in the H11m was 1.23%. In the modified alloy, areas which showed strong Ni segregations were found to have high austenite amount of about 4.89% (see Supplementary Materials).

3.5. Microhardness Tests

The average HV0.5 hardness values of the investigated samples are shown in Figure 10. The average microhardness of the standard H11 sample is 591 HV0.5. The average microhardness of the samples produced with the modified H11 is smaller overall, ranging from 555 to 571 HV0.5 with standard deviations of 15 to 28 HV0.5 (see Figure 10a). In this range of process speed, microhardness seems to increase slightly with increasing process speed. However, the increase lies within the standard deviation of the measurements.
The microhardness does not seem to depend on the position (top, middle or bottom) in the sample systematically (see Figure 10b). The microhardness average in the top and bottom regions across all samples is 573 HV0.5 and 563 HV0.5, respectively. Deviations are therefore within measurement and standard deviation.

4. Discussion

4.1. Scheil, Solidification and Powder

Below certain temperatures, the austenitic phase is not a thermodynamically stable phase (see Figure 3). This means that a transformation from austenite to martensite in the already solidified material must take place. Conditions for martensitic transformation are given in the processes investigated in this work—powder atomization and DED-LB/M of H11 and H11 m. The manifold and complex thermal conditions of additive manufacturing and atomizing processes result in microstructures that are similarly complex and difficult to predict. The different cooling conditions and heat cycles generate different microstructures. Scheil simulation models provide help to understand the phase formation and evolution under metastable conditions. However, they do not reflect the process conditions and kinetics of the transformations. To complement the results of the Scheil-simulations and for a better understanding of the microstructure formation, the powder and HS DED-LB/M microstructures were investigated in tandem with the simulation.
Below the martensitic start temperature, the diffusionless shear transformation in the austenitic cell colonies to martensite is accompanied by a volume extension through lattice expansion so that local lattice stresses can inhibit the transformation and some austenitic phase remains as part of the microstructure, even if the martensite finish is reachable. This was shown in the powder particles (Figure 2d) and DED-LB/M (Figure 9) as well as 3.4 and HS DED-LB/M-results.

4.2. Discussion Microstructure Analysis: Phase Characterization, Segregations, Relative Density

The amount of RA was the highest in H11 (ca. 4%), followed by the powder particles (ca. 1.45%) and the H11m (ca. 1.2%) samples. This amount of retained austenite (RA) can influence the overall performance of the built part because the austenitic phase is softer than the martensitic matrix. EBSD-phasemap of powder particle (Figure 2) and H11 and H11m HS DED-LB/M samples (Figure 9) show a predominantly martensitic microstructure. The RA leads to an inhomogeneous microstructure and consequently to inhomogeneous part properties. Under special thermal conditions, RA can transform to martensite and may lead to a brittle microstructure.
Several hypotheses are given to explain different amounts of RA. During AM processes, as a result of the remelting of the underlying substrate layers typical with the process, some of the martensite may re-transform back into austenite, which upon rapid cooling, again below the martensite start temperature, may not reach the martensite finish temperature and becomes stabilized by diffused carbon from the martensite therefore leaving a martensitic microstructure with some retained austenite [36]. However, HS DED-LB/M processes typically remelt only very little (<5 µm) of the underlying layers compared to PBF-LB/M (40 up to 550 µm) [37,38].
The higher the localized segregation level in the microstructure, the steeper the expected gradient of segregating atoms, most likely grain or cell boundaries, so that the austenitic lattice is stabilized. In general, martensite formation in various processes (AM and atomization) is only possible if the chemical composition is combined with the necessary cooling rate, therefore, an inhomogeneous local element distribution may lead to stabilization of the austenite and RA.
The experiments showed that slowing down the cooling rate of the process as well as modifying the chemical composition can decrease the amount of RA. Lowering the cooling rate leaves more time for diffusion to a homogeneous element distribution. In the PBF-LB/M-process, the amount of RA could be lowered from 12% to 1.1% by using a heating plate to lower the cooling rate. Also, the modified composition led to a decrease of the RA amount.
In the DED-LB/M-process, the RA amount of both alloys was lower than in the PBF-LB/M-process, which can be traced back to the lower cooling rate of the process. Also, here the modified alloy showed a lower RA compared to the standard alloy.
In PBF-LB/M processes, melt pool depth can be up to seven times the layers thickness which allows the three powder types (H11, Ni and Mn powder) to mix in the melt [38]. In Raffeis et al., the melt pool depth was 3.3 times the layer thickness [8]. In HS DED-LB/M, there is only a very thin melt film on the substrate (<5 µm according to [37]) and the powder particles are melted in flight and solidify rapidly upon impinging onto the substrate. Time in the melted state is too short and contact between the three powder types is equally short for homogenous mixing of the melt. Therefore, the solidification behavior could vary from the Calphad simulated composition. The manufacturability of H11 and H11m using HS DED-LB/M because of the interactions of the three powder types and the different alloy composition. Koss et al. [17] found that changes in powder volume flow due to differing powder densities can impact manufacturability due to shielding effects of the powder particles. The densities of H11 (7.81 g/cm3) and Mn (7.21 g/cm3) are close, but Ni has a higher density 8.9 cm3.
Processing parameters need to be adjusted for H11m in comparison to H11. This aligns with findings in previous works on PBF-LB/M manufacturing of H11 and H11m [8].
In the investigated range of process parameters (1600 to 2300 W—laser power, 40 to 80 m/min—process speed), a lower line energy density El appears to lead to reduced amounts of cracks and, therefore, a higher relative density. The line energy density is defined as the quotient of laser power (W) and process speed (m/s):
E l = P l v p
Therefore, in future investigations, samples should be manufactured using lower laser power and higher process speed to reduce fracturing, leading both to lower line energy density.

4.3. Microhardness

The H11 reference steel showed a higher hardness and a higher amount of RA than the H11m which is attributed to a higher amount of carbides in the alloy. The observed small differences in the amounts of RA do not influence the hardness of the alloys. This is different from the PBF-LB/M investigations in [8] where the difference of RA was often about 10%. The lower hardness values can also be explained with the alloy composition: H11m contains fewer carbide formers than H11 which would lead to fewer carbides in the matrix and, according to Scheil calculations, only M7C3 carbides are expected.
In Figure 11a, the correlation between relative density and microhardness is shown. With higher relative density, a slightly higher microhardness is observed (R2 = 0.76). This could explain the higher hardness (591 HV0.5) of the H11 sample compared to the H11m samples (561.5 HV0.5).
In Figure 11b, microhardness in H11 and H11m samples manufactured by HS DED-LB/M and PBF-LB/M are contrasted. PBF-LB/M manufactured samples [8] were found to have microhardness in the same range as the HS DED-LB/M manufactured samples but slightly higher for H11m (607 HV 0.5—H11m, 565 HV0.5–H11). Since the relative density of all PBF-LB/M samples was >99.7%, the lower microhardness in PBF-LB/M for H11 is a result of the higher amount of the soft RA compared to H11m. Comparing the standard H11 samples of PBF-LB/M and HS DED-LB/M which have similar relative densities (>99.7 and 99.87%, respectively), the hardness of the HS DED-LB/M sample is higher. This is attributed to changes in microstructure related to varying solidification conditions resulting in less RA.
Standard deviation of microhardness is notably higher in PBF-LB/M samples (>50 HV0.5 vs. <25 HV0.5). This could be related to varying microhardness depending on measurement positions in PBF-LB/M samples, where five indentations each were performed at the top, middle and bottom of the samples. Since the height of the PBF samples is greater (10 vs. 2–4 mm) and manufacturing time is higher (2–3 h build job length vs. <5 min sample manufacturing time), the influence of the process-inherent cycling heating could lead to varying microstructure and, therefore, microhardness in upper and lower parts of the PBF-LB/M samples.

5. Conclusions and Outlook

Parameters for crack-free DED-LB/M samples for H11 were determined, while parameters for crack-free manufacturing of H11m were difficult to obtain and still must be enhanced. The matrix of all samples (powder particles, H11 reference and H11m) which underwent different cooling regimens consisted of martensite containing carbides and RA.
Hardness measurements obtained from HS DED-LB/M manufactured samples are in the range of PBF-LB/M samples (591 vs. 565 HV0.5 for H11, 555 vs. 607 for H11m), further supporting a potential application of HS DED-LB/M as a fast and resource-efficient emulator for PBF-LB/M, for example: in the field of alloy development.
However, the application of dry-mixed powders for HS DED-LB/M poses the challenge of inhomogeneous elemental distribution in the manufactured samples. This challenge must be met to utilize HS DED-LB/M as a rapid alloy development tool. To tackle inhomogeneous mixing of the three powder types, laser remelting in between layers could promote mixing in a melt pool of sufficient volume.
Another way is to investigate pre-alloyed powder where all particles have the same composition, meaning that mixing during manufacturing is not necessary. However, the manufacturing of pre-alloyed powders is costly and time-consuming. Research-scale powder atomizers could be used for this purpose.
The differences in cooling conditions in HS DED-LB/M processing should be established and linked to process parameters. Once these causal relationships are known, HS DED-LB/M process parameters should be adapted to match solidification conditions of PBF-LB/M more closely. This allows for process differences such as remelting in PBF-LB/M to be investigated upon their influence on material properties.
The RA of H11 processed via HS DED-LB/M could be lowered from ca. 4% to ca. 1.2% in H11m.
Extensive characterization of nanosized carbides was not in the scope of the present work and since their influence is believed to have accounted for the high hardness properties of the reference alloy (H11) compared to H11m as a result of the presence of quantitatively high carbide formers, the carbide type, size and volume fraction has to be further characterized and optimized with parameters in order to further minimize RA via HS DED-LB/M.
Practical application of the investigated approach can be fast and resource-efficient additive manufacturing of e.g., inserts for die-casting with integrated cooling channels for lower cycle times. Due to local powder supply, chemical composition of the alloy could be adapted depending on local requirements of properties.

Supplementary Materials

The following supporting information can be downloaded at: https://www.mdpi.com/article/10.3390/met14010079/s1, Figure S1: EBSD-phasemap (left) and EDS mapping of Ni (right) of H11m reference alloy, and the quantitative FCC amount.

Author Contributions

Conceptualization, M.-N.B., I.R. and F.A.-K.; methodology, M.-N.B., I.R. and F.A.-K.; software, I.R. and F.A.-K.; validation, M.-N.B., I.R. and F.A.-K.; formal analysis, M.-N.B., I.R. and F.A.-K.; investigation, M.-N.B., I.R. and F.A.-K.; resources, J.H.S. and A.B.-P.; data curation, M.-N.B., I.R. and F.A.-K.; writing—original draft preparation, M.-N.B., I.R. and F.A.-K.; writing—review and editing, J.H.S. and A.B.-P.; visualization, M.-N.B., I.R. and F.A.-K.; supervision, J.H.S. and A.B.-P.; project administration, M.-N.B. and I.R.; funding acquisition, J.H.S. and A.B.-P. All authors have read and agreed to the published version of the manuscript.

Funding

Funded by the Deutsche Forschungsgemeinschaft (DFG, German Research Foundation) under Germany’s Excellence Strategy—EXC-2023 Internet of Production—390621612.

Data Availability Statement

The data presented in this study are available in the article.

Conflicts of Interest

The authors declare no conflicts of interest. The funders had no role in the design of the study; in the collection, analyses or interpretation of data; in the writing of the manuscript; or in the decision to publish the results.

References

  1. Ren, B.; Lu, D.; Zhou, R.; Li, Z.; Guan, J. Preparation and mechanical properties of selective laser melted H13 steel. J. Mater. Res. 2019, 34, 1415–1425. [Google Scholar] [CrossRef]
  2. ISO/TC 261; Additive Manufacturing: General Principles, Fundamentals and Vocabulary. 2nd ed. ISO: Geneva, Switzerland, 2021; 25.030 01.040.25 (52900:2021).
  3. Vafadar, A.; Guzzomi, F.; Rassau, A.; Hayward, K. Advances in Metal Additive Manufacturing: A Review of Common Processes, Industrial Applications, and Current Challenges. Appl. Sci. 2021, 11, 1213. [Google Scholar] [CrossRef]
  4. Yan, J.J.; Zheng, D.L.; Li, H.X.; Jia, X.; Sun, J.F.; Li, Y.L.; Qian, M.; Yan, M. Selective laser melting of H13: Microstructure and residual stress. J. Mater. Sci. 2017, 52, 12476–12485. [Google Scholar] [CrossRef]
  5. Jain, A.; Ong, S.P.; Hautier, G.; Chen, W.; Richards, W.D.; Dacek, S.; Cholia, S.; Gunter, D.; Skinner, D.; Ceder, G.; et al. Commentary: The Materials Project: A materials genome approach to accelerating materials innovation. APL Mater. 2013, 1, 011002. [Google Scholar] [CrossRef]
  6. Lachmayer, R.; Rettschlag, K.; Kaierle, S. Konstruktion für die Additive Fertigung 2020; Springer: Berlin/Heidelberg, Germany, 2021. [Google Scholar]
  7. Haase, C.; Tang, F.; Wilms, M.B.; Weisheit, A.; Hallstedt, B. Combining thermodynamic modeling and 3D printing of elemental powder blends for high-throughput investigation of high-entropy alloys—Towards rapid alloy screening and design. Mater. Sci. Eng. A 2017, 688, 180–189. [Google Scholar] [CrossRef]
  8. Raffeis, I.; Adjei-Kyeremeh, F.; Ewald, S.; Schleifenbaum, J.H.; Bührig-Polaczek, A. A Combination of Alloy Modification and Heat Treatment Strategies toward Enhancing the Properties of LPBF Processed Hot Working Tool Steels (HWTS). J. Manuf. Mater. Process 2022, 6, 63. [Google Scholar] [CrossRef]
  9. Megahed, S.; Koch, R.; Schleifenbaum, J.H. Laser Powder Bed Fusion Tool Repair: Statistical Analysis of 1.2343/H11 Tool Steel Process Parameters and Microstructural Analysis of the Repair Interface. J. Manuf. Mater. Process. 2022, 6, 139. [Google Scholar] [CrossRef]
  10. Zhao, C.; Wang, Z.; Li, D.; Xie, M.; Kollo, L.; Luo, Z.; Zhang, W.; Prashanth, K.G. Comparison of additively manufacturing samples fabricated from pre-alloyed and mechanically mixed powders. J. Alloys Compd. 2020, 830, 154603. [Google Scholar] [CrossRef]
  11. Koptyug, A.; Popov, V.V.; Botero Vega, C.A.; Jiménez-Piqué, E.; Katz-Demyanetz, A.; Rännar, L.-E.; Bäckström, M. Compositionally-tailored steel-based materials manufactured by electron beam melting using blended pre-alloyed powders. Mater. Sci. Eng. A 2020, 771, 138587. [Google Scholar] [CrossRef]
  12. Garrard, R.; Lynch, D.; Carter, L.N.; Adkins, N.J.; Gie, R.; Chouteau, E.; Pambaguian, L.; Attallah, M.M. Comparison of LPBF processing of AlSi40 alloy using blended and pre-alloyed powder. Addit. Manuf. Lett. 2022, 2, 100038. [Google Scholar] [CrossRef]
  13. Ewald, S.; Kies, F.; Hermsen, S.; Voshage, M.; Haase, C.; Schleifenbaum, J.H. Rapid Alloy Development of Extremely High-Alloyed Metals Using Powder Blends in Laser Powder Bed Fusion. Materials 2019, 12, 1706. [Google Scholar] [CrossRef] [PubMed]
  14. Marchese, G.; Garmendia Colera, X.; Calignano, F.; Lorusso, M.; Biamino, S.; Minetola, P.; Manfredi, D. Characterization and Comparison of Inconel 625 Processed by Selective Laser Melting and Laser Metal Deposition. Adv. Eng. Mater. 2017, 19, 1600635. [Google Scholar] [CrossRef]
  15. Ewald, S.; Schaukellis, M.; Koehnen, P.; Schleifenbaum, J.H. Laser Powder Bed Fusion of Advanced High-Strength Steels—Modification of Deformation Mechanisms by Increasing Stacking Fault Energy. Berg. Huettenmaenn Monatsh 2019, 164, 127–132. [Google Scholar] [CrossRef]
  16. Schneck, M.; Horn, M.; Schmitt, M.; Seidel, C.; Schlick, G.; Reinhart, G. Review on additive hybrid- and multi-material-manufacturing of metals by powder bed fusion: State of technology and development potential. Prog. Addit. Manuf. 2021, 6, 881–894. [Google Scholar] [CrossRef]
  17. Koß, S.; Ewald, S.; Bold, M.-N.; Koch, J.H.; Voshage, M.; Ziegler, S.; Schleifenbaum, J.H. Comparison of the EHLA and LPBF Process in Context of New Alloy Design Methods for LPBF. Adv. Mater. Res. 2021, 1161, 13–25. [Google Scholar] [CrossRef]
  18. Kolli, S.; Javaheri, V.; Ohligschläger, T.; Kömi, J.; Porter, D. The importance of steel chemistry and thermal history on the sensitization behavior in austenitic stainless steels: Experimental and modeling assessment. Mater. Today Commun. 2020, 24, 101088. [Google Scholar] [CrossRef]
  19. Costa e Silva, A. Challenges and opportunities in thermodynamic and kinetic modeling microalloyed HSLA steels using computational thermodynamics. Calphad 2020, 68, 101720. [Google Scholar] [CrossRef]
  20. Hyer, H.; Zhou, L.; Park, S.; Huynh, T.; Mehta, A.; Thapliyal, S.; Mishra, R.S.; Sohn, Y. Elimination of extraordinarily high cracking susceptibility of aluminum alloy fabricated by laser powder bed fusion. J. Mater. Sci. Technol. 2022, 103, 50–58. [Google Scholar] [CrossRef]
  21. Vecchio, K.S.; Dippo, O.F.; Kaufmann, K.R.; Liu, X. High-throughput rapid experimental alloy development (HT-READ). Acta Mater. 2021, 221, 117352. [Google Scholar] [CrossRef]
  22. Steen, W.M.; Vilar, R.M.; Watkins, K.G.; Ferreira, M.G.S.; Carvalho, P.; Sexton, C.L.; Pontinha, M.; McMahon, M. Alloy System Analysis by Laser Cladding; AIP Publishing: Melville, NY, USA, 1992; pp. 278–287. [Google Scholar] [CrossRef]
  23. Zhang, D.; Sun, S.; Qiu, D.; Gibson, M.A.; Dargusch, M.S.; Brandt, M.; Qian, M.; Easton, M. Metal Alloys for Fusion-Based Additive Manufacturing. Adv. Eng. Mater. 2018, 20, 1700952. [Google Scholar] [CrossRef]
  24. Gokuldoss, P.K. Design of next-generation alloys for additive manufacturing. Mater. Des. Process. Commun. 2019, 1, 34. [Google Scholar] [CrossRef]
  25. Boyce, B.L.; Uchic, M.D. Progress toward autonomous experimental systems for alloy development. MRS Bull. 2019, 44, 273–280. [Google Scholar] [CrossRef]
  26. Bold, M.-N.; Schmitt, N.; Schleifenbaum, J.H. Application of the 3D-EHLA Process for Agile Alloy Development; Universitätsbibliothek der RWTH Aachen: Aachen, Germany, 2022. [Google Scholar] [CrossRef]
  27. Li, T.; Zhang, L.; Chen, G.; Pirch, N.; Schopphoven, T.; Gasser, A.; Poprawe, R. A combined heat source model for the prediction of residual stress post extreme high-speed laser material deposition. J. Manuf. Process. 2022, 78, 265–277. [Google Scholar] [CrossRef]
  28. Raffeis, I.; Adjei-Kyeremeh, F.; Vroomen, U.; Suwanpinij, P.; Ewald, S.; Bührig-Polazcek, A. Investigation of the Lithium-Containing Aluminum Copper Alloy (AA2099) for the Laser Powder Bed Fusion Process [L-PBF]: Effects of Process Parameters on Cracks, Porosity, and Microhardness. JOM 2019, 71, 1543–1553. [Google Scholar] [CrossRef]
  29. Chen, Y.; Zhang, X.; Parvez, M.M.; Liou, F. A Review on Metallic Alloys Fabrication Using Elemental Powder Blends by Laser Powder Directed Energy Deposition Process. Materials 2020, 13, 3562. [Google Scholar] [CrossRef] [PubMed]
  30. Petschow, U.; Ferdinand, J.P.; Dickel, S.; Flämig, H.; Steinfeldt, M.; Worobei, A. Dezentrale Produktion, 3D-Druck und Nachhaltigkeit: Trajektorien und Potenziale Innovativer Wertschöpfungsmuster Zwischen Maker-Bewegung und Industrie 4.0; neue Ausg; Institut für Ökologische Wirtschaftsforschung Berlin: Berlin, Germany, 2014. [Google Scholar]
  31. Wang, K.; Du, D.; Liu, G.; Pu, Z.; Chang, B.; Ju, J. High-temperature oxidation behaviour of high chromium superalloys additively manufactured by conventional or extreme high-speed laser metal deposition. Corros. Sci. 2020, 176, 108922. [Google Scholar] [CrossRef]
  32. Wang, K.; Du, D.; Liu, G.; Pu, Z.; Chang, B.; Ju, J. A study on the additive manufacturing of a high chromium Nickel-based superalloy by extreme high-speed laser metal deposition. Opt. Laser Technol. 2021, 133, 106504. [Google Scholar] [CrossRef]
  33. Fang, P.; Xu, Y.; Li, X.; Chen, Y. Influence of Atomizing Gas and Cooling Rate on Solidification Characterization of Nickel-based Superalloy Powders. Rare Met. Mater. Eng. 2018, 47, 423–430. [Google Scholar] [CrossRef]
  34. Mohammadpour, P.; Yuan, H.; Phillion, A.B. Microstructure evolution of Inconel 625 alloy during single-track Laser Powder Bed Fusion. Addit. Manuf. 2022, 55, 102824. [Google Scholar] [CrossRef]
  35. Zhou, L.; Pan, H.; Hyer, H.; Park, S.; Bai, Y.; McWilliams, B.; Cho, K.; Sohn, Y. Microstructure and tensile property of a novel AlZnMgScZr alloy additively manufactured by gas atomization and laser powder bed fusion. Scr. Mater. 2019, 158, 24–28. [Google Scholar] [CrossRef]
  36. Knoll, H.; Ocylok, S.; Weisheit, A.; Springer, H.; Jägle, E.; Raabe, D. Combinatorial Alloy Design by Laser Additive Manufacturing. Steel Res. Int. 2017, 88, 1600416. [Google Scholar] [CrossRef]
  37. Schopphoven, T. Experimental and Model-Theoretical Investigations on Extreme High-Speed Laser Material Deposition; Fraunhofer Verlag: Aachen, Germany, 2020. [Google Scholar]
  38. Khorasani, M.; Ghasemi, A.; Leary, M.; Cordova, L.; Sharabian, E.; Farabi, E.; Gibson, I.; Brandt, M.; Rolfe, B. A comprehensive study on meltpool depth in laser-based powder bed fusion of Inconel 718. Int. J. Adv. Manuf. Technol. 2022, 120, 2345–2362. [Google Scholar] [CrossRef]
Figure 1. (a) Location of cross-section investigated for relative density, hardness and SEM measurements; (b) scanning scheme for the manufacturing of each layer including acceleration and deceleration; (c) Positions of the hardness indentations. Horizontal distance between indentations was 2 mm, vertical distance between indentations varied between 0.7 and 1.0 mm because of varying sample heights; (d) schematic drawing of laser-particle interaction in HS DED-LB/M.
Metals 14 00079 g001
Figure 2. (a) Electron image of particle cross-section showing cellular structures; (b,c) EDS map showing Mo- and V-micro segregations at the cell walls; (d) Scanning electron image of embedded particle cross-section; (e) EBSD image of the martensite and retained austenite (1.45% RA). Figure adapted from [8], Figure 9a, 9b and 9c replaced.
Metals 14 00079 g002
Figure 3. Scheil simulation (TCFE10) of H11 and H11m modified after [8]. Dashed lines show equilibrium solidification path.
Metals 14 00079 g003
Figure 4. (a) Optical microscopy of sample manufactured using H11 and 50 m/min process speed, 2300 W laser power (top), H11m, 50 m/min, 2300 W (middle) and H11m, 80 m/min, 2300 W (bottom) with their respective relative densities (RD); (b) Color-coded relative density of samples produced with H11m and relative density in dependency of the laser power in manufacturing of H11m samples.
Metals 14 00079 g004
Figure 5. LOM images of as-built 3D HS DED-LB/M samples, (a,b) H11; (c,d) H11m etched with 5% Nital, both manufactured with 2300 W, 50 m/min.
Metals 14 00079 g005
Figure 6. SEM images of 3D HS DED-LB/M (ac)—H11; (df)—H11m showing cell network, and carbide growth on cell boundaries and in matrix.
Metals 14 00079 g006
Figure 7. EDS mapping of H11m showing strong local Ni segregations while Cr, Mo and V are seen to be relatively distributed homogenously.
Metals 14 00079 g007
Figure 8. EDS mapping of H11 reference alloy showing no clear micro segregations of Mo, V, Cr and Mn.
Metals 14 00079 g008
Figure 9. Shows EBSD-phasemap of (a) H11 reference alloy; (b) H11m (modified alloy), and the quantitative FCC amounts.
Metals 14 00079 g009
Figure 10. Microhardness of samples (a) depending on process speed (H11 and H11m); (b) depending on measurement position (H11m only) averaged across five measurements each.
Metals 14 00079 g010
Figure 11. (a) Correlation between relative density and microhardness in H11m samples; (b) Microhardness in H11 and H11m samples manufactured by HS DED-LB/M and PBF-LB/M (data for PBF-LB/M taken from [8]).
Metals 14 00079 g011
Table 1. Alloy compositions (wt.%) of standard and modified H11 powder.
HWTSCSiCrMoMnVNiFe
H11 (reference)0.412.076.141.49<0.010.46-Bal.
H11m (modified)0.382.065.611.191.110.413.07Bal.
Table 2. Parameters used for manufacturing HS DED-LB/M samples using H11 and H11m.
Process Speed [m/min]Laser Power [W]Alloy
502300H11
402300H11m
501600H11m
501800H11m
502200H11m
502300H11m
502500H11m
602300H11m
802300H11m
Disclaimer/Publisher’s Note: The statements, opinions and data contained in all publications are solely those of the individual author(s) and contributor(s) and not of MDPI and/or the editor(s). MDPI and/or the editor(s) disclaim responsibility for any injury to people or property resulting from any ideas, methods, instructions or products referred to in the content.

