Article

Effect of Y on Arc Breaking Behavior of Platinum–Iridium Alloy Contact Materials at Different Voltages

1
Faculty of Material Science and Engineering, Kunming University of Science and Technology, Kunming 650093, China
2
Kunming Institute of Precious Metals, No. 988, Keji Road, Kunming 650106, China
3
State Key Laboratory of Advanced Technologies for Comprehensive Utilization of Platinum Metals, Sino-Platinum Metals Co., Ltd., Kunming 650106, China
4
Yunnan Precious Metals Lab Co., Ltd., Kunming 650106, China
*
Authors to whom correspondence should be addressed.
Metals 2023, 13(8), 1394; https://doi.org/10.3390/met13081394
Submission received: 28 June 2023 / Revised: 27 July 2023 / Accepted: 31 July 2023 / Published: 3 August 2023

Abstract

:
The Pt–Ir alloy is an important electrical contact material in the aerospace field, and its electrical contact performance directly affects the reliability and stability of the circuit system. In order to elucidate the effect of Y on the breaking arc behavior of Pt–Ir alloys at different voltages, Pt-10Ir-1Y and Pt-25Ir-1Y alloys were prepared using melting and thermal processing, and the electrical contact tests were carried out at DC 15 A 12 V, 24 V, and 36 V. When comparing the results of Pt-10Ir and Pt-25Ir electrical contact tests, they showed that Y doping provided a tendency to concentrate individual arc erosion regions. Meanwhile, the comparative study showed that the addition of Y could inhibit the tendency of the Pt–Ir arc time to increase with voltage. At 36 V, the overall arc time of Pt–Ir–Y was significantly lower than that of Pt–Ir, and the fluctuation in arc time and arc energy was reduced. In addition, Y reduced the welding force of Pt–Ir alloys at 12 V, while Y improved the stability of the welding force of Pt–Ir alloys at 24 V. It could be seen that Y was favorable to improving the arc erosion resistance of the Pt–Ir alloy under certain conditions. The contact resistance analysis showed that there was an obvious partitioning phenomenon in the contact resistance of Pt–Ir alloys, and Y changed in this phenomenon at a certain voltage range. In addition, the material transfer direction of the Pt–Ir alloy was from the anode to the cathode, which was not affected by the voltage change, while the addition of Y changed the material transfer direction from the cathode to the anode, which was likely caused by the change from the metal-phase arc dominance to gas-phase arc dominance.

1. Introduction

Electrical contact materials are often used in conductive brushes, electrical contacts, circuit switches, and other crucial fields. They are the most vital parts of switching appliances and electronic components [1,2,3,4,5]. With the rapid development of modern science and technology, as well as the acceleration of the replacement of electronic instrument products, electrical contact materials have begun to be widely used in the aerospace field of precision electrical components and other aspects. Therefore, the performance indicators of electrical contact materials are increasingly enhanced. However, because the electric contact is subjected to a force when it is working, it is also subject to erosion by a high-temperature arc. Therefore, there is an urgent requirement to provide electrical contact materials with a wide range of properties (low and stable contact resistance, arc erosion resistance, good welding resistance, high thermal conductivity, good mechanical qualities, etc.).
Usually, the properties of electrical contact materials are important because the characteristics of the materials that make up the electrical contacts (resistivity, hardness, thermal conductivity, chemical properties, etc.) directly impact their performance, which, in turn, affects the entire electrical system. Widely used electrical contact materials include Ag-based electrical contact material, Cu-based electrical contact material, Au-based electrical contact material, and platinum group metal electrical contact material [6,7,8,9].
Pure Pt has high chemical resistance and high resistance to arc erosion, but it is generally not directly used as a contact material because of its low strength [10]. Alloying can improve the electrical contact properties of Pt, especially with a high melting point platinum group metal alloying Pt, which can not only improve the strength of the contact but also improve the contact arc erosion resistance and reduce electrical erosion wear. The Pt–Ir alloy has a higher melting point, strength, hardness, and corrosion resistance than pure Pt and is less likely to form arcs than pure Pt [11]; at the same time, it also possesses low and stable contact resistance, which is mainly used in the fields of aviation, aerospace, and shipbuilding, such as engine ignition contacts, highly sensitive relays, speed controllers, micro-motors, and vibrators, and other electrical contacts. In recent years, research reports on Pt–Ir alloys have focused on the field of catalysts. In the literature [12], Ir was found to be beneficial in lowering the onset potential of the Pt–Ir/XC-72 catalyst for an ammonia oxidation reaction. The Pt–Ir/CeO2 catalyst, on the other hand, has high catalytic activity for toluene oxidation and can be adjusted to affect the catalytic performance of toluene combustion by changing the ratio of platinum to iridium [13]. Alloyed Pt–Ir tetrahedral (THH) nanocrystals (NCs) with high-index facets prepared using electrodeposition showed excellent electrocatalytic activity and stability for the ethylene glycol oxidation reaction (EGOR) and glycerol oxidation reaction (GOR) [14]. Increasing the metal loading of Ir–Pt/C composite catalysts significantly prolonged the voltage reversal resistance time and reduced the performance loss of membrane electrode assemblies [15]. Pt–Ir as an electrode material has also attracted the attention of scholars. A. Petrossians et al. found that Pt–Ir probe-type disc electrodes deposited with a low impedance Pt–Ir alloy coating showed a significant improvement in their in vitro electrochemical performance and a significant improvement in the rat’s power consumption for retinal electrical stimulation, which was significantly reduced [16]. The 32-channel Pt–Ir cortical electrode array was implanted in sheep for more than 15 months with no significant material changes and long-term stability in the magnitude and phase of electrochemical impedance measurements [17].
Higher standards for the stability and reliability of electrical contact materials have been put forth alongside the development of aviation, aerospace, shipbuilding, and other industries. At the same time, it was also hoped that the number of precious metals would be saved from the perspective of green environmental protection, thereby reducing costs and expanding the application market. One of the most popular methods to fulfill this need is to combine additional inexpensive metal components with Pt–Ir alloys, and the rare earth element Y is often used to improve the performance of alloys. Y is the first rare earth element discovered by mankind and is a chemically more active silver-white metal; it is mainly obtained via the thermal reduction in yttrium fluoride with calcium metal [18]. Y is often used as an additive with nonferrous metals via alloying to improve the mechanical properties, electromagnetic properties, corrosion resistance, etc., of alloys. The literature [19] found that a different Y content affects the initial hydrogen absorption activation time and hydrogen release activation energy of ball-milled Mg2.4–Y–Ni hydrogen storage alloys. For Ti-48Al (at.%) alloys, the microhardness of the alloys increased with the increasing Y content [20]. When brazing a diamond with the Ni–Cr alloy filler, the introduction of Y could reduce the possibility of cracking, refine the grain size, reduce the thickness, and effectively release the thermal stresses of the joint in the carbonized layer [21]. Our team found that the addition of Y to the Pt-24Ir alloy could effectively refine the microstructure of the alloy, which improved the hardness and strength of the alloy, and, at the same time, had more excellent resistance to arc erosion [22]. However, detailed studies on the breaking arc behavior of Pt–Ir and Pt–Ir–Y alloys have not been reported this year.
Therefore, in this paper, Y-added Pt-10Ir and Pt-25Ir alloys were prepared, and the electrical contact performance of Pt–Ir contacts before and after doping was comparatively investigated for breaking arcs at the same voltage and different currents, and the effect of Y on the arc erosion behavior was explored, which provided a theoretical basis for the optimization and upgrading of the contact materials and the development of new materials as well as practical applications.

2. Materials and Methods

In this work, raw materials included the platinum block (99.95 wt%), iridium powder (99.95 wt%), and yttrium flakes (99.95%). Since the contact material is most commonly prepared via the metal melting method, an ingot with nominal compositions of Pt-10Ir, Pt-10Ir-1Y, Pt-25Ir, and Pt-25Ir-1Y was prepared using an MSM20-7 micro-metal melting furnace with argon at 1 standard atmosphere. Due to the absence of obvious impurities and defects on the surface of the ingots, no surface treatment or cutting was carried out. Then, the billet was hot rolled at 1000~1300 °C, annealed at 1150~1250 °C, rolled to a thickness of 1.0 mm sheet, and then pressed into a small round sheet with a diameter of Φ5.4 mm with a special mold and 63 tons of the single column calibration press (liquid 41–63 type); this was then welded to the Cu rivet with the preparation process shown in Figure 1.
Pt-10Ir, Pt-25Ir, Pt-10Ir-1Y, and Pt-25Ir-1Y were used to carry out electric contact experiments at DC 15 A and 12 V, 24 V, and 36 V, to obtain the electric contact properties of the materials under different voltages, such as arc duration, arc energy, the welding force, contact resistance, and other electric contact properties. The specific experimental parameters are shown in Table 1. The electrical contact experimental equipment is the JF04C electrical contact test system, the photo and schematic diagram of which is shown in Figure 2a,b. This test system can simulate the actual operation of the contact, which is composed of an industrial PC, signal acquisition, measurement, and protection device with a contact motion simulator, steady current test power system, and other test equipment. The device can collect data such as the electric contact arc-firing time, arc energy, and contact resistance, etc. The testing accuracy of the arc-firing time was 0.1%, the testing accuracy of the arc-firing energy was 0.5%, the testing accuracy of the welding force was 1%, and the testing accuracy of contact resistance was 1% ± 10 μΩ. A pair of contacts were fixed to the equipment fixture, where the moving and static contacts were the anode and cathode, respectively. The phase composition of the alloys was analyzed using an X-ray diffractometer (RIGAKU, Rigaku, TTRIII-18KW) at 40 kV and 200 mA with Cu Kα radiation. The weight changes before and after the electrical contact experiment were obtained using an electronic balance (METTELER TOLEDO AB135-S). The mass change of more than 0.01 mg could be accurately measured by the balance. The surface morphology of the arc erosion samples was characterized via S-3400N scanning electron microscopy (HITACHI S-3400N type), as shown in Figure 3. Prior to this observation, the erosion surface was thoroughly treated using ethanol liquid (KODUS SK2200H) SK2200H ultrasonic cleaning equipment. The elements and their compositions were analyzed using an energy spectrometer (EDAX, PV77-47600ME) mounted on a scanning electron microscope.

3. Results and Discussion

3.1. XRD and Binary Phase Diagrams of Pt–Ir and Pt–Ir–Y Contact Materials

Figure 4 shows the XRD pattern of the Pt–Ir alloy before and after the addition of Y. The characteristic diffraction peaks of the face-centered cubic (fcc) Pt structure and Ir structure were observed, and it could be found that the intensity of Pt and Ir peaks varied. Figure 4a is the diffraction spectra of Pt-10Ir and Pt-10Ir-1Y, and Figure 4b is the diffraction spectra of Pt-25Ir and Pt-25Ir-1Y. Figure 4c–e shows the binary phase diagrams of Pt-Ir, Ir-Y and Pt-Y, respectively. According to the binary phase diagram of Pt and Ir [23,24,25], the two formed a continuous solid solution at a high temperature before decomposing into two fcc solid solution phases with different components at a low temperature. However, the X-ray diffraction pattern shows that there was only one phase. Because the content of the Y element was less, it did not form a second phase with Pt and Ir. In addition, XRD analysis showed that with the addition of the Y element, the peak value of XRD changed greatly. The reason for this was mainly because the atomic radius of the Y element was very different from that of the Pt and Ir elements; therefore, the addition of the Y element could cause the lattice to be distorted, and the corresponding lattice parameters changed, thereby causing the peak value to change.

3.2. Arc Erosion Surface Morphology of Pt–Ir and Pt–Ir–Y Contact Materials

Figure 5 and Figure 6 show the macroscopic morphology of the anode and cathode arc-breaking erosion surfaces of Pt-10Ir and Pt-25Ir alloys before and after adding Y after 10,000 operations at different voltage conditions. As shown in Figure 5a–l, the overall erosion zone of Pt-10Ir and Pt-25Ir alloys was mostly elliptical and gentle, and no obvious overall convex humps or pits were formed; however, the surface topography of the erosion zone fluctuated much more than that of the nonerosion zone. The erosion zone size of the cathode was larger than that of the anode, and the erosion zone size increased with the increase in the current. After Y was added in Figure 6, the macroscopic morphology of the anode erosion zone was convex hummocky (Figure 6a,c,e,g,i,k), while that of the cathode was concave (Figure 6b,d,f,h,j,l), which is similar to that of the AgSnO2 material in the literature [26], and the size of the cathode erosion zone was larger than that of the anode. The erosion zone size of both the cathode and anode increased with the increase in the current. By comparing Figure 5 and Figure 6, it was found that after the addition of Y, the erosion pits on the surface of the Pt-10Ir and Pt-25Ir alloys were significantly reduced, and the overall scope of the erosion zone was reduced, indicating that the Y element made the erosion zone of the single breaking arc have a tendency to concentrate.

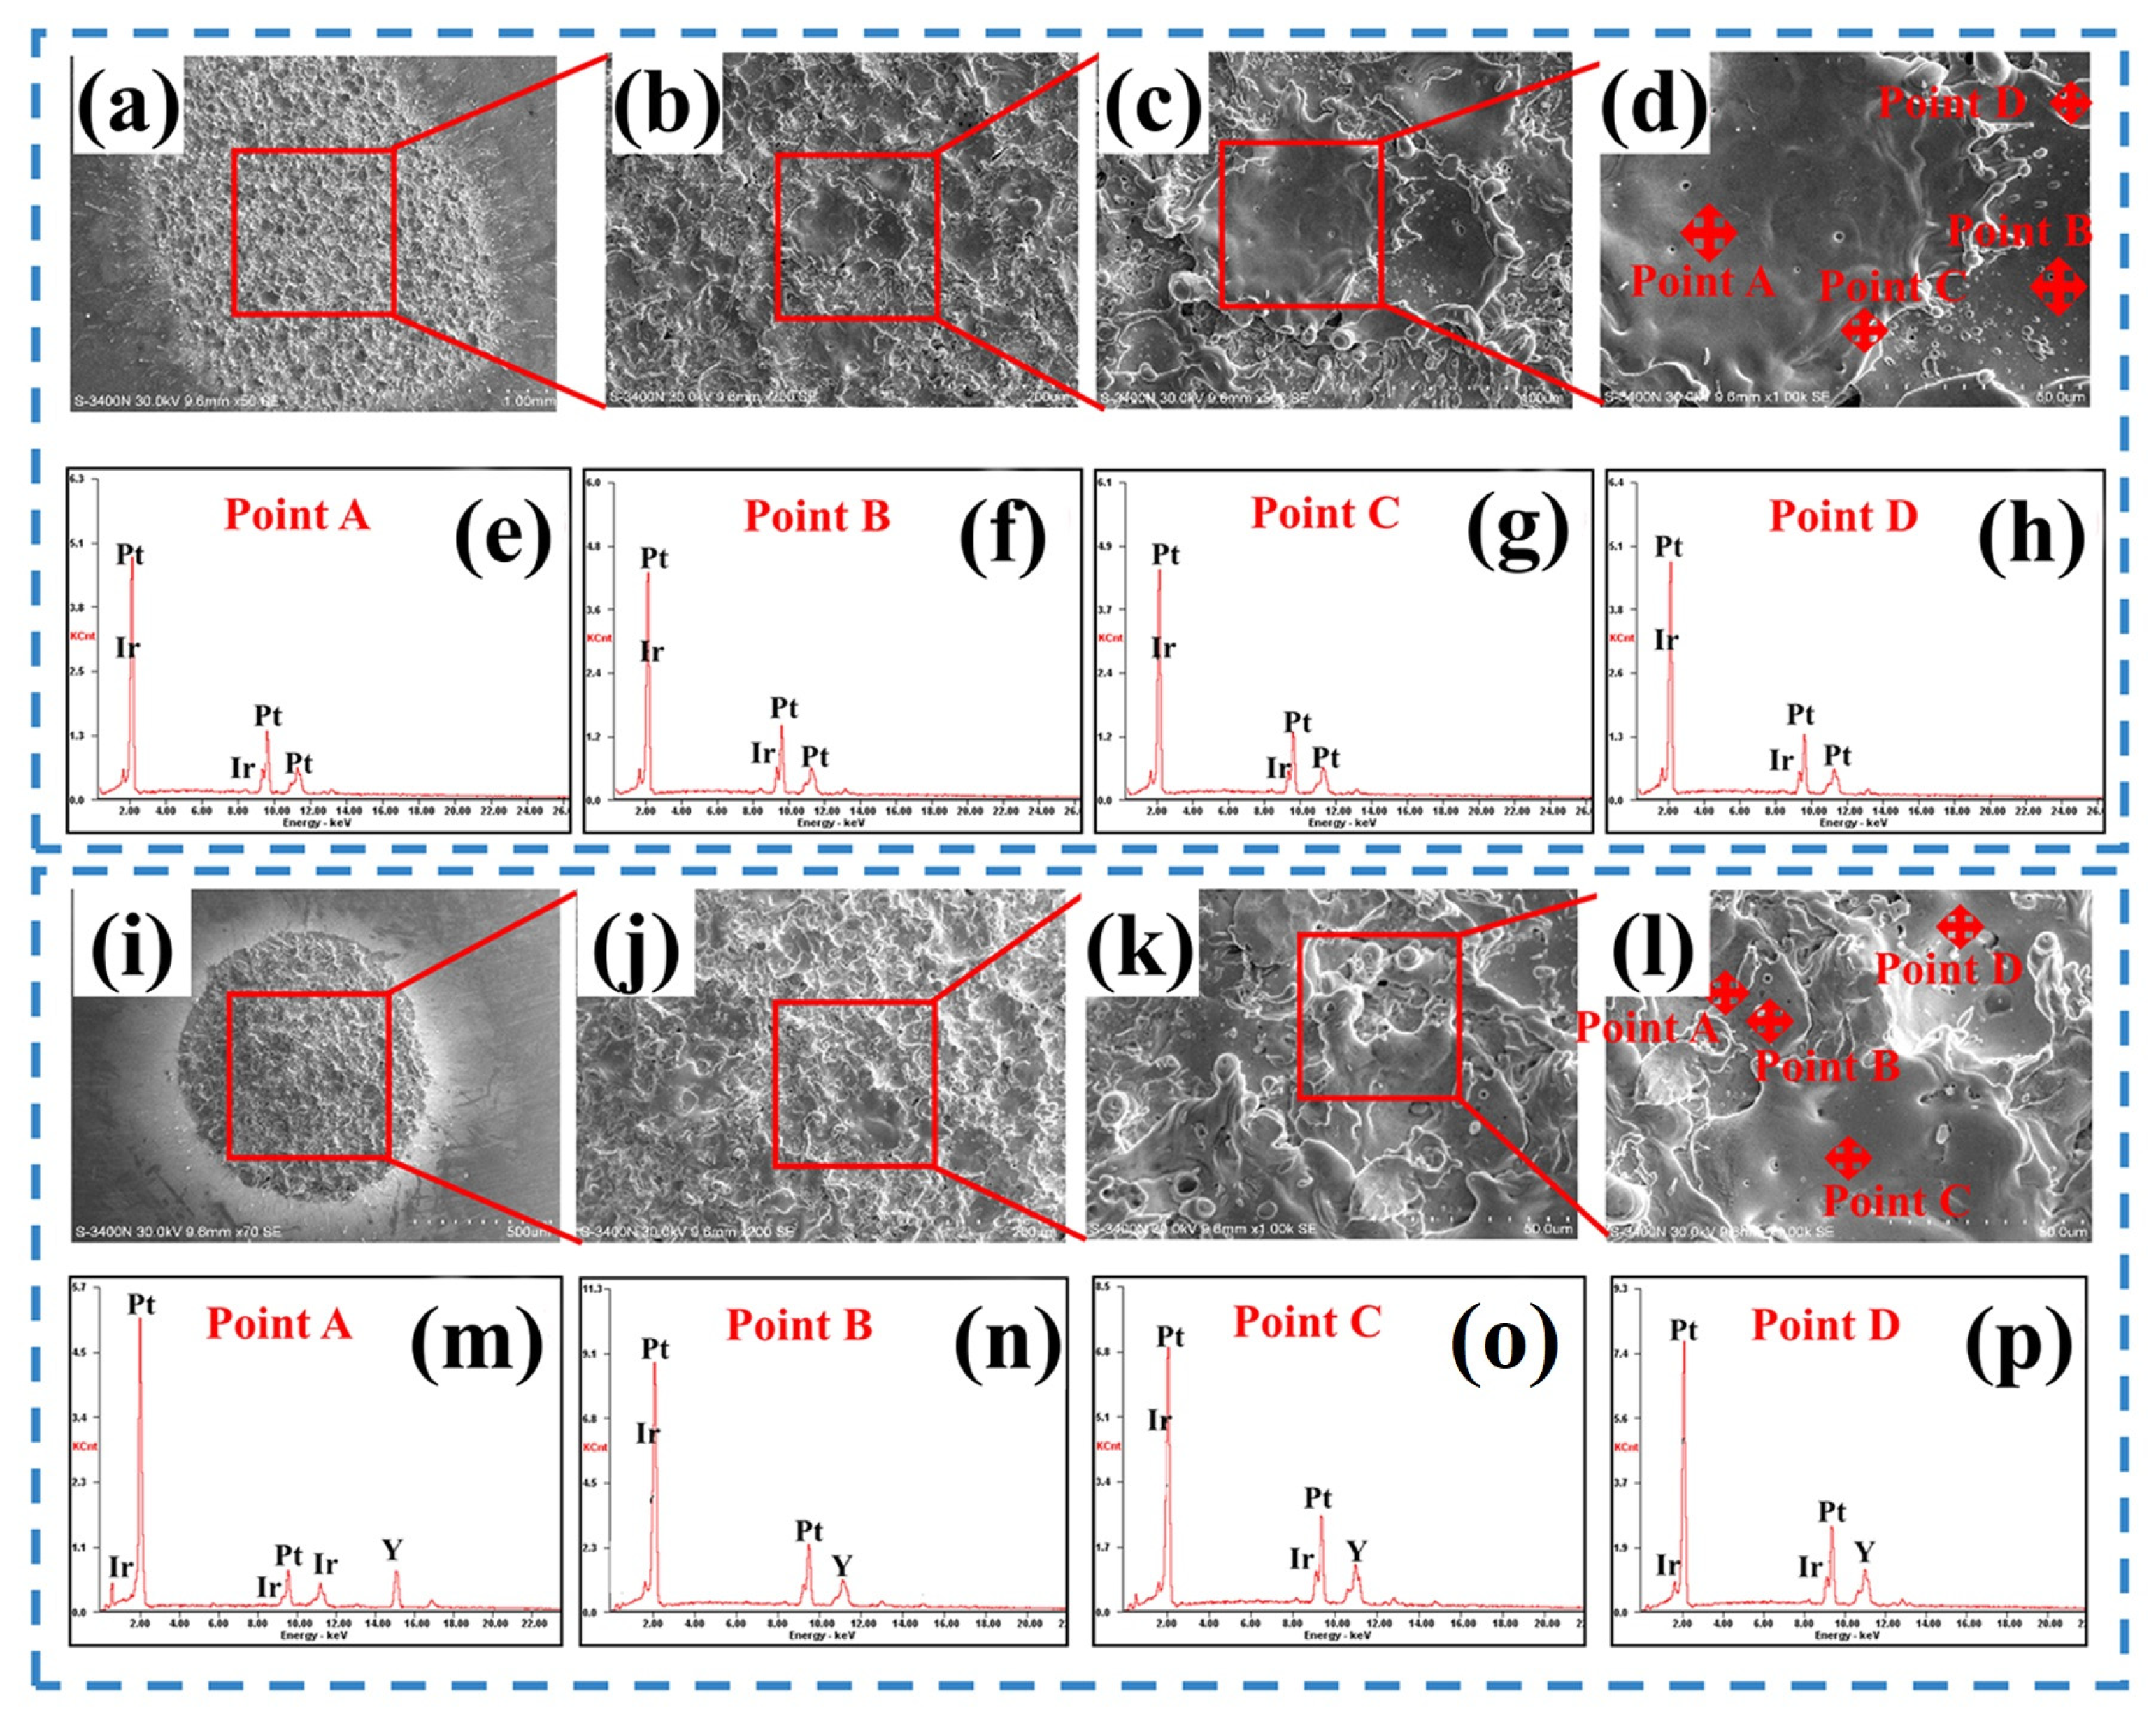
3.3. Arc Erosion Micro-Morphology of Pt–Ir and Pt–Ir–Y Contact Materials

On the basis of observing the macroscopic morphology, the micro-morphology of the breaking arc erosion with different contacts was further observed. Figure 7 and Figure 8 show the breaking arc erosion microstructure of the cathode and anode of the contract after 10,000 operations. Generally speaking, the typical micromorphologies of arc erosion generally include the melting plot, edge spatter morphology, droplet, porosity, and cavity. From Figure 7 and Figure 8, it can be observed that the surface erosion zone of the contact was formed by many fusion zones overlapping and joining, accompanied by droplets, porosity, holes, and other morphologies. In Figure 7, the melting plot without Y was relatively regular, showing a relatively flat middle and a petal-like sputtering bulge at the edge. The melting zone was due to the high-temperature thermal action brought by the arc; therefore, the local alloy softeners, or even melts, spread the flow around, and the farther away from the arc this occurred, the lower the surface temperature, and the lower the metal flow ability, until the temperature was lower than the melting point of the alloy solidification, and the melting zone range was basically stable. Similar to the macroscopic morphology, the melting plot also showed that the size increased with the increase in the current.
The mechanical action of the arc on the melting area can also lead to the sputtering of the molten alloy, forming sputtering bumps and droplets. The yellow circles in Figure 7a–h,l and Figure 8a–d,f–l indicate the pores and holes in the melting zone, mainly because the molten alloy interacted with oxygen in the air under the action of an electric arc. When arc melting materials are spread out, the space caused by the gas overflow and the overlapping edges of multiple melting zones are formed, and the morphology of the edges of multiple melting zones can be observed. When the alloy is cooled rapidly and begins to solidify, some oxygen does not have time to escape, resulting in the formation of pores both on and inside the contact surface [27]. Secondly, the green circle was marked for micro-cracks (Figure 8b,d,f–h,j,l), the formation of which was partly caused by the gap formed by the overlapping edge of multi-layer melting cells, and the other as the result of the force of the arc. Other conditions were the same, including a higher voltage, greater arc energy, and a stronger force effect, resulting in higher voltage cracks.
The further analysis of the SEM point scan results in Figure 9, combined with the XRD results in Figure 4, show that a single-phase solid solution was formed between Pt and Ir elements, while no second phase was formed. Due to the low amount of the Y element, no new phase was formed. The enrichment of the Y element was found only in the local area, which could be caused by the different thermal actions of the arc at different locations on the surface.

3.4. Characteristics of Arc Energy, Arc Time, and Welding Force of Pt–Ir and Pt–Ir-1Y Contact Materials

As we all know, arc erosion is an extremely complicated multi-physics coupling problem that involves numerous disciplines, including heat, fluid mechanics, electromagnetic, and electrodynamics, as we are all aware. The two fundamental components of the arc erosion process are the arc properties and their overall impact on the thermal stress, gas pressure, the electromagnetic force on the surface of the molten pool, and the material’s reaction to the arc’s heat and force. Arc energy, arc duration, welding force, and electric contact resistance are the key factors influencing the physical phenomena of the electric contact formed during arc erosion [28,29,30]. Among them, in the process of arc erosion, with the change in some conditions, such as materials, its physical phenomenon also changes accordingly.
In this work, in order to better analyze and discuss the effect of adding the Y element to Pt–Ir contact material on the physical phenomenon of the electrical contact, Pt–Ir and Pt–Ir-1Y electrical contact materials were compared under the same current and different voltage conditions. Figure 10 shows the average breaking arc energy, breaking arc time, and welding force for every 100 operations during 10,000 operations.
Figure 10a,d,g,j shows the ignition times of the Pt-10Ir and Pt-25Ir, Pt-10Ir-1Y, and Pt-25Ir-1Y electrical contact materials at 12 V, 24 V, and 36 V. Firstly, except for Pt-25Ir-1Y, the arc time of the other three alloys increased with the increase in the voltage. However, when the voltage increased by 12 V, the increase in the arc time of different alloys was not the same. After adding Y, the arc time decreased significantly with the increase in the voltage, and even at the middle and late stages of the experiment, the arc time of 36 V began to be less than that of 24 V. It was seen that Y was beneficial when restraining the increase in the arc time with a rising voltage. At the same time, it can also be seen in Figure 10 that the arc time fluctuation of Pt-10Ir, Pt-10Ir-1Y, and Pt-25Ir-1Y at 12 V was larger than that of other voltages. This could be because, when the voltage was low, a single arc formed a tiny, relatively flat melting plot, which caused the erosion area’s surface to be more uneven. The arc time was subject to significant changes at 12 V, near 1000 operations, which could be brought on by the oxide coating or contaminants that were originally present on the material’s surface. This rise in surface fluctuation could be the reason for the variability of the arc time in the experiment’s latter phases. The fluctuation in the arc time of Pt-25Ir at 36 V was the largest, and the addition of Y significantly reduced the peak and fluctuation of the arc time and improved the arc erosion resistance of the material.
Figure 10b,e,h,k shows the breaking arc energy of the four alloys. As shown in the figure, the arc energy of the four alloys increased with the increase in the voltage. Before adding Y, the increase in the arc energy from 24 V to 36 V was greater than that from 12 V to 24 V, and after adding Y, the increase in the arc energy was basically the same as when the voltage increased by 12 V. After adding Y, the arc energy variation trend of the four alloys was basically the same; however, at 36 V, the arc energy of Pt-25Ir-1Y was slightly lower than that of Pt-25Ir, the fluctuation was reduced, and stability was improved. Combined with the analysis of the arc burning time, it could be seen that adding Y at 36 V was beneficial to improving the arc erosion resistance of Pt-25Ir.
Figure 10c,f,i,l shows the welding force of Pt–Ir and Pt–Ir–Y contacts at different voltages when the arc was broken. The average welding force of Pt–Ir and Pt–Ir–Y contact materials fluctuated greatly with the increase in operation times. Under different voltages, Pt-10Ir basically showed an initial rise with the increase in operation times, which gradually stabilized in the later period. At 24 V, the fusion welding force was generally higher, as shown in Figure 10c. As shown in Figure 10f, the Pt-25Ir of 12~36 V was higher in the initial stage, decreased in the middle stage, and then increased slightly in the later stage with the increase in operation times. The peak fusion welding force was higher in the early stage at 12 V, higher in the later stage at 36 V, and the fusion welding force of 24 V was the smallest and most stable compared with other voltages. Pt-10Ir-1Y, as shown in Figure 10i, had a basic trend of appearing low in the early stage, rising in the middle stage, and slightly decreasing in the late stage at 12~24 V. The overall fluctuation in the Pt-10Ir-1Y welding force was the largest at 36 V. In Figure 10l, the fusion welding force of Pt-25Ir-1Y at different voltages first increased slightly and then basically stabilized, and its value and degree of fluctuation were positively correlated with the voltage. By comparing Figure 10f, it could be found that after adding Y, the overall fluctuation of the Pt-25Ir welding force significantly decreased at 24 V.
In order to better analyze the variation characteristics of the fusion welding force, the cumulative frequency curve of the fusion welding force under different voltages was drawn, as shown in Figure 11. At 12 V, 99% of the fusion welding force for Pt-10Ir was lower than that of 7 cN. With the increase in the voltage, the frequency of the fusion welding force above 7 cN also increased, and the frequency of the fusion welding force above 7 cN was the highest at 24 V, as shown in Figure 11a, indicating that the overall value of the Pt-10Ir fusion welding force at 24 V was the highest. At 12 V, 89% of the fusion welding force for Pt-25Ir was less than 12 cN, and when the voltage rose to 24 V and 36 V, the proportion was 93% and 96%, respectively. It can be seen that the voltage increase was conducive to improving the stability of the fusion welding force of Pt-25Ir. By comparing Figure 11a,c, it can be seen that after adding Y, the fusion welding force of Pt-10Ir less than 13 cN accounted for 91%, 93%, and 94% at 12 V, 24 V, and 36 V, respectively, indicating that Y increased the overall fusion welding force of Pt-10Ir, which was not conducive to improving fusion welding resistance. After adding Y to Pt-25Ir, the fusion welding force was less than 15 cN at 12 V, while the fusion welding force of Pt-25Ir before its addition was 82% greater than 15 cN; it can be seen that Y could reduce the fusion welding force at this voltage.

3.5. Contact Resistance of Pt–Ir and Pt–Ir–Y Contact Materials

Contact resistance is the local additional resistance that is caused by current contractions near the conductive spot due to an uneven actual contact surface. Figure 12 shows the contact resistance of the Pt–Ir and Pt–Ir–Y alloys measured per 50 operations at 15 A and 12 V, 24 V, and 36 V. As can be seen from Figure 12a–f, the contact resistance of the Pt–Ir alloy could be divided into two parts: a high-value region and a low-value region. The high-value range was between 2.5 mΩ and 4.0 mΩ, and this low-value range was less than 1 mΩ. The high-value contact resistance of the Pt-10Ir contacts decreased with the increase in the voltage. When it reached 36 V, only three contact resistance values were greater than 2.5 mΩ, indicating that a higher current helped to suppress the high-value contact resistance of Pt-10Ir, which was conducive to improving the stability of the material contact resistance. As with Pt-10Ir, the high-value contact resistance of Pt-25Ir decreased with the voltage at 12 V and 24 V; however, at 25 V, the high-value contact resistance of Pt-25Ir increased to more than 50%. Combined with the XRD results in Figure 3 and the energy spectrum analysis results in Figure 9, Pt-10Ir and Pt-25Ir were single-phase solid solutions, and no second phase was formed. Therefore, the reason for the above phenomenon could be the surface topography change or the oxide film. Other conditions were the same: a higher voltage resulted in higher arc energy and easily broke down or cleared the oxide film. This could be why Pt-10Ir at 12~36 V and Pt-25Ir at 12~24 V experienced a decrease in high energy contact resistance with the increase in the voltage. Comparing the contact resistance before and after adding Y, it was found that the obvious partitioning phenomenon of Pt-10Ir-1Y’s contact resistance at 12 V and 24 V and Pt-25Ir-1Y’s contact resistance at 24 V and 36 V disappeared, as shown in Figure 12g,h,k,l. According to the analysis in Figure 9, this phenomenon may result from the effect of the arc action on Y in the local area, which changed the hardness of the local material, and the micro-surface fluctuation caused by arc erosion. However, the Pt-10Ir-1Y of 36 V (Figure 12i) and Pt-25Ir-1Y of 12 V (Figure 12j) still had the phenomenon that the contact resistance was divided into a high-value region and a low-value region, and the range of these two regions was basically the same before adding Y. The number of high-value contact resistors of 12 V Pt-25Ir-1Y was significantly reduced compared to before the addition, with only 13% of Pt-25Ir. At 24 V, the contact resistance of Pt-10Ir-1Y not only had no high value at all but was less than 0.35 mΩ, and the fluctuation amplitude was also very small, which is the most ideal situation for the four alloys at different voltages.
Under the use conditions of low-voltage electrical appliances, the contact resistance of Pt–Ir alloys exhibits a significant partitioning phenomenon compared to the contact resistance of mainly applied silver-based electrical contact materials such as Ag–SnO2 [31], Ag–CuO [8], and AgNi [32], which should be mainly caused by the difference in the organizational structure; Pt–Ir alloys are single-phase solid solutions, whereas the organizational structure of Ag–SnO2, Ag–CuO, and AgNi consists of at least two phases.

3.6. Mass Change in Pt–Ir and Pt–Ir–Y Contact Materials

Figure 13 shows the mass change in the anode and cathode contacts and the net material transfer amount of Pt–Ir and Pt–Ir–Y alloys at different voltages. It can be seen from Figure 13a,b that the material transfer amount of the Pt–Ir alloy was not positively correlated with the voltage at the same current. At 24 V, Pt-10Ir and Pt-25Ir had the smallest amount of cathode and anode mass changes and net transfer. All Pt–Ir alloys lost weight at the anode and gained weight at the cathode, and this net mass change was negative, indicating that the material transfer direction was from anode to cathode, but the contact lost more material than it gained, and overall material loss occurred. This material transfer was not affected by voltage changes. Figure 13c,d shows the situation after adding Y. The mass changes in the anode and cathode rose with the increase in the voltage when Pt-10Ir-1Y was 12–36 V and when Pt-25Ir-1Y was 12–24 V; however, the net mass changes were not positively associated with the voltage. At all three voltages, Pt-10Ir-1Y’s net mass change was lowest at 24 V, suggesting that this contact experienced the least amount of material loss. The net mass change in Pt-25Ir-1Y was constant at 12~24 V, indicating that the overall material loss was not affected by the voltage. Compared with before the addition, it was found that the anode, cathode, and net mass changes in Pt-10Ir-1Y increased, indicating that adding Y was not conducive to reducing the material loss of Pt-10Ir. However, the net mass change in Pt-25Ir-1Y was basically the same as before the addition at 12~24 V; therefore, Y did not affect the overall material loss of the contact pair under this condition. After the addition of Y, the Pt–Ir–Y alloy at different voltages showed that the anode gained weight and the cathode lost weight; that is, the material transferred from the cathode to the anode in the opposite direction compared to before the addition. The change in the material transfer direction could be caused by the change in the arc erosion behavior.
In general, the physical process of breaking an arc is shown in Figure 14. As shown in Figure 14a, when the contact was separated, only a very small number of conductive spots could actually make the current pass through due to the micro-roughness of the contact surface. The current line shrank near the conductive spot, resulting in additional local resistance (contact resistance). At the same time, the contact resistance generated Joule heat to soften and melt nearby materials, forming a fusion bridge under the action of surface tension, as shown in Figure 14b. With the increase in the anode and cathode’s distance, the diameter of the welding bridge decreased, the contact resistance increased, the temperature also increased, and the material was finally broken by boiling the welding bridge; therefore, the contact gap between the anode and cathode was filled with high-temperature metal vapor, as shown in Figure 14c. At this point, the tip of the cathode became a source of electron emission. The emitted electrons were accelerated by the electric field and moved toward the anode, during which inelastic collisions with the metal vapors occurred, leading to the ionization of the metal vapors and an avalanche of electrons. This ignited the metal phase arc. With the further separation of the contacts, the metal ions were consumed due to the deposition on the cathode and the mutual diffusion between the metal vapor and the surrounding gas, while the density of the metal vapor decreased with time, and the gas in the atmosphere became the main medium between the electrodes, the gaseous ions became the main ions. The arc changed from the metal phase to the gas phase. The two stages of the breaking arc were first proposed by Boddy and Utsumi [33] and then verified by Gray through spectroscopy [34]. On this basis, Z. K. Chen proposed the particle scattering and deposition (PSD) model and successfully explained the material transfer of Ag and Pd in the DC breaking arc [35]. According to the PSD model, when the metal phase arc is dominant, the material is transferred from the anode to the cathode; however, when the gas phase arc is dominant, the material is transferred from the cathode to the anode. Therefore, adding Y made the breaking arc of the Pt–Ir alloy become dominant from the metal phase arc.

4. Conclusions

In this paper, the breaking arc behavior of Pt-10Ir, Pt-25Ir, Pt-10Ir-1Y, and Pt-25 Ir-1Y at different voltages and their influencing factors were studied, and the effects of Y on the arc erosion morphology, arc burning characteristics, contact resistance, material transfer, and other electrical contact properties of Pt–Ir alloys were discussed. The following conclusions were drawn:
(1) The range of the Pt–Ir alloy’s arc erosion zone is positively associated with voltage under the same circumstances. Melt plots, spattered droplets, pores, holes, and gaps generated at the interface of multi-layer melt plots are all common erosion morphologies. Under the influence of the arc heat, the cathode also experiences localized Y polarization, and high voltage fractures can be seen.
(2) The addition of Y can inhibit the increase in the arc time of the Pt–Ir alloy with the rise in voltage. At 36 V, Y can obviously reduce the fluctuation in the arc time of the Pt-25Ir alloy and restrain the fluctuation in the arc energy, which is conducive to improving the arc erosion resistance of the material. The addition of Y reduces the fusion welding force of Pt-25Ir at 12 V and significantly reduces the overall fluctuation of Pt-25Ir’s fusion welding force at 24 V, which is conducive to improving the fusion welding resistance of the material.
(3) The contact resistance of the Pt–Ir alloy has an obvious zoning phenomenon. Under the experimental conditions in this paper, the high-value region ranged from 2.5 to 3.0 mΩ, and the low-value region was less than 1 mΩ. Pt-10Ir was between 12 V and 36 V and Pt-25Ir was between 12 V and 24 V, and the higher voltage could inhibit the appearance of high-value contact resistance. Adding Y to a certain voltage range changes this obvious zoning phenomenon.
(4) Under different voltages, the material transfer direction of the Pt–Ir alloy is from the anode to the cathode, and the addition of Y is from the cathode to the anode to change the dominant arc type.
In conclusion, doping Y can improve certain electrical contact properties of Pt–Ir alloys, but have adverse effects on other electrical contact properties, and optimization or degradation is related to the specific conditions of use. It can be seen that the addition of Y can be used as one of the directions for the optimization of the alloy’s electrical contact materials, but it is necessary to comprehensively consider a number of factors affecting the selection of factors and the use of demand.

Author Contributions

Conceptualization, Y.S., S.C. and Y.Y.; data curation, S.W. (Saibei Wang), S.W. (Song Wang) and A.L.; formal analysis, S.W. (Saibei Wang), A.L., M.P. and B.L.; funding acquisition, M.X.; investigation, S.W. (Saibei Wang), S.W. (Song Wang) and Y.Y.; project administration, Y.S.; resources, Y.D. and M.X.; supervision, Y.S. and S.C.; writing—original draft, S.W. (Saibei Wang) and B.L.; writing—review and editing, S.W. (Saibei Wang), Y.D. and M.P. All authors have read and agreed to the published version of the manuscript.

Funding

This research was funded by the National Natural Science Foundation of China (51507075), the Yunnan Provincial Science and Technology Plan Project (202201AT070273, 202305AD160020), the Innovation Team of Yunnan Province (202105AE160027), and the Science and Technology Project of Yunnan Precious Metal Laboratory (YPML-2022050227, YPML-2022050228).

Data Availability Statement

Data supporting the reported results can be found from the authors.

Conflicts of Interest

The authors declare no conflict of interest.

References

  1. Michal, R.; Saegar, K.E. Metallurgical aspects of silver-based contact materials for air-break switching devices for power engineering. IEEE Trans. Compon. Hyb. Man. Technol. 1989, 12, 71–81. [Google Scholar] [CrossRef]
  2. Zhou, Y.X.; Xue, Y.L.; Zhou, K. Failure analysis of arc ablated tungsten-copper electrical contacts. Vacuum 2019, 164, 390–395. [Google Scholar] [CrossRef]
  3. Wang, S.B.; Peng, M.J.; Sun, Y.; Xie, M.; Wang, S.; Duan, Y.H.; Chen, S.; Liu, M.M.; Yang, Y.C. Research Progress on Electrical Contact Performance of Metal Contacts. Mater. Rep. 2020, 34, 09117–09123. [Google Scholar]
  4. Zhou, Z.; Liu, D.; Wei, Y.; Hu, Y.; Tian, D.; Wen, G.; Liu, Z.H.; Huang, X.C. Investigation on arc erosion characteristics of Ag/Ti3SiC2 composites in SF6 mixed with buffer gases. Vacuum 2022, 206, 111536. [Google Scholar] [CrossRef]
  5. Han, J.R.; Dou, Z.H.; Zhang, T.A.; An, W. Review of the recent Chinese research on the electrical properties of CuCr contacts for vacuum interrupters. J. Mater. Res. Technol. 2023, 25, 1585–1598. [Google Scholar] [CrossRef]
  6. Yang, R.; Liu, S.; Cui, H.; Yang, H.; Zeng, Y.; Liu, M.; Sun, X. Quasi-Continuous Network Structure Greatly Improved the Anti-Arc-Erosion Capability of Ag/Y2O3 Electrical Contacts. Materials 2022, 15, 2450. [Google Scholar] [CrossRef]
  7. Zhang, W.Y. Research and application of electrical contact materials. J. Shanghai Electr. Technol. 2021, 14, 62–66. [Google Scholar]
  8. Chen, S.; Wang, J.; Yuan, Z.; Wang, Z.; Du, D. Microstructure and arc erosion behaviors of Ag-CuO contact material prepared by selective laser melting. J. Alloys Compd. 2021, 860, 158494. [Google Scholar] [CrossRef]
  9. Dong, L.; Li, L.; Li, X.; Zhang, W.; Fu, Y.; Elmarakbi, A.; Zhang, Y. Enhancing mechanisms of arc-erosion resistance for copper tungsten electrical contact using reduced graphene oxides in situ modified by copper nanoparticles. Int. J. Refract. Met. Hard Mater. 2022, 108, 105934. [Google Scholar] [CrossRef]
  10. Ning, Y.T.; Yan, Z.F.; Wen, F. Platinum, 1st ed.; Metallurgical Industry Press: Beijing, China, 2010; p. 201. [Google Scholar]
  11. Braunovic, M.; Konchits, V.V.; Myshkin, N.K. Electrical Contacts Fundamentals, Applications and Technology, 1st ed.; Machinery Industry Press: Beijing, China, 2016; p. 69. [Google Scholar]
  12. Fang, H.; Liao, C.; Cai, Q.; Zhong, F.; Lin, L.; Chen, C.; Luo, Y.; Jiang, L.L. Tuning surficial atomic configuration of Pt-Ir catalysts for efficient ammonia oxidation and low-temperature direct ammonia fuel cells. Chem. Eng. Sci. 2023, 118836. [Google Scholar] [CrossRef]
  13. Zhang, Y.; Wu, C.; Wang, Z.; Ji, J.; Wan, H.; Zou, W.; Tong, Q.; Sun, J.F.; Dong, L.; Chen, Y.W. Enhanced low-temperature catalytic performance for toluene combustion of CeO2-supported Pt-Ir alloy catalysts. Appl. Surf. Sci. 2022, 580, 152278. [Google Scholar]
  14. Dai, H.; Dong, K.; Zhang, T.; Pu, H.; Wang, Y.; Deng, Y. Electrodeposition of shaped PtIr alloy nanocrystals with high-index facets for the electro-catalytic oxidation of alcohols. Appl. Surf. Sci. 2023, 609, 155225. [Google Scholar] [CrossRef]
  15. Wang, Y.; Liao, J.; Li, Z.; Wu, B.; Lou, J.; Zeng, L.; Zhao, T. Ir-Pt/C composite with high metal loading as a high-performance anti-reversal anode catalyst for proton exchange membrane fuel cells. Int. J. Hydrogen Energy 2022, 26, 13101–13111. [Google Scholar] [CrossRef]
  16. Petrossians, A.; Davuluri, N.; Whalen, J.J.; Mansfeld, F.; Weiland, J.D. Improved Biphasic Pulsing Power Efficiency with Pt-Ir Coated Microelectrodes.Artin Petrossians. MRS Online Proc. Libr. 2014, 1621, 249–257. [Google Scholar] [CrossRef]
  17. Kohler, F.; Stieglitz, T.; Schuettler, M. Morphological and electrochemical properties of an explanted PtIr electrode array after 15 months in vivo. In Proceedings of the 2014 36th Annual International Conference of the IEEE Engineering in Medicine and Biology Society, Chicago, IL, USA, 26–30 August 2014. [Google Scholar]
  18. Zhang, C.; Dang, Q.; Liu, G.H.; Wang, Z.D. Development and Application of the Rare Earth Yttrium. Mater. Rep. 2023, 37, 22120049-8. [Google Scholar]
  19. Zheng, C.; Zhou, D.; Feng, D.; Ren, H.; Zhang, Y. Effect of Y content on the hydrogen storage properties of ball-milled Mg2.4-xYxNi (x = 0.05, 0.1, 0.15, 0.2) alloys. J. Phys. Chem. Solids 2023, 178, 111320. [Google Scholar] [CrossRef]
  20. Fan, J.; Wei, Z.; Liang, L.; Li, Y.; Wu, S.; Wang, Y.; Zhou, X.K.; Liu, J.X. Effect of Y Alloying on Microstructure and Mechanical Properties of Ti-48Al Alloy. JOM 2022, 74, 4806–4816. [Google Scholar] [CrossRef]
  21. Wang, P.; Zhang, L.; Cheng, Z.; Xiong, H.; Zuo, R.; Jiu, Y.; Qin, H.; Xu, D. Effect of Y on interface characteristics and mechanical properties of brazed diamond with Ni-Cr filler alloy. Diam. Relat. Mater. 2023, 132, 109645. [Google Scholar] [CrossRef]
  22. Xie, M.; Chen, J.; Chen, L.I.; Fu, S.J.; Ning, D.K.; Zeng, R.C.; Yang, Y.C.; Li, R.M.; Duan, Y.X.; Zhen, F.Q. Investigation on the Microstructure and Properties of Pt-24Ir-RE Alloys. Precious Met. 2004, 25, 25–28. [Google Scholar]
  23. Yamabe-Mitarai, Y.; Aoyagi, T.; Abe, T. An investigation of phase separation in the Ir–Pt binary system. J. Alloys Compd. 2009, 484, 327–334. [Google Scholar] [CrossRef]
  24. Okamoto, H. Supplemental Literature Review of Binary Phase Diagrams: Ag-Nd, Ag-Zr, Al-Nb, B-Re, B-Si, In-Pt, Ir-Y, Na-Si, Na-Zn, Nb-P, Nd-Pt, and Th-Zr. J. Phase Equilib. Diff. 2014, 35, 636–648. [Google Scholar] [CrossRef]
  25. Zadesenets, A.V.; Shubin, Y.V.; Korenev, S.V. Experimental investigation of phase equilibria of the Ir-Pt binary system in subsolidus region. Mater. Today Commun. 2022, 31, 103247. [Google Scholar] [CrossRef]
  26. Zhang, M.; Wang, X.H.; Yang, X.H.; Zou, J.T.; Liang, S.H. Arc erosion behaviors of AgSnO2 contact materials prepared with different SnO2 particle sizes. Trans. Nonferrous Met. Soc. China 2016, 26, 783–790. [Google Scholar] [CrossRef]
  27. Xi, Y.; Wang, X.H.; Zhou, Z.J.; Li, H.Y.; Guo, X.H. Material transfer behavior of AgTiB2 contact under different contact forces and electrode gaps. Trans. Nonferrous Met. Soc. China 2019, 29, 1046–1056. [Google Scholar] [CrossRef]
  28. Wang, J.; Kang, Y.; Wang, C.; Wang, J.; Fu, C. Resistance to arc erosion characteristics of CuO skeleton-reinforced Ag-CuO contact materials. J. Alloys Compd. 2018, 756, 202–207. [Google Scholar] [CrossRef]
  29. Wu, C.; Yi, D.; Weng, W.; Li, S.; Zhou, J.; Zheng, F. Arc erosion behavior of Ag/Ni electrical contact materials. Mater. Design 2015, 85, 511–519. [Google Scholar] [CrossRef]
  30. Long, F.; Guo, X.; Song, K.; Jia, S.; Yakubov, V.; Li, S.; Liang, S. Enhanced arc erosion resistance of TiB2/Cu composites reinforced with the carbon nanotube network structure. Mater. Des. 2019, 183, 108136. [Google Scholar] [CrossRef]
  31. Wang, H.T.; Wang, Z.X.; Wang, L.Z.; Wang, J.Q.; Zhu, Y.C. Effect of sintering temperature on the physical properties and electrical contact properties of doped AgSnO2 contact materials. Int. J. Miner. Metall. Mater. 2018, 23, 1275. [Google Scholar] [CrossRef]
  32. Li, A.; Zhou, W.; Xie, M.; Wang, S.; Wang, S.; Yang, Y.; Chen, Y.T.; Liu, M.M. Preparation and arc erosion behavior of AgNi10 contact material with different allotropes of carbon addition. Diam. Relat. Mater. 2021, 111, 108141. [Google Scholar] [CrossRef]
  33. Boddy, P.J.; Utsumi, T. Fluctuation of arc potential caused by metalvapor diffusion in arcs in air. J. Appl. Phys. 1971, 42, 3369–3373. [Google Scholar] [CrossRef]
  34. Gray, E.W. Some spectroscopic observations of the two regions (metallic vapor and gaseous) in break arcs. IEEE Trans. Plasma Sci. 1973, PS-1, 30–33. [Google Scholar] [CrossRef]
  35. Chen, Z.K.; Sawa, K. Effect of arc behavior on material transfer: A review. IEEE Trans. Compon. Packaging Manuf. Technol. A 1998, 21, 310–322. [Google Scholar] [CrossRef]
Figure 1. Experimental operation flow diagram.
Metals 13 01394 g001
Figure 2. JF04C electrical contact test apparatus. (a) Photograph, (b) schema.
Metals 13 01394 g002
Figure 3. Photograph of S-3400N scanning electron microscopy.
Metals 13 01394 g003
Figure 4. Pt–Ir contact materials of different Y are added in the XRD pattern. (a) diffraction spectra of Pt–10Ir and Pt–10Ir–1Y, (b)diffraction spectra of Pt-25Ir and Pt–25Ir–1Y, (c) Pt–Ir binary phase diagrams, (d) Ir–Y binary phase diagrams, (e) Pt–Y binary phase diagrams.
Metals 13 01394 g004
Figure 5. The macroscopic morphology of Pt-10Ir and Pt-25Ir eroded composites under the same voltage and different current conditions: (a,g) 12 V, 15 A, anode, (b,h) 12 V, 15 A, cathode, (c,i) 24 V, 15 A, anode, (d,j) 24 V, 15 A, cathode, (e,k) 36 V, 15 A, anode, (f,l) 36 V, 15 A, cathode.
Metals 13 01394 g005
Figure 6. The macroscopic morphology of Pt-10Ir-1Y and Pt-25Ir-1Y eroded composites under the same voltage and different current conditions: (a,g) 12 V, 15 A, anode, (b,h) 12 V, 15 A, cathode, (c,i) 24 V, 15 A, anode, (d,j) 24 V, 15 A, cathode, (e,k) 36 V, 15 A, anode, (f,l) 36 V, 15 A, cathode.
Metals 13 01394 g006
Figure 7. The micro-morphology of the Pt–Ir moving contact material after 10,000 runs under the same voltage and different current conditions (the red and blue boxes indicate the enlarged areas in the previous picture). yellow circle: pore and hole. (a) 12 V, 15 A, Pt–10Ir’s anode, (b) 12 V, 15 A, Pt–10Ir’s cathode, (c) 24 V, 15 A, Pt–10Ir’s anode, (d) 24 V, 15 A, Pt–10Ir’s cathode, (e) 36 V, 15 A, Pt–10Ir’s anode, (f) 36 V, 15 A, Pt–10Ir’s cathode, (g) 12 V, 15 A, Pt–25Ir’s anode, (h) 12 V, 15 A, Pt–25Ir’s cathode, (i) 24 V, 15 A, Pt–25Ir’s anode, (j) 24 V, 15 A, Pt–25Ir’s cathode, (k) 36 V, 15 A, Pt–25Ir’s anode, (l) 36 V, 15 A, Pt–25Ir’s cathode.
Metals 13 01394 g007
Figure 8. The micro-morphology of the Pt–Ir–Y moving contact material after 10,000 runs under the same voltage and different current conditions (the red and blue boxes indicate the enlarged areas in the previous picture). yellow circle: pore and hole, green circle: micro-crack. (a) 12 V, 15 A, Pt–10Ir–1Y’s anode, (b) 12 V, 15 A, Pt–10Ir–1Y’s cathode, (c) 24 V, 15 A, Pt–10Ir–1Y’s anode, (d) 24 V, 15 A, Pt–10Ir–1Y’s cathode, (e) 36 V, 15 A, Pt–10Ir–1Y’s anode, (f) 36 V, 15 A, Pt–10Ir–1Y’s cathode, (g) 12 V, 15 A, Pt–25Ir–1Y’s anode, (h) 12 V, 15 A, Pt–25Ir–1Y’s cathode, (i) 24 V, 15 A, Pt–25Ir–1Y’s anode, (j) 24 V, 15 A, Pt–25Ir–1Y’s cathode, (k) 36 V, 15 A, Pt–25Ir–1Y’s anode, (l) 36 V, 15 A, Pt–25Ir–1Y’s cathode.
Metals 13 01394 g008
Figure 9. SEM scanning analysis of Pt–25Ir (24 V, 15 A) and Pt-25Ir–Y (24 V, 15 A) moving contact materials. (ad,il) Microscopic positions of the point energy spectrum, (eh,mp) Spectra of point energy spectra.
Metals 13 01394 g009
Figure 10. Pt–Ir and Pt–Ir–Y electrical contact materials in 10,000 operations under the same current, different voltage conditions, the average arc energy, and the arc time and welding force per 100 operations. (a) average arc time of Pt–10Ir, (b) average arc energy of Pt–10Ir, (c) average welding force of Pt–10Ir, (d) average arc time of Pt–25Ir, (e) average arc energy of Pt–25Ir, (f) average welding force of Pt–25Ir, (g) average arc time of Pt–10Ir–1Y, (h) average arc energy of Pt–10Ir–1Y, (i) average welding force of Pt–10Ir–1Y, (j) average arc time of Pt–25Ir–1Y, (k) average arc energy of Pt–25Ir–1Y, (l) average welding force of Pt–25Ir–1Y.
Metals 13 01394 g010
Figure 11. The cumulative frequency curve of welding force for Pt–Ir and Pt–Ir–Y under the same current, different voltage conditions. (a) Pt–10Ir, (b) Pt–25Ir, (c) Pt–10Ir–1Y, (d) Pt–25Ir–1Y.
Metals 13 01394 g011
Figure 12. The contact resistance of Pt–Ir and Pt–Ir–Y under the same voltage and different current conditions. (a) 12 V, 15 A, Pt–10Ir, (b) 24 V, 15 A, Pt–10Ir, (c) 36 V, 15 A, Pt–10Ir, (d) 12 V, 15 A, Pt–25Ir, (e) 24 V, 15 A, Pt–25Ir, (f) 36 V, 15 A, Pt–25Ir, (g) 12 V, 15 A, Pt–10Ir–1Y, (h) 24 V, 15 A, Pt–10Ir–1Y, (i) 36 V, 15 A, Pt–10Ir–1Y, (j) 12 V, 15 A, Pt–25Ir–1Y, (k) 24 V, 15 A, Pt–25Ir–1Y, (l) 36 V, 15 A, Pt–25Ir–1Y.
Metals 13 01394 g012
Figure 13. Mass change in the eroded anode and cathode for (a) Pt–10Ir and (b) Pt–10Ir–1Y, (c) Pt–25Ir and (d) Pt–25 Ir–1Y contact materials.
Metals 13 01394 g013
Figure 14. Diagram of the physical process of the breaking arc. (a) the beginning of the breaking process, (b) the molten bridge, (c) the arc.
Metals 13 01394 g014
Table 1. Parameters of electrical contact test.
Circuit ConditionDC 12 V, 24 V, 36 V, 15 A, Resistive Load
Number of operations10,000
Switching frequency0.5 s
Contact force20 cN
Electrode spacing1 mm
Surrounding gasAir
Disclaimer/Publisher’s Note: The statements, opinions and data contained in all publications are solely those of the individual author(s) and contributor(s) and not of MDPI and/or the editor(s). MDPI and/or the editor(s) disclaim responsibility for any injury to people or property resulting from any ideas, methods, instructions or products referred to in the content.

