
Effects of Variated Final Temperature and Workpiece Thickness for Hot Rolling of Aluminum Alloy EN AW-8011
 , ,
, ,
Abstract
:1. Introduction
2. Experimental Procedure
3. Results
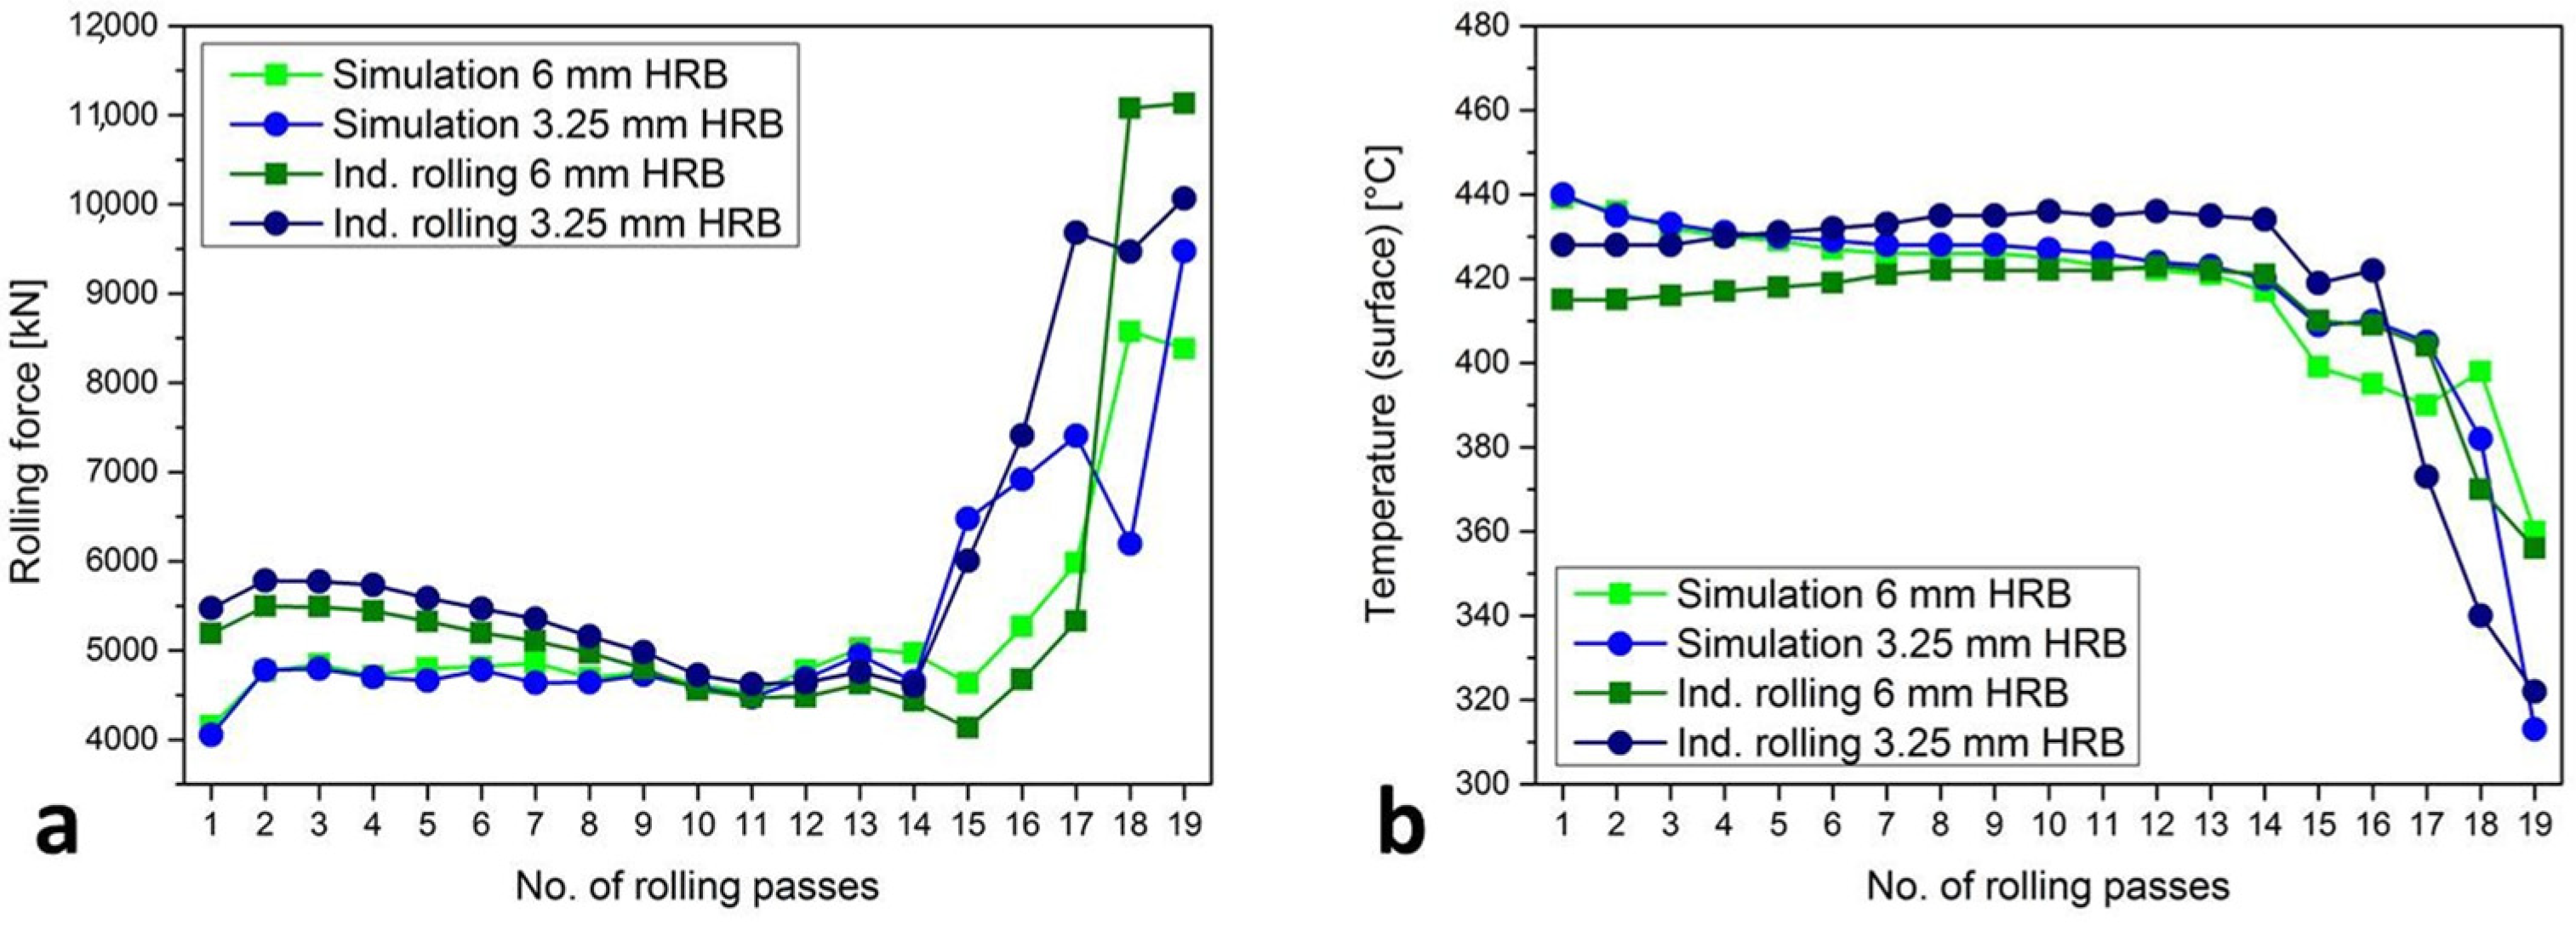
3.1. Simulations
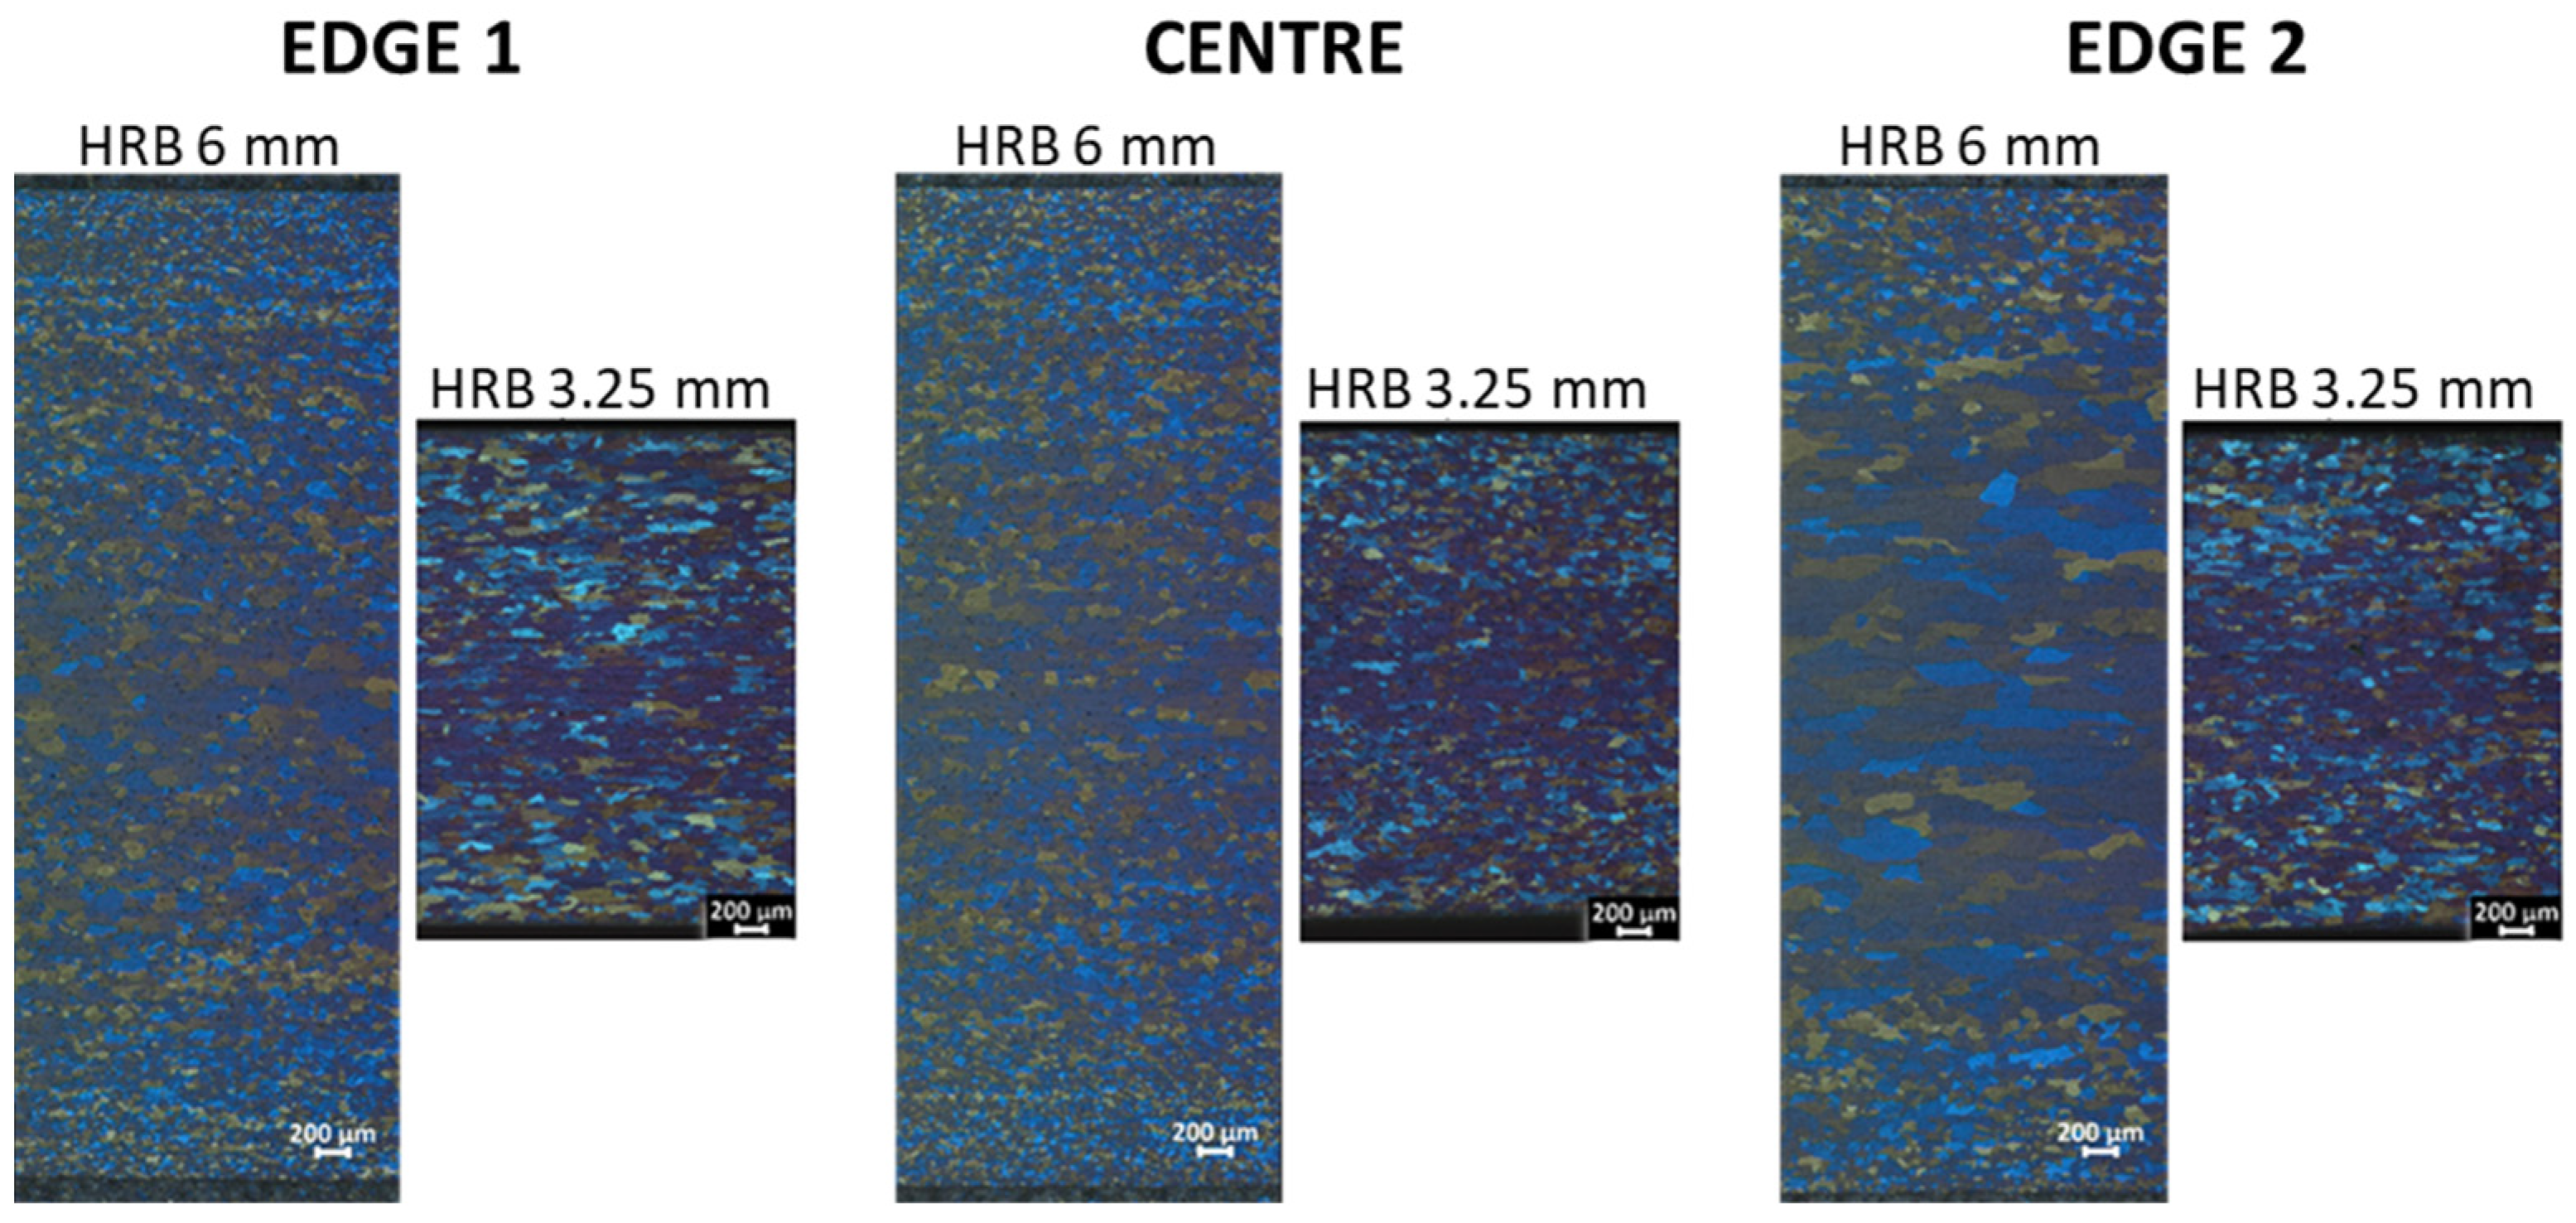
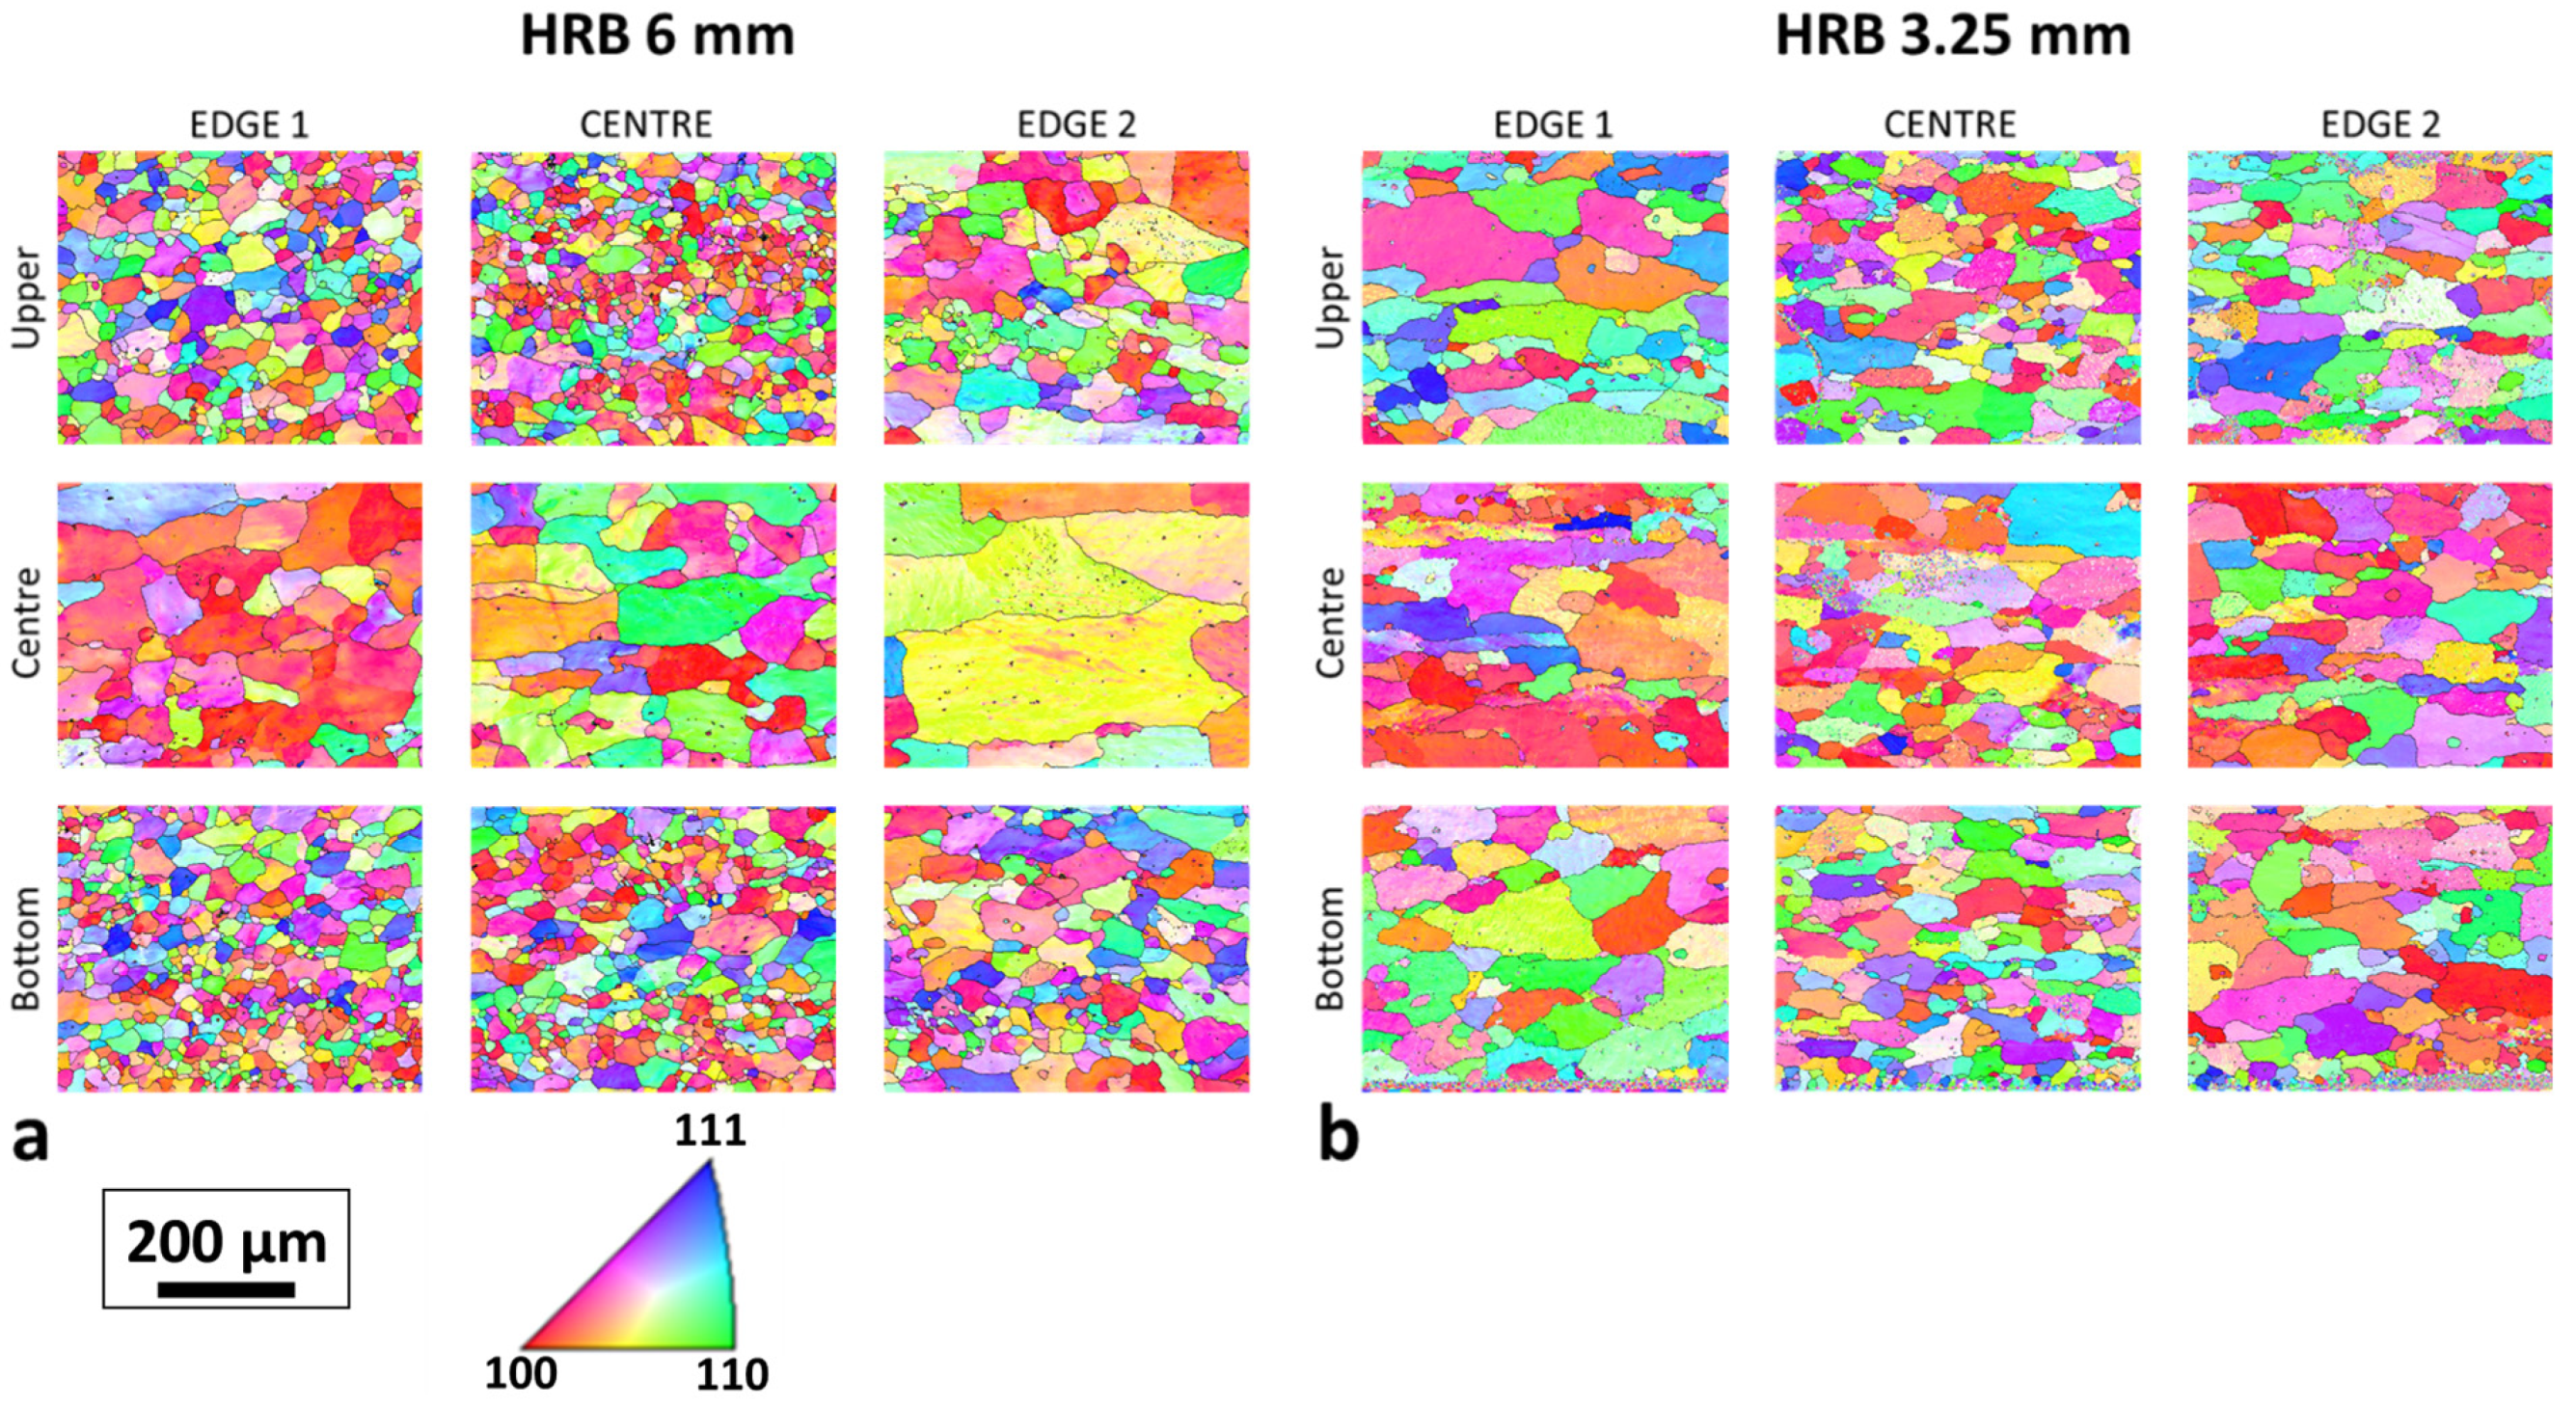
3.2. Metallography
3.3. Mechanical Properties and Formability
4. Discussion
5. Conclusions
- The hot rolling simulations predicted the rolling force and temperature on the surface of the workpiece for each rolling pass. Compared to the measured values of industrial hot rolling, the simulation results match to a greater extent and predict the possible intermediate deviations from increasing and decreasing trends.
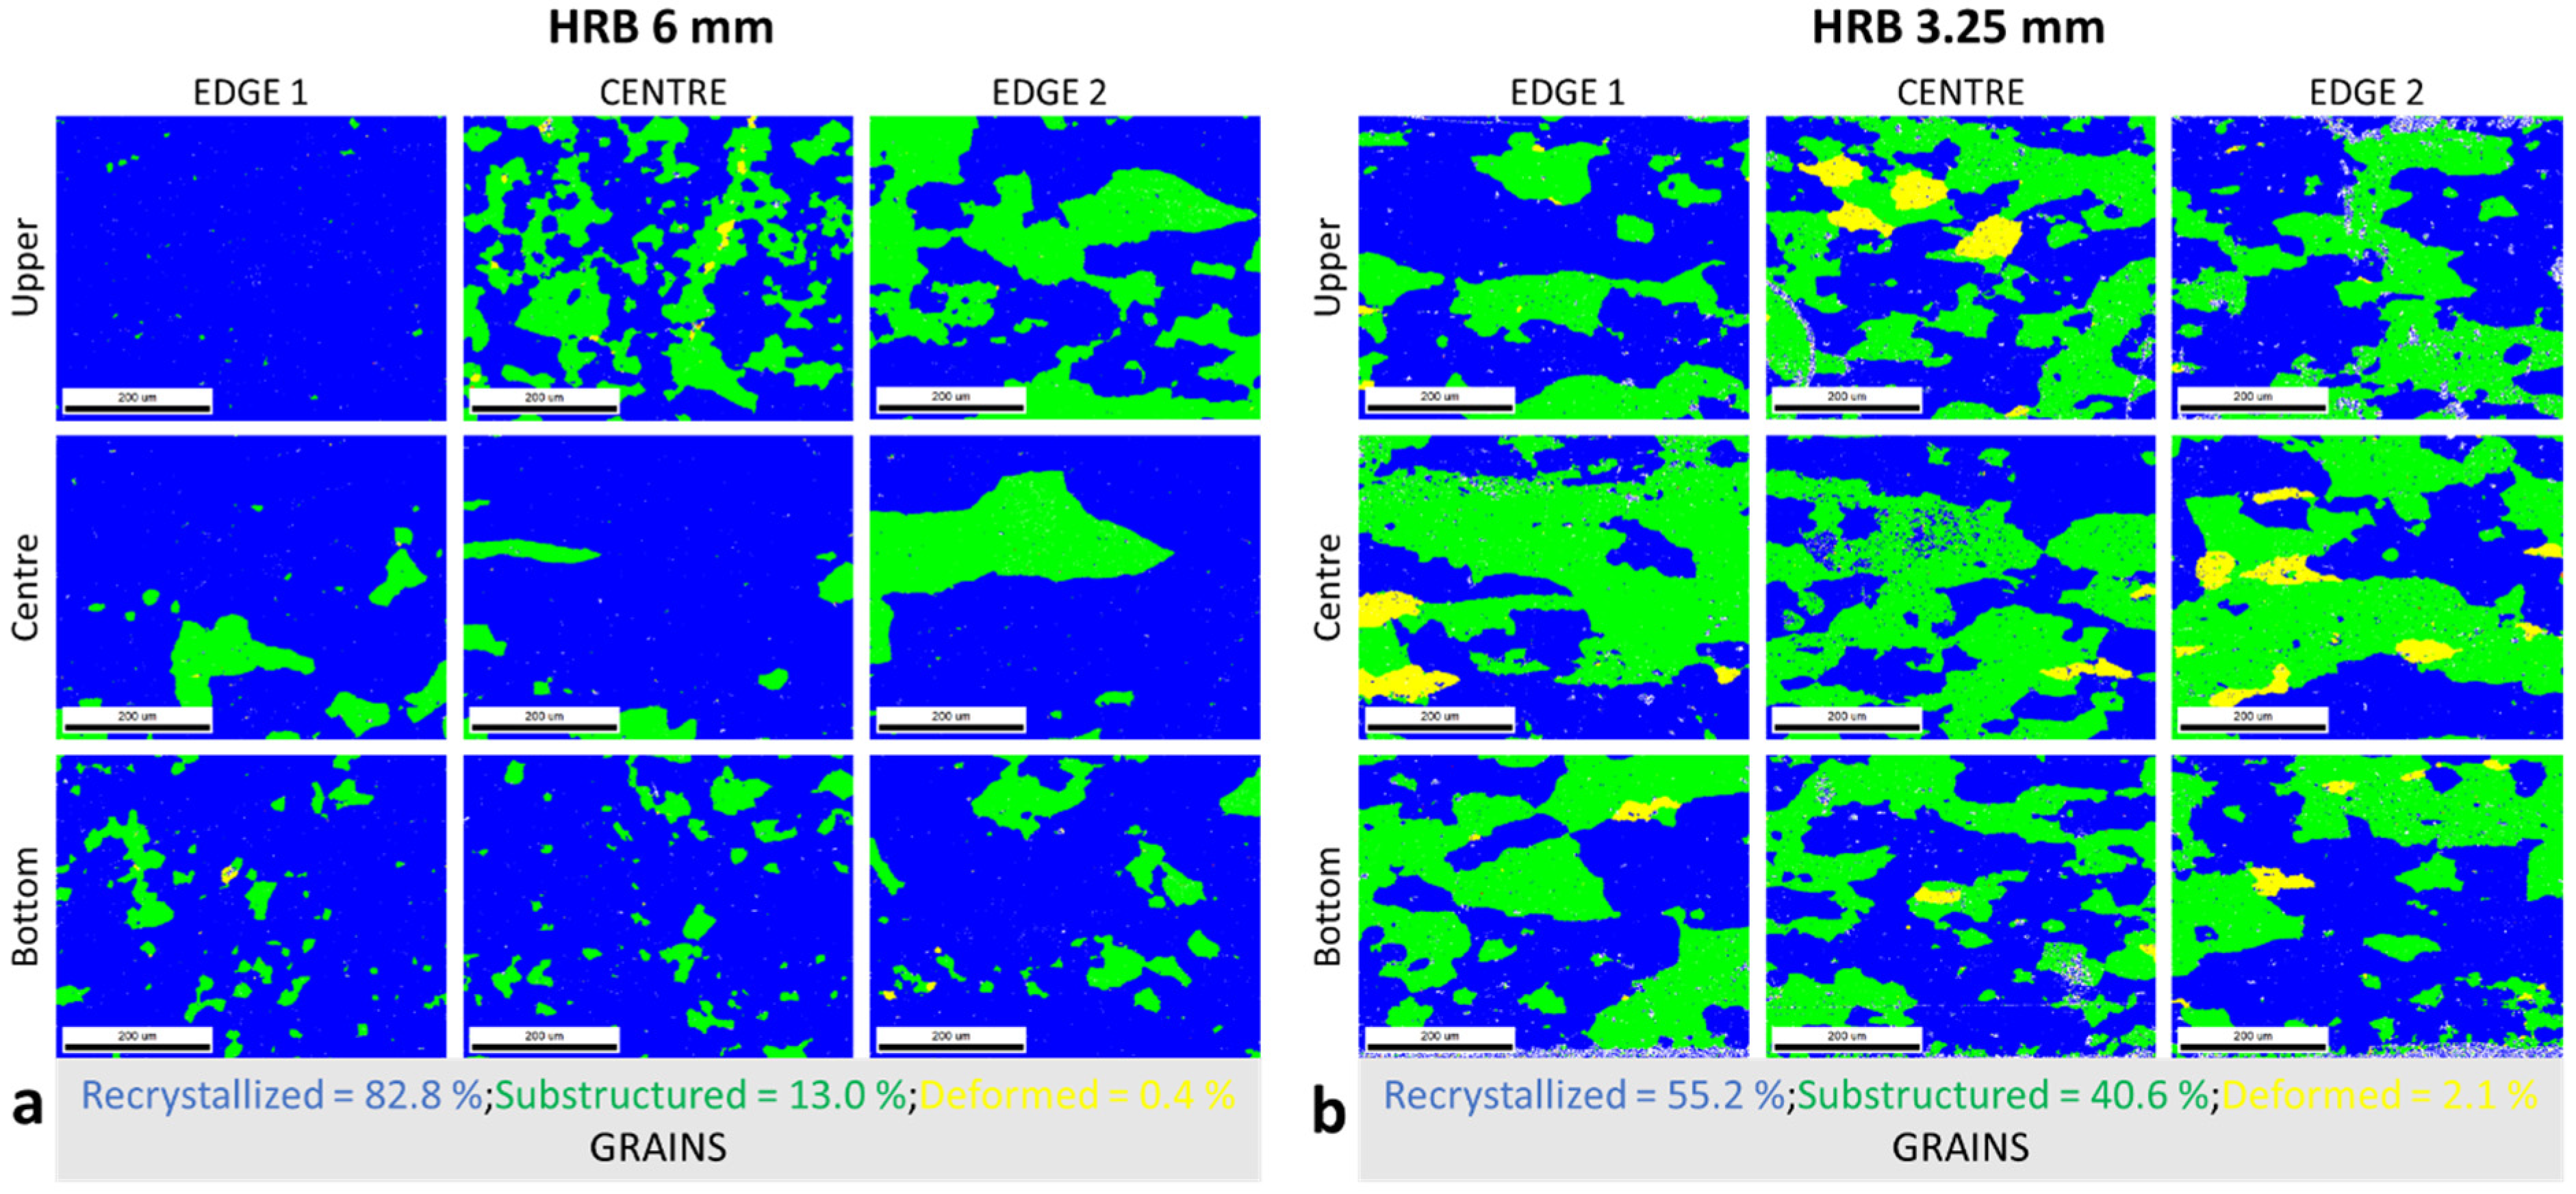
- The thickness and, consequently, the temperature reduction in HRBs provide the microstructure with more evenly distributed (homogeneous) grains of a similar size through the cross-section. For the 3.25 mm HRB, the smaller grains appeared in the center of the cross-section, unlike for the 6 mm HRB, where the smaller grains were detected on the top and bottom positions of the cross-section.
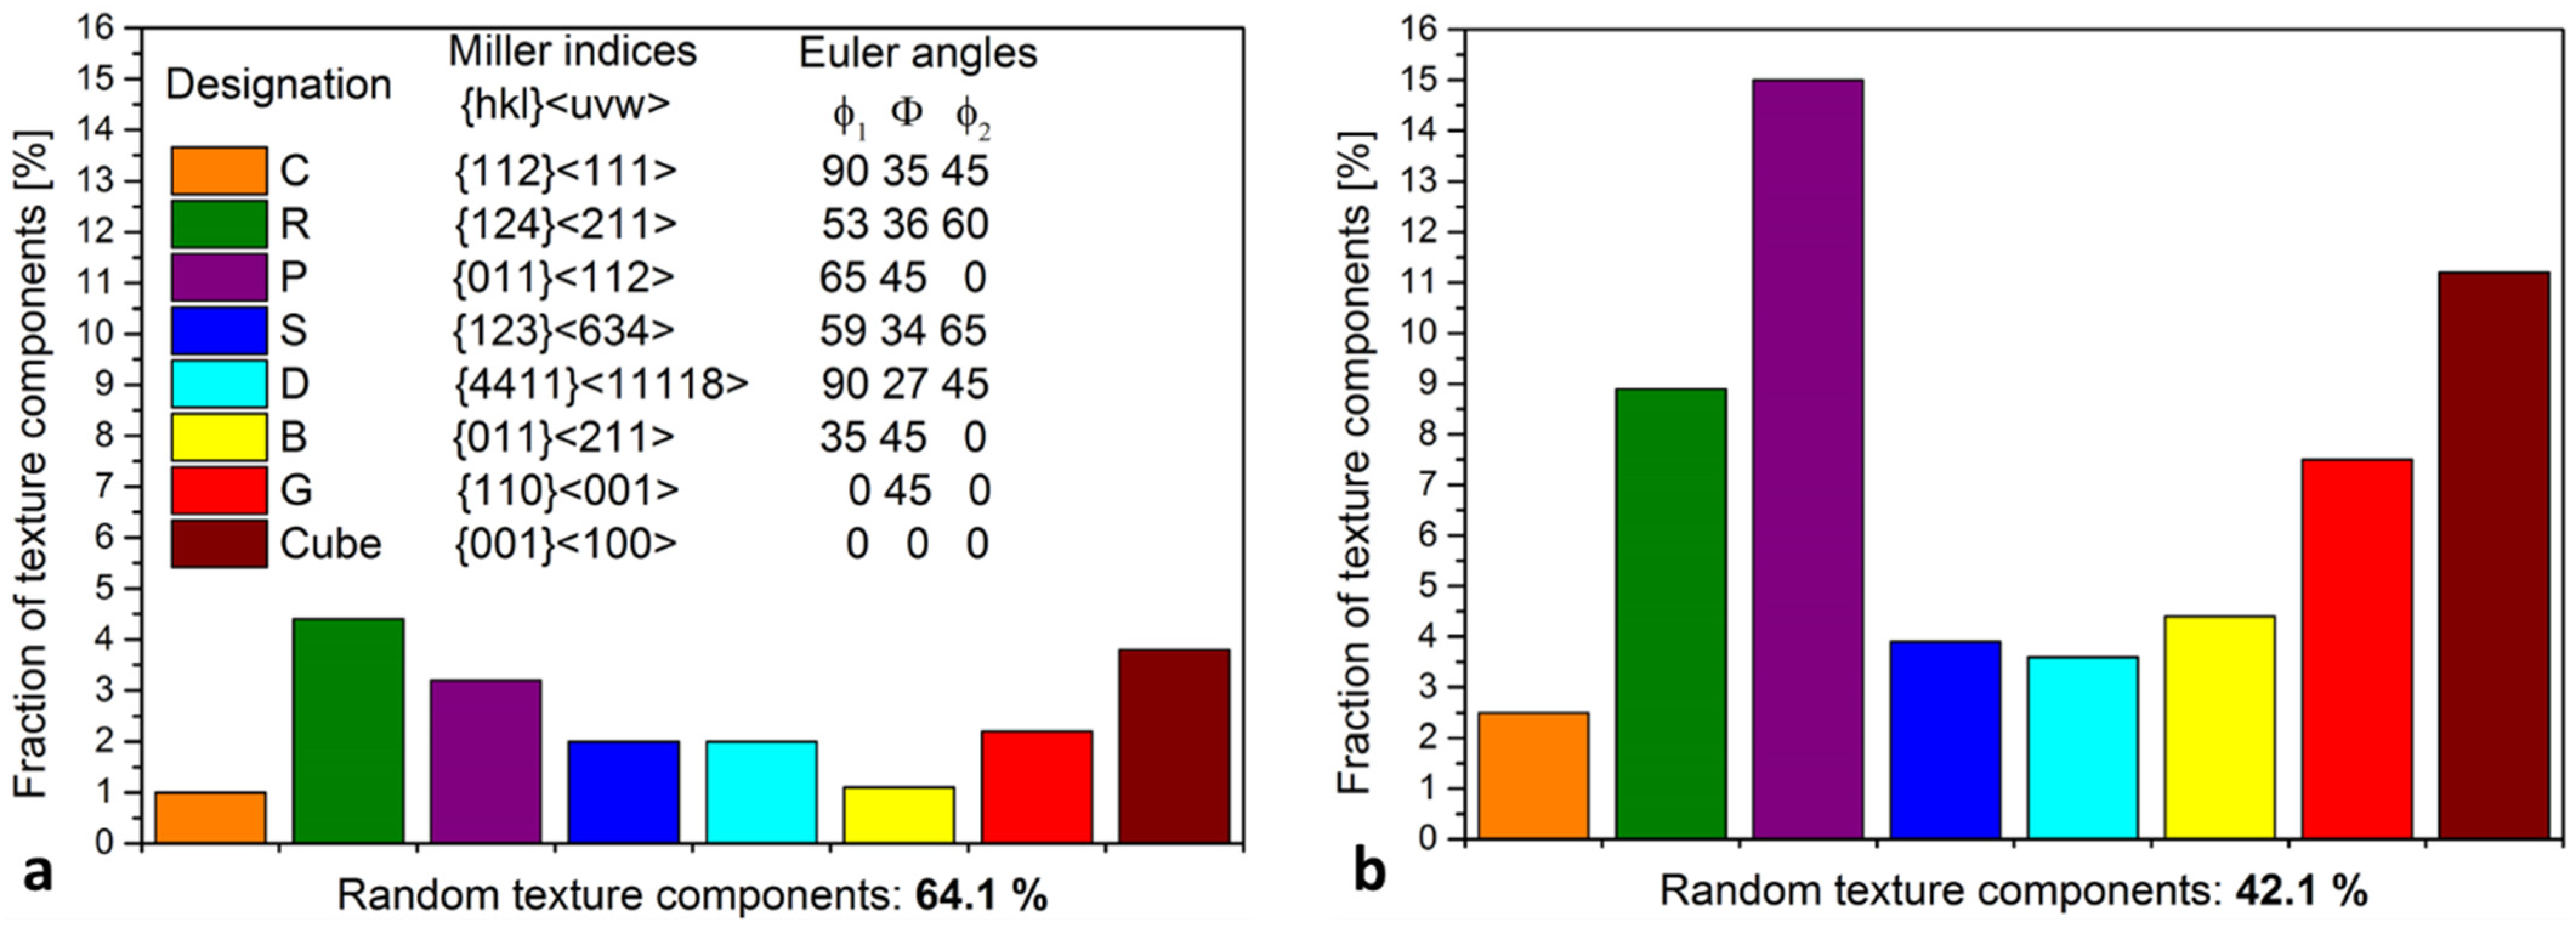
- The 6 mm HRB has 64% of random texture components and 83% of recrystallized grains. The effect of temperature and thickness reduction causes the proportional adjustment for 3.25 mm HRB, where 42% are random texture components and 55% of grains are recrystallized.
- Elongation (A) values in rolling (RD) and transverse (TD) directions significantly differ, only in the case of 3.25 mm HRB. Consequently, the earing results (Ea) are more than 1.5% higher for 3.25 mm HRB compared to 6 mm HRB.
Author Contributions
Funding
Data Availability Statement
Acknowledgments
Conflicts of Interest
Nomenclature
| HRB | Hot-rolled band |
| SEM | Scanning electron microscopy |
| EBSD | Electron backscatter diffraction |
| IPF-Z | Inverse pole figure in Z direction |
| GAM | Grain average misorientation |
| LM | Light microscopy |
| Rm | Ultimate tensile strength, MPa |
| Rp0.2 | Yield strength, MPa |
| A | Elongation, % |
| Ea | Earing measurements, % |
| RD | Rolling direction |
| TD | Transverse direction |
References
- Kraner, J.; Smolar, T.; Volšak, D.; Lažeta, M.; Skrbinek, R.; Fridrih, D.; Cvahte, P.; Godec, M.; Paulin, I. Influence of the Hot-Rolling Technique for En Aw-8021B Aluminium Alloy on the Microstructural Properties of a Cold-Rolled Foil. Mater. Tehnol. 2021, 55, 773–779. [Google Scholar] [CrossRef]
- Zhao, Q.; Liu, Z.; Li, S.; Huang, T.; Xia, P.; Lu, L. Evolution of the Brass texture in an Al-Cu-Mg alloy during hot rolling. J. Alloys Compd. 2017, 691, 786–799. [Google Scholar] [CrossRef]
- Maurice, C.; Driver, J.H. Hot rolling textures of aluminum. Mater. Sci. Forum 1994, 157–162, 807–812. [Google Scholar] [CrossRef]
- Neumann, L.; Kopp, R.; Ludwig, A.; Wu, M.; Bührig-Polaczek, A.; Schneider, M.; Crumbach, M.; Gottstein, G. Simulation of casting, homogenization, and hot rolling: Consecutive process and microstructure modelling for aluminium sheet production. Model. Simul. Mater. Sci. Eng. 2004, 12, S19–S31. [Google Scholar] [CrossRef] [Green Version]
- Nellippallil, A.B.; De, P.S.; Gupta, A.; Goyal, S.; Singh, A.K. Hot Rolling of a Non-heat Treatable Aluminum Alloy: Thermo-Mechanical and Microstructure Evolution Model. Trans. Indian Inst. Met. 2017, 70, 1387–1398. [Google Scholar] [CrossRef]
- Bruni, C.; El Mehtedi, M.; Forcellese, A.; Gabrielli, F.; Simoncini, M. Simulation of multipass hot rolling of AA6082 aluminium alloy. J. Steel Relat. Mater. 2004, 2, 109–114. [Google Scholar]
- Rudnytskyj, A.; Simon, P.; Jech, M.; Gachot, C. Constitutive modelling of the 6061 aluminium alloy under hot rolling conditions and large strain ranges. Mater. Des. 2020, 190, 108568. [Google Scholar] [CrossRef]
- Shahani, A.R.; Setayeshi, S.; Nodamaie, S.A.; Asadi, M.A.; Rezaie, S. Prediction of influence parameters on the hot rolling process using finite element method and neural network. J. Mater. Process. Technol. 2009, 209, 1920–1935. [Google Scholar] [CrossRef]
- Abolhasani, A.; Zarei-Hanzaki, A.; Abedi, H.R.; Rokni, M.R. The room temperature mechanical properties of hot rolled 7075 aluminum alloy. Mater. Des. 2012, 34, 631–636. [Google Scholar] [CrossRef]
- Byra Reddy, B.; Bharathesh, T.P.; Prasad, D.S. Effect of Hot rolling on Microstructure and Mechanical behaviour of B 4 C nano particulates reinforced Al6063alloy Composites. J. Mech. Civ. Eng. 2021, 18, 53–62. [Google Scholar] [CrossRef]
- Zheng, C.; Wang, Y.; Jin, J.; Gong, P.; Wang, X.; Wen, H.; Zhang, M. Recrystallization and grain growth behavior of variously deformed CoCrFeMnNi high-entropy alloys: Microstructure characterization and modeling. J. Mater. Res. Technol. 2022, 20, 2277–2292. [Google Scholar] [CrossRef]
- Yoda, R.; Yokomaku, T.; Tsuji, N. Plastic deformation and creep damage evaluations of type 316 austenitic stainless steels by EBSD. Mater. Charact. 2010, 61, 913–922. [Google Scholar] [CrossRef]
- Ghosh, S.; Patnamsetty, M.; Somani, M.C.; Peura, P. Characteristics of dynamic softening during high temperature deformation of CoCrFeMnNi high-entropy alloy and its correlation with the evolving microstructure and micro-texture. J. Mater. Res. Technol. 2021, 15, 6608–6623. [Google Scholar] [CrossRef]
- Kraner, J.; Fajfar, P.; Palkowski, H.; Kugler, G.; Godec, M.; Paulin, I. Microstructure and texture evolution with relation to mechanical properties of compared symmetrically and asymmetrically cold rolled aluminum alloy. Metals 2020, 10, 156. [Google Scholar] [CrossRef] [Green Version]
- Kraner, J.; Fajfar, P.; Palkowski, H.; Godec, M.; Paulin, I. Asymmetric cold rolling of an aa 5xxx aluminium alloy. Mater. Tehnol. 2020, 54, 575–582. [Google Scholar] [CrossRef]
- Rudnytskyj, A.; Vorlaufer, G.; Leimhofer, J.; Jech, M.; Gachot, C. Estimating the real contact area in lubricated hot rolling ofaluminium André. Tribiol. Int. 2023, 180, 108283. [Google Scholar] [CrossRef]
- Kraner, J.; Smolar, T.; Volsak, D.; Cvahte, P.; Godec, M.; Paulin, I. A Review of Asymmetric Rolling Osnovni Pregled Asimetričnega Valjanja. Mater. Tehnol. 2020, 54, 731–743. [Google Scholar] [CrossRef]
- Frodal, B.H.; Thomesen, S.; Børvik, T.; Hopperstad, O.S. On fracture anisotropy in textured aluminium alloys. Int. J. Solids Struct. 2022, 244–245, 111563. [Google Scholar] [CrossRef]
- Brun, O.; Chauveau, T.; Bacroix, B. Influence of temperature on hot rolling textures of aluminium alloys in absence of recrystallisation. Mater. Sci. Technol. 1991, 7, 167–175. [Google Scholar] [CrossRef]
- Sidor, J.J. Effect of hot band on texture evolution and plastic anisotropy in aluminium alloys. Metals 2021, 11, 1310. [Google Scholar] [CrossRef]
- Kraner, J.; Kevorkijan, V.; Godec, M.; Paulin, I. Metallographic Methods for Determining the Quality of Aluminium Alloys. Mater. Tehnol. 2021, 55, 541–547. [Google Scholar] [CrossRef]
- Gravier, P.; Mas, F.; Barthelemy, A.; Boller, E.; Salvo, L.; Lhuissier, P. Pore closure in thick aluminum plate: From industrial hot rolling to individual pore observation. J. Mater. Process. Technol. 2022, 303, 117509. [Google Scholar] [CrossRef]
- Macek, W.; Branco, R.; Szala, M.; Marciniak, Z.; Ulewicz, R.; Sczygiol, N.; Kardasz, P. Profile and areal surface parameters for fatigue fracture characterisation. Materials 2020, 13, 3691. [Google Scholar] [CrossRef] [PubMed]
- Zhang, L.; Wang, Y.; Yang, X.; Li, K.; Ni, S.; Du, Y.; Song, M. Texture, microstructure and mechanical properties of 6111 aluminum alloy subject to rolling deformation. Mater. Res. 2017, 20, 1360–1368. [Google Scholar] [CrossRef] [Green Version]
- Danilov, S.V.; Mustaeva, I.A.; Golovnin, M.A. Influence of hot rolling technological regimes on 6061 aluminium alloy sheet texture. Solid State Phenom. 2017, 265, 999–1004. [Google Scholar] [CrossRef]
- Li, W.; Wu, M.; Xiao, D.; Huang, L.; Liu, W.; Tang, S. Effect of rolling temperature on microstructure and properties of TA31 titanium alloy hot rolled plate. Materials 2022, 15, 7517. [Google Scholar] [CrossRef]
- Zhao, X.; Chen, L.; He, K.; Wu, N.; Zeng, J. Effect of contact heat transfer on hot rolling of aluminum alloy. Procedia Manuf. 2019, 37, 91–96. [Google Scholar] [CrossRef]
- Wang, B.B.; Xie, G.M.; Wu, L.H.; Xue, P.; Ni, D.R.; Xiao, B.L.; Liu, Y.D.; Ma, Z.Y. Grain size effect on tensile deformation behaviors of pure aluminum. Mater. Sci. Eng. A 2021, 820, 141504. [Google Scholar] [CrossRef]
- Skejić, D.; Dokšanović, T.; Čudina, I.; Mazzolani, F.M. The basis for reliability-based mechanical properties of structural aluminium alloys. Appl. Sci. 2021, 11, 4485. [Google Scholar] [CrossRef]
- Hirsch, J. Texture evolution during rolling of aluminium alloys. TMS Light Met. 2008, 2008, 1071–1077. [Google Scholar]
- Yoshida, K.; Ishizaka, T.; Kuroda, M.; Ikawa, S. The effects of texture on formability of aluminum alloy sheets. Acta Mater. 2007, 55, 4499–4506. [Google Scholar] [CrossRef]


| Si | Fe | Mn | Mg | Cu | Ti | Al | |
|---|---|---|---|---|---|---|---|
| Standard EN AW-8011 | 0.65–0.80 | 0.65–0.75 | 0.08–0.10 | 0.03–0.05 | <0.1 | 0.02–0.04 | Bal. |
| 6 mm HRB | 0.68 | 0.68 | 0.09 | 0.04 | 0.01 | 0.03 | Bal. |
| 3.25 mm HRB | 0.68 | 0.67 | 0.09 | 0.04 | 0.01 | 0.02 | Bal. |
| Sample | Position | Average Crystal Grain Size Diameter (µm) | |||
|---|---|---|---|---|---|
| 6 mm HRB | 3.25 mm HRB | ||||
| LM | SEM-EBSD | LM | SEM-EBSD | ||
| EDGE 1 | Top | 30.4 | 32.4 | 75.5 | 84.9 |
| Centre | 95.4 | 92.5 | 89.8 | 83.4 | |
| Bottom | 32.5 | 29.4 | 63.5 | 82.2 | |
| CENTRE | Top | 34.8 | 28.3 | 53.4 | 52.6 |
| Centre | 89.8 | 88.2 | 63.5 | 64.9 | |
| Bottom | 30.4 | 32.3 | 53.4 | 45.5 | |
| EDGE 2 | Top | 57.4 | 65.4 | 75.5 | 57.4 |
| Centre | 198.2 | 213.7 | 75.5 | 68.4 | |
| Bottom | 51.3 | 49.9 | 75.5 | 66.1 | |
| Sample | Direction | Rm (MPa) | Rp0.2 (MPa) | A (%) | Ea (%) | ||||
|---|---|---|---|---|---|---|---|---|---|
| HRB 6 mm | HRB 3.25 mm | HRB 6 mm | HRB 3.25 mm | HRB 6 mm | HRB 3.25 mm | HRB 6 mm | HRB 3.25 mm | ||
| EDGE 1 | RD | 103 | 97 | 37 | 37 | 40.0 | 41.6 | 1.04 | 2.58 |
| TD | 95 | 89 | 35 | 36 | 40.4 | 32.3 | |||
| CENTRE | RD | 102 | 101 | 36 | 35 | 40.4 | 40.1 | 1.03 | 1.79 |
| TD | 97 | 96 | 36 | 34 | 40.0 | 33.2 | |||
| EDGE 2 | RD | 102 | 100 | 36 | 44 | 40.5 | 39.1 | 1.02 | 2.63 |
| TD | 95 | 94 | 35 | 40 | 41.0 | 25.8 | |||
Disclaimer/Publisher’s Note: The statements, opinions and data contained in all publications are solely those of the individual author(s) and contributor(s) and not of MDPI and/or the editor(s). MDPI and/or the editor(s) disclaim responsibility for any injury to people or property resulting from any ideas, methods, instructions or products referred to in the content. |
© 2023 by the authors. Licensee MDPI, Basel, Switzerland. This article is an open access article distributed under the terms and conditions of the Creative Commons Attribution (CC BY) license (https://creativecommons.org/licenses/by/4.0/).
Share and Cite
Kraner, J.; Cvahte, P.; Šuštarič, P.; Šuštar, T.; Donik, Č.; Paulin, I.; Kim, S.K.; Kim, K.I. Effects of Variated Final Temperature and Workpiece Thickness for Hot Rolling of Aluminum Alloy EN AW-8011. Metals 2023, 13, 1301. https://doi.org/10.3390/met13071301
Kraner J, Cvahte P, Šuštarič P, Šuštar T, Donik Č, Paulin I, Kim SK, Kim KI. Effects of Variated Final Temperature and Workpiece Thickness for Hot Rolling of Aluminum Alloy EN AW-8011. Metals. 2023; 13(7):1301. https://doi.org/10.3390/met13071301
Chicago/Turabian StyleKraner, Jakob, Peter Cvahte, Primož Šuštarič, Tomaž Šuštar, Črtomir Donik, Irena Paulin, Shae K. Kim, and Kyung Il Kim. 2023. "Effects of Variated Final Temperature and Workpiece Thickness for Hot Rolling of Aluminum Alloy EN AW-8011" Metals 13, no. 7: 1301. https://doi.org/10.3390/met13071301