Article

Microstructure and Phase Transition of Ag50.5Cu33.3Sn16.2-xInx Alloys through Experimental Study and Thermodynamic Calculation

School of Materials Science and Engineering & Guangxi Key Laboratory of Information Materials, Guilin University of Electronic Technology, Guilin 541004, China
*
Authors to whom correspondence should be addressed.
Metals 2023, 13(7), 1296; https://doi.org/10.3390/met13071296
Submission received: 16 June 2023 / Revised: 13 July 2023 / Accepted: 17 July 2023 / Published: 19 July 2023

Abstract

:
In this study, the solidified microstructure and phase transition temperatures of Ag50.5Cu33.3Sn16.2-xInx (x = 5.0, 6.6, 8.2, 9.1, 9.9, 10.7, 11.5, 12.3; at.%) alloys were investigated using a scanning electron microscope with energy dispersive spectrometer (SEM-EDS) and differential thermal analysis (DTA). The experimental microstructure of Ag50.5Cu33.3Sn16.2-xInx alloys demonstrates that the phase fraction of Fcc(Ag) phase increased gradually as the addition of In increased, while the phase fraction of Fcc(Cu) phase decreased. Moreover, the liquidus temperatures of Ag50.5Cu33.3Sn16.2-xInx alloys also decrease with increasing In content. In this work, the Ag-Cu-Sn-In quaternary thermodynamic database was ideally extrapolated from the published literature for Ag-Cu-Sn, Ag-Cu-In, Ag-Sn-In and Cu-Sn-In thermodynamic databases. The calculated vertical section of Ag50.5Cu33.3Sn16.2-Ag50.5Cu33.3In16.2 agreed generally with the phase transition temperatures measured in the present experiment. Finally, the solidification behaviors of Ag50.5Cu33.3Sn16.2-xInx as-cast alloys were analyzed by thermodynamic calculation of the Scheil–Gulliver non-equilibrium model. The simulated solidification processes of some Ag50.5Cu33.3Sn16.2-xInx alloys are, in general, consistent with the experimental results in the present work, which would provide a theoretical basis for the design of novel Ag-Cu-Sn-In brazing alloys.

1. Introduction

Excellent joints play a key role in ensuring the quality and reliability of welded parts [1,2]. With the speedy development of the electronics industry, there are increasing requirements for soldering and brazing technologies in the packaging of microelectronic devices [3,4]. Due to the toxicity of cadmium and lead, brazing/soldering alloys containing cadmium and lead are restricted in the applications of electrical and electronic devices [5,6,7]. Therefore, substitutes with the representation of silver-based solder have been attracted attention recently [8]. Among them, the eutectic and near-eutectic Ag-Cu alloys have attracted considerable attention owing to their high strength and high electrical conductivity [9,10]. Ag-Cu-Sn-based alloys have been used in industrial applications as brazing/soldering alloys due to their excellent mechanical properties [11,12,13]. However, the high price of silver has limited the further application of Ag-based brazing alloys [14]. Some alloying elements, such as In, Zn, Sb, Bi, Ni and rare-earth (RE) metals, have been added to Ag-Cu-Sn-based alloys in order to reduce costs and improve the performance of brazing/soldering alloys [15,16,17,18,19,20]. The reported investigations indicated that the addition of In can lower liquidus and solidus temperatures of Ag-Cu-Sn-based alloys and refine the grain to improve the strength of the joints [15,16,21]. The mechanical properties of Ag-Cu-Sn-based alloys are greatly influenced by the formed microstructure during the solidification process [22,23]. It is considered that a quantitative description of the solidification behavior of Ag-Cu-Sn-In alloys will help to effectively design novel Ag-based brazing/soldering alloys. At present, very few studies about the phase equilibria and solidification in In-added Ag-Cu-Sn alloys have been reported in the literature. Thermodynamic calculations via the CALPHAD (CALculation of PHAse Diagram) method provide a good prediction of the equilibrium phase relations and the non-equilibrium solidification process of multi-component Ag-Cu-Sn-based brazing/soldering alloys [24,25,26].
Therefore, the purpose of this work was to discuss the effect of In addition to the solidification behavior and solidified microstructure of Ag-Cu-Sn alloys, and to obtain a comprehensive overview of the solidification behavior of Ag-Cu-Sn alloys with different In contents through a combination of experiments and thermodynamic calculations.

2. Experimental Procedure

Pure metals Ag, Cu, Sn and In (with purity 99.99 wt.%) were used as starting materials to prepare Ag50.5Cu33.3Sn16.2-xInx (x = 5.0, 6.6, 8.2, 9.1, 9.9, 10.7, 11.5, 12.3; at.%) alloy samples with the vacuum arc-melting technique. The arc-melting process of the alloy samples was protected by high-purity argon gas to prevent the oxidation of the alloy samples at high temperature. Each alloy sample was re-melted four times to ensure the homogeneity of the composition and microstructure. It should be pointed out that the alloy samples were cooled down to room temperature through cold water in the Cu crucible, and thus the cooling rate of the alloy samples was not determined during the solidification process. During the arc-melting process, less than 1% of the mass of the alloy sample was lost, so no further measurement of its composition was performed.
To characterize the microstructure, the alloy samples installed in epoxy resin were ground using silicon carbide paper and then were polished. After grinding and polishing, the alloy samples were cleaned ultrasonically in ethyl alcohol absolute for 300 s. The microstructure and phase compositions of the formed phase in the alloy samples were identified using a scanning electron microscope with energy dispersive spectrometer (SEM-EDS, FEI 450G) (accelerating voltage 20 kV, scanning speed 10 μs, working distance 4.5 mm).
The thermal analysis determinations of Ag50.5Cu33.3Sn16.2-xInx alloys were performed by differential thermal analysis (DTA, TA Instruments SDT/Q-600) with an alumina crucible under a flowing argon atmosphere at heating and cooling rates of 10 K/min. Before testing, thermal analysis determinations were calibrated using the calibration materials In, Sn, Bi, Zn, Al, Ag, Au and Ni (TA Instruments-Waters LLC) as standard samples to eliminate the random errors and systematic errors. The uncertainty of the determined phase transformation temperature was estimated to be ±1 K.

3. Thermodynamic Calculation

The Gibbs energy functions of the pure elements Ag, Cu, Sn and In were taken from the SGTE (Scientific Group Thermodata Europe, Saint-Martin-d’Hères, France) pure element database compiled by Dinsdale [27]. The thermodynamic parameters for the Ag-Cu [28], Ag-In [29], Ag-Sn [30], Cu-In [31], Cu-Sn [32] and In-Sn [33] binary systems from the literature were adopted in the present work. The Ag-Cu-Sn ternary system was re-evaluated by Tong et al. [12] based on the available experimental data. To better describe the new experimental results, Tong [34] re-assessed the Ag-Cu-In, Ag-Sn-In and Cu-Sn-In systems considering the solid solubility of some intermetallic compounds. The calculated results were able to reproduce the experimental results well. No stable quaternary intermetallic compounds in the Ag-Cu-Sn-In quaternary system were reported in the available literature. To date, information on the phase equilibria of this quaternary system is also very limited. Assuming no quaternary interaction, the present work established a thermodynamic database of the Ag-Cu-Sn-In quaternary system by direct extrapolation from the thermodynamic description of the four ternary systems (i.e., Ag-Cu-Sn, Ag-Cu-In, Ag-Sn-In and Cu-Sn-In). The thermodynamic parameters of the Ag-Cu-In-Sn quaternary system were used in the present calculations and are shown as Supplementary Materials. In the following section, the thermodynamic models of various phases in the Ag-Cu-In-Sn quaternary system are demonstrated in detail.

3.1. Solution Phases

The solution phases Φ, including Liquid, Fcc, Bcc, Hcp, β-InSn, γ-InSn, Bct(Sn), Diamond(Sn) and Tetragonal(In), are described by the substitutional solution model. The molar Gibbs energy of the solution phase Φ was expressed by the Redlich–Kister–Muggianu polynomial [35,36]:
G Φ = G r e f Φ + G m i x Φ + G e x b i n Φ + G e x t e r Φ + G e x q u a Φ
with
G r e f Φ = x A g G 0 A g Φ + x C u G 0 C u Φ + x S n G 0 S n Φ + x I n G 0 I n Φ
G m i x Φ = R T · x A g l n x A g + x C u l n x C u + x S n l n x S n + x I n l n x I n
G e x b i n Φ = x A g x C u j = 0 n L A g , C u Φ j x A g x C u j + x A g x I n j = 0 n L A g , I n Φ j x A g x I n j + x A g x S n j = 0 n L A g , S n Φ j x A g x S n j + x C u x I n j = 0 n L C u , I n Φ j x C u x I n j   + x C u x S n j = 0 n L C u , S n Φ j x C u x S n j + x I n x S n j = 0 n L I n , S n Φ j x I n x S n j
G e x t e r Φ = x A g x C u x S n j = 0 n L A g , C u , S n Φ j x j + 1 x A g x C u x S n / 3 + x A g x C u x I n j = 0 n L A g , C u , I n Φ j x j + 1 x A g x C u x I n / 3 + x A g x S n x I n j = 0 n L A g , S n , I n Φ j x j + 1 x A g x S n x I n / 3 + x C u x S n x I n j = 0 n L C u , S n , I n Φ j x j + 1 x C u x S n x I n / 3
G e x q u a Φ = x A g x C u x S n x I n L A g , C u , S n , I n Φ
where G i Φ 0 is the molar Gibbs energy of the element i   ( i = Ag, Cu, Sn, In) with the structure Φ referred to the enthalpy of its stable state at 298.15 K and 1 bar, and G m Φ e x is the excess Gibbs energy ( m = binary, ternary, quaternary). x i is the mole fraction of the element i   ( i = Ag, Cu, Sn, In). R is the gas constant, and T is the temperature in Kelvin. L A , B Φ j (A, B = Ag, Cu, Sn or In, and A ≠ B), L A g , C u , S n Φ j (A, B, C = Ag, Cu, Sn or In, and A ≠ B ≠ C) and L A g , C u , S n , I n Φ are the binary, ternary and quaternary interaction parameters, respectively. All of these parameters are temperature-dependent, and usually expressed as a + b · T . The interaction coefficients, a and b , are either optimized based on the experimental data or computed from first-principles calculations [37].

3.2. Intermetallic Compounds

The sublattice model was applied to describe all the intermetallic compounds in the Ag-Cu-Sn-In quaternary system. The Ag-Cu-Sn-In quaternary system consists of many binary and ternary intermetallic compounds, such as Ag3Sn, Ag9In4, AgIn2, γ-CuIn, δ-Cu7In3, η-LT, Cu11In9, Cu3Sn, Cu10Sn3, Cu41Sn11, Cu6Sn5-h, Cu6Sn5-l, τ1-Cu11In2Sn and τ2-Cu2In3Sn. In the Ag-Cu-Sn system, there are six binary intermetallic compounds, including Ag3Sn, Cu3Sn, Cu10Sn3, Cu41Sn11, Cu6Sn5-h and Cu6Sn5-l. Based on the experimental results, the solubility of the third element in the intermetallic compounds in the Cu-Sn and Ag-Sn binary system is negligible. The intermetallic compound Ag3Sn was modeled by the two-sublattice model (Ag)0.75(Ag,Sn)0.25 to maintain the consistency with other databases [12]. The Gibbs energy of the Ag3Sn phase is expressed as:
G m A g 3 S n =   y A g I y A g I I G A g : A g A g 3 S n + y A g I y S n I I G A g : S n A g 3 S n + 0.75 R T y A g I ln y A g I   + 0.25 R T y A g I I ln y A g I I + y S n I I ln y S n I I + y A g I y A g I I y S n I I L A g : A g , S n A g 3 S n
where y i I and y i I I denote the mole fraction of i   ( i = Ag, Sn) in the first and second sublattice, respectively. Additionally, the parameters  G A g : A g A g 3 S n , G A g : S n A g 3 S n and L A g : A g , S n A g 3 S n are directly taken from the Ag-Sn binary system [30].
The intermetallic compounds Cu3Sn, Cu10Sn3, Cu41Sn11, Cu6Sn5-h and Cu6Sn5-l are treated as the stoichiometric compounds in this work. The molar Gibbs energies of these intermetallic compounds are expressed as:
G m C u 3 S n = 0.75 G 0 C u F c c + 0.25 G 0 S n B c t + A 1 + B 1 T
G m C u 10 S n 3 = 0.769 G 0 C u F c c + 0.231 G 0 S n B c t + A 2 + B 2 T
G m C u 41 S n 10 = 0.788 G 0 C u F c c + 0.212 G 0 S n B c t + A 3 + B 3 T
G m C u 6 S n 5 h = 0.545 G 0 C u F c c + 0.455 G 0 S n B c t + A 4 + B 4 T
G m C u 6 S n 5 l = 0.545 G 0 C u F c c + 0.455 G 0 S n B c t + A 5 + B 5 T
where G 0 A g F c c , G 0 C u F c c  and G 0 S n B c t are the Gibbs energies of the pure elements Ag, Cu and Sn. The parameters A 1 , A 2 , A 3 , A 4 , A 5  and B 1 , B 2 , B 3 , B 4 , B 5 were taken from the literature [12].
Based on the experimental results reported in the literature, no ternary intermetallic compounds were found in the Ag-Cu-Sn, Ag-Cu-In and Ag-Sn-In ternary systems. There are two ternary intermetallic compounds, τ1-Cu11In2Sn and τ2-Cu2In3Sn, in the Cu-Sn-In ternary system. According to the literature information [32], a two-sublattice model Cu0.77(In, Sn)0.23 and three-substance model Cu0.333In0.5Sn0.167 were used to describe τ1-Cu11In2Sn and τ2-Cu2In3Sn, respectively. The molar Gibbs energies of τ1-Cu11In2Sn and τ2-Cu2In3Sn are expressed as:
G m C u 11 I n 2 S n = y C u I y I n I I G C u : I n C u 11 I n 2 S n + y C u I y S n I I G C u : S n C u 11 I n 2 S n + 0.23 R T y I n I I ln y I n I I + y S n I I ln y S n I I + y C u I y I n I I y S n I I L C u : I n , S n C u 11 I n 2 S n
G m C u 2 I n 3 S n = 0.3333 G 0 C u F c c + 0.5 G 0 I n T e t r a g o n a l + 0.1667 G 0 S n B c t + A 6 + B 6 T
where the parameters A 6 and B 6 are evaluated in the literature [34]. G 0 C u F c c , G 0 I n T e t r a g o n a l and G 0 S n B c t are the Gibbs energies of the pure Fcc(Cu), Tetragonal(In) and Bct(Sn), respectively. y i I and y i I I denote the mole fraction of i   ( i   = Cu, Sn, In) in the first and second sublattice, respectively. Additionally, the parameters G C u : I n C u 11 I n 2 S n , G C u : S n C u 11 I n 2 S n were taken directly from the literature [32].

4. Results and Discussion

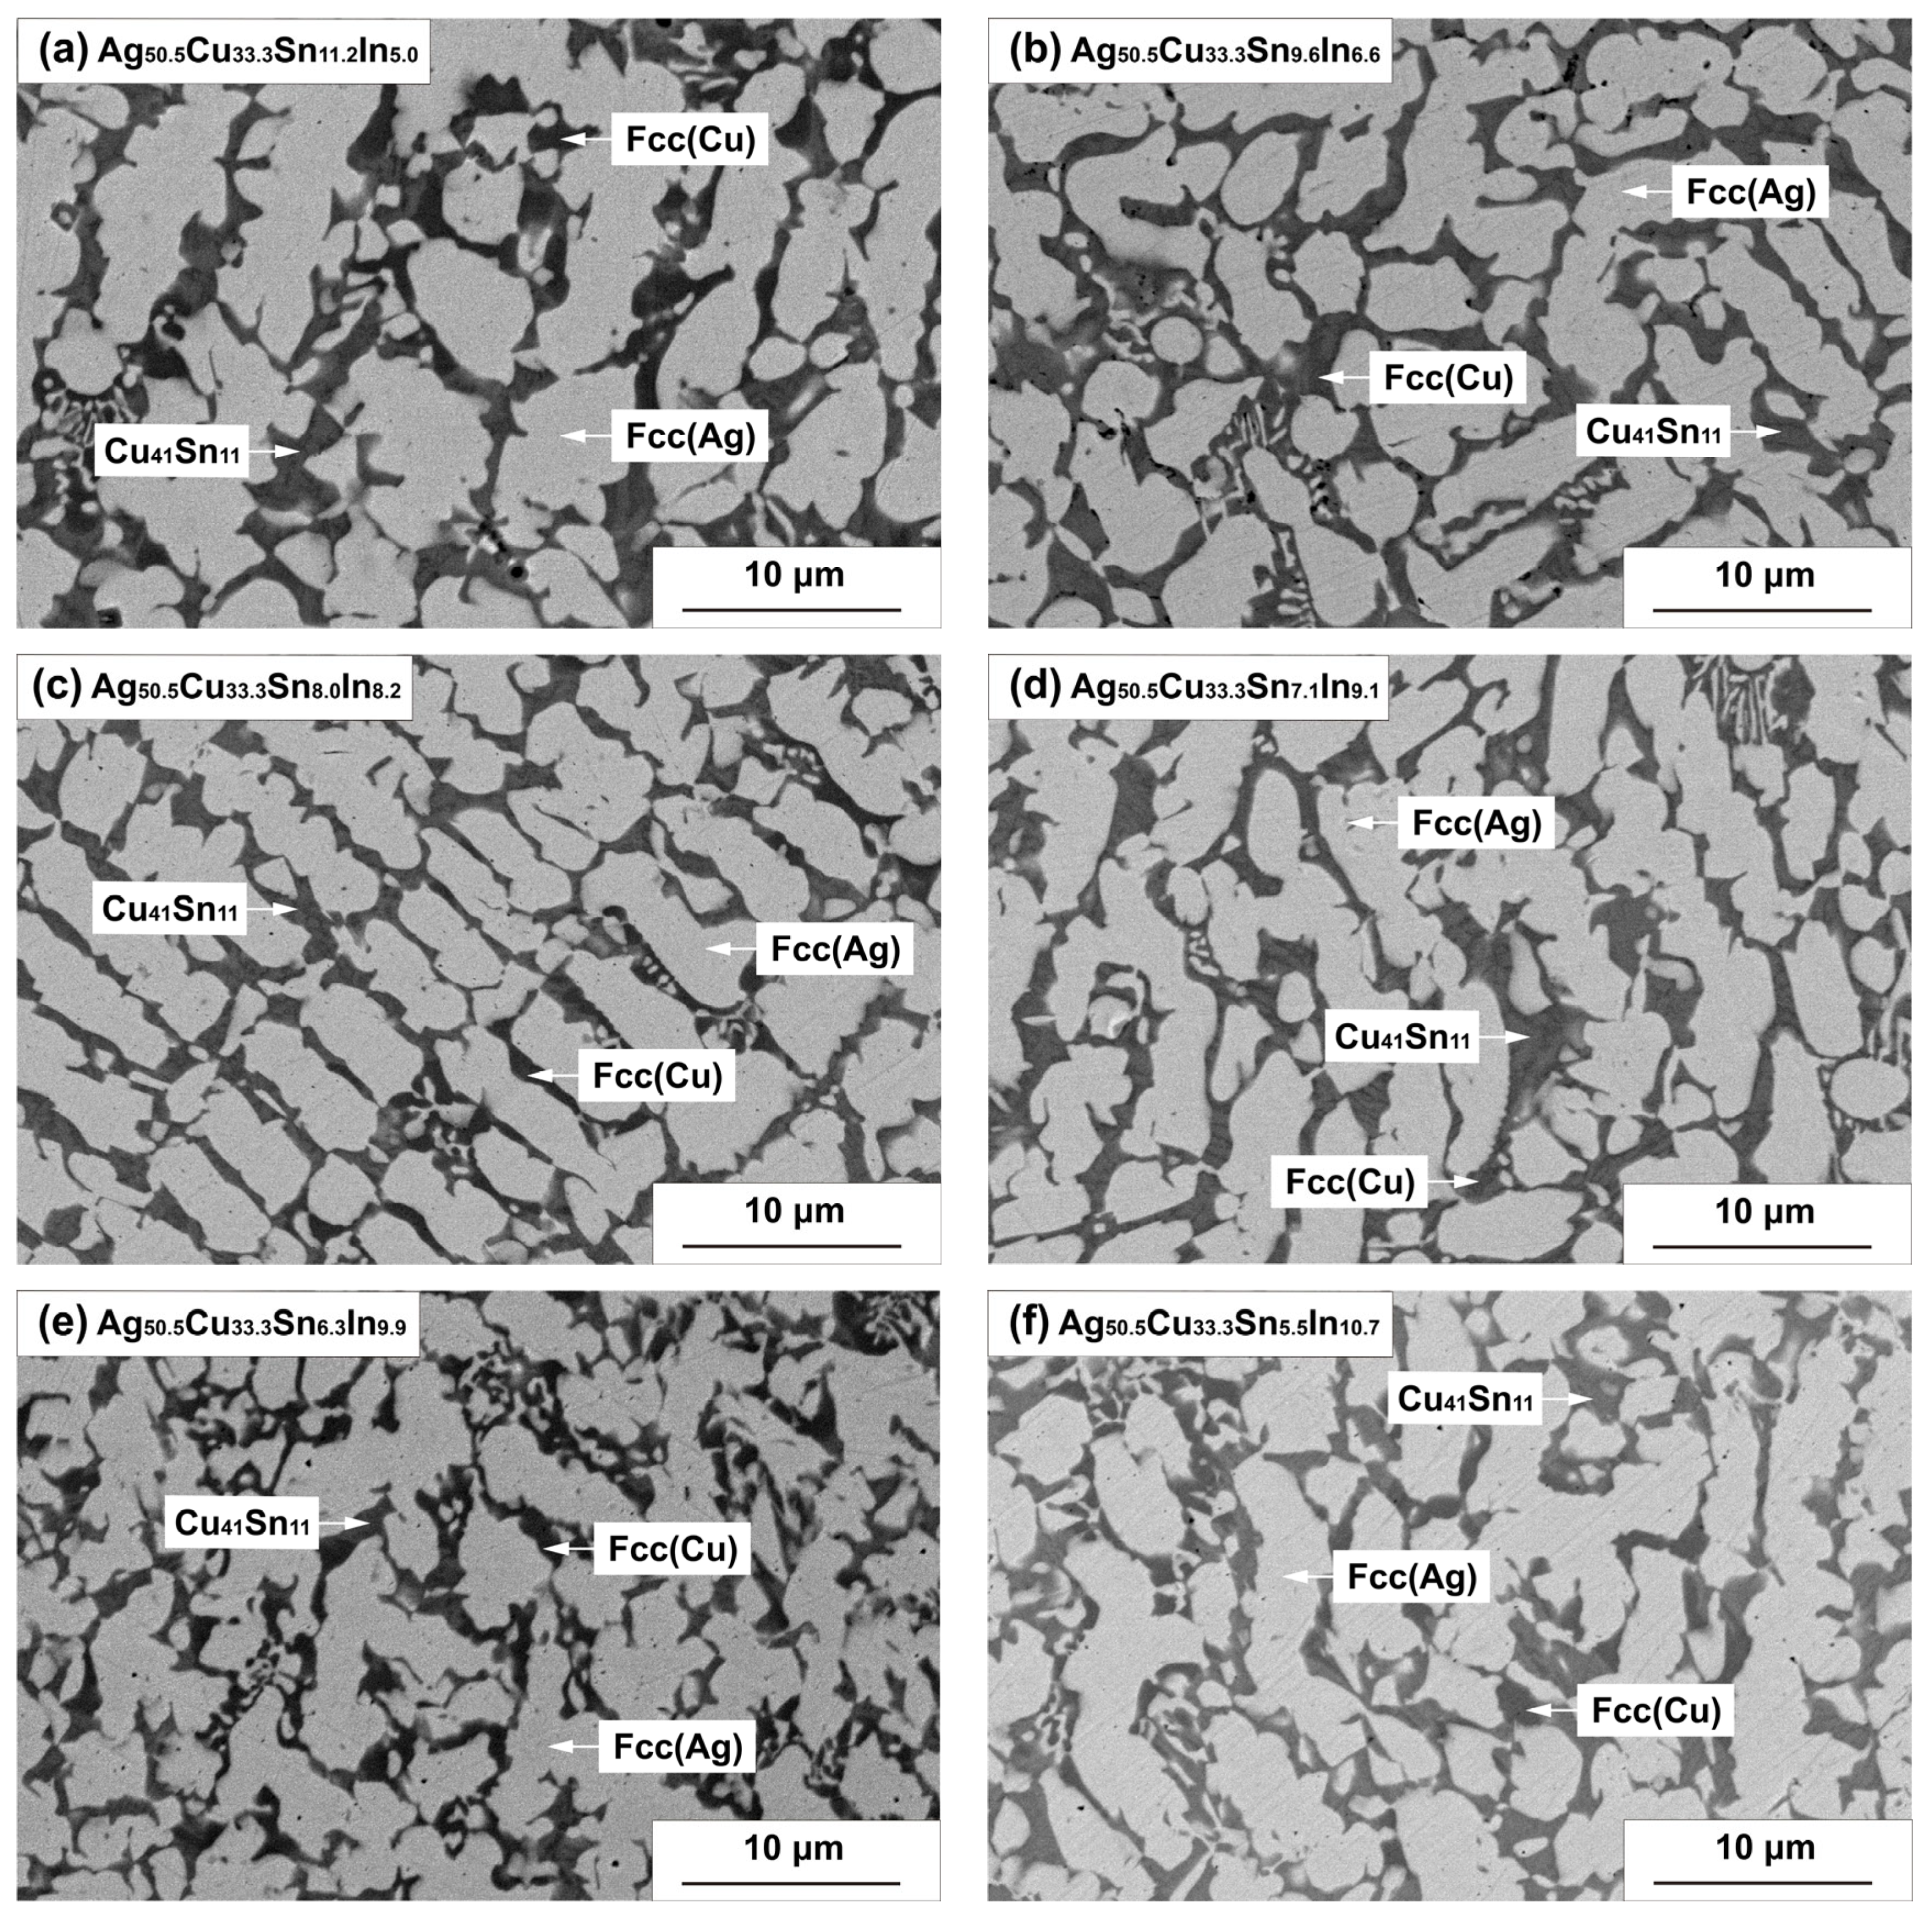
4.1. Microstructure Characterization

Figure 1 displays the back-scattered electron (BSE) micrographs of Ag50.5Cu33.3Sn16.2-xInx (x = 5.0, 6.6, 8.2, 9.1, 9.9, 10.7, 11.5, 12.3; at.%) as-cast alloys. It can be observed that the morphology of the solidification microstructures for Ag50.5Cu33.3Sn16.2-xInx as-cast alloys is dependent on In contents. The phase compositions of the formed phases measured by EDS in these alloys are listed in Table 1. The BSE micrographs of all as-cast alloys in Figure 1 display the three-phase microstructure. According to the chemical compositions by EDS measurements in Table 1, three different phases formed in Ag50.5Cu33.3Sn16.2-xInx alloys were identified as Fcc(Ag) phase (bright), Cu41Sn11 phase (gray) and Fcc(Cu) phase (black).
In Figure 1a,b, the large bright Fcc(Ag) phase as a primary phase in A1 (Ag50.5Cu33.3Sn11.2In5.0) alloy and A2 (Ag50.5Cu33.3Sn9.6In6.6) alloy is precipitated firstly from the liquid phase, and then the Cu41Sn11 phase and Fcc(Cu) phase are formed during the solidification process. The microstructure of A3 (Ag50.5Cu33.3Sn8.0In8.2) alloy in Figure 1c consists of three phases: the Fcc(Ag) phase, the Cu41Sn11 phase and the Fcc(Cu) phase. It is obvious that the phase fraction of Fcc(Ag) in A3 alloy is much larger than those of the Cu41Sn11 phase and Fcc(Cu) phase. As shown in Figure 1d–g, A4 (Ag50.5Cu33.3Sn7.1In9.1) alloy, A5 (Ag50.56Cu33.3Sn6.3In9.9) alloy, A6 (Ag50.5Cu33.3Sn5.5In10.7) alloy and A7 (Ag50.5Cu33.3Sn4.7In11.5) alloy display a three-phase microstructure. It was found that the Fcc(Cu) phase is surrounded by Cu41Sn11 phase, while the phase fraction of the Fcc(Cu) phase is extremely small. It can be seen that the solidification processes of these alloys with the increase of In content are similar. In particular, Figure 1h presents the formation of a eutectic microstructure in A8 (Ag50.5Cu33.3Sn3.9In12.3) alloy, although this alloy is still composed of three phases, i.e., the Fcc(Ag) phase, Cu41Sn11 phase and Fcc(Cu) phase. This indicates that the solidification process of A8 (Ag50.5Cu33.3Sn3.9In12.3) alloy is different from other alloys. In addition, as shown in the BSE micrographs of Ag50.5Cu33.3Sn16.2-xInx alloys in Figure 1, the phase fraction of the Fcc(Ag) phase in Ag50.5Cu33.3Sn16.2-xInx alloys increases gradually as the content of In increases, while the phase fraction of the Fcc(Cu) phase deceases. The reason for this could be that the solubility of In in the Fcc(Ag) phase is much larger than that of the Fcc(Cu) phase, resulting in the formation of the Fcc(Ag) phase prior to the Fcc(Cu) phase.

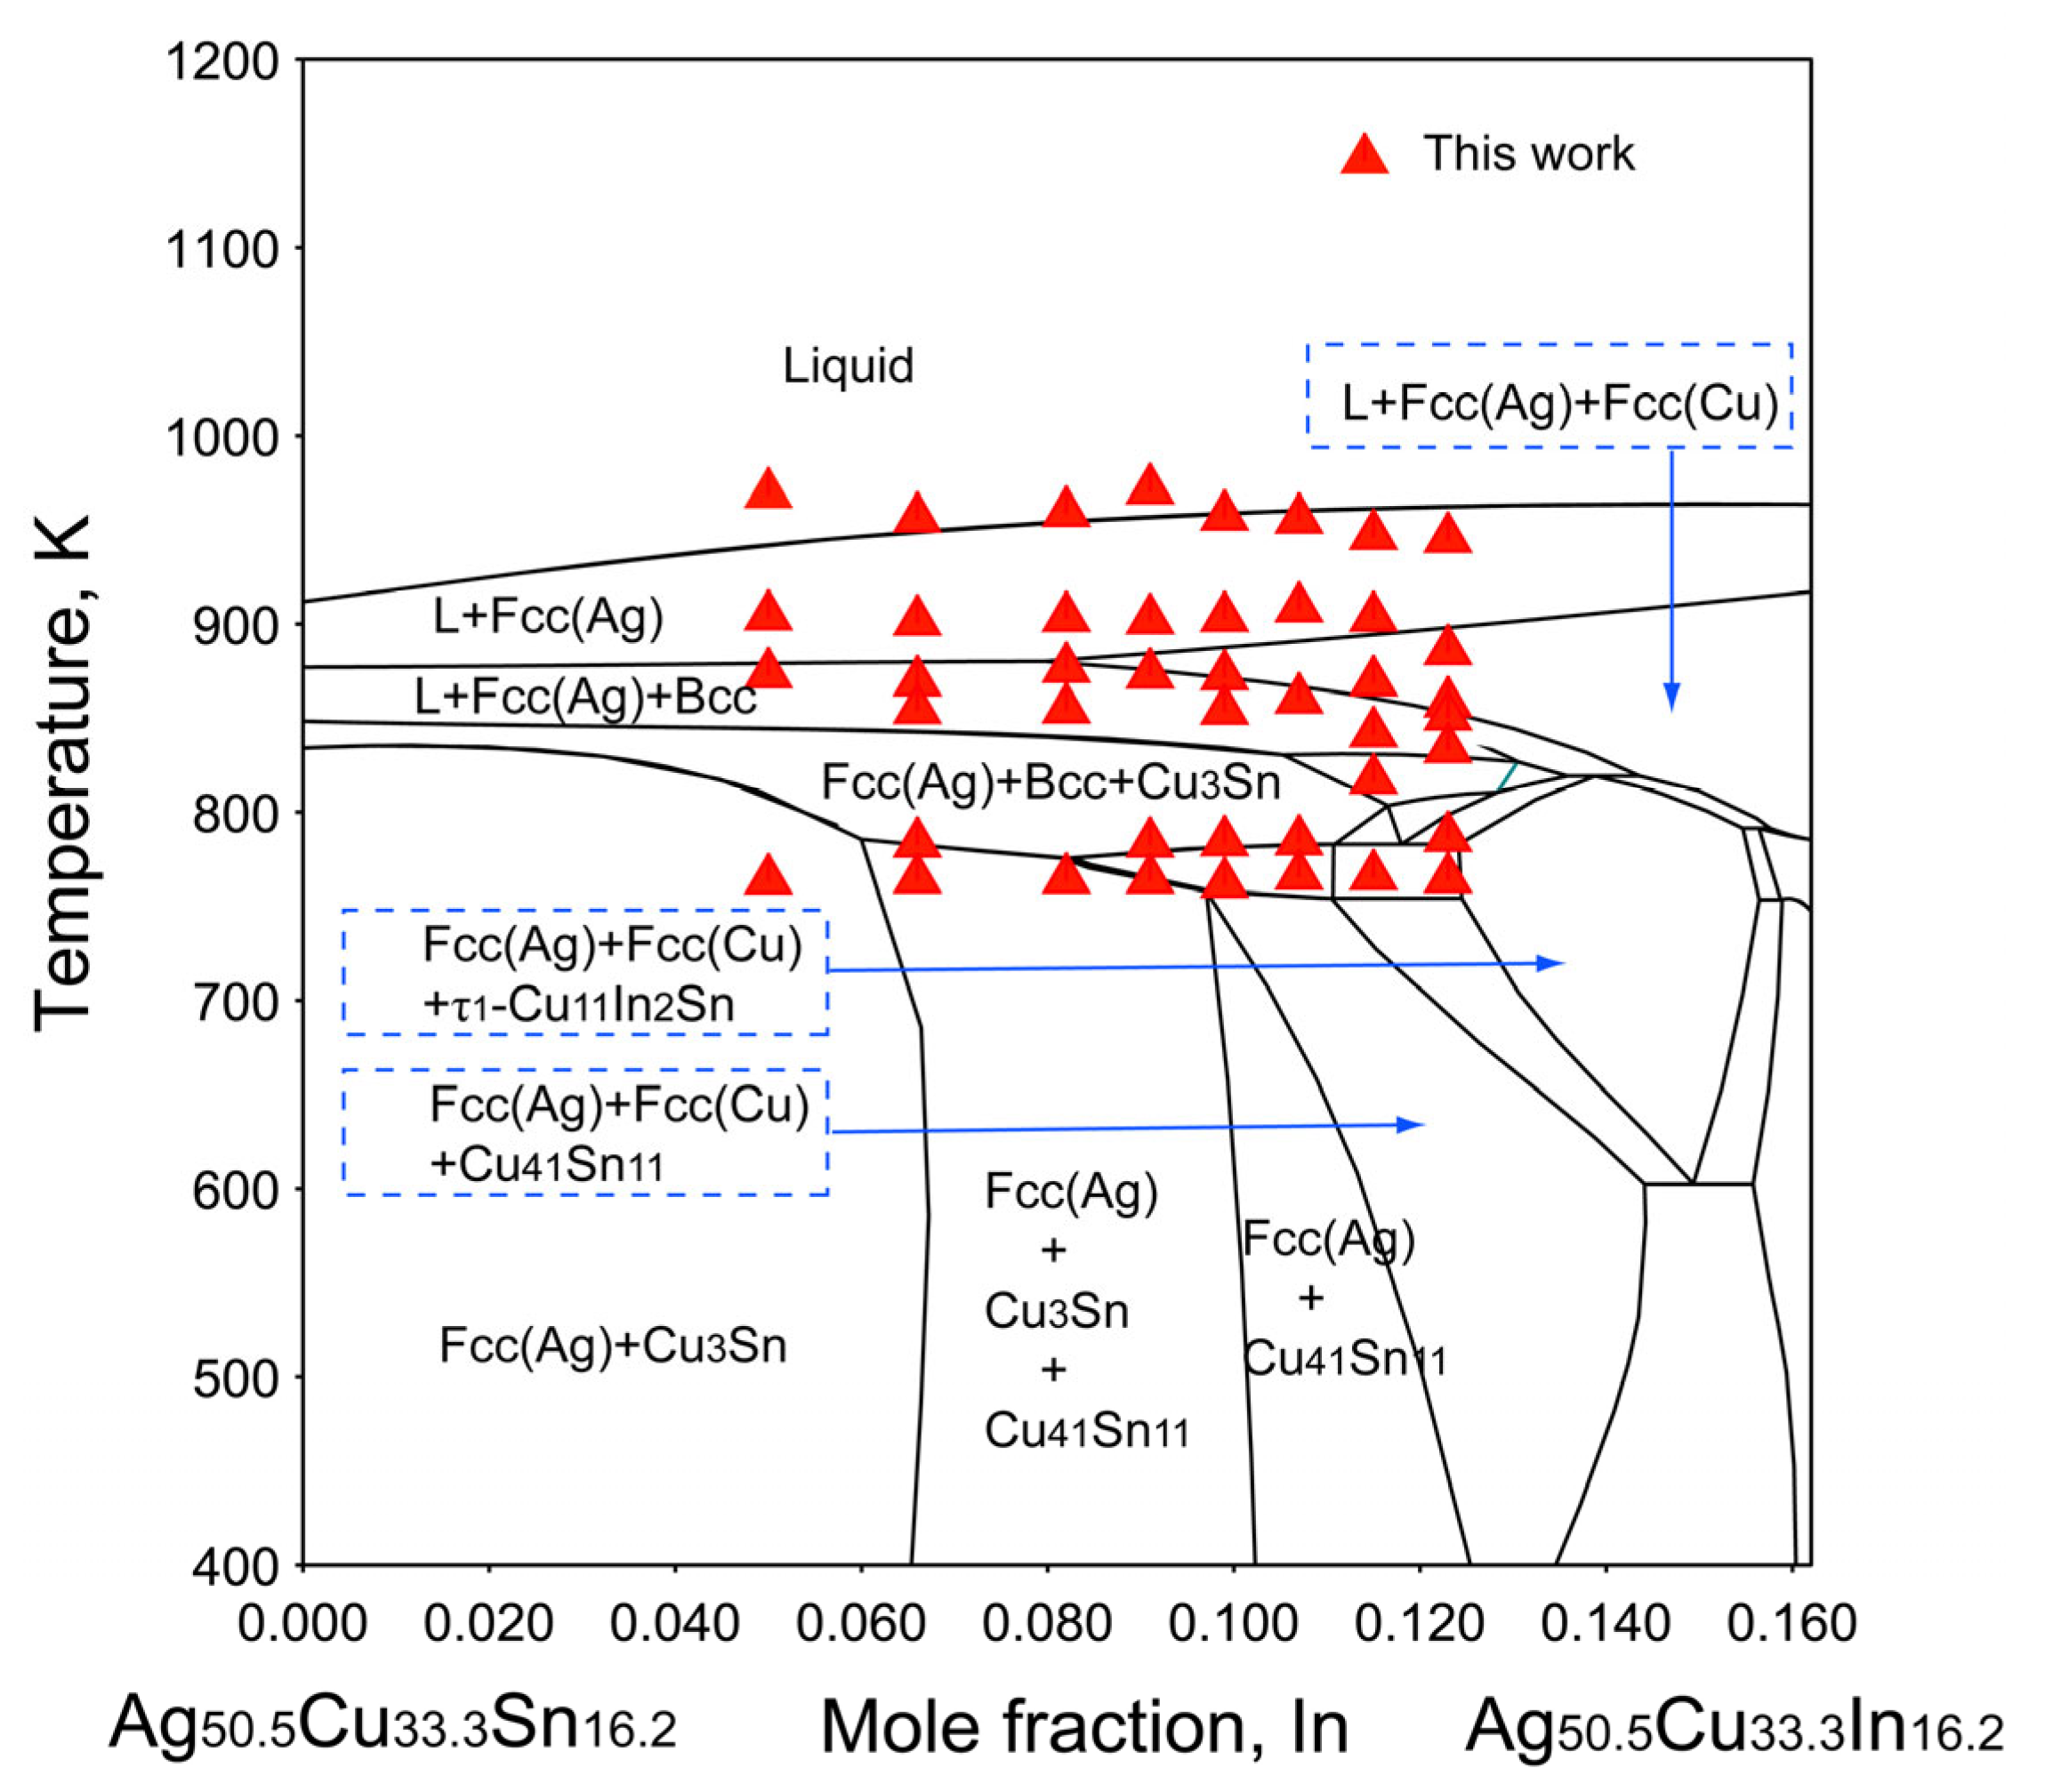
4.2. Phase Transition

The thermal analysis curves of Ag50.5Cu33.3Sn16.2-xInx (x = 5.0, 6.6, 8.2, 9.1, 9.9, 10.7, 11.5, 12.3; at.%) as-cast alloys were determined at a heating rate of 10 K/min under an argon atmosphere. In the heating curve, the onset temperatures of the peaks are determined as the temperatures of the invariant reactions, while the peak temperature of the last thermal effect is used as the liquidus temperature [38]. Figure 2 shows the thermal analysis curves determined from the Ag50.5Cu33.3Sn16.2-xInx as-cast alloys. Based on the heating curves, phase transition temperatures of Ag50.5Cu33.3Sn16.2-xInx as-cast alloys were determined as shown in Table 2.
As shown in Figure 2a, the thermal analysis curve of A1 (Ag50.5Cu33.3Sn11.2In5.0) alloy shows four endothermic peaks, suggesting that four phase transitions take place during the solidification process. It could be assumed that A1 alloy undergoes a phase transition at 763.9 K, corresponding to the precipitation of the Cu41Sn11 phase. The second peak at 873.4 K in the heating curve corresponds to the generation of the Bcc phase (L + Fcc(Cu) → Fcc(Ag) + Bcc), while the third peak at 904.2 K corresponds to the generation of the Fcc(Cu) phase (L → Fcc(Cu) + Fcc(Ag)). Meanwhile, the fourth peak at 969.2 K corresponds to the formation of the primary phase Fcc(Ag) from the liquid phase.
In Figure 2b,c,e,g, the thermal analysis curves of A2 (Ag50.5Cu33.3Sn9.6In6.6) alloy, A3 (Ag50.5Cu33.3Sn8.0In8.2) alloy, A5 (Ag50.5Cu33.3Sn6.3In9.9) alloy and A7 (Ag50.5Cu33.3Sn4.7In11.5) alloy are shown. A2 alloy and A5 alloy undergo a phase transition at 854.6/854.2 K (L → Fcc(Ag) + Bcc). However, this endothermic peak was not detected in the thermal analysis curves of A3 alloy and A7 alloy because the thermal effect at 784 K was minor. The extra metastable sign at 817.2 K was found in the heating curve of A7 alloy (seen in Figure 2g), which resulted from the non-equilibrium microstructure of this as-cast alloy.
The thermal analysis curves of A4 (Ag50.5Cu33.3Sn7.1In9.1) alloy and A6 (Ag50.5Cu33.3Sn5.5In10.7) alloy in Figure 2d,f show five endothermic peaks at 763.3/766.3 K, 783.4/784.6 K, 873.2/860.1 K, 902.2/908.5 K and 971.3/955.7 K. This indicates that five phase transitions occurred during the solidification process. A4 alloy and A6 alloy underwent a phase transition at 763.3/766.3 K, which corresponds to the precipitation of the Cu41Sn11 phase, while the second peak at 783.4/784.6 K corresponds to the decomposition of the Bcc phase (Bcc → Fcc(Cu) + Cu41Sn11). The third peak at 873.2/860.1 K corresponds to the formation of the Bcc phase (L + Fcc(Cu) → Fcc(Ag) + Bcc), while the fourth peak at 902.2/908.5 K corresponds to the formation of the Fcc(Cu) phase (L → Fcc(Cu) + Fcc(Ag)), and the fifth peak at 971.3/955.7 K corresponds to the formation of the primary phase Fcc(Ag) from the liquid phase.
As shown in Figure 2h, the thermal analysis curve of A8 (Ag50.5Cu33.3Sn3.9In12.3) alloy shows seven endothermic peaks (764.6 K, 786.5 K, 833.8 K, 851.1 K, 858.1 K, 885.7 K, 945.5 K). This indicates that seven phase transitions occurred during the solidification process. The thermal analysis curve of A8 alloy is similar to those of A3 alloy and A5 alloy, and an endothermic peak at 833.6 K in the thermal analysis of A8 alloy was observed. According to the Ag-Cu-Sn ternary phase diagram, it can be concluded that this endothermic peak corresponds to the reaction (L + Bcc → Fcc(Ag) + Cu3Sn).
By comparing the thermal analysis curves of Ag50.5Cu33.3Sn16.2-xInx as-cast alloys in Figure 2, it can be seen that liquidus temperatures of Ag50.5Cu33.3Sn16.2-xInx alloys decrease with increasing In content. In addition, it was observed that the heating curves of Ag50.5Cu33.3Sn16.2-xInx alloys displaying the effect of the endothermic peaks at around 764 K and 870 K are very obvious, which suggests that the same phase transitions at 764 K and 870 K occur during the solidification process, respectively.

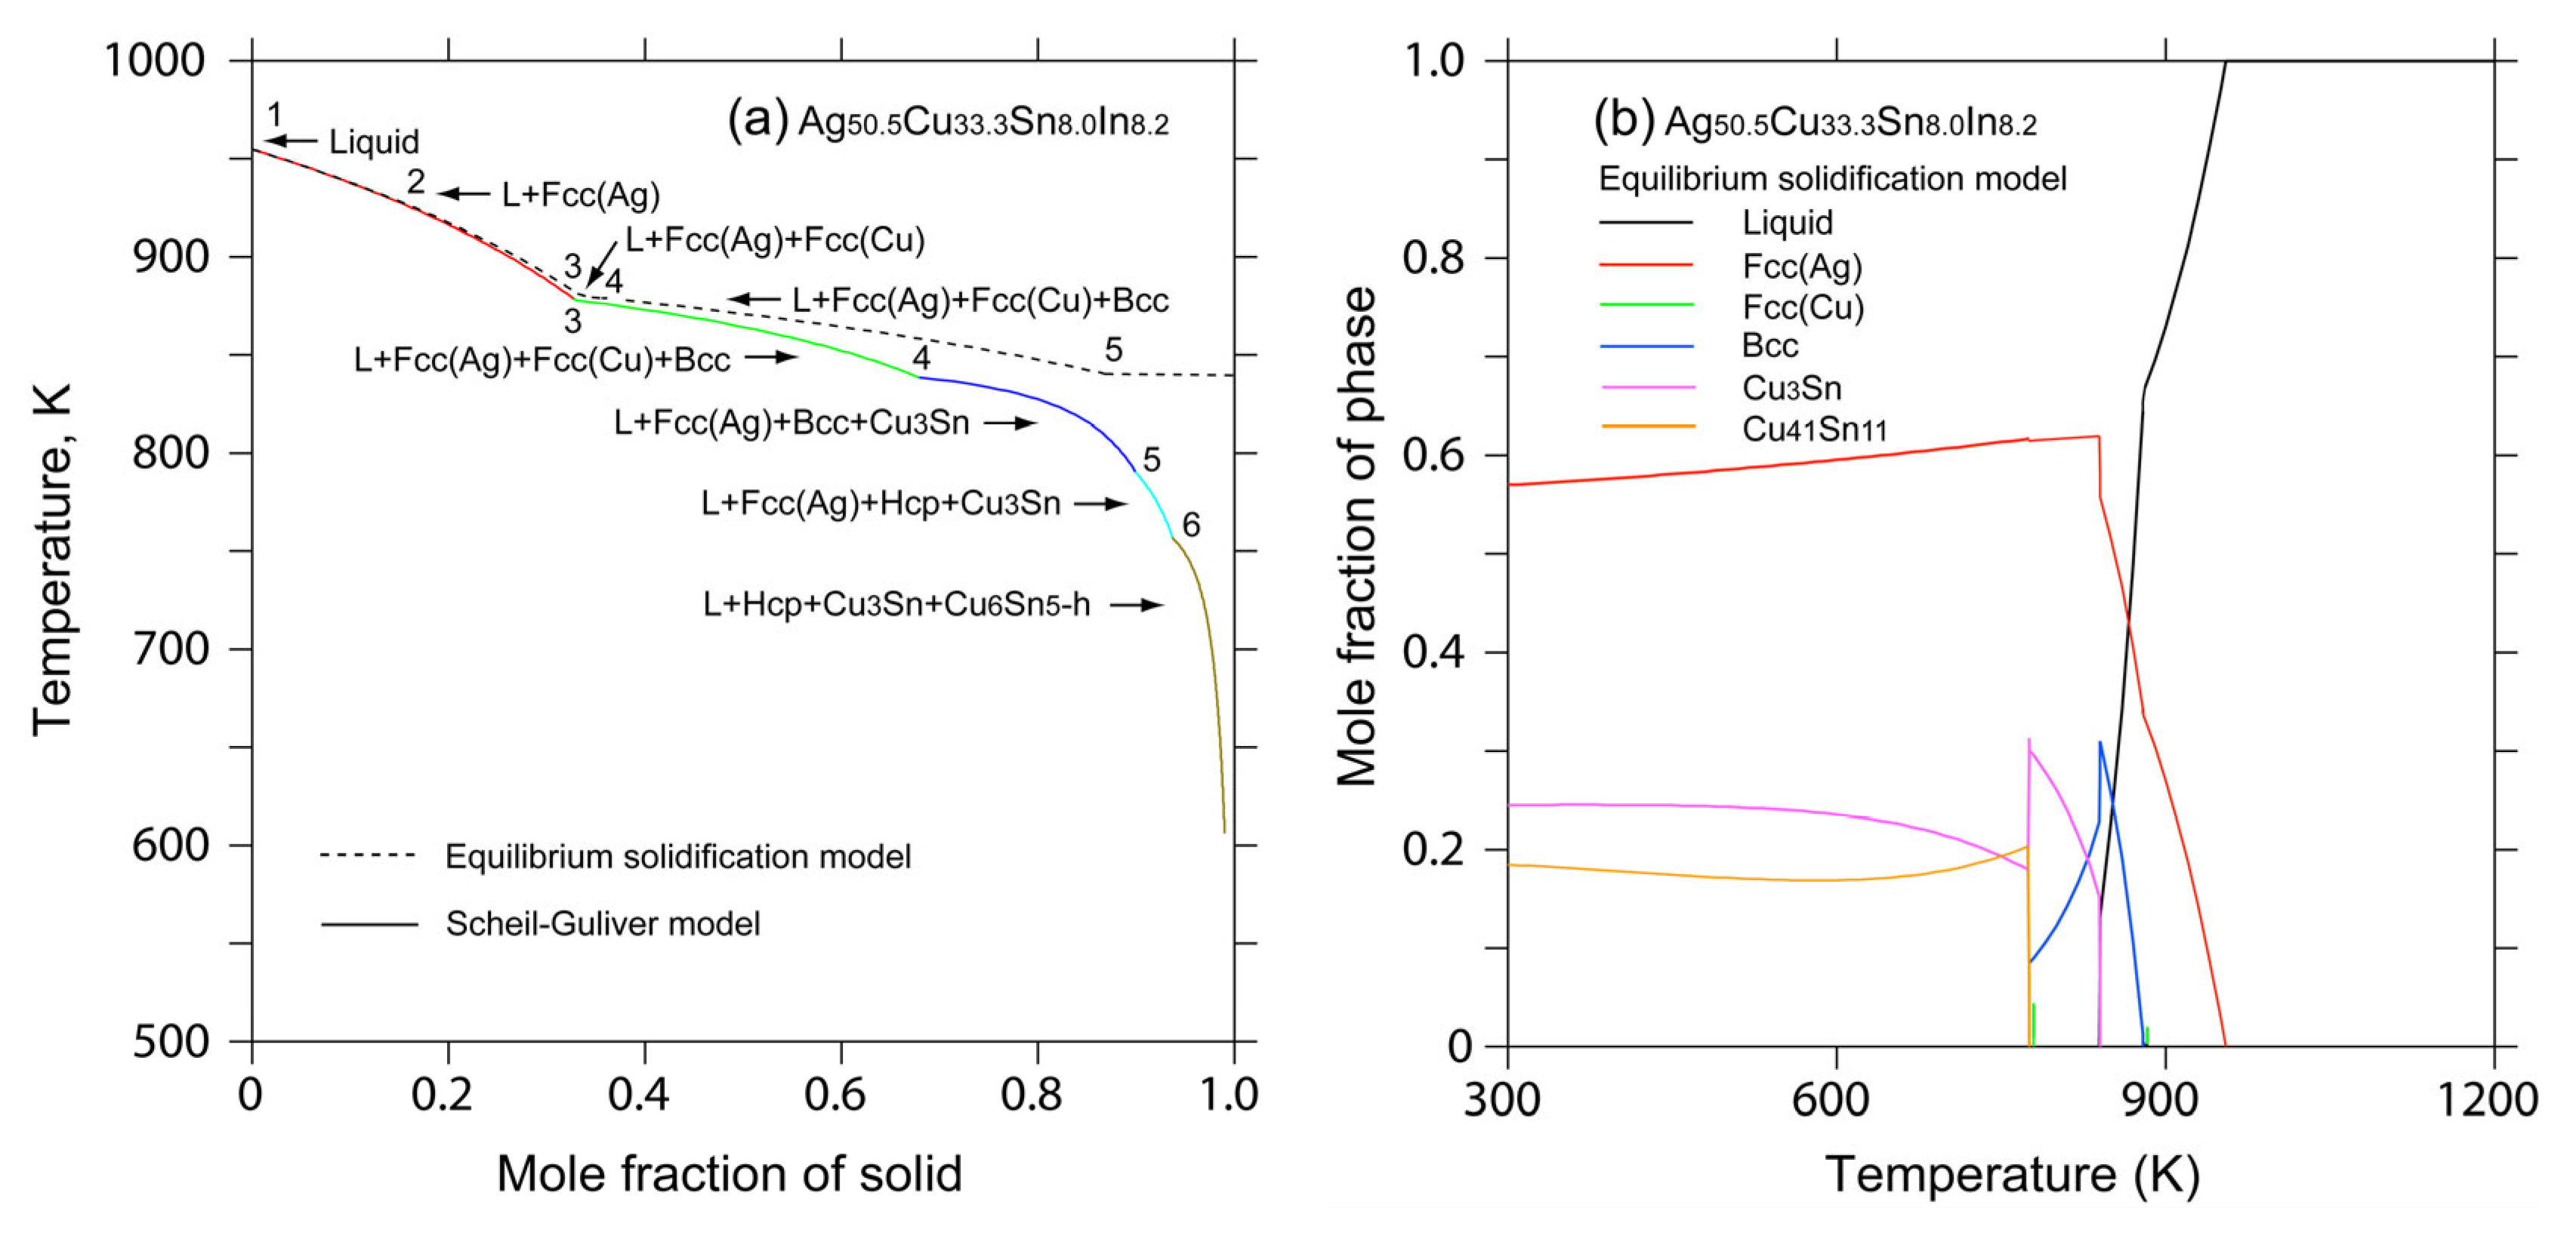
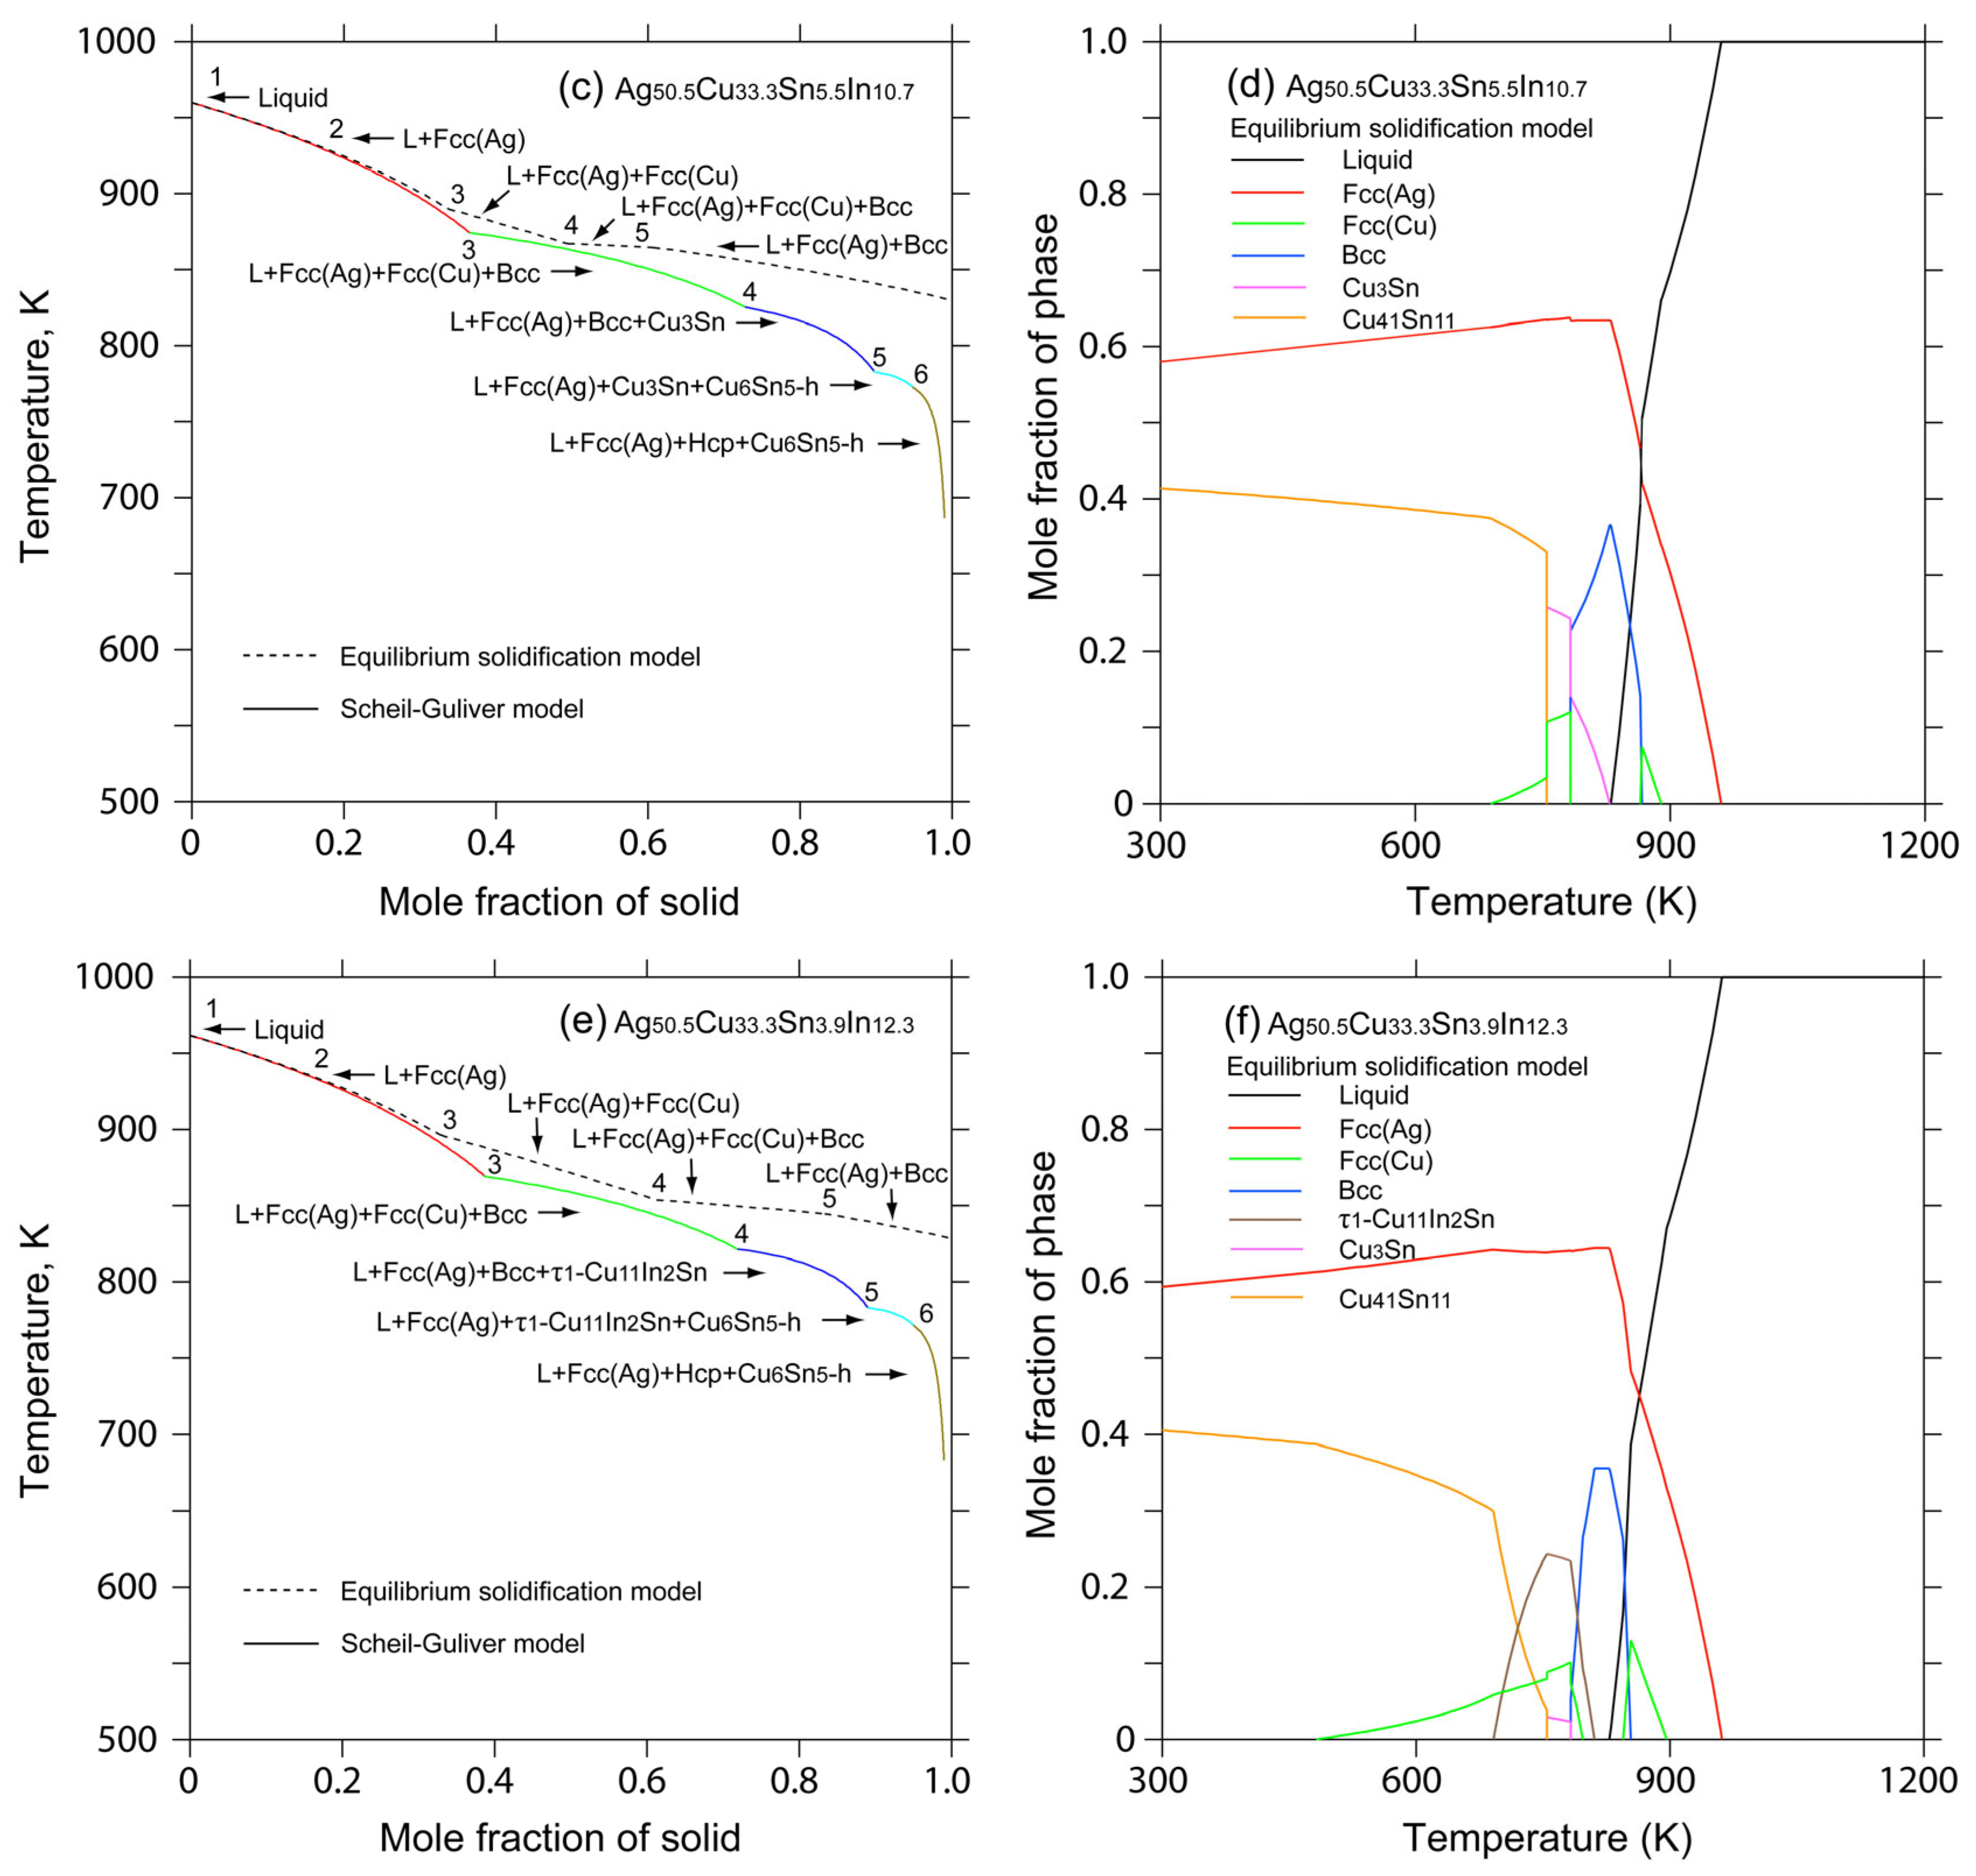
4.3. Solidification Simulation

Solidification simulations using an accurate thermodynamic database can provide a reliable approximation of phase formation and transformation in the alloy. Currently, the solidification process is usually calculated under two different conditions using the equilibrium solidification model and Scheil–Gulliver non-equilibrium solidification model. In the Scheil–Gulliver solidification simulations, diffusion in liquid phase is assumed to be fast enough to achieve the equilibrium immediately, while no diffusion in solid phases is assumed [39]. The Scheil–Gulliver solidification behavior is much closer to the normal casting conditions compared with the equilibrium solidification process. Moreover, different solidification sequences can illustrate different typical microstructure characteristics of alloys, and then further influence their performances. To better understand the solidification behaviors of Ag50.5Cu33.3Sn16.2-xInx as-cast alloys, the solidification process of the typical as-cast alloys was simulated by using the equilibrium solidification model and Scheil–Gulliver non-equilibrium model [40] based on the established thermodynamic database of the Ag-Cu-Sn-In quaternary system.
A thermodynamic database of the Ag-Cu-Sn-In quaternary system was constructed in this work. For the Ag-Cu-Sn ternary system, Tong et al. [12] reassessed it based on the available experimental data. Subsequently, the Ag-Cu-In, Ag-Sn-In and Cu-Sn-In systems were re-evaluated by Tong [34] in order to better describe the new experimental results. According to the available literature, no stable quaternary intermetallic compounds of the Ag-Cu-Sn-In quaternary system were reported. Assuming no quaternary interaction, the present work established a thermodynamic database of the Ag-Cu-Sn-In quaternary system by direct extrapolation from the thermodynamic description of the four subternary systems (i.e., Ag-Cu-Sn, Ag-Cu-In, Ag-Sn-In and Cu-Sn-In).
Figure 3 displays the calculated solidification processes of A3 (Ag50.5Cu33.3Sn8.0In8.2) alloy, A6 (Ag50.5Cu33.3Sn5.5In10.7) alloy and A8 (Ag50.5Cu33.3Sn3.9In12.3) alloy, demonstrating the solidification processes and the phase fractions of the formed phases as a function of temperature for these alloys. In Figure 3a, the solidification sequence of A3 alloy is depicted through the Scheil–Gulliver non-equilibrium model as: L → L + Fcc(Ag) → L + Fcc(Ag) + Fcc(Cu) + Bcc → L + Fcc(Ag) + Bcc + Cu3Sn → L + Fcc(Ag) + Hcp + Cu3Sn → L + Fcc(Ag) + Cu3Sn + Cu6Sn5-h. Figure 3b displays the phase fractions of the phases in A3 alloy as a function of temperature during the solidification process. The calculations show that the microstructure of A3 alloy consists of Fcc(Ag), Cu3Sn and Cu41Sn11 phases. As shown in Figure 1c, the simulation results are inconsistent with the microstructure observations. The reason for this could be that the real solidification process of A3 alloy is between the equilibrium process and non-equilibrium process [41]. The simulated solidification process of A6 alloy in Figure 3c is obtained by the Scheil–Gulliver non-equilibrium model as follows: L → L + Fcc(Ag) → L + Fcc(Ag) + Fcc(Cu) + Bcc → L + Fcc(Ag) + Bcc + Cu3Sn → L + Fcc(Ag) + Cu3Sn + Cu6Sn5-h → L + Fcc(Ag) + Hcp + Cu6Sn5-h. Figure 3d displays the phase fractions of the phases in A6 alloy as a function of temperature during the solidification process. The calculations show that the microstructure of A6 alloy is composed of Fcc(Ag), Fcc(Cu) and Cu41Sn11 phases, which is in accordance with the microstructure observation as shown in Figure 1f. In Figure 3e, using the Scheil–Gulliver non-equilibrium model, the solidification sequence of A8 alloy is followed as: L → L + Fcc(Ag) → L + Fcc(Ag) + Fcc(Cu) + Bcc → L + Fcc(Ag) + Bcc + τ1-Cu11In2Sn → L + Fcc(Ag) + τ1-Cu11In2Sn + Cu6Sn5-h → L + Fcc(Ag) + Hcp + Cu6Sn5-h. Figure 3f displays the phase fractions of the A8 alloy as a function of temperature during the solidification process. The calculations show that the microstructure of A8 alloy is composed of Fcc(Ag), Fcc(Cu) and Cu41Sn11 phases, which is in accordance with the microstructure observation as shown in Figure 1h.
Figure 4 displays the calculated vertical section of Ag50.5Cu33.3Sn16.2-Ag50.5Cu33.3In16.2 in the Ag-Cu-Sn-In quaternary system with the experimental data measured in the present work. It can be observed that the calculated liquidus temperature and phase transition temperatures are in general agreement with the experimental data measured in the present work as the Ag50.5Cu33.3Sn16.2-xInx as-cast alloys were used to determine phase transition temperatures, resulting in the slight difference between the calculated vertical section and the experimental results.

5. Conclusions

In this work, the solidification microstructure, phase compositions and phase transition temperatures of Ag50.5Cu33.3Sn16.2-xInx (x = 5.0, 6.6, 8.2, 9.1, 9.9, 10.7, 11.5, 12.3; at.%) were examined using SEM-EDS and DTA. The experimental results show that the phase fraction of Fcc(Ag) phase increases gradually as the addition of In increases, while the phase fraction of Fcc(Cu) phase is reduced. In addition, the liquidus temperatures of Ag50.5Cu33.3Sn16.2 alloys decrease with increasing In content. Based on the thermodynamic parameters of the Ag-Cu-Sn-In quaternary system reported in the literature, the calculated vertical section of Ag50.5Cu33.3Sn16.2-Ag50.5Cu33.3In16.2 agrees generally with the experimental data measured by the present work. The solidification processes of some Ag50.5Cu33.3Sn16.2-xInx alloys were analyzed using Scheil–Gulliver simulation and were compared with the experimental solidification microstructure. The simulated results of some as-cast alloys are in general agreement with the experimental results in the present work. Experimental results of the solidification microstructure and phase transition of Ag50.5Cu33.3Sn16.2-xInx alloys will be useful for the design of Ag-Cu-Sn-In brazing alloys.

Supplementary Materials

The following supporting information can be downloaded at: https://www.mdpi.com/article/10.3390/met13071296/s1, Table S1: Thermodynamic parameters of the Ag-Cu-Sn-In quaternary system.

Author Contributions

Q.T., M.R. and J.W. conceived and designed the calculations; Q.T. analyzed the data and discussed the calculations; Q.T., M.R. and J.W. wrote the paper. All authors have read and agreed to the published version of the manuscript.

Funding

This research was funded by Guangxi Key Laboratory of Information Materials, Guilin University of Electronic Technology, China (151009-Z) and Innovation Project of Guangxi Graduate Education (YCSW2023321).

Data Availability Statement

All the data that support the findings of this study are included within the article.

Acknowledgments

This work was supported financially by Guangxi Key Laboratory of Information Materials, Guilin University of Electronic Technology, China (151009-Z) and Innovation Project of Guangxi Graduate Education (YCSW2023321).

Conflicts of Interest

The authors declare no conflict of interest.

References

  1. Illes, B.; Choi, H.; Hurtony, T.; Dusek, K.; Busek, D.; Skwarek, A. Suppression of Sn whisker growth from SnAgCu solder alloy with TiO2 and ZnO reinforcement nano-particles by increasing the corrosion resistance of the composite alloy. J. Mater. Res. Technol. 2022, 20, 4231–4240. [Google Scholar] [CrossRef]
  2. Li, Q.; Zhao, M.; Lin, J.; Lu, S. Effect of temperature on the corrosion behavior of lead-free solders under polyvinyl chloride fire smoke atmosphere. J. Mater. Res. Technol. 2021, 15, 3088–3098. [Google Scholar] [CrossRef]
  3. Hardwick, L.; Webb, P.; Goodall, R. Design of higher temperature copper brazing filler metals with reduced brittle phase content. Mater. Today Commun. 2023, 35, 105524. [Google Scholar] [CrossRef]
  4. Way, M.; Willingham, J.; Goodall, R. Brazing filler metals. Int. Mater. Rev. 2020, 65, 257–285. [Google Scholar] [CrossRef]
  5. Wu, J.; Xue, S.B.; Liu, L.; Zhang, P.; Luo, Q.C. Influence of Ga Content on the Microstructure and Mechanical Properties of Cadmium-Free Filler Metal. Metals 2022, 12, 1151. [Google Scholar] [CrossRef]
  6. Vidyatharran, K.; Hanim, M.A.; Dele-Afolabi, T.T.; Matori, K.A.; Azlina, O.S. Microstructural and shear strength properties of GNSs-reinforced Sn-1.0Ag-0.5Cu (SAC105) composite solder interconnects on plain Cu and ENIAg surface finish. J. Mater. Res. Technol. 2021, 15, 2497–2506. [Google Scholar] [CrossRef]
  7. Rashidi, R.; Naffakh-Moosavy, H. Metallurgical, physical, mechanical and oxidation behavior of lead-free chromium dissolved Sn-Cu-Bi solders. J. Mater. Res. Technol. 2021, 13, 1805–1825. [Google Scholar] [CrossRef]
  8. Wang, H.; Xue, S.B. Effect of Ag on the properties of solders and brazing filler metals. J. Mater. Sci. Mater. Electron. 2016, 27, 1–13. [Google Scholar] [CrossRef]
  9. Tian, Y.Z.; Li, J.J.; Zhang, P.; Wu, S.D.; Zhang, Z.F.; Kawasaki, M.; Langdon, T.G. Microstructures, strengthening mechanisms and fracture behavior of Cu-Ag alloys processed by high-pressure torsion. Acta Mater. 2012, 60, 269–281. [Google Scholar] [CrossRef]
  10. Mu, G.Q.; Qu, W.Q.; Zhang, Y.H.; Zhuang, H.S. Effect of Ni on the wetting and brazing characterization of 304 stainless steel by Ag–Cu alloy. J. Mater. Sci. 2023, 58, 6297–6312. [Google Scholar] [CrossRef]
  11. Basri, D.K.; Sisamouth, L.; Farazila, Y.; Miyazawa, Y.; Ariga, T. Brazeability and mechanical properties of Ag-Cu-Sn brazing filler metals on copper-brazed joint. Mater. Res. Innov. 2015, 18, 429–432. [Google Scholar] [CrossRef]
  12. Tong, Q.S.; Ge, J.; Rong, M.H.; Li, J.L.; Jiao, J.; Zhang, L.; Wang, J. Thermodynamic modeling of the Ag-Cu-Sn ternary system. Metals 2022, 12, 1557. [Google Scholar] [CrossRef]
  13. Liu, W.; Zheng, M.; Wang, X.R.; Fan, Z.H.; Yu, D.K.; Chen, R.; Shen, H.Y.; Guo, J.Y.; Guo, B.; He, P. Processing and Characterization of Ag-Cu-Sn Brazing Alloy Prepared by a Mechanical Alloying Method. J. Mater. Eng. Perform. 2018, 27, 1147–1158. [Google Scholar] [CrossRef]
  14. Ma, C.L.; Xue, S.B.; Wang, B. Study on novel Ag-Cu-Zn-Sn brazing filler metal bearing Ga. J. Alloys Compd. 2016, 688, 854–862. [Google Scholar] [CrossRef]
  15. Luktuke, A.; Singaravelu, A.S.S.; Mannodi-Kanakkithodi, A.; Chawla, N. Influence of Indium addition on microstructural and mechanical behavior of Sn solder alloys: Experiments and first principles calculations. Acta Mater. 2023, 249, 118853. [Google Scholar] [CrossRef]
  16. Kanlayasiri, K.; Mongkolwongrojn, M.; Ariga, T. Influence of indium addition on characteristics of Sn-0.3Ag-0.7Cu solder alloy. J. Alloys Compd. 2009, 485, 225–230. [Google Scholar] [CrossRef]
  17. Leong, Y.M.; Haseeb, A.S.M.A.; Nishikawa, H.; Mokhtari, O. Microstructure and mechanical properties of Sn-1.0Ag-0.5Cu solder with minor Zn additions. J. Mater. Sci. Mater. Electron. 2019, 30, 11914–11922. [Google Scholar] [CrossRef]
  18. Zhao, J.; Cheng, C.Q.; Qi, L.; Chi, C.Y. Kinetics of intermetallic compound layers and shear strength in Bi-bearing Sn-Ag-Cu/Cu soldering couples. J. Alloys Compd. 2009, 473, 382–388. [Google Scholar] [CrossRef]
  19. Wang, Y.W.; Lin, Y.W.; Tu, C.T.; Kao, C.R. Effects of minor Fe, Co, and Ni additions on the reaction between Sn-Ag-Cu solder and Cu. J. Alloys Compd. 2009, 478, 121–127. [Google Scholar] [CrossRef]
  20. Shi, Y.W.; Tian, J.; Hao, H.; Xia, Z.D.; Lei, Y.P.; Guo, F. Effects of small amount addition of rare earth Er on microstructure and property of Sn-Ag-Cu solder. J. Alloys Compd. 2008, 453, 180–184. [Google Scholar] [CrossRef]
  21. Ren, X.L.; Wang, Y.P.; Lai, Y.Q.; Shi, S.Y.; Liu, X.Y.; Zou, L.J.; Zhao, N. Effects of In addition on microstructure and properties of SAC305 solder. Trans. Nonferrous Met. Soc. China 2022. Available online: https://kns.cnki.net/kcms/detail/43.1239.TG.20220809.1614.008.html (accessed on 15 June 2023).
  22. Tang, Y.; Li, Y.; Zhao, W.; Roslyakova, I.; Zhang, L. Thermodynamic descriptions of quaternary Mg-Al-Zn-Bi system supported by experiments and their application in descriptions of solidification behavior in Bi-additional AZ casting alloys. J. Magnes. Alloys. 2020, 8, 1238–1252. [Google Scholar] [CrossRef]
  23. Sopousek, J.; Palcut, M.; Hodulova, E.; Janovec, J. Thermal analysis of the Sn-Ag-Cu-In solder alloy. J. Electron. Mater. 2010, 39, 312–317. [Google Scholar] [CrossRef]
  24. Liu, Z.K. Computational thermodynamics and its applications. Acta Mater. 2020, 200, 745–792. [Google Scholar] [CrossRef]
  25. Li, X.F.; Li, Z.; Chen, C.; Ren, Z.F.; Wang, C.P.; Liu, X.J.; Zhang, Q.; Chen, S. CALPHAD as a powerful technique for design and fabrication of thermoelectric materials. J. Mater. Chem. A 2021, 9, 6634–6649. [Google Scholar] [CrossRef]
  26. Luo, X.B.; Peng, J.B.; Zhang, W.B.; Wang, S.; Cai, S.S.; Wang, X.J. CALPHAD-guided alloy design of Sn–In based solder joints with multiphase structure and their mechanical properties. Mater. Sci. Eng. A 2022, 860, 144284. [Google Scholar] [CrossRef]
  27. Dinsdale, A.T. SGTE data for pure elements. Calphad 1991, 15, 317–425. [Google Scholar] [CrossRef]
  28. He, X.C.; Wang, H.; Liu, H.S.; Jin, Z.P. Thermodynamic description of the Cu-Ag-Zr system. Calphad 2006, 30, 367–374. [Google Scholar] [CrossRef]
  29. Muzzillo, C.P.; Anderson, T. Thermodynamic assessment of Ag-Cu-In. J. Mater. Sci. 2018, 53, 6893–6910. [Google Scholar] [CrossRef]
  30. Du, J.Y.; Zemanova, A.; Hutabalian, Y.; Kroupa, A.; Chen, S.W. Phase diagram of Ag-Pb-Sn system. Calphad 2020, 71, 101997. [Google Scholar] [CrossRef]
  31. Liu, H.S.; Cui, Y.; Ishida, K.; Liu, X.J.; Wang, C.P.; Ohnuma, I.; Kainuma, R.; Jin, Z.P. Thermodynamic Assessment of the Cu-In Binary System. J. Phase Equilib. 2002, 23, 409–415. [Google Scholar] [CrossRef]
  32. Liu, X.J.; Liu, H.S.; Ohnuma, I.; Kainuma, R.; Ishida, K.; Itabashi, S.; Kameda, K.; Yamaguchi, K. Experimental determination and thermodynamic calculation of the phase equilibria in the Cu-In-Sn system. J. Electron. Mater. 2001, 30, 1093–1103. [Google Scholar] [CrossRef]
  33. Moelans, N.; Hari, K.C.; Wollants, P. Thermodynamic optimization of the lead-free solder system Bi-In-Sn-Zn. J. Alloys Compd. 2003, 360, 98–106. [Google Scholar] [CrossRef]
  34. Tong, Q.S. Thermodynamic Calculation of Phase Equilibrium in Ag-Cu-Sn-X(X=In, Sb) Alloy Systems. Master’s Thesis, Guilin University of Electronic and Technology, Guilin, China, 2023. [Google Scholar]
  35. Redlich, O.; Kister, A.T. Thermodynamics of nonelectrolyte solutions. Ind. Eng. Chem. 1948, 40, 341–345. [Google Scholar] [CrossRef]
  36. Muggianu, Y.M.; Gambino, M.; Bros, J.P. Enthalpies of formation of liquid alloys bismuth-gallium-tin at 723 K. Choice of an analytical representation of integral and partial excess functions of mixing. J. Chim. Phys. 1975, 75, 83–88. [Google Scholar] [CrossRef]
  37. Lu, Z.; Zhang, L.J. Thermodynamic description of the quaternary Al-Si-Mg-Sc system and its application to the design of novel Sc-additional A356 alloys. Mater. Des. 2017, 116, 427–437. [Google Scholar] [CrossRef]
  38. Su, D.; Rong, M.H.; Yang, K.C.; Yao, Q.R.; Wang, J.; Rao, G.H.; Zhou, H.Y. Thermodynamic calculation and solidification behavior of the La-Pr-Fe and Ce-Pr-Fe ternary systems. Calphad 2021, 74, 102285. [Google Scholar] [CrossRef]
  39. Jung, J.G.; Cho, Y.H.; Lee, J.M.; Kim, H.W.; Kwangjun, E. Designing the composition and processing route of aluminum alloys using CALPHAD: Case studies. Calphad 2019, 64, 236–247. [Google Scholar] [CrossRef]
  40. Scheil, E. Remarks on layer crystal formation. Z. Metallkd. 1942, 34, 70–72. [Google Scholar]
  41. Wang, Y.H.; Gao, K.; Tao, X.M.; Ko, W.S.; Wang, J.; Chen, F.W.; Xu, G.L.; Cui, Y.W. Experimental investigation and thermodynamic description of Mg-Sc-Zn ternary system. Calphad 2022, 77, 102406. [Google Scholar] [CrossRef]
Figure 1. Back-scattered electron (BSE) micrographs of Ag50.5Cu33.3Sn16.2-xInx as-cast alloys. (a) A1 (Ag50.5Cu33.3Sn11.2In5.0) alloy, (b) A2 (Ag50.5Cu33.3Sn9.6In6.6) alloy, (c) A3 (Ag50.5Cu33.3Sn8.0In8.2) alloy, (d) A4 (Ag50.5Cu33.3Sn7.1In9.1) alloy, (e) A5 (Ag50.5Cu33.3Sn6.3In9.9) alloy, (f) A6 (Ag50.5Cu33.3Sn5.5In10.7) alloy, (g) A7 (Ag50.5Cu33.3Sn4.7In11.5) alloy and (h) A8 (Ag50.5Cu33.3Sn3.9In12.3) alloy.
Metals 13 01296 g001aMetals 13 01296 g001b
Figure 2. Thermal analysis curves of Ag50.5Cu33.3Sn16.2-xInx alloys measured by DTA. (a) A1 (Ag50.5Cu33.3Sn11.2In5.0) alloy, (b) A2 (Ag50.5Cu33.3Sn9.6In6.6) alloy, (c) A3 (Ag50.5Cu33.3Sn8.0In8.2) alloy, (d) A4 (Ag50.5Cu33.3Sn7.1In9.1) alloy, (e) A5 (Ag50.5Cu33.3Sn6.3In9.9) alloy, (f) A6 (Ag50.5Cu33.3Sn5.5In10.7) alloy, (g) A7 (Ag50.5Cu33.3Sn4.7In11.5) alloy and (h) A8 (Ag50.5Cu33.3Sn3.9In12.3) alloy.
Metals 13 01296 g002aMetals 13 01296 g002b
Figure 3. Calculated solidification curves and phase fractions of the formed phases in three Ag-Cu-Sn-In as-cast alloys. (a,b) A3 (Ag50.5Cu33.3Sn8.0In8.2) alloy, (c,d) A6 (Ag50.5Cu33.3Sn5.5In10.7) alloy and (e,f) A8 (Ag50.5Cu33.3Sn3.9In12.3) alloy.
Metals 13 01296 g003aMetals 13 01296 g003b
Figure 4. Calculated vertical section of Ag50.5Cu33.3Sn16.2-Ag50.5Cu33.3In16.2 in the Ag-Cu-Sn-In quaternary system with the experimental data determined in this work.
Metals 13 01296 g004
Table 1. The formed phase, phase compositions of Ag-Cu-Sn-In alloys determined by EDS in this work.
Alloy Composition
(at.%)
EDS Measurement (at.%)Phase Identification
AgCuSnIn
A1—Ag50.5Cu33.3Sn11.2In5.082.2312.003.002.77Fcc(Ag)
4.7074.7418.971.59Cu41Sn11
6.1285.967.520.40Fcc(Cu)
A2—Ag50.5Cu33.3Sn9.6In6.679.8911.782.755.58Fcc(Ag)
2.8476.5017.402.26Cu41Sn11
2.8380.4614.572.14Fcc(Cu)
A3—Ag50.5Cu33.3Sn8.0In8.279.1911.891.667.26Fcc(Ag)
5.4475.6113.355.60Cu41Sn11
7.9284.295.841.95Fcc(Cu)
A4—Ag50.5Cu33.3Sn7.1In9.179.1611.542.167.14Fcc(Ag)
2.7575.7416.095.42Cu41Sn11
3.2179.7413.663.39Fcc(Cu)
A5—Ag50.5Cu33.3Sn6.3In9.980.489.023.586.92Fcc(Ag)
4.0678.4115.571.96Cu41Sn11
6.6885.436.950.94Fcc(Cu)
A6—Ag50.5Cu33.3Sn5.5In10.779.7612.440.797.01Fcc(Ag)
4.1174.8013.997.10Cu41Sn11
6.1284.576.332.98Fcc(Cu)
A7—Ag50.5Cu33.3Sn4.7In11.577.9110.522.009.57Fcc(Ag)
5.5375.6912.356.43Cu41Sn11
5.7379.4010.464.41Fcc(Cu)
A8—Ag50.5Cu33.3Sn3.9In12.379.149.980.8510.03Fcc(Ag)
5.3175.969.379.36Cu41Sn11
5.2787.783.663.29Fcc(Cu)
Table 2. Phase transition temperatures of Ag-Cu-Sn-In alloys determined by DTA in this work.
Alloy Composition (at.%)Phase Transformation Temperatures (K)Liquidus
A1—Ag50.5Cu33.3Sn11.2In5.0763.9873.4904.2969.2
A2—Ag50.5Cu33.3Sn9.6In6.6764.4783.4854.6869.2901.4956.2
A3—Ag50.3Cu33.3Sn8.0In8.2764.3854.9876.3903.4959.3
A4—Ag50.5Cu33.3Sn7.1In9.1764.3783.4873.2902.2971.3
A5—Ag50.5Cu33.3Sn6.3In9.9762.0784.2854.2872.3903.4957.3
A6—Ag50.5Cu33.3Sn5.5In10.7766.3784.6860.1908.5955.7
A7—Ag50.5Cu33.3Sn4.7In11.5766.1817.2842.2869.2903.4947.1
A8—Ag50.5Cu33.3Sn3.9In12.3764.6786.5833.8851.1858.1885.7945.5
Disclaimer/Publisher’s Note: The statements, opinions and data contained in all publications are solely those of the individual author(s) and contributor(s) and not of MDPI and/or the editor(s). MDPI and/or the editor(s) disclaim responsibility for any injury to people or property resulting from any ideas, methods, instructions or products referred to in the content.

