Article

Formation and Modification of Al2O3 and MnS Inclusions in Al-Killed Gear Steels via Ca Treatment

1
Sustainable Minerals Institute, University of Queensland, Brisbane 4072, Australia
2
Baoshan Iron and Steel Co., Ltd., Shanghai 200122, China
3
International Research Institute for Resources, Energy, Environment and Materials, Jiangxi University of Science and Technology, Ganzhou 341000, China
*
Authors to whom correspondence should be addressed.
Metals 2023, 13(7), 1153; https://doi.org/10.3390/met13071153
Submission received: 4 April 2023 / Revised: 10 June 2023 / Accepted: 14 June 2023 / Published: 21 June 2023
(This article belongs to the Special Issue Inclusions in Steels and Alloys)

Abstract

:
A laboratory study was carried out to better understand the factors that contribute to the formation of complex inclusions, as inclusions play an important role during steel production; if not properly managed, inclusions can cause nozzle clogging during continuous casting and also damage the steel’s mechanical properties and machineability. To determine the chemical composition of inclusions that are less detrimental to the machineability of Al-deoxidized and Ca-treated gear steels, thermodynamic calculations and automated scanning electron microscopy (SEM) coupled with energy dispersive spectroscopy (EDS), as well as electron probe micro-X-ray analysis (EPMA) with the wavelength dispersive spectroscopy (WDS) technique, were utilized. The findings demonstrated that the morphology of inclusions changed from irregular to a more spherical type and the composition also changed to dual oxy-sulfides from pure oxides and sulfides as the Ca concentration in the steel was increased up to 36 ppm. The amount of Pure MnS sulfides also reduced significantly after Ca treatment. The ternary phase diagram and stability diagram for the inclusions revealed that 15–25 ppm Ca is the optimal range for the modification of both oxides and sulfides into the desired morphology and composition under the stipulation that the concentration of O in the steel is maintained at or below 50 ppm.

1. Introduction

The formation of non-metallic inclusions is inevitable and, when not properly controlled, can cause poor performance and casting problems. Even in steels with very high levels of purity, inclusion-forming elements cannot be eliminated completely. Thus, a certain proportion of inclusions will always form and be retained during the solidification process, e.g., endogenous inclusions—for instance, oxides and sulfides [1,2]. Keeping in mind the adverse effects of non-metallic inclusions in steels, efforts for their control and removal have been boosted in the past several decades. The control of the size, shape, and distribution of the inclusions remaining in the steel during casting and solidification is essential for its processing and also for the final properties of the steel product [3,4].
Irregular-shaped and elongated sulfide inclusions have been a major problem for gear steels, as inclusion morphology has a strong effect on the machineability and transverse properties of gears [5]. Sims’ [6] classification provides three specific types of sulfides (based on oxygen content) that can be found in steels; among them, type II MnS inclusions have a low O and Al content. Such types of inclusions precipitate along the primary grain boundaries during steel solidification. MnS inclusions of type II elongate during the hot working of steel; these elongated inclusions induce an anisotropy in the mechanical properties of steel, which leads to its inferior strength, ductility and toughness in the short transverse direction [7]. Type I MnS inclusions usually contain an oxide core, and are therefore harder than type II MnS. Oxy-sulfides (type I) are usually present in steel as individual particles, while type II MnS inclusions are formed by a eutectic reaction. In addition, type II MnS inclusions can deform to a larger extent than the inclusions of Type I during hot working, and hence, they are more harmful to the mechanical properties of gears.
Besides elongated/deformed sulfides, oxides are another type of endogenous inclusions that are present in steels as inevitable inclusions. A probable reason for the presence of oxides is the presence of deoxidizers. The most common deoxidizer (other than silicon (Si) [8,9], titanium (Ti) [10] and magnesium (Mg) [11], or in combination [12,13,14,15]) for steel castings is aluminum (Al), which produces solid particles of Al2O3. The use of specific deoxidizers depends on the final properties and application of the steels. The main purpose of deoxidation is to reduce the dissolved oxygen content in the steel by adding elements that have a greater affinity for O and form stable oxides other than FeO, and also to help produce a fine grain structure in the cast steel. Al has the highest affinity with O among other deoxidizers and easily reduces the O level into the desired range, and it is also more economical to use than other deoxidizers. However, Al2O3 inclusions are sometimes difficult to float up due to the highly viscous steel surrounding them, and they remain trapped in the melt, which cause casting problems [16].
In order to control the amount, size and morphology of oxides and sulfides, calcium treatment is the most commonly used method for transforming detrimental oxide and sulfide inclusions in steel into less harmful inclusions that can have beneficial effects on the steel’s properties; this is commonly used to modify solid Al2O3 and MgO.Al2O3 inclusions to fully or partially liquid calcium aluminates [17]. The chemical affinity of Ca to O is higher than that of S, and at a temperature of 1600 °C, oxides of Ca are more stable than sulfides. If Ca is to react with S and not with O, the O activity in the liquid steel at the temperature of 1600 °C should be about 19 times lower than the S activity [18]. Another advantage of Ca treatment is to control the sulfides’ morphology. Firstly, the addition of Ca modifies the oxide inclusions, and later—depending upon the amount of S present in the melt and the activity of Mn at the specified temperature—it either forms CaS or converts MnS to (Ca,Mn)S. Inclusions with a high melting point—such as Al2O3 and CaS—can also work as nucleation sites for MnS, making sulfides thinly dispersed in the steel matrix [19].
For effective inclusion control, it is important to know the conditions required for the formation of various inclusions during steel making. As discussed earlier, only large inclusions are removed by flotation in liquid steel, whereas finer ones are difficult to float out—the challenge is to optimize and customize the steelmaking process route for gear steels with the desired applications [20,21]. Ca treatment can somehow modify the inclusions; however, many large inclusions are generated, due to which, the modification effect would be dramatically decreased by the formation of a large amount of CaS inclusions. At steelmaking temperature, the precipitation of CaS decreases the modification effect of Al2O3, as it hinders the formation of liquid calcium aluminates and causes nozzle clogging. Furthermore, the formation of CaS at casting temperature worsens the cast ability of steel [22]. To evaluate the effect of Ca treatment on inclusions, an analysis of sulfides is also necessary. There is not enough literature available to explain the formation of complex oxy-sulfides in medium to high-S steels. Thermodynamic studies, along with experimental evidence, is required in order to have smooth castings and the desired inclusion formation—avoiding the precipitation of CaS inclusions despite having a high S content in the gear steels. A novel technique is developed here to quantify MnS inclusions in terms of their size, morphology and distribution; it involves the use of automated scanning electron microscopy coupled with a high-speed EDS detector and mineral liberation analysis (MLA) Dataview 3.1.4686-1) software. For the first time, this integrated software is used to characterize inclusions in steel. MLA software was used primarily to characterize the minerals in the ore; it uses the chemical composition and densities of the minerals to differentiate them in terms of their morphology, size and distribution. We feed the bulk composition of our samples and the densities of the expected inclusions, and the software automatically converts the inputs (including EDS data) into the desired results. Through image analysis, inclusions are recognized and separated, and the specific phases within the observed area are delineated for discrete X-ray analysis to determine their composition. This modern tool not only increases the speed and accuracy of analysis, but also enhances measurement automation. An inclusion analysis conducted using this technique can be regarded as a representation of the whole sample as it scans the complete area, and it is therefore easy to determine the inclusion distribution in the sample. Details regarding the image analysis and mineral liberation analysis can be found in [23].

2. Materials and Methods

2.1. Materials

A vacuum induction furnace (SP-60 KTC, 15 kW) (MTI Corporation, Richmond, CA, USA) was employed for the melting of the samples using a high-purity MgO crucible to avoid reoxidation of the melt by the atmosphere, which would otherwise have influenced the inclusion formation. The chemical compositions of the samples are given in Table 1. Pure Al pieces (IMP Iron and steel Co, Inner Mongolia, China) were used for deoxidation and CaSi powder (IMP Iron and steel Co, Inner Mongolia, China) was used for Ca treatment. Considering the low yield rate of Ca, a significant amount of CaSi powder was added. Each sample, weighing 500 g, was prepared for analysis. A mechanical pump connected to the induction furnace can evacuate the chamber from both the top and bottom to about 1 Pascal prior to backfilling with argon. A type C thermocouple (1/4″ diameter and 20″ length) (MTI Corporation, Richmond, CA, USA) was used to measure the melt temperature through the top. Before creating the vacuum, the furnace was flushed with pure argon gas for 5 min to remove the entrapped air. Afterwards, the chamber was evacuated by using the mechanical pump (156 L/min double stage rotary vane) (MTI Corporation, Richmond, CA, USA) and then backfilled again with high-purity Ar gas to atmospheric pressure. A slow heating process, i.e., 10 °C/min, with a continuous Ar gas flow of 200 mL/min was employed to avoid breakage of the crucible from sudden thermal shocks. After complete melting, the temperature was stabilized for 15 min to allow homogeneous mixing of elements followed by Al deoxidation and Ca treatment with 1 min apart—after that, the furnace was turned off to cool down the sample with a continuous flow of argon gas.

2.2. Steel Sampling and Analysis

To investigate the effect of Ca on oxide and sulfide inclusions, a total of five samples were prepared with varying percentages of calcium (0, 4, 11, 22, and 36 ppm). Samples, prepared for the inclusion analysis, were taken from the middle of the whole sample to avoid any possible segregation effect of the solute particles. After mounting into the epoxy resin (polyfast) (provided by Struers, Ballerup, Denmark), the samples were ground up by 4000 grit size paper and slightly polished. Extensive polishing can easily wash away the inclusions. Rectangular polished sample surfaces, around 10 × 8 mm2 in area, were scanned in a scanning electron microscope (SEM SU3500, Hitachi, Tokio, Japan) coupled with an Oxford EDS detector. Backscattered electron (BSE) imaging was used to identify the inclusions, and point analysis as well as map scanning mode were used to confirm the contents of the inclusions in the steel. A JXA 8200 electron probe X-ray microanalyzer (JEOL, Tokyo, Japan) with wavelength-dispersive (WDS) detectors was used for accurate compositional analysis. The parameters employed for analysis included an accelerating voltage of 15 kV, a 15 nA current, a zero probe diameter, a peak measuring time of 30 s, a background position of ±5 µm and a background measuring time of 5 s. The standards used for the analysis were spinel (MgO·Al2O3), calcium silicate (CaSiO3), iron sulfide (FeS2), spessartine (Mn3Al2Si3O12), and hematite (Fe2O3) for Al, Mg, Ca, Si, S, Mn and Fe, respectively. The built-in (1) atomic number (Z) effect, (2) absorption (A) effect, and (3) fluorescence excitation (F) effect simply known as ZAF correction procedure supplied with the probe was applied. Different crystals covering the entire X-ray spectrum were used, including Lithium fluoride (LIF), pentaerythritol (PET) and thallium acid phthalate (TAP).
In order to quantify the MnS inclusions in the steel samples, automated SEM (Thermofisher Quanta 650 (Waltham, MA, USA) with a Bruker EDS (Billerica, MA, USA) detector was used. A 10 × 8 mm2 sample area was scanned pixel-by-pixel in order to produce a detailed image of each sample, and high-speed EDS scanning was run simultaneously to capture the energy spectra emitted by the elements in the specific phases, which the dataview (v.3.1.4.686-1) software converted to the approximate composition of each phase.

3. Results

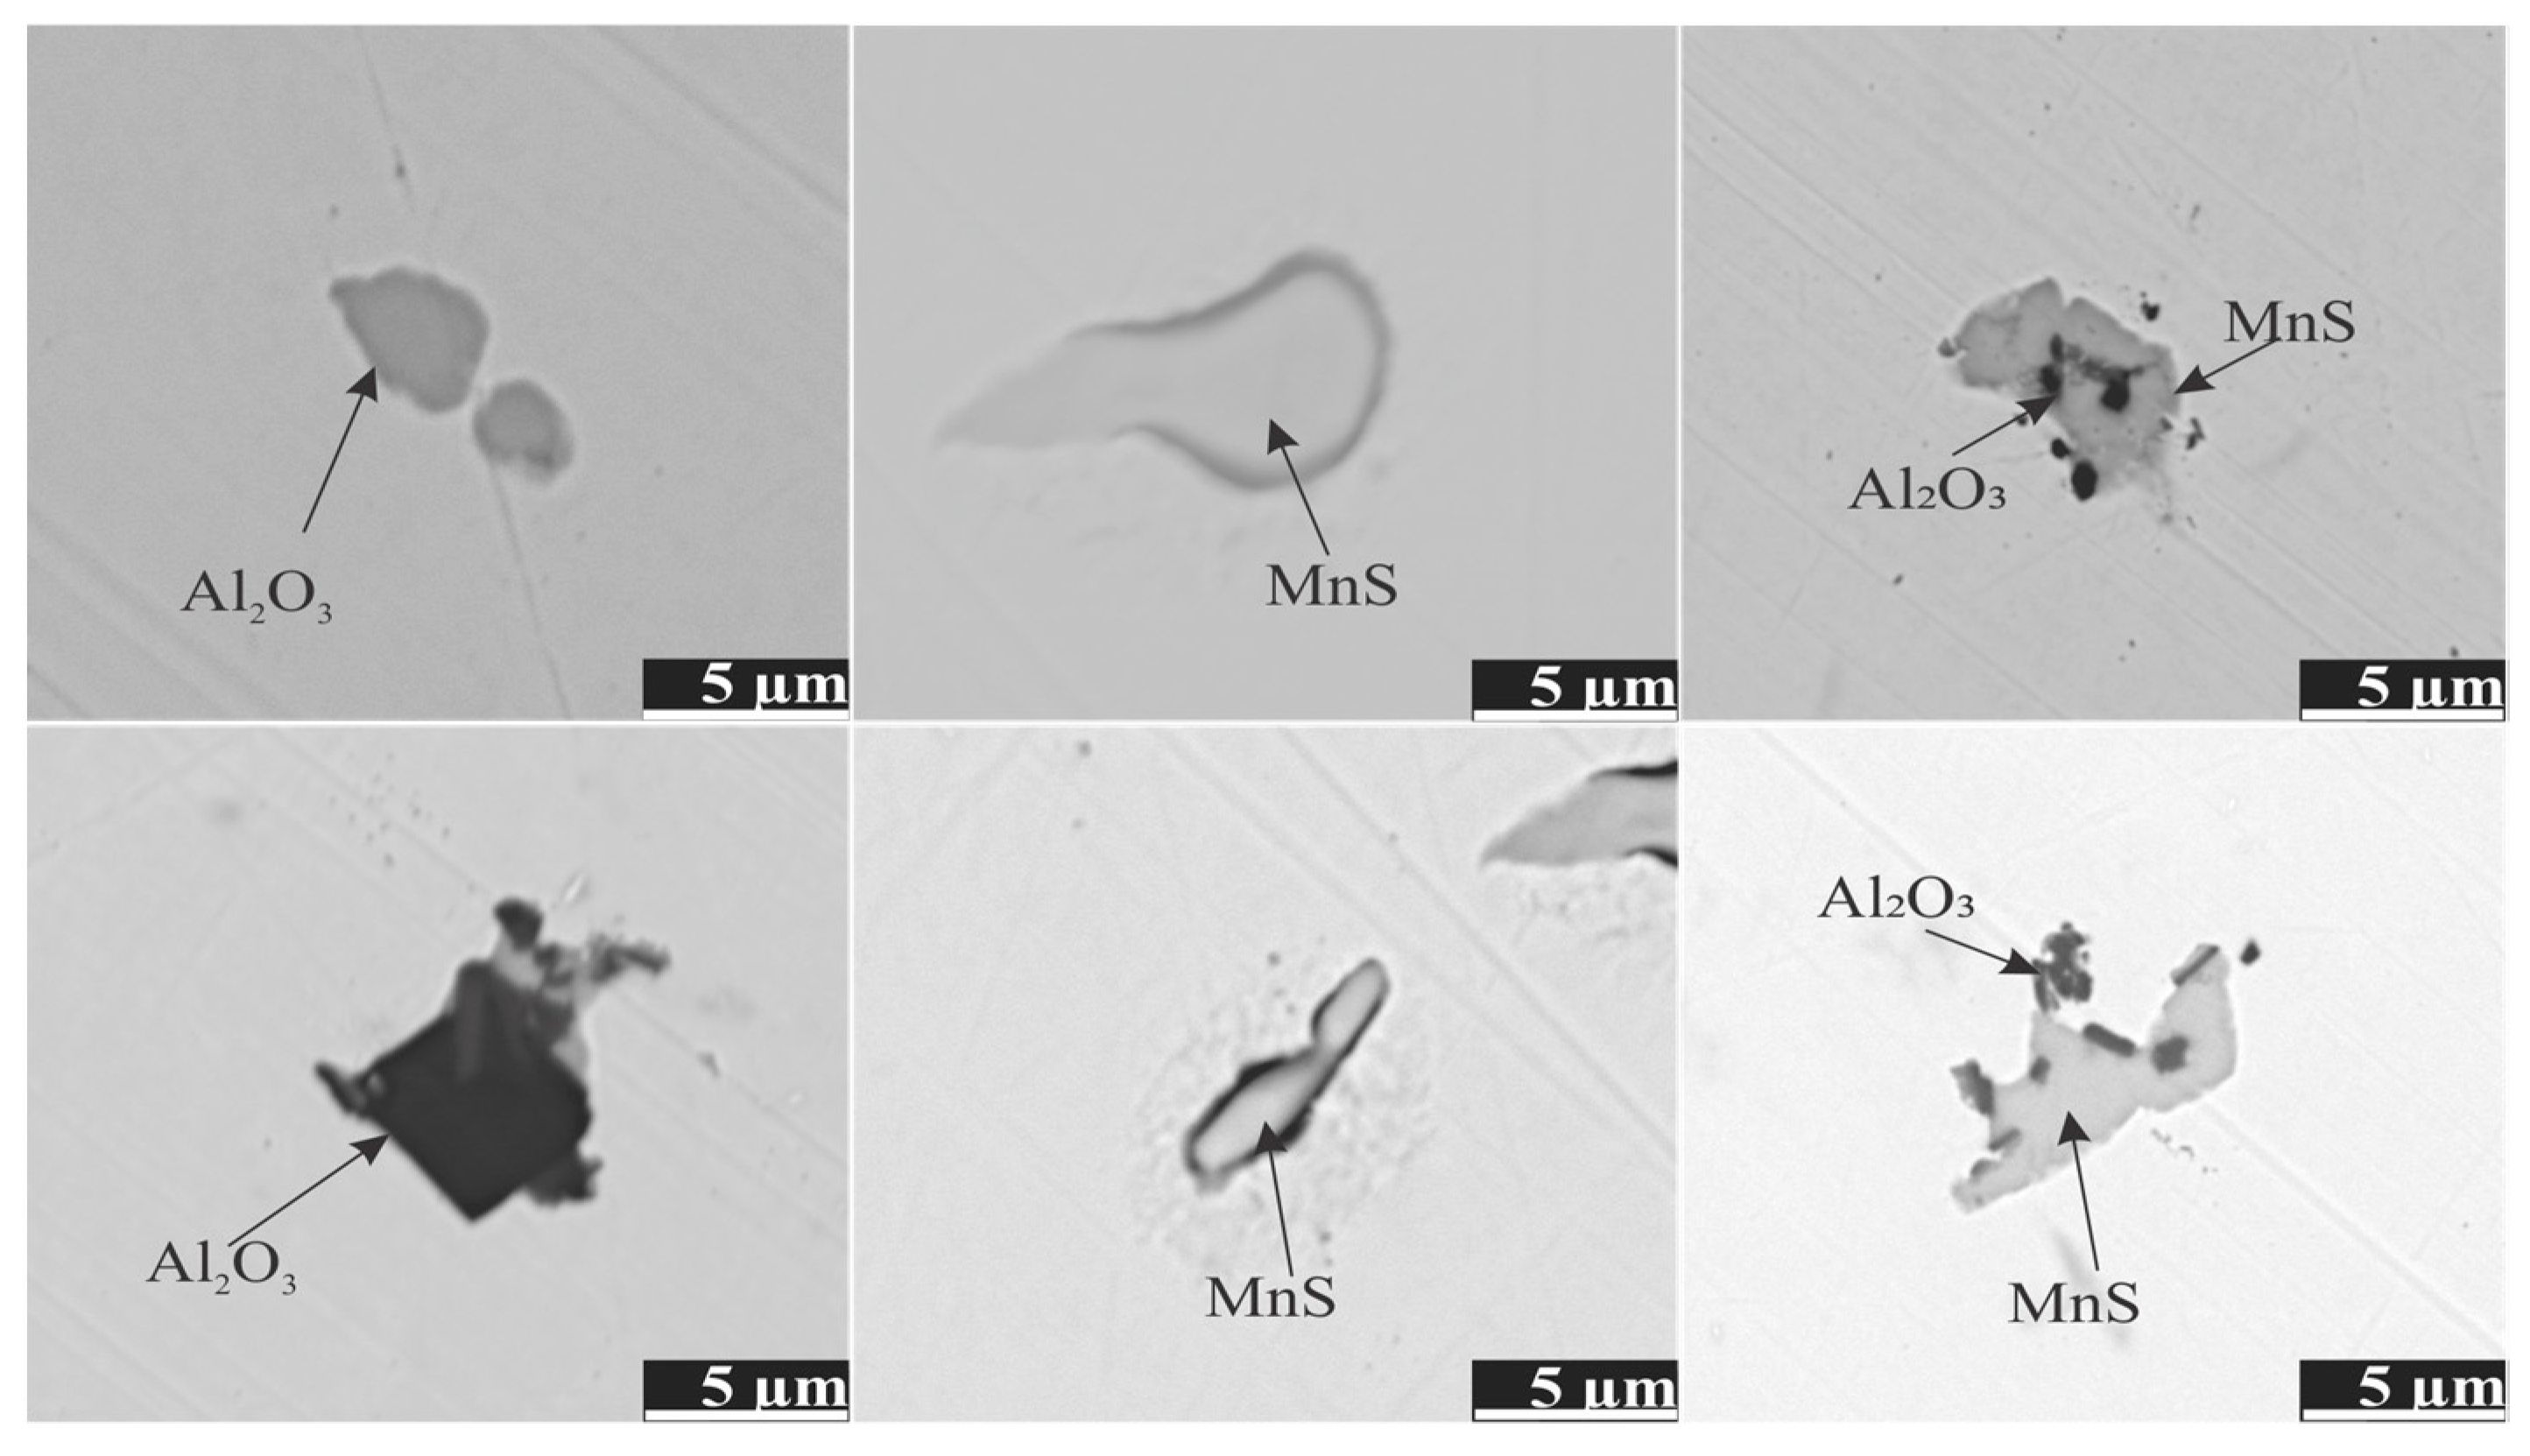
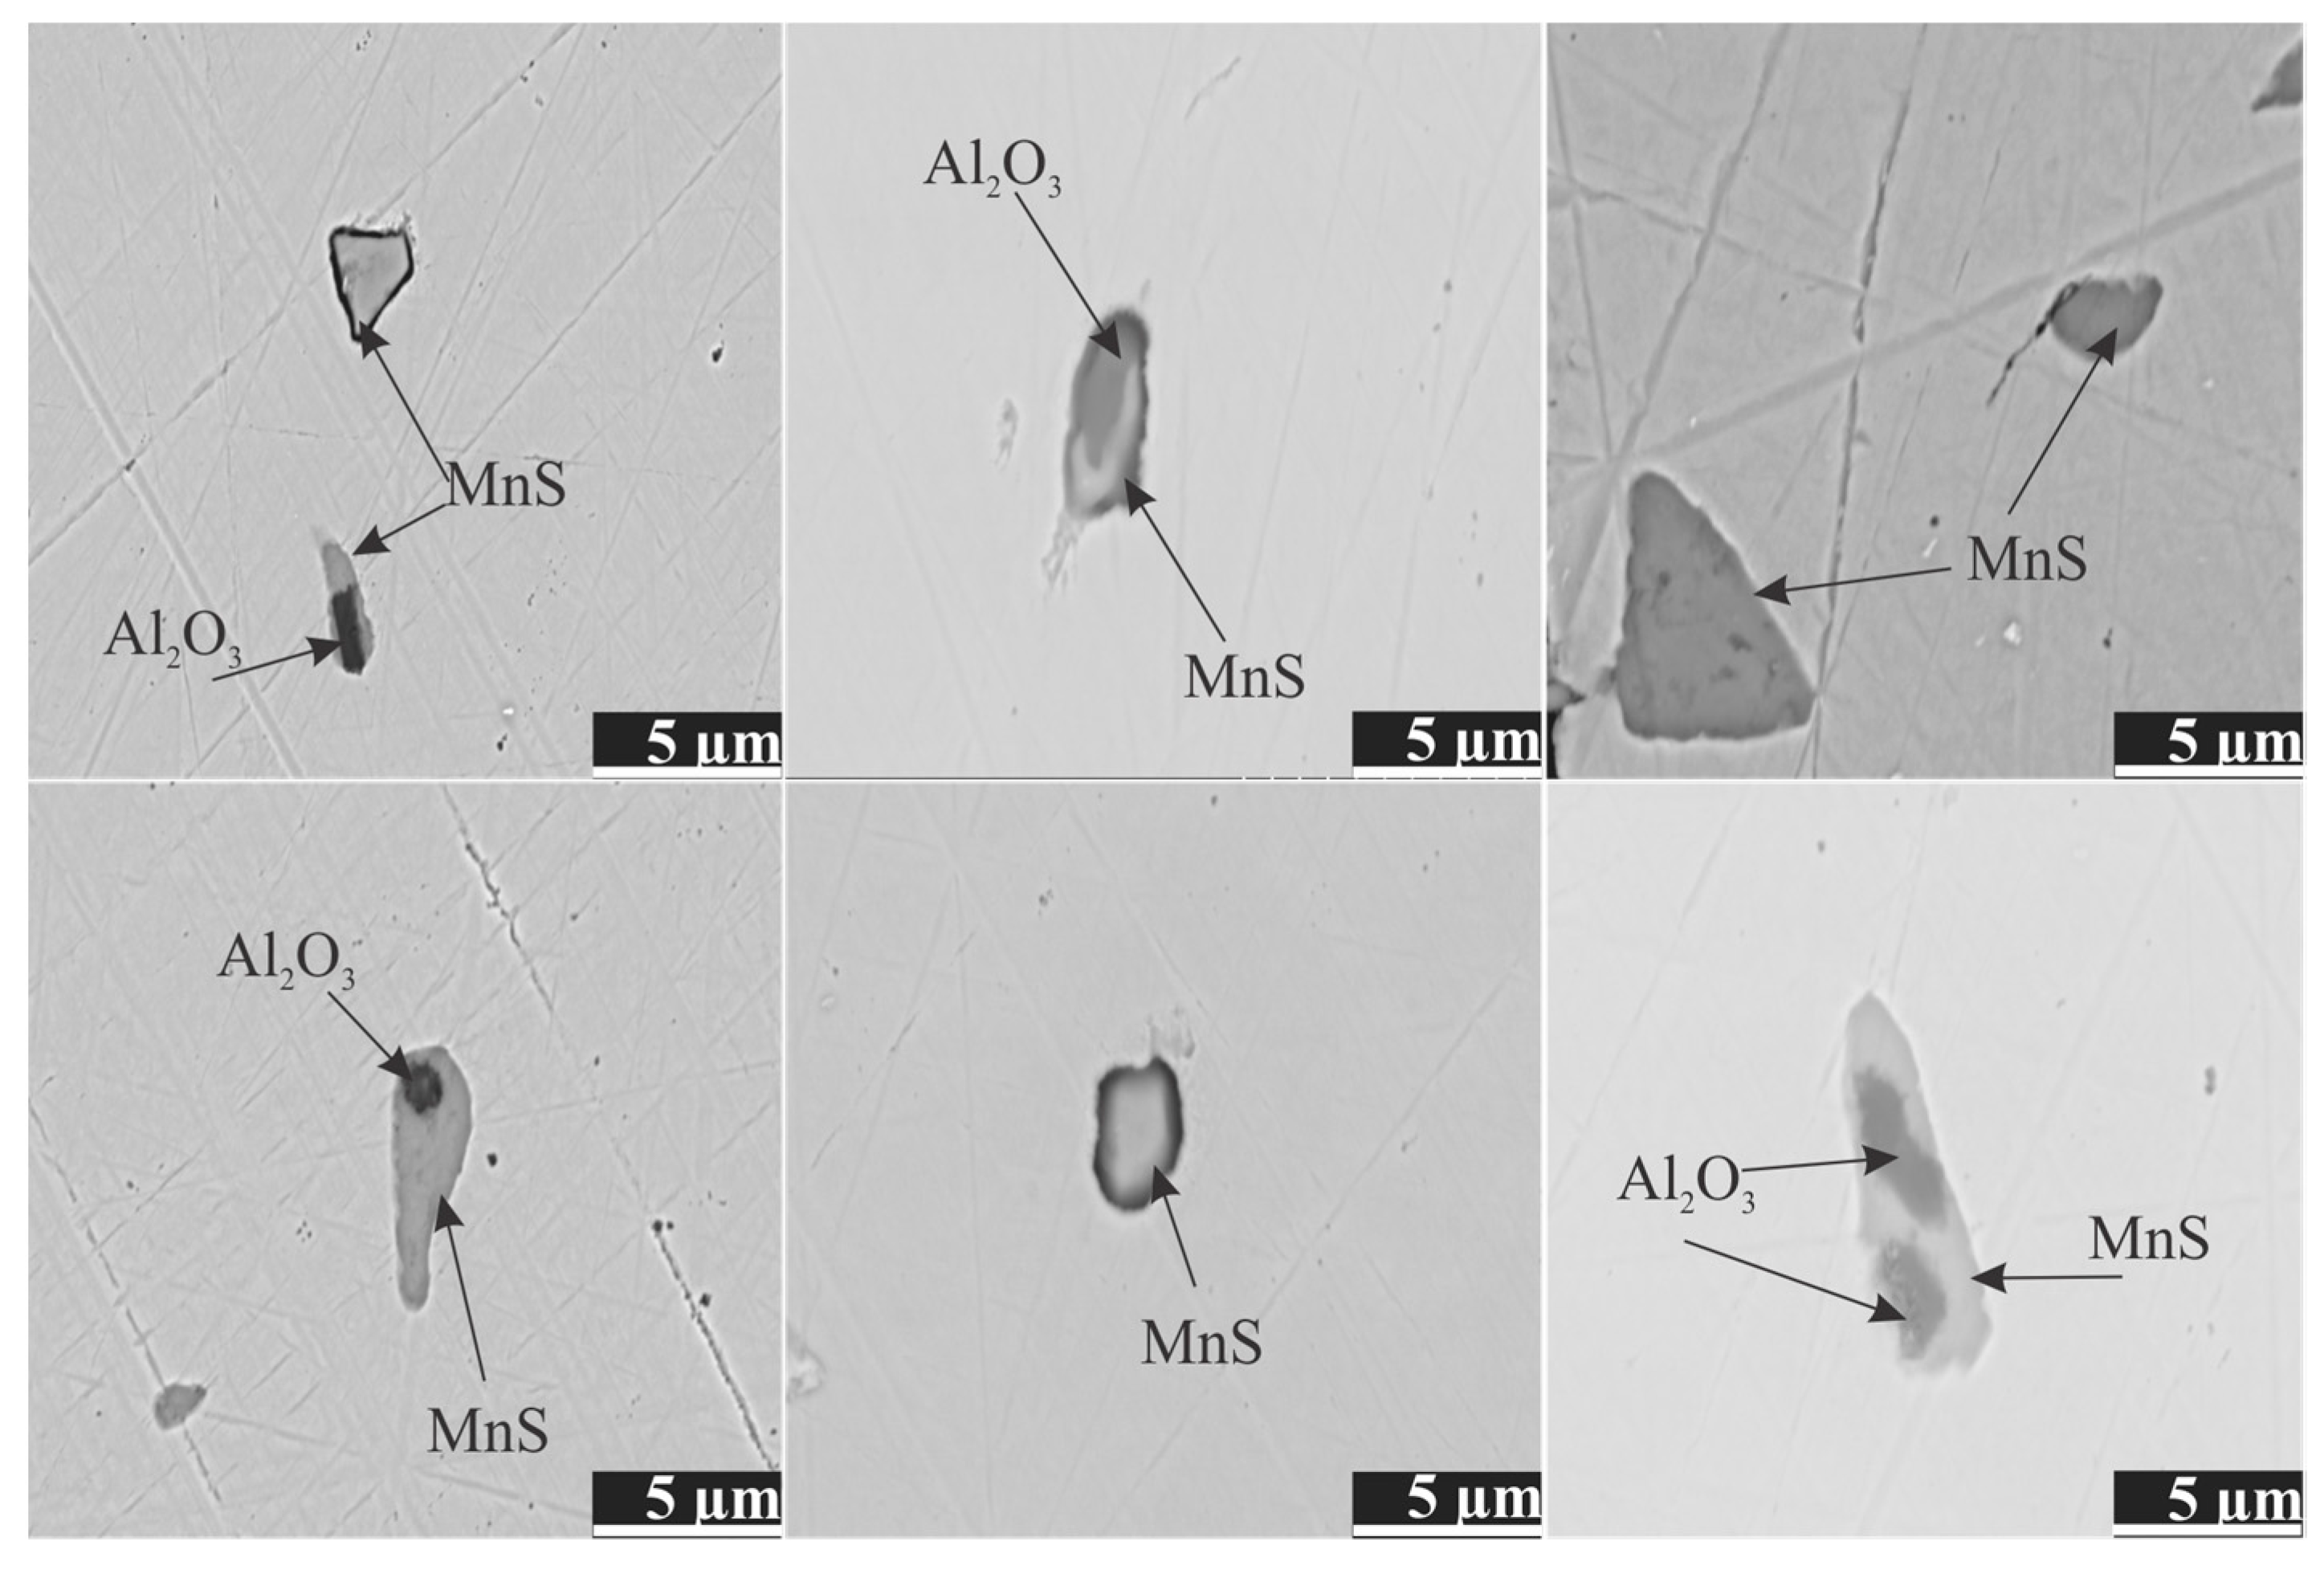
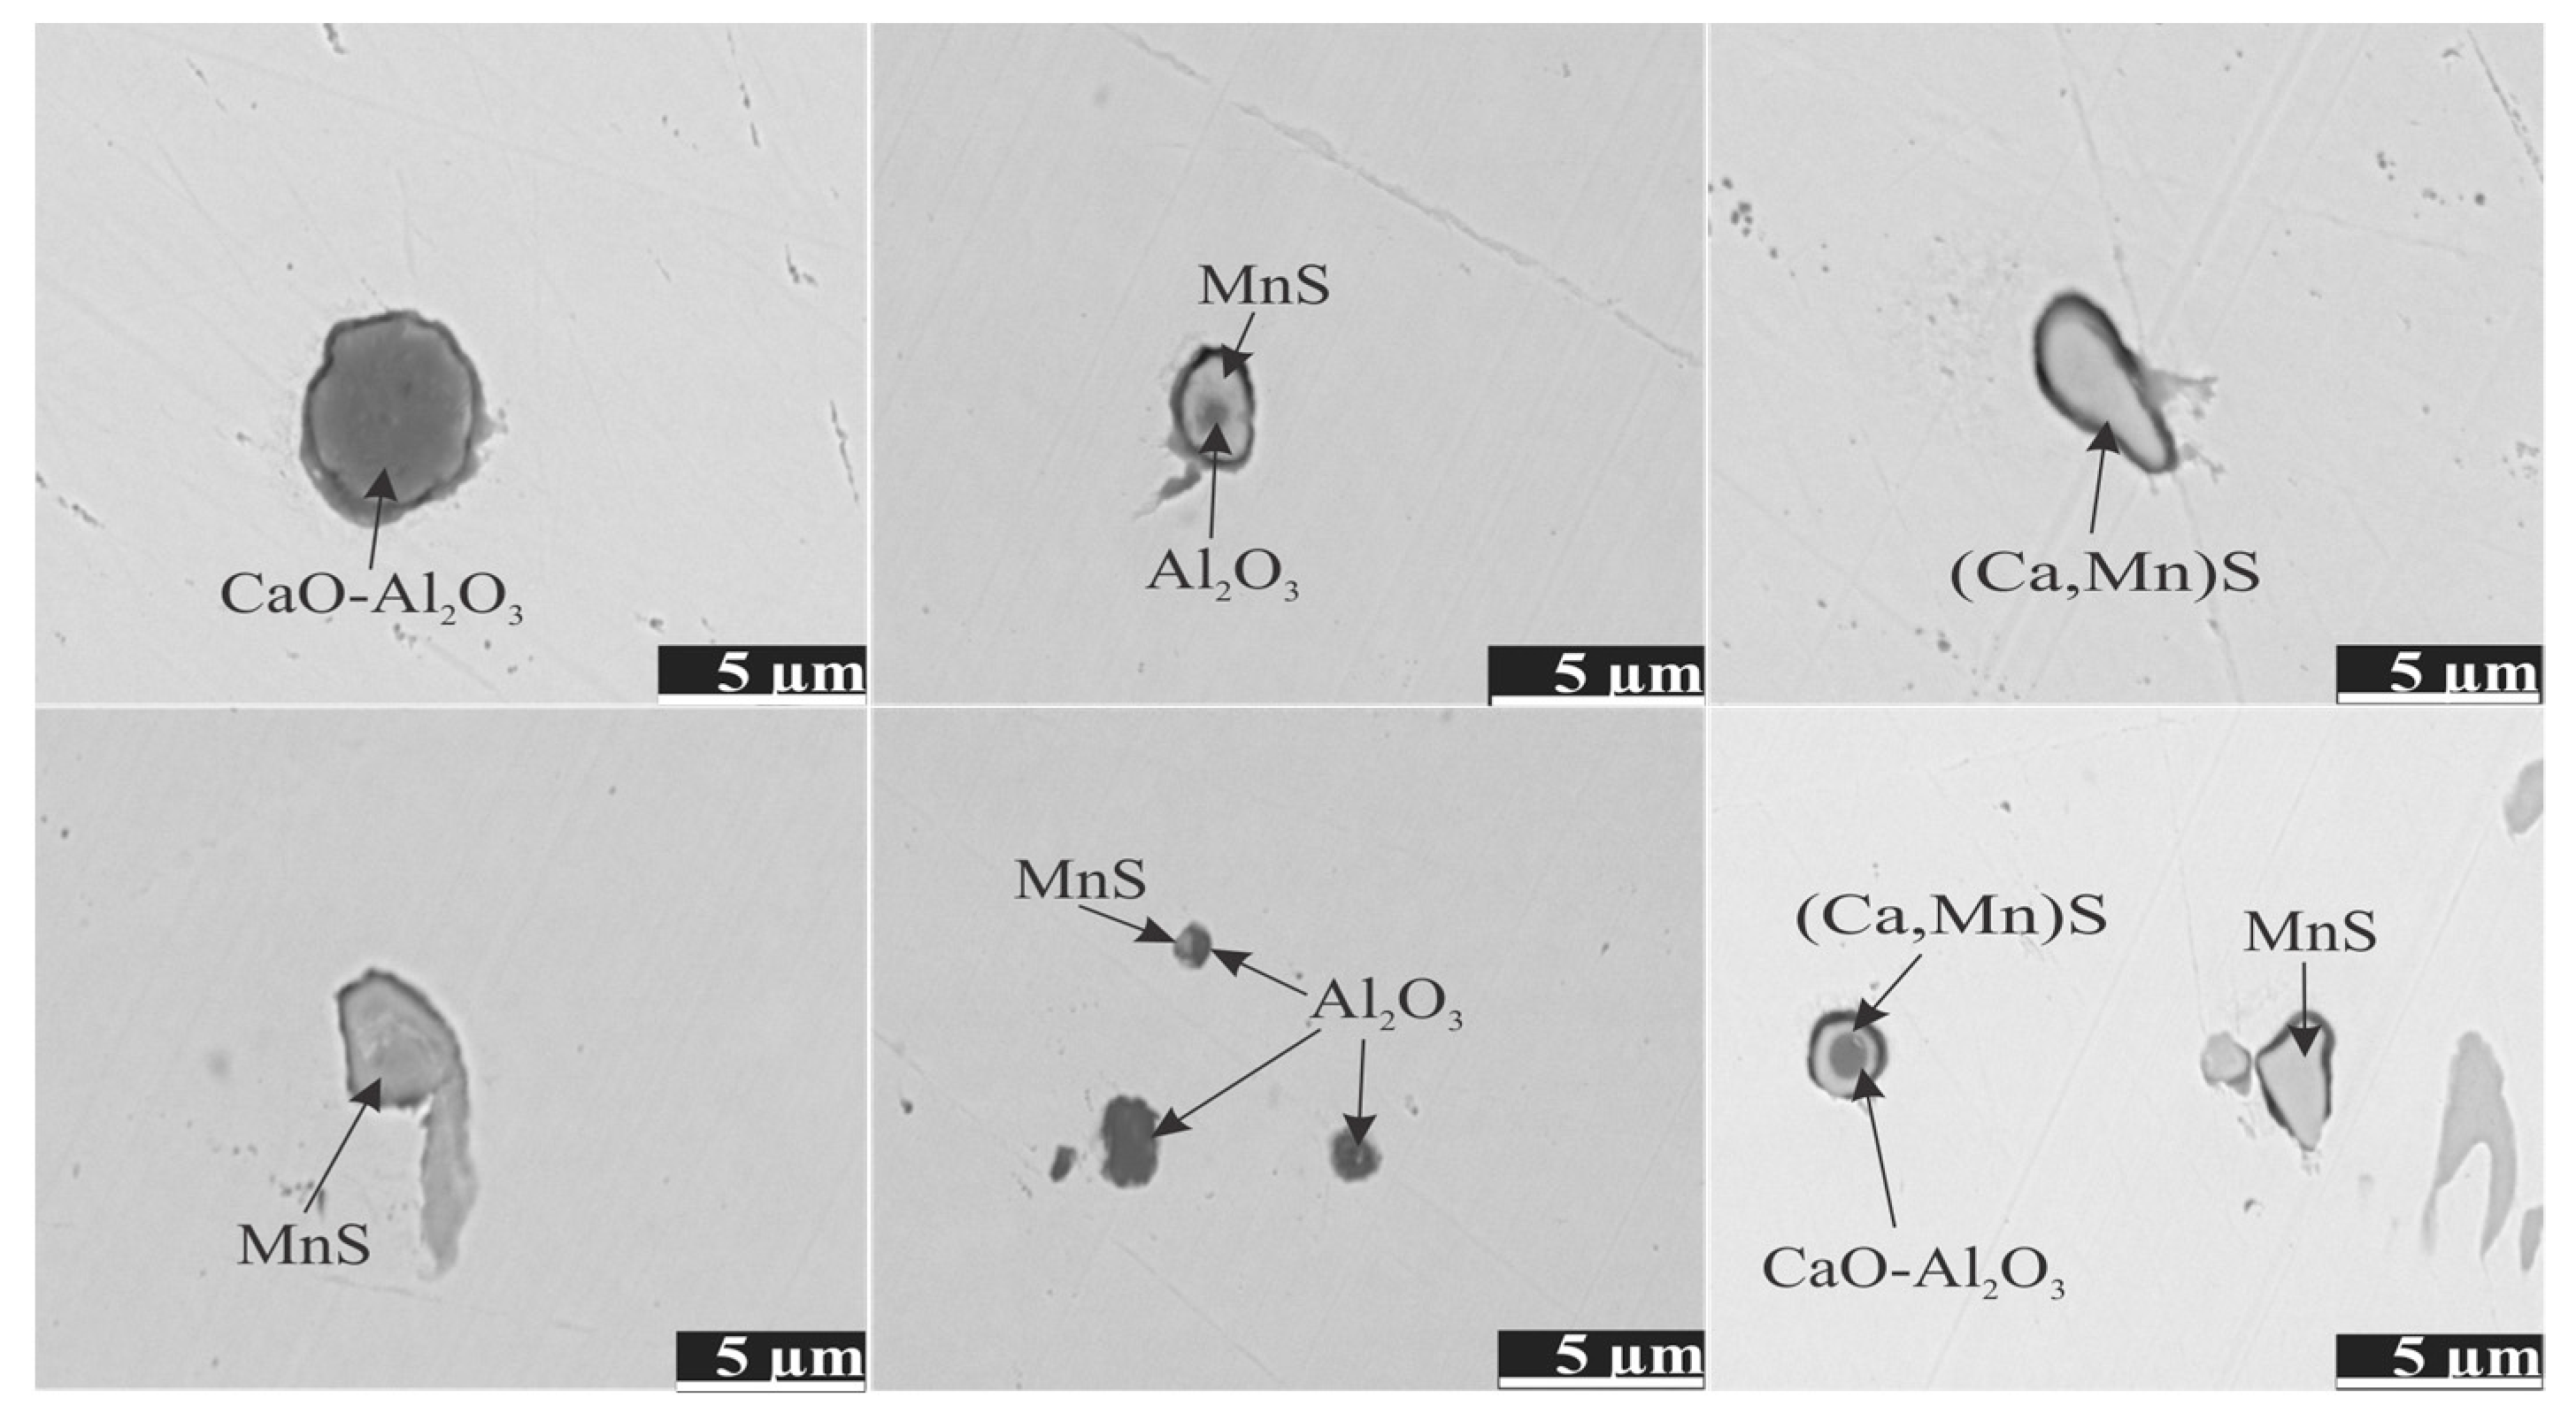
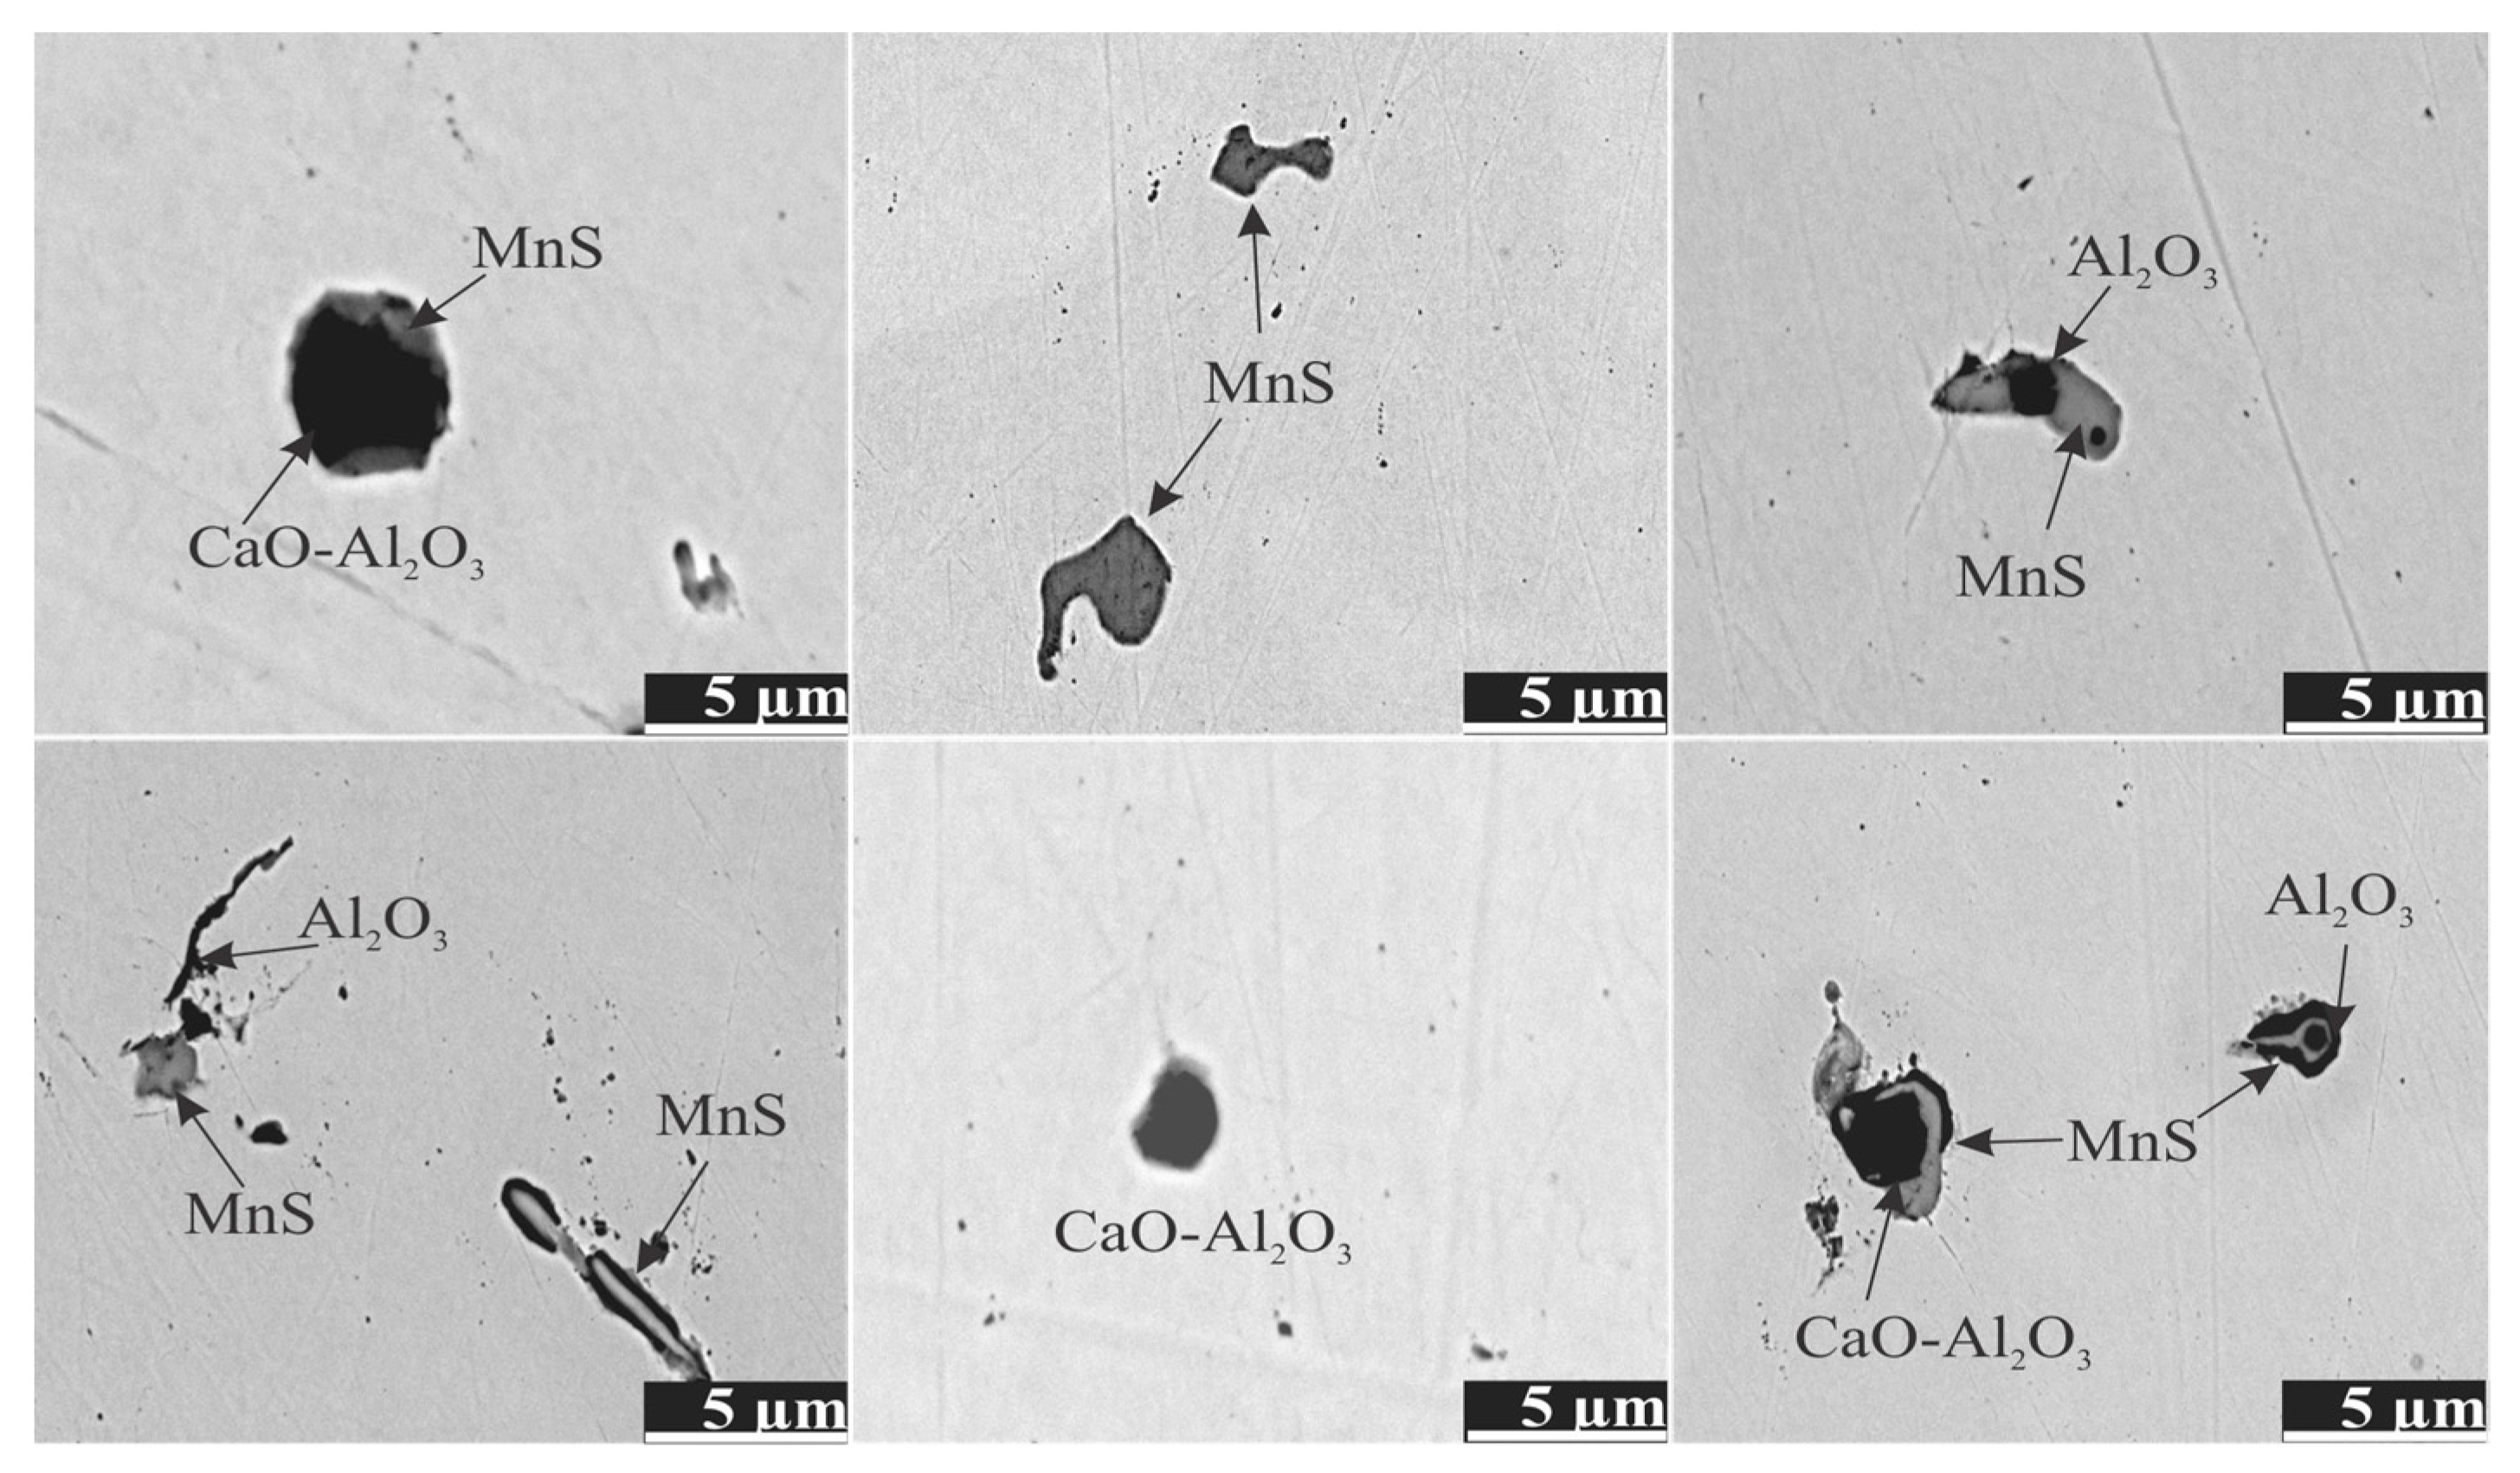
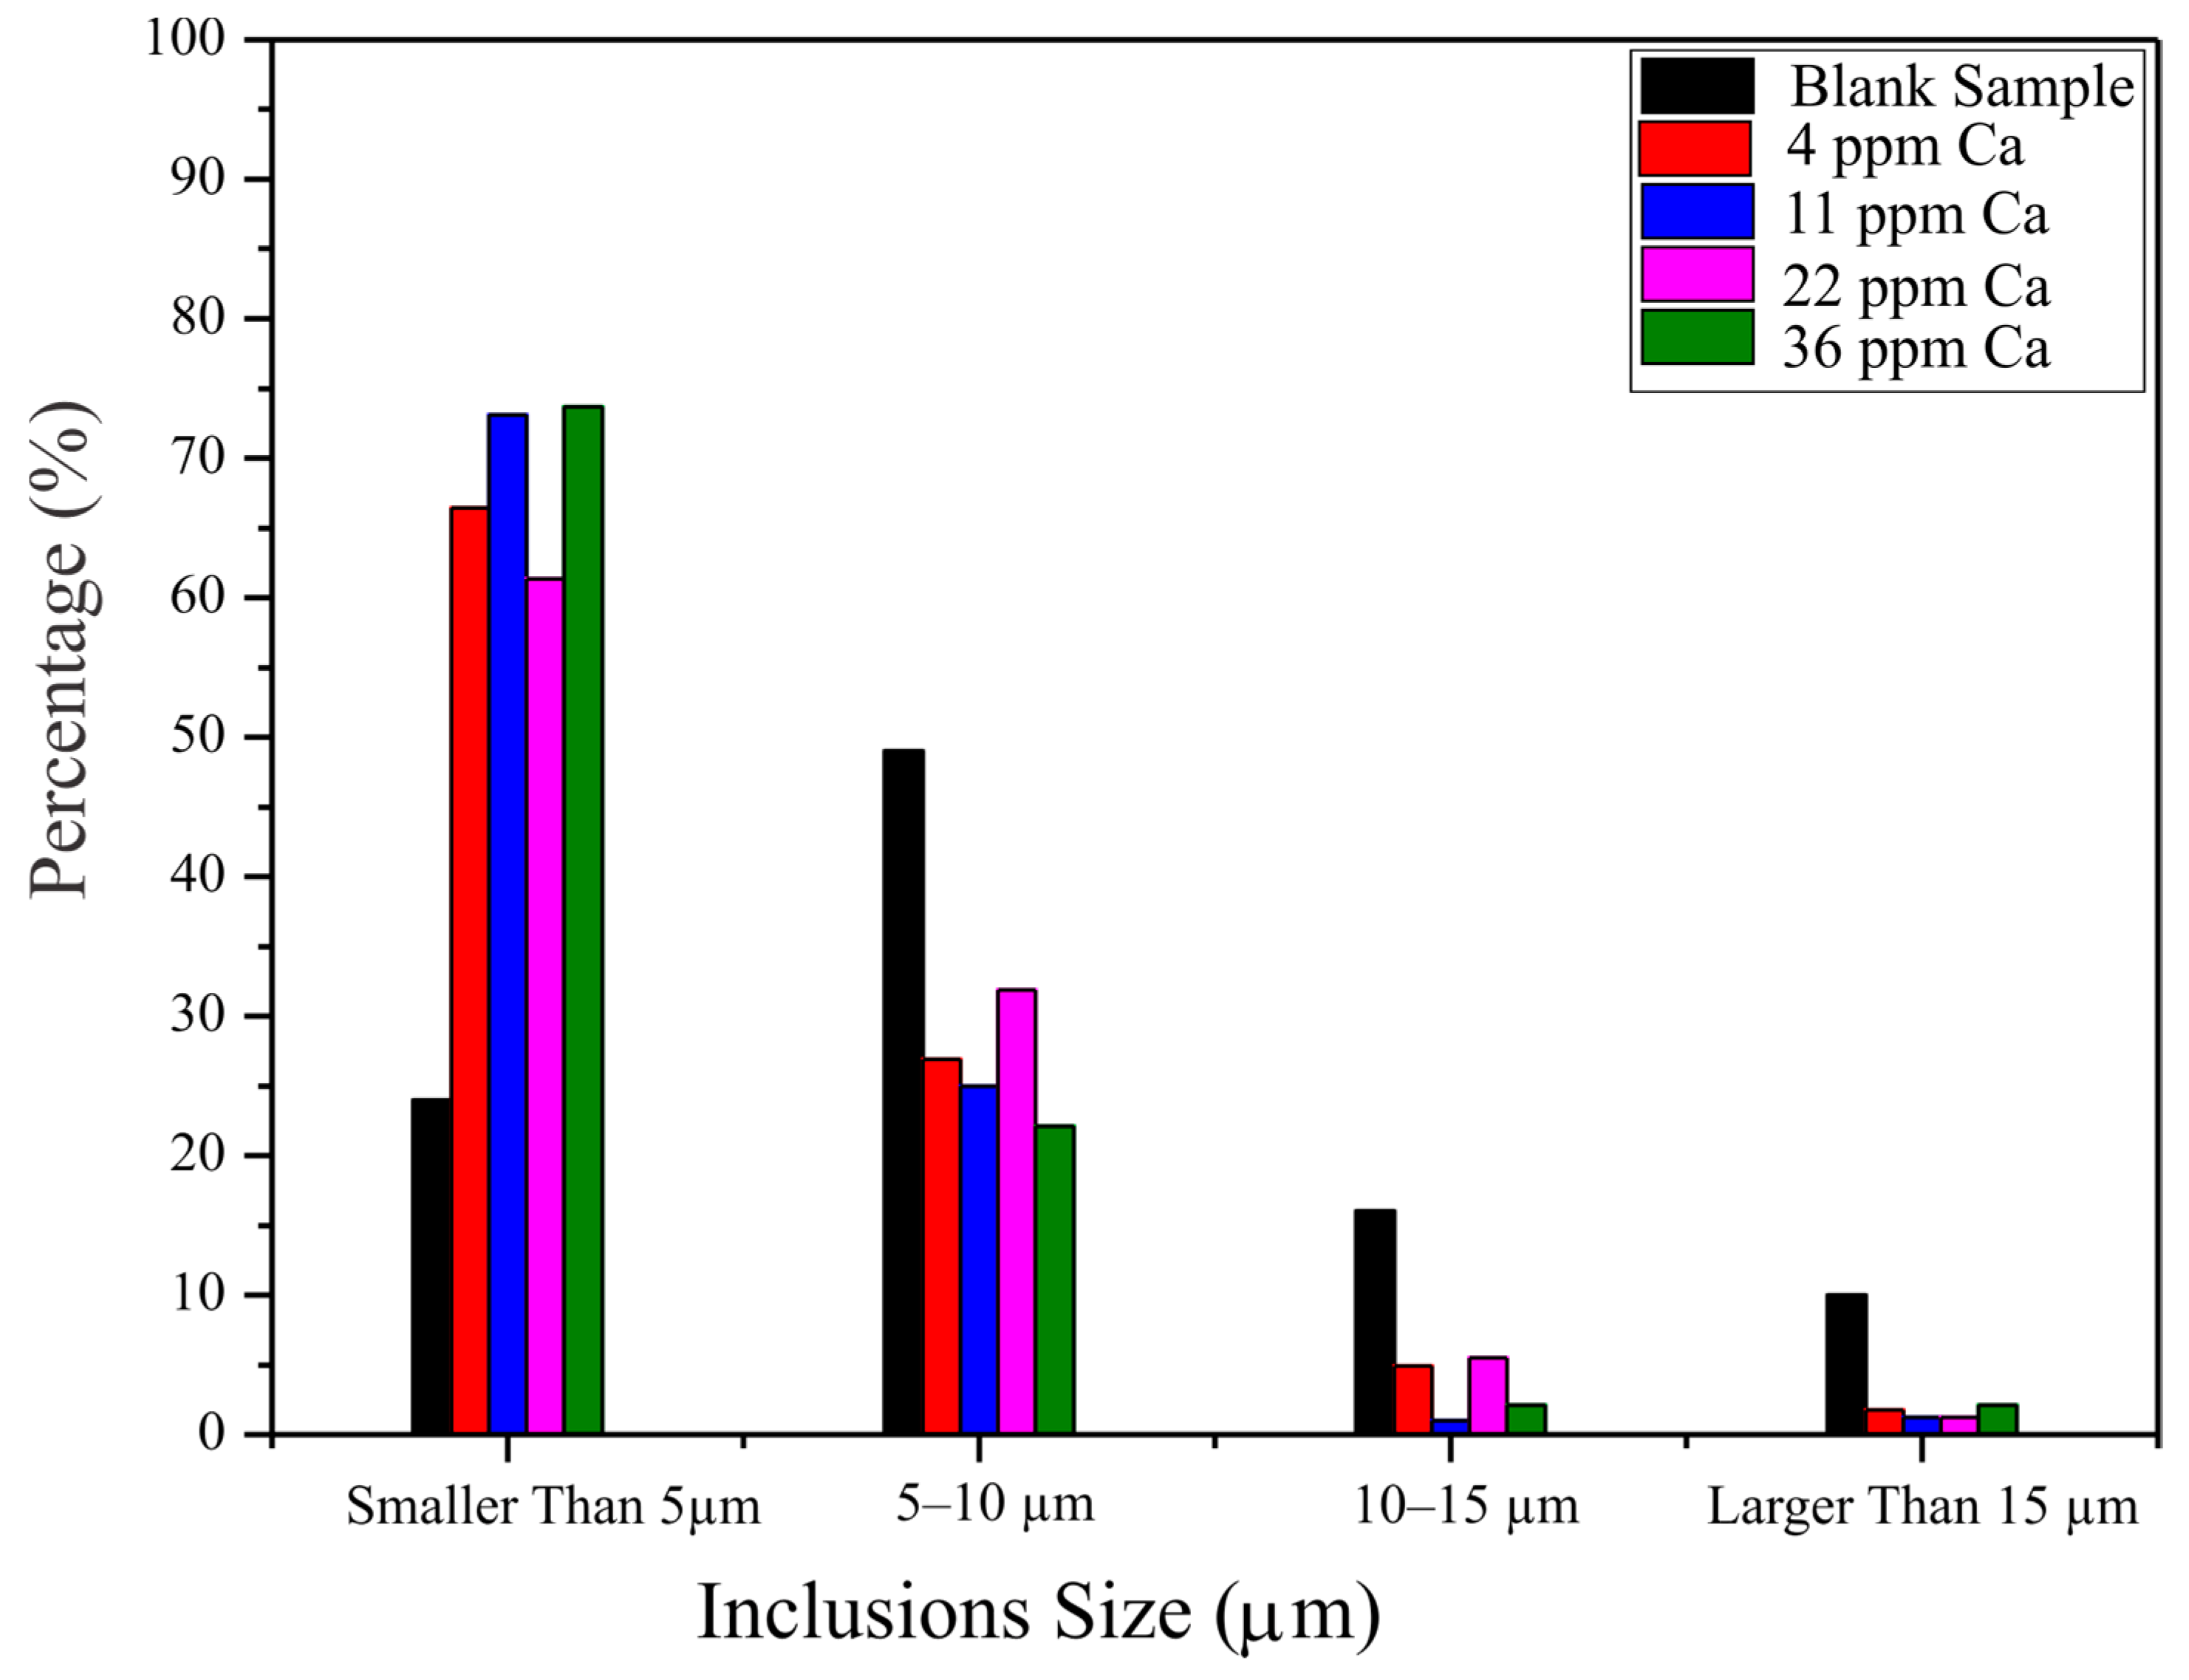
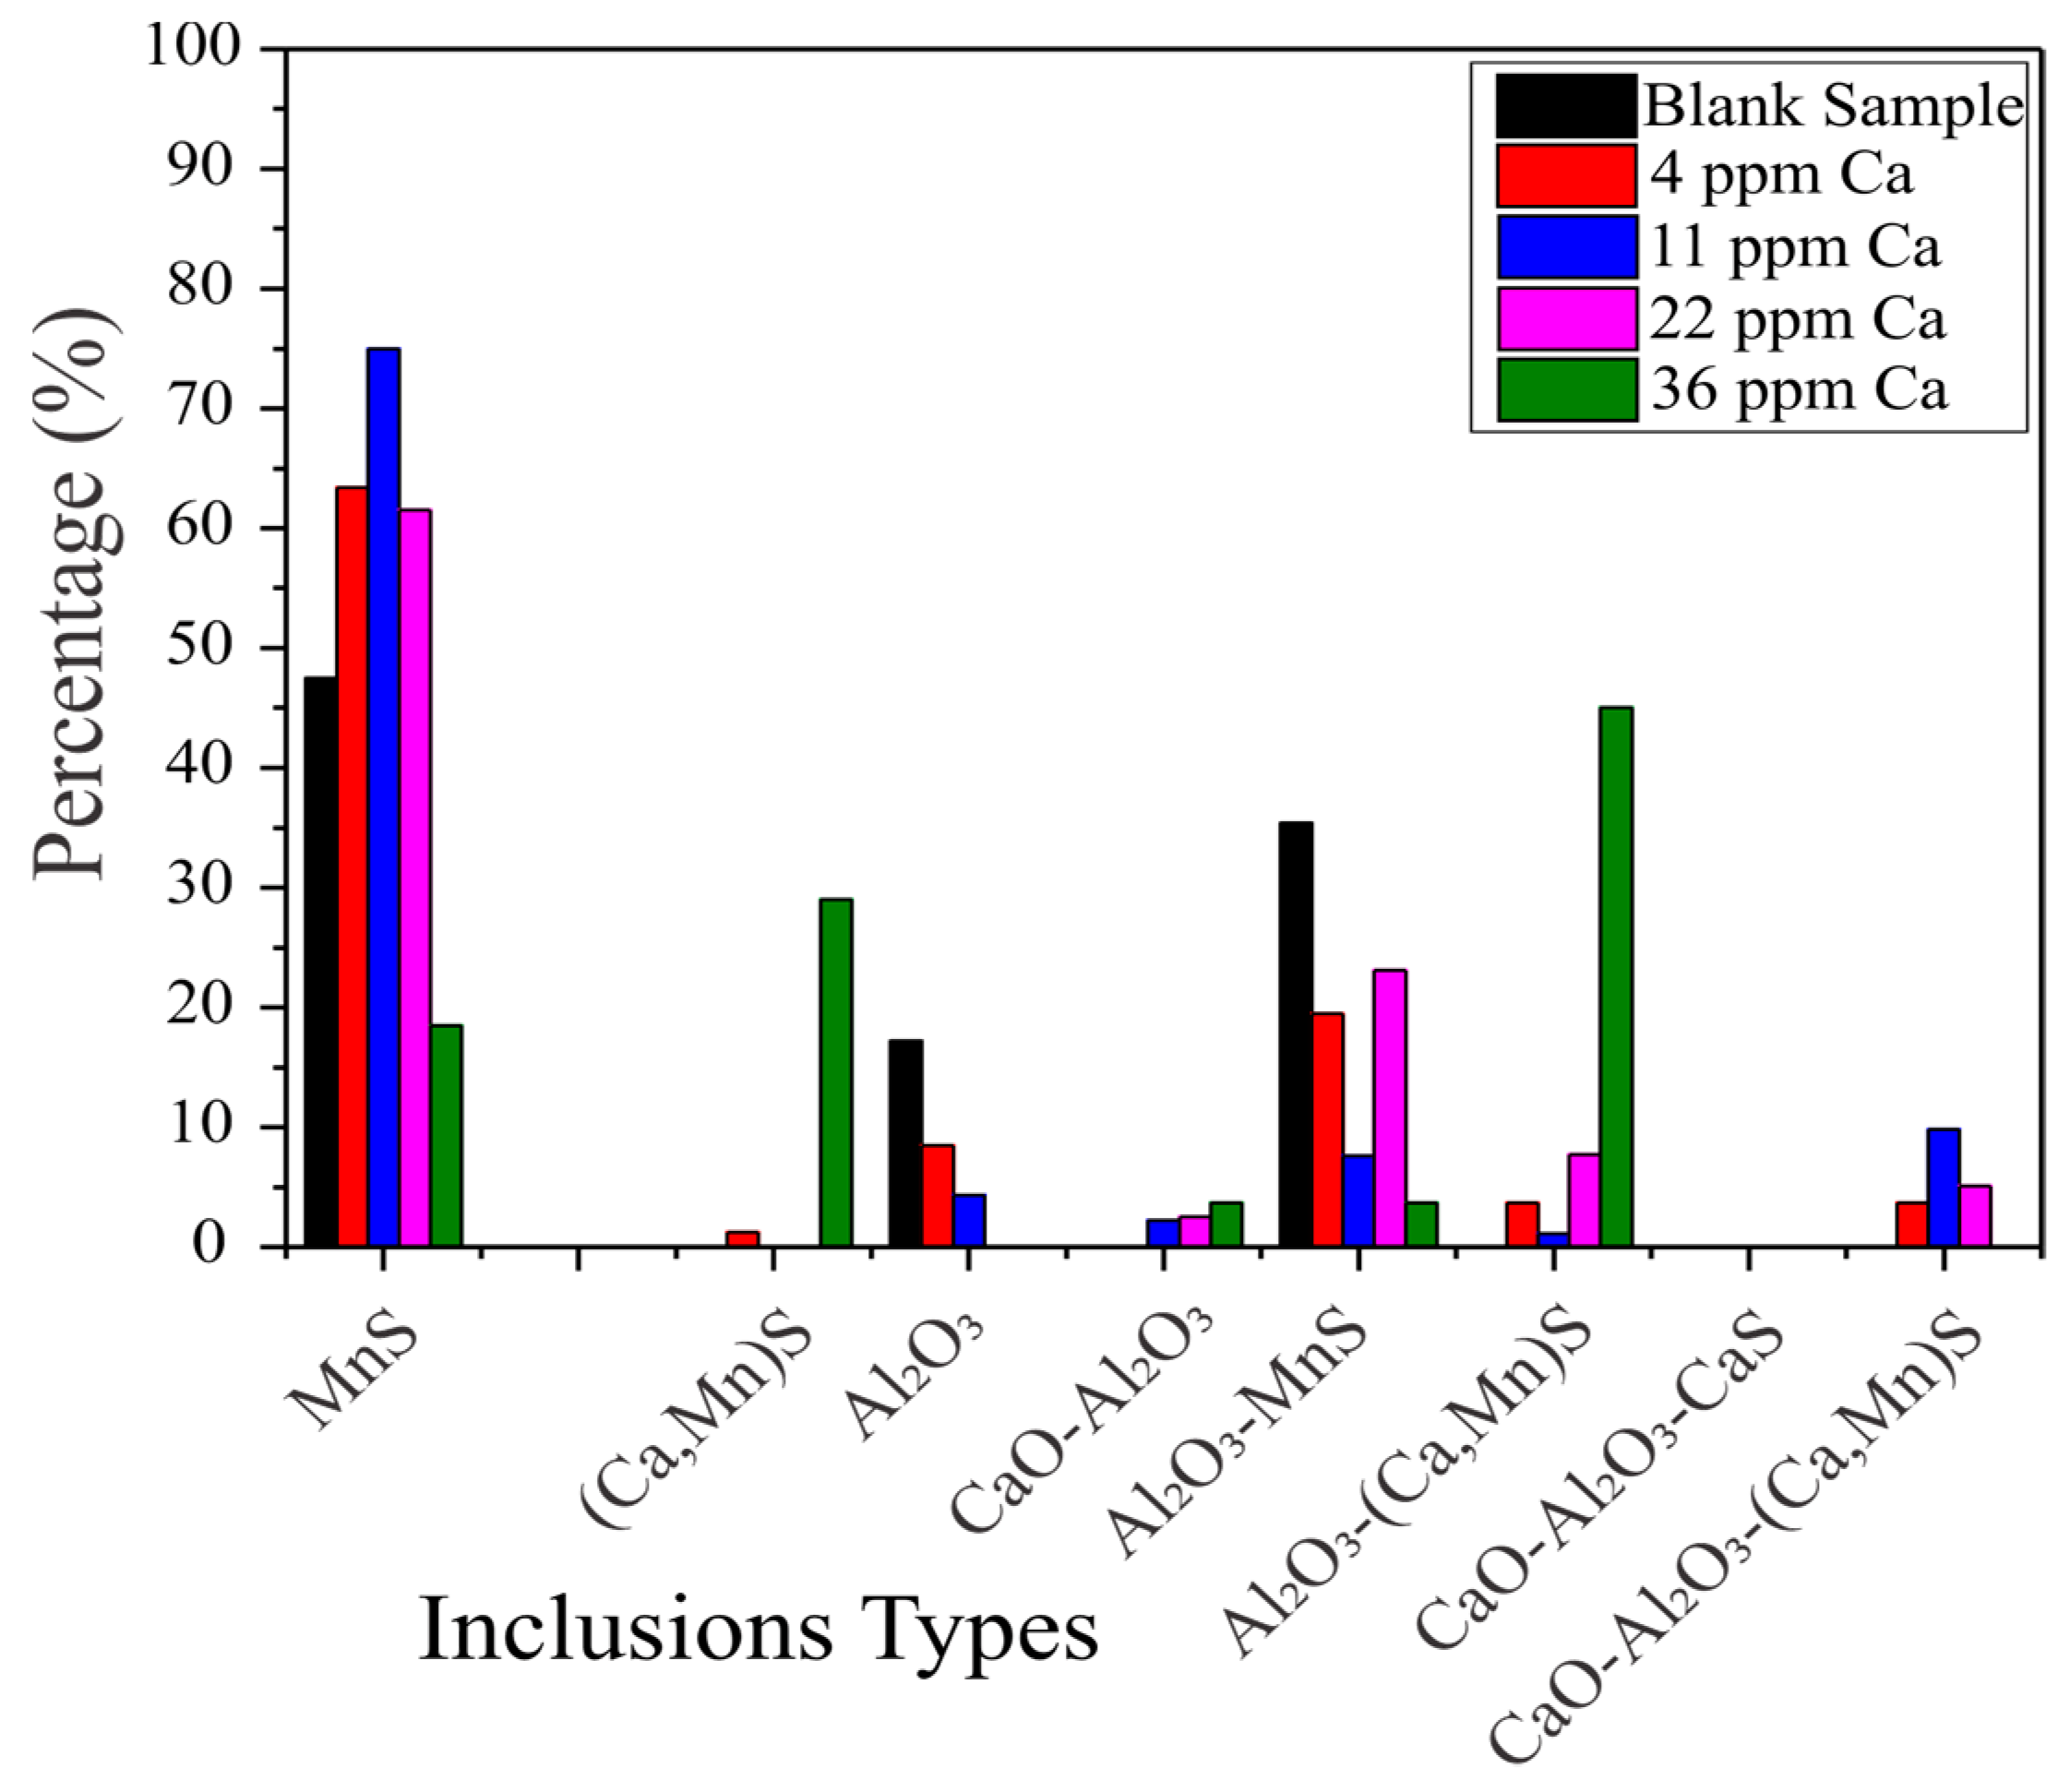
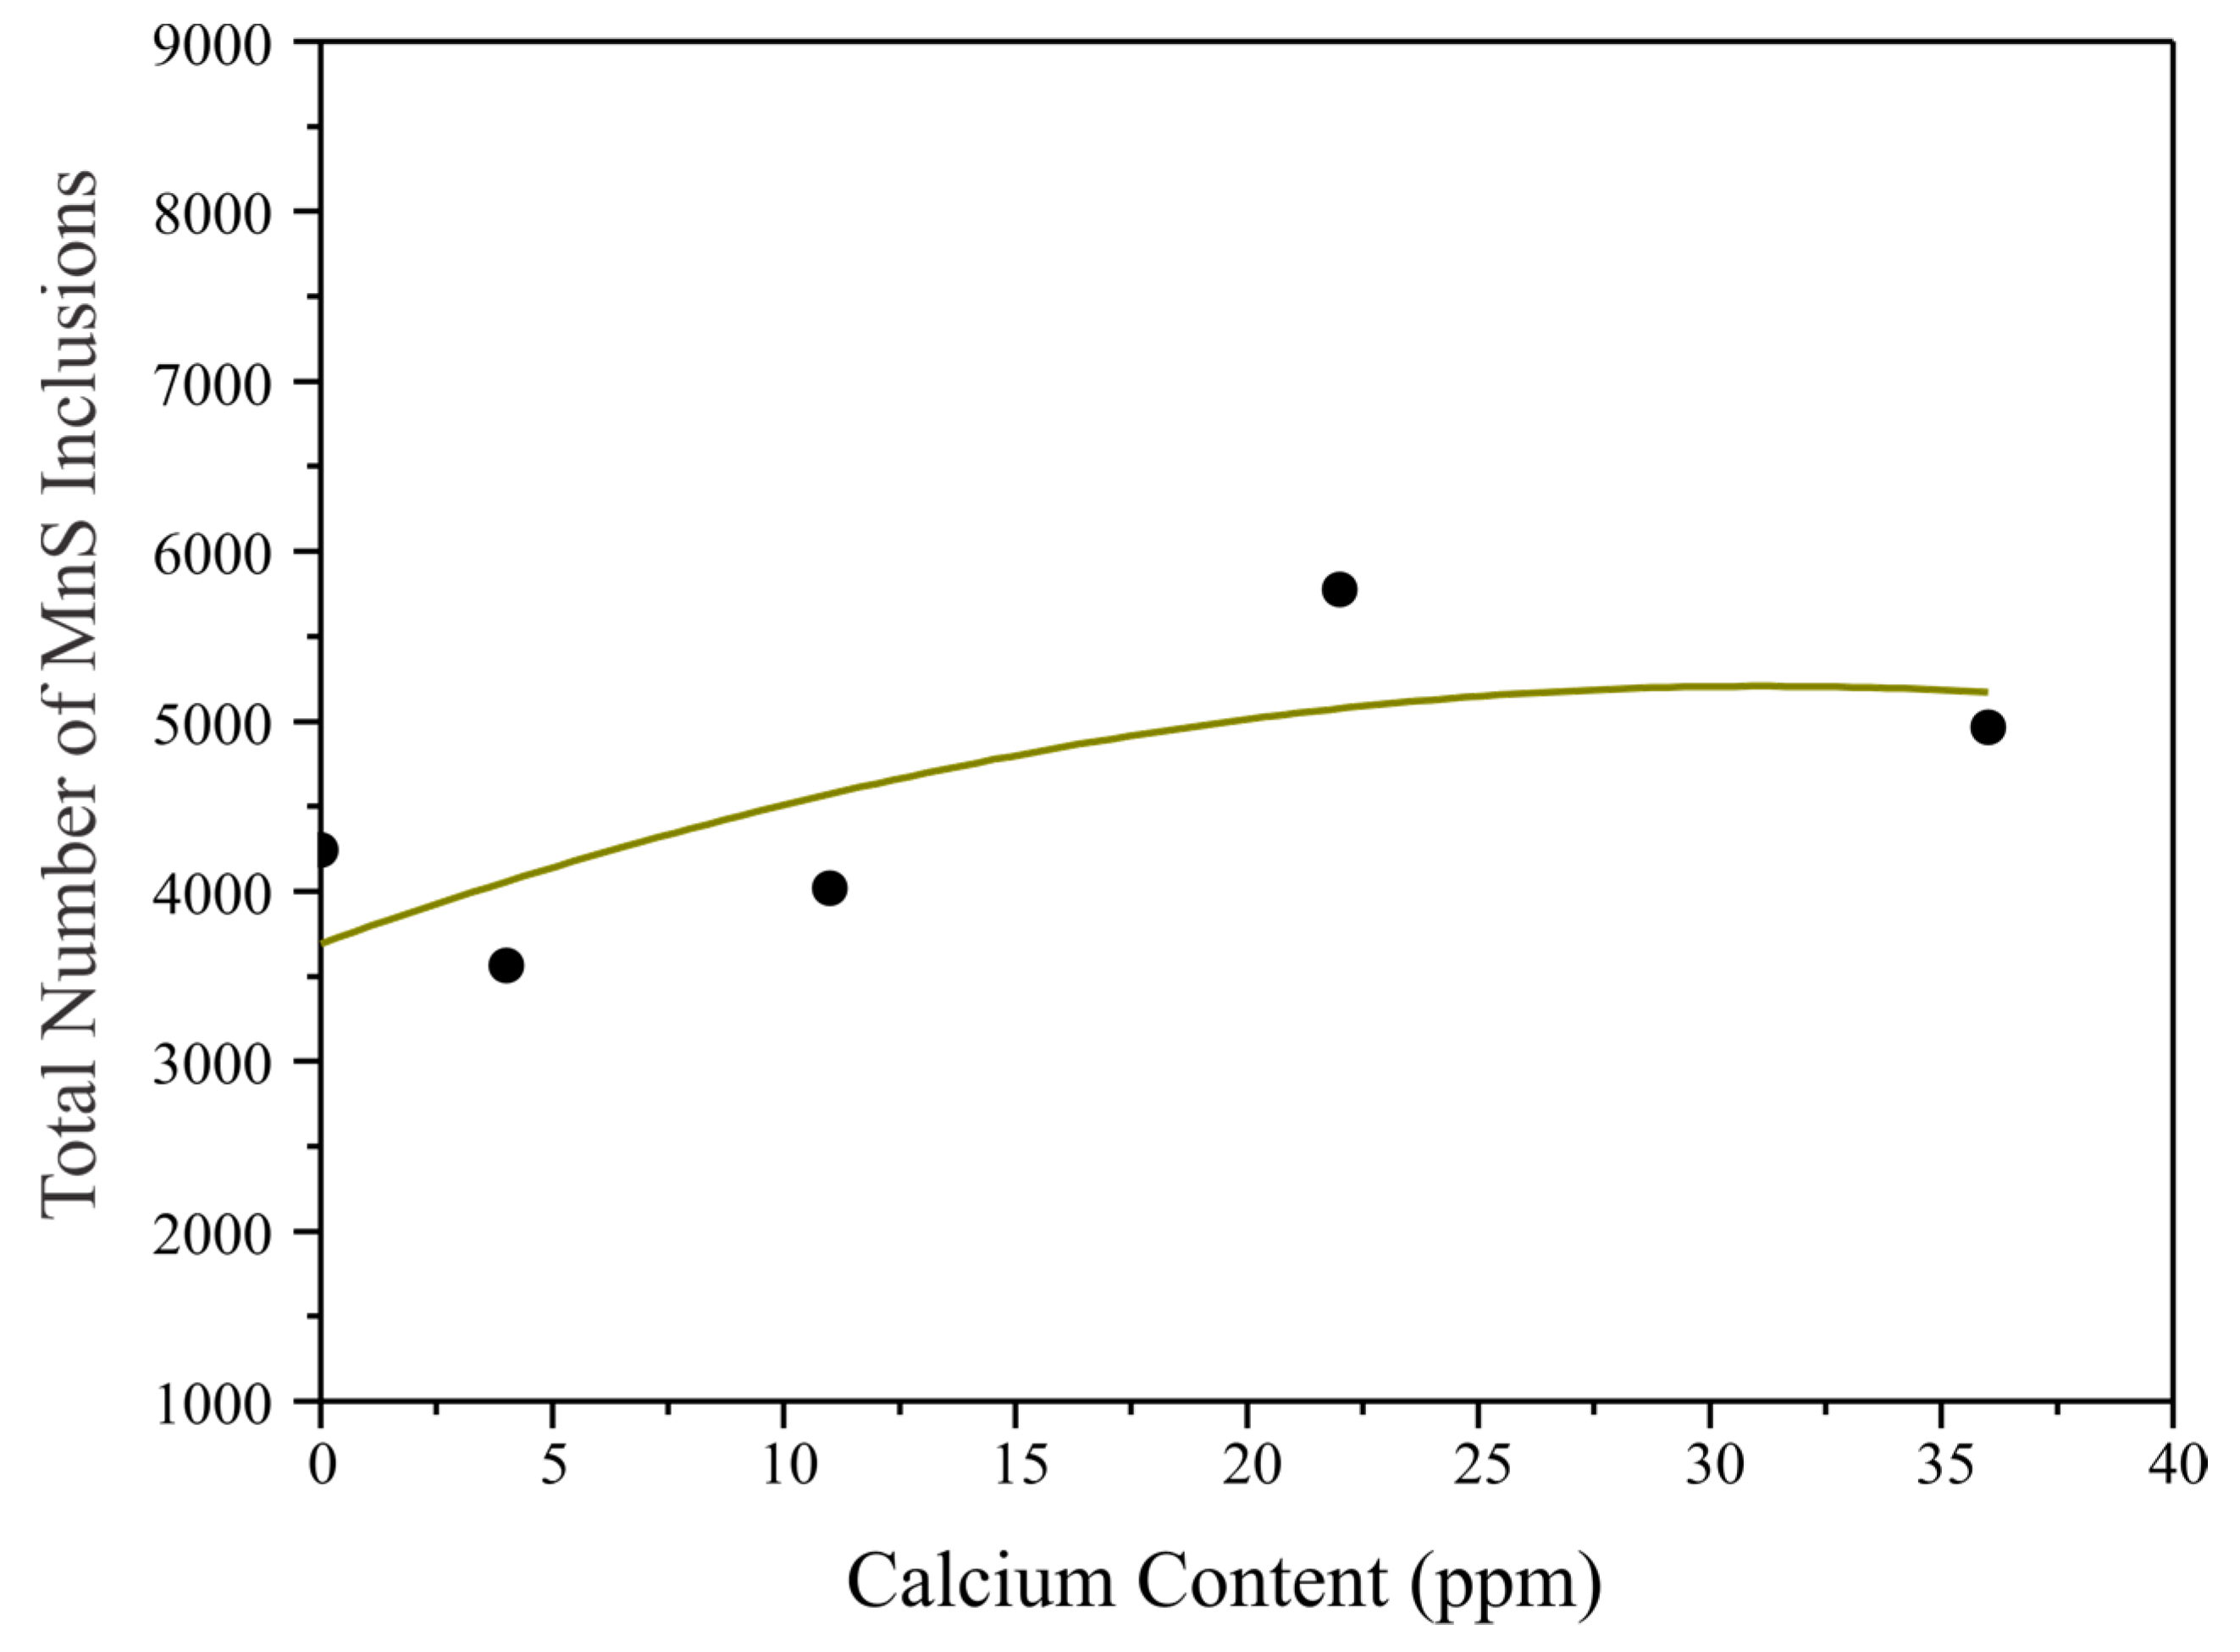
3.1. Morphology, Composition, Number Fraction and Size Range of Inclusions

The inclusions were categorized into different types based on their major chemical compositions and morphologies, including single/dual phases. The typical morphologies of the observed inclusions are shown in Figure 1, Figure 2, Figure 3, Figure 4 and Figure 5 below. From the blank sample up to 36 ppm Ca addition, the inclusions become more spherical and smaller in size. The classification of the inclusions based on their composition is given in Table 2 below.
The inclusion size is simply defined by measuring the longest length of the inclusion and considering the aspect ratio, and the morphology is defined as the structural feature of the inclusions—for instance, globular or irregular shape, with various sizes and lengths. According to Figure 6—explaining the inclusion size distribution—approximately 49% of the total inclusions in the blank sample were in the range of 5–10 µm, only around 22% of the inclusions were less than 5 µm and 10% of the inclusions were larger than 15 µm. In the sample containing 4 ppm Ca, around 65% of the total inclusions were less than 5 µm and 28% of the inclusions fell into the 5–10 µm size range. The sample with 11 ppm Ca addition showed around 73% of its total inclusions as less than 5 µm in size, while 25% of the total inclusions were in the range of 5–10 µm. In the sample with 22 ppm Ca, 60% of the total inclusions were less than 5 µm in size, while 35% of the total inclusions were in the 5–10 µm size range and only 7% of the inclusions were larger than 10 µm in size. The proportion of inclusions smaller than 5 µm were above 73% in the sample that contained 36 ppm Ca, around 20% of the total inclusions were in the 5–10 µm range and only around 5% of the inclusions were larger than 10 µm. The overall size of the inclusions began to decrease with increases in Ca content in the steel.
The classification/types of inclusions according to the specific composition of Ca is given in Figure 7. According to Figure 7, explaining the types of inclusion formation with increased in Ca content in the steel, with no Ca in the steel, pure MnS inclusions formed clearly—as can be seen in the figure, they accounted for around 47% of the total inclusions with pure MnS. As the steel was deoxidized with Al, the formation of pure Al2O3 and its transformation into CaOx–AlOy inclusions can be seen from the figure. Starting from 17% of total inclusions as pure Al2O3 in the blank sample, this percentage began to decrease with increases in Ca content in the steel, and the percentage of CaOx–AlyOz inclusions started to increase. The number of CaOx–AlyOz inclusions began to increase at the expense of alumina inclusions. As Al was the primary deoxidizer, its association with the other inclusions is also important to discuss. The blank sample showed around 35% of its total inclusions as Al2O3–MnS inclusions. Meanwhile, with 4 ppm Ca addition, the percentage of pure MnS inclusions increased up to 65% as compared to the base sample—but the percentage of pure Al2O3 inclusions reduced to only 8%, whereas 10% of the inclusions were a solid solution of (Ca,Mn)S with either pure alumina core or calcium aluminate. In the sample with 11 ppm Ca, around 75% of the total inclusions were unmodified, pure MnS inclusions, even though the size of the inclusions was less than 5 µm. Only around 15% of the collective dual-phase inclusions were observed. The sample with 22 ppm Ca addition showed around 60% of its total inclusions as containing pure MnS; around 25% of these MnS inclusions contained an alumina core and only 5% of the inclusions were completely modified with liquid CaO–Al2O3 as a core surrounded by a solid solution of (Ca,Mn)S. In the steel sample with 36 ppm Ca addition, around 20% of the total inclusions contained pure MnS; around 45% were dual-phase inclusions, such as an Al2O3 core surrounded by a solid solution of (Ca,Mn)S, while around 30% modified (Ca,Mn)S inclusions were present in the sample.
Figure 8 and Figure 9 represent the number of pure MnS inclusions and their size distribution with increases in Ca content in the steel; the data used to produce these images was extracted from MLA software using mineral grain size distribution data series provided in the software. This software can differentiate inclusions based on their composition and grain size distribution. To include every possible/detectable inclusion for analysis, pixel-by-pixel scanning was carried out using an automated scanning electron microscope. It can be seen from Figure 8 below, that the gradual increase of Ca content in the steel caused the number of pure MnS inclusions to increase steadily up to an extent and then decrease again, whereas Figure 9 shows the size distribution of pure MnS inclusions. By comparing both Figure 8 and Figure 9, although the number of pure MnS inclusions seemed to be increasing with increases in Ca content, the average size of these inclusions began to decrease and the morphology of the inclusions also changed from irregular to globular (as can be seen in Figure 1, Figure 2, Figure 3, Figure 4 and Figure 5 above), making them feasible for use as cast steels. The increases in Ca in the steel changed the inclusions’ composition from pure MnS to either CaO–Al2O3-(Ca,Mn)S or a solid solution of (Ca,Mn)S. After hot working, the larger-sized inclusions broke down into several small-sized inclusions, while the oval-shaped or tear drop-shaped inclusions elongated and affected the transverse properties of the steels; they also created hindrances during machining, and at hot-working temperatures, the MnS inclusions dissolved and reprecipitated again.
Figure 10 shows the exact size distribution of pure MnS inclusions in all the samples. It can be seen from the figure that with increases in Ca content in the steel, the percentage of smaller-sized pure MnS inclusions began to increase. The average size of the pure MnS inclusions showed a decline with increases in Ca content in the steel; although the number of pure MnS inclusions increased with increases in Ca content, the average size decreased, proving the effect of Ca addition on modifying the pure MnS inclusions. Furthermore, Ca addition in the melt transformed the pure MnS inclusions into duplex ones.

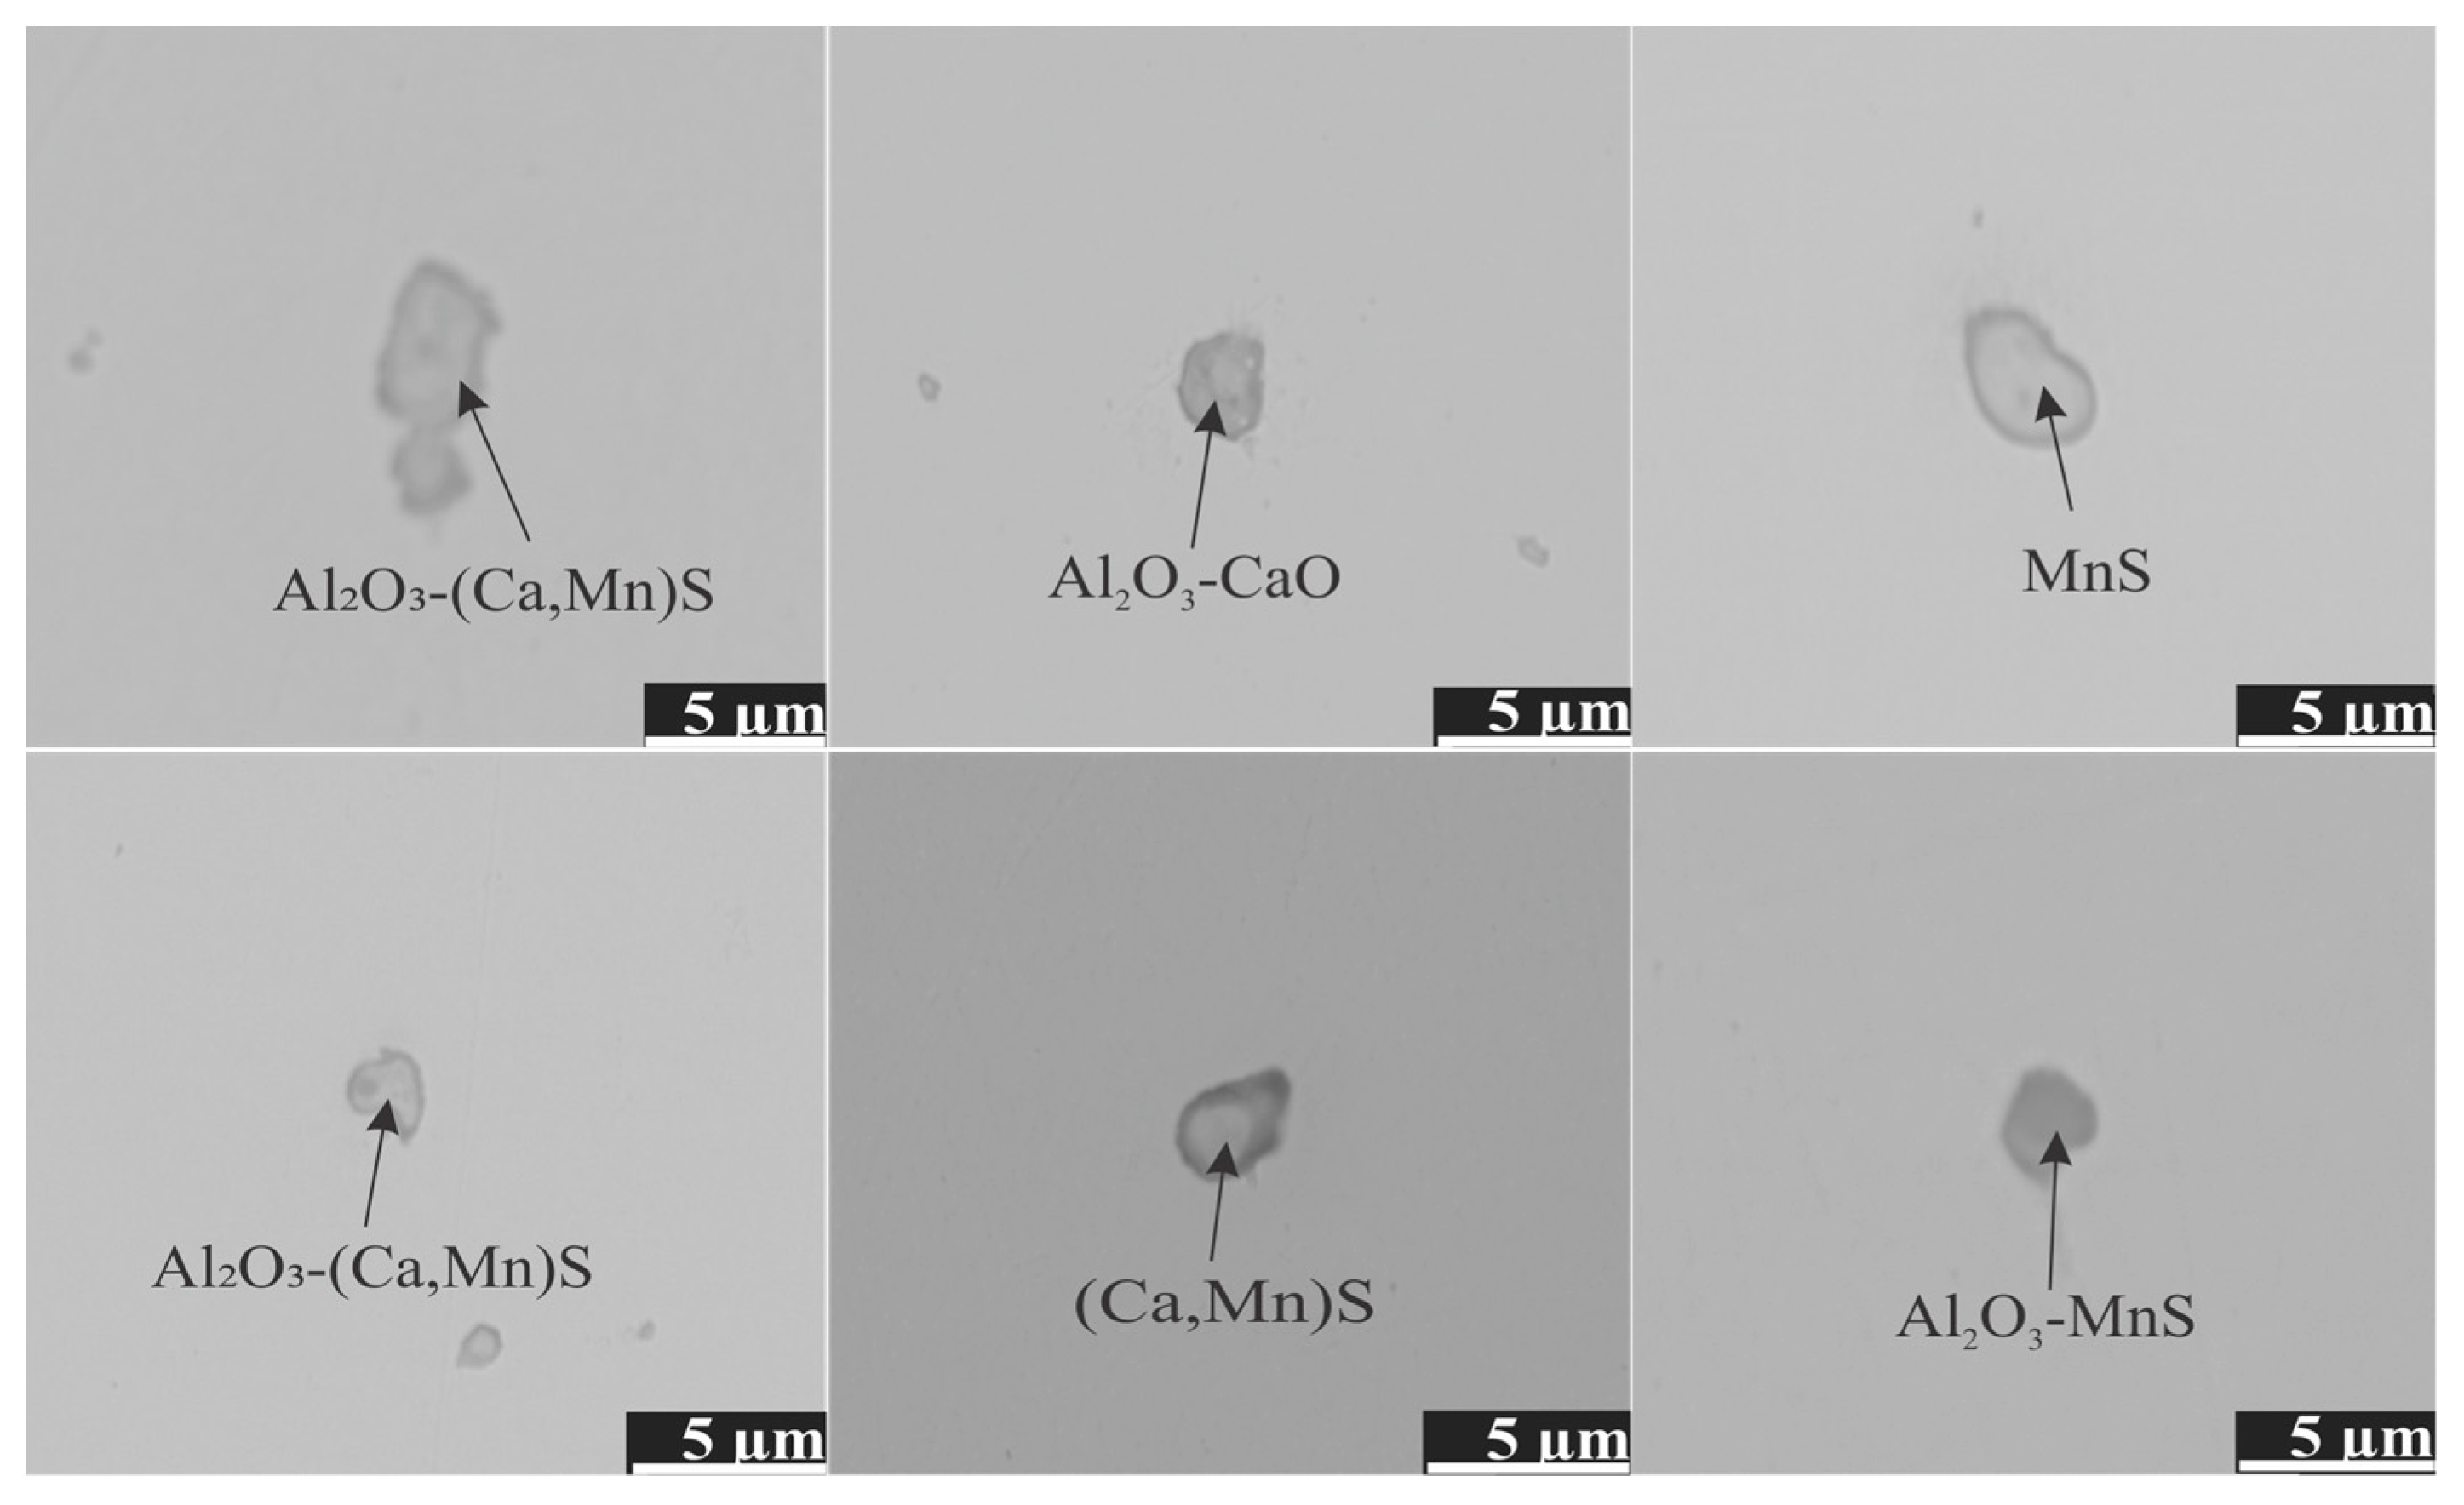
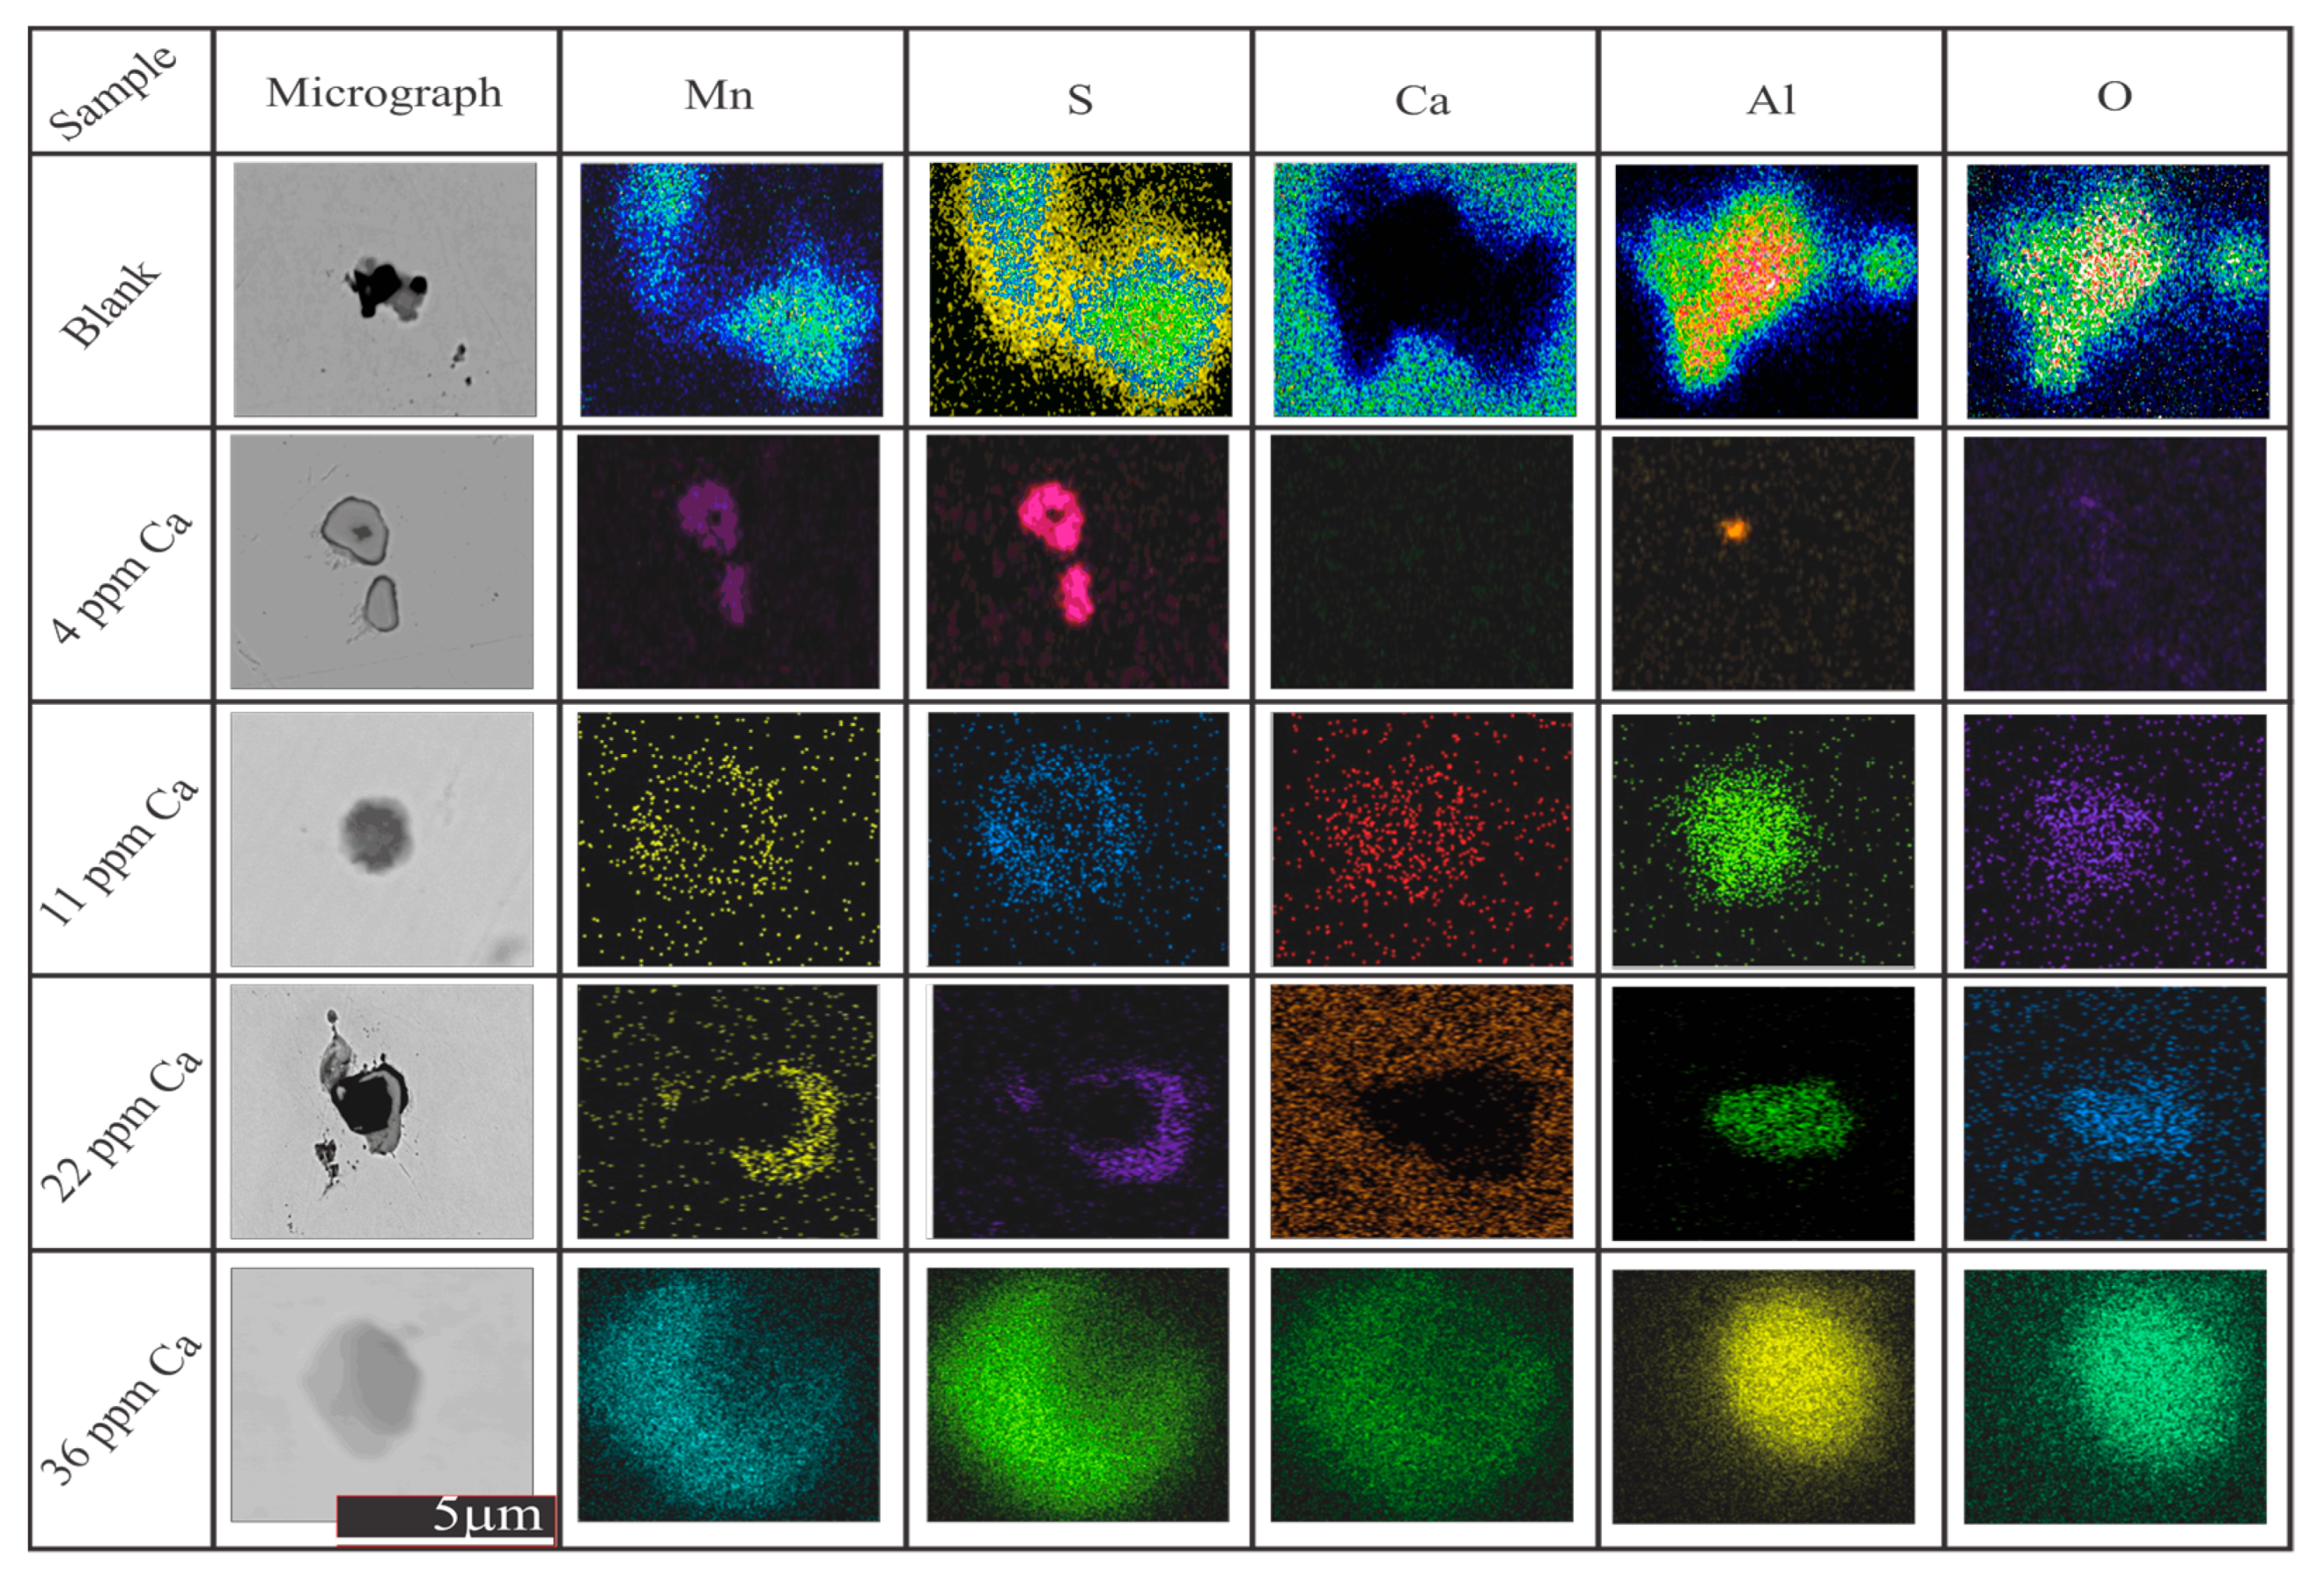
3.2. Typical Morphologies and EDS Mappings

As mentioned in the earlier section, either only pure MnS or a solid solution of (Ca,Mn)S inclusions were observed in all the steel samples—either single phased inclusions or dual—and no CaS inclusions were precipitated either individually or associated with any oxide core, despite having a high sulfur content. SEM-EDS mappings of typical inclusions in all the samples are shown in Figure 11.
In a study [24] of inclusion formation in Ca-treated Al-killed steel, the activity of CaS associated with the oxide phase was considered constant—such as one—because of the very low solubility of CaS (2 to 5 wt.%) in calcium aluminate at 1600 °C and the lack of MnS inclusion in steel above the liquidus temperature. However, during solidification, the segregation and enrichment of S and Mn in the liquid portion resulted in the precipitation of MnS in the inter dendritic space; subsequently, the MnS got dissolved in the CaS to form a solid solution of (Ca,Mn)S, leaving no pure CaS behind. Thus, the activity of CaS can vary in a (Ca,Mn)S solid solution and cannot be treated as a constant. Hence, the modification of MnS inclusions into solid solutions of (Ca,Mn)S depends largely on the Ca/Mn and Ca/S ratios in the steels. Blais et al. studied the effect of calcium-to-sulfur (Ca/S) ratios on the modification of inclusions and proposed that an optimum Ca/S ratio of 0.70 to be the best for the modification of sulfide inclusions [25]. In the present study, the Ca/S ratio ranged from 0.07 to 0.3—less than that suggested by Blais, but still capable modifying a considerable percentage of pure MnS inclusions into a solid solution of (Ca,Mn)S.

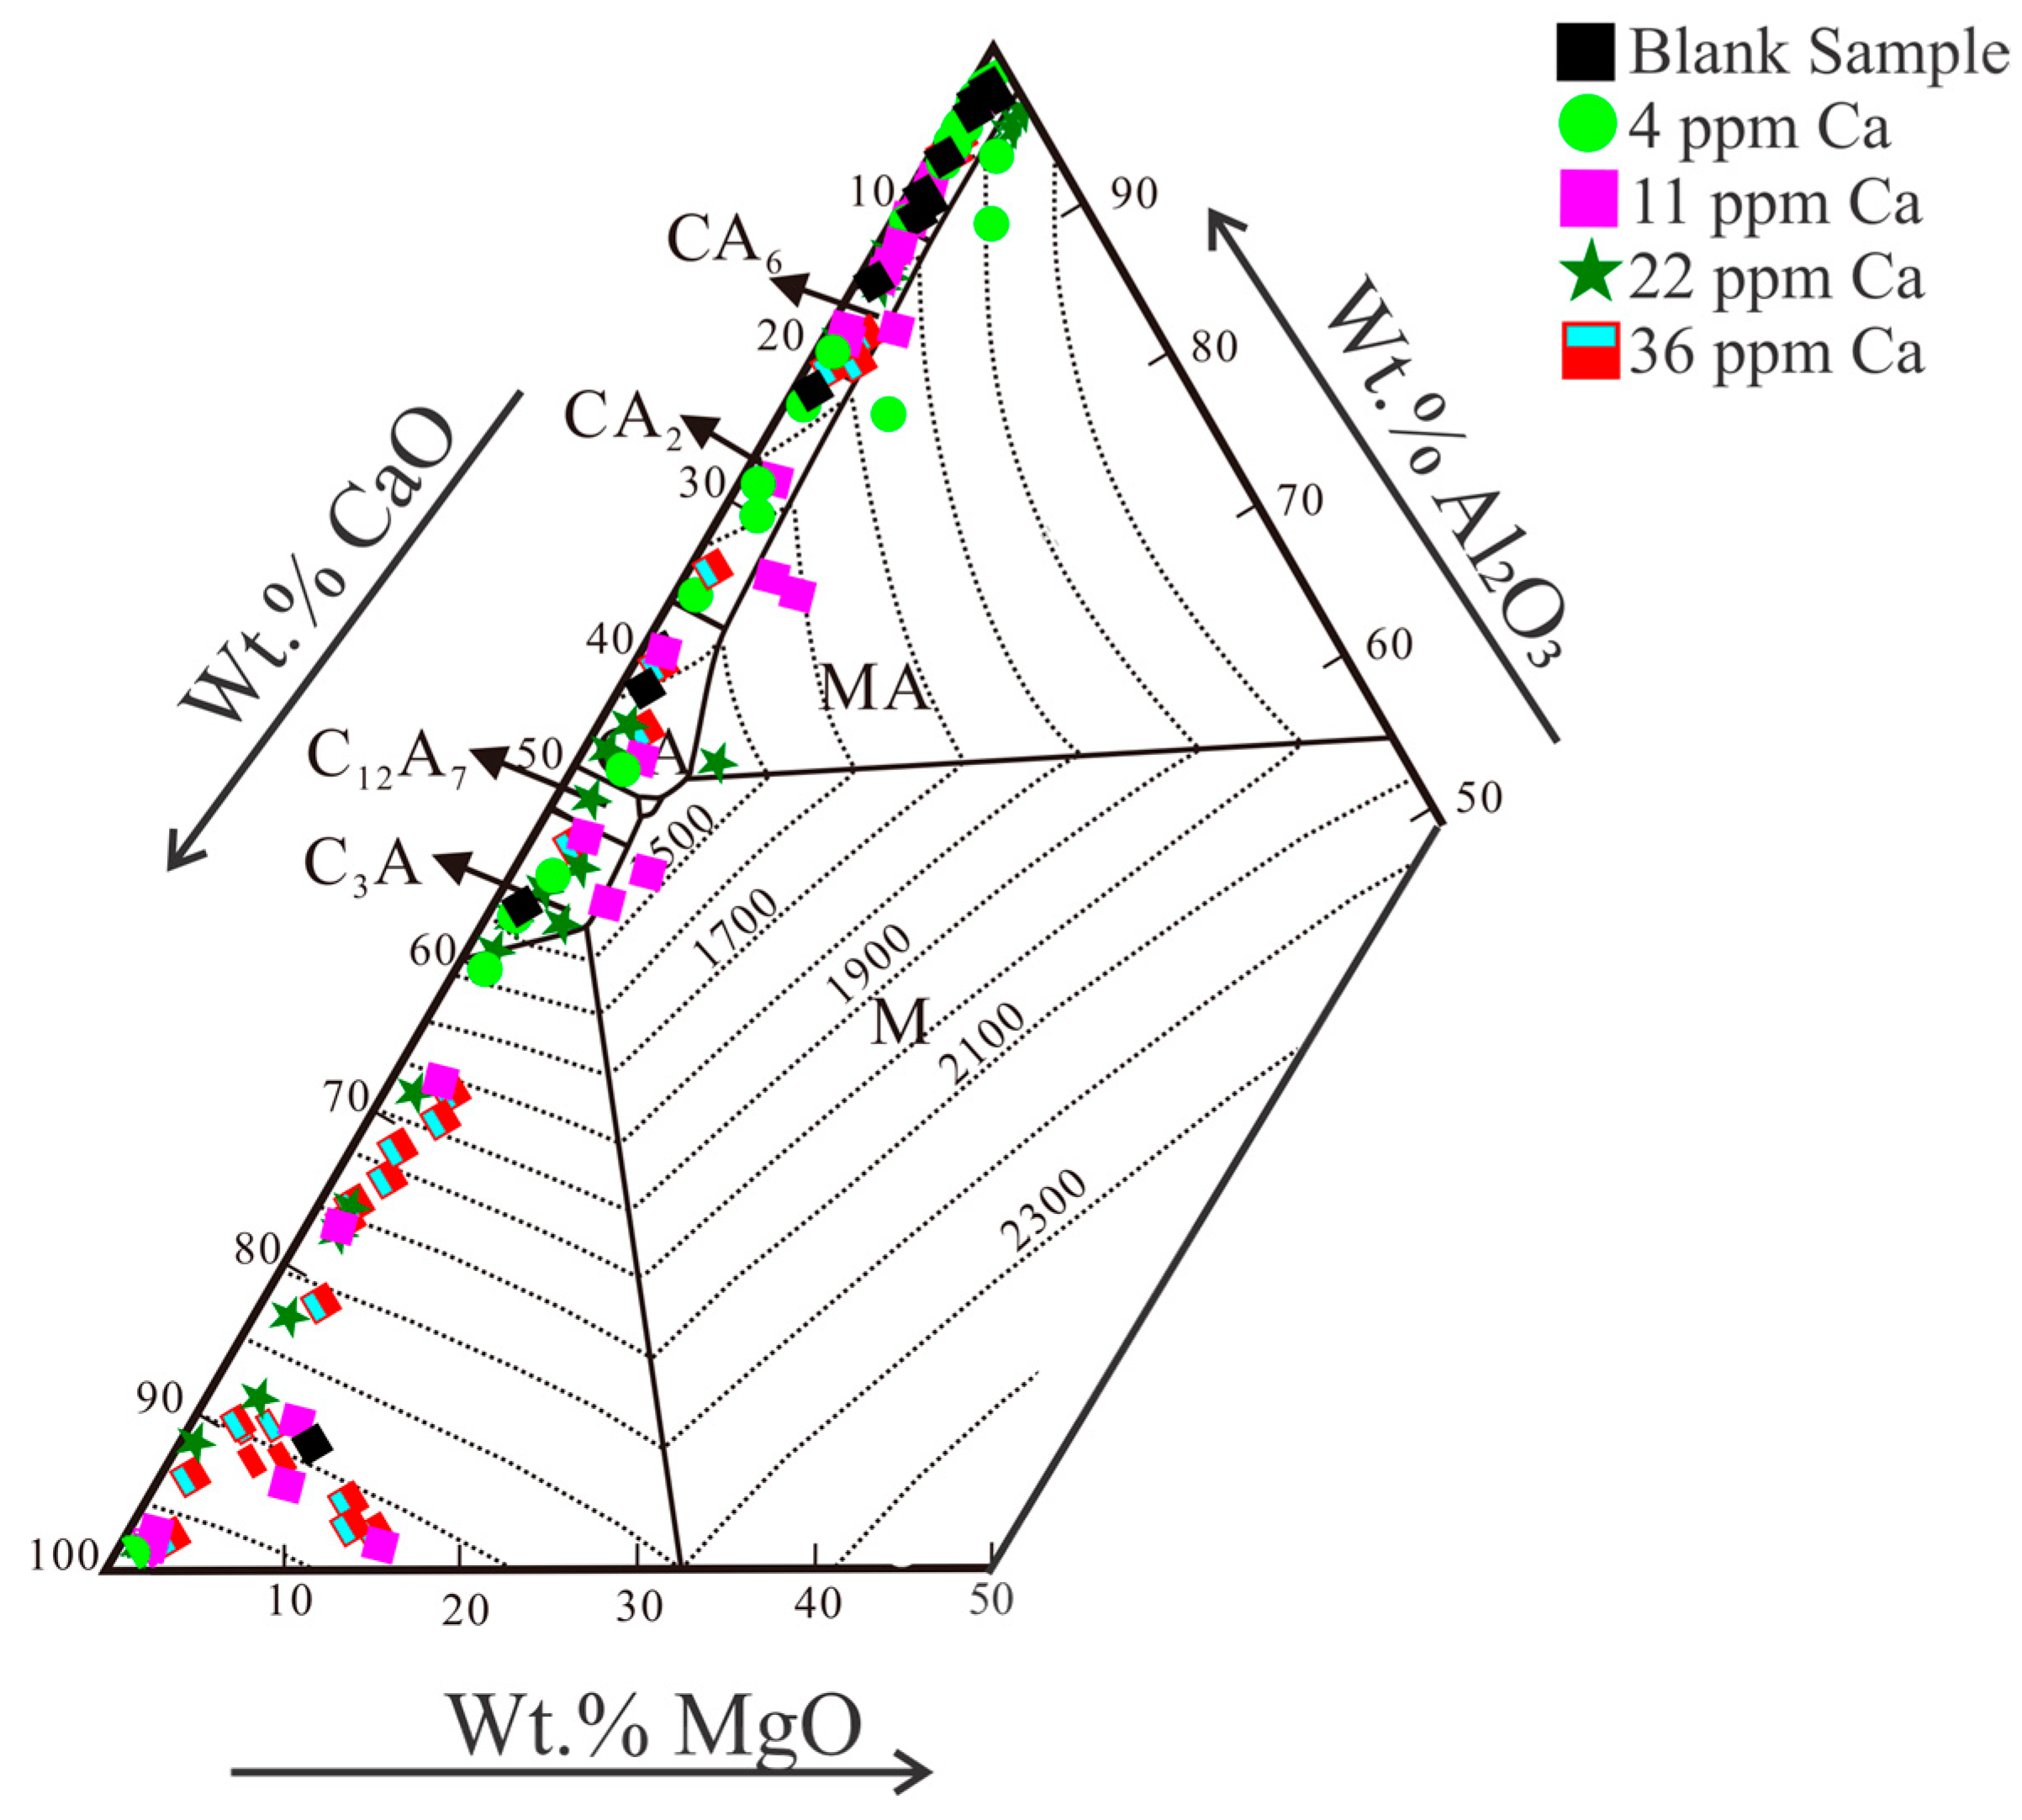
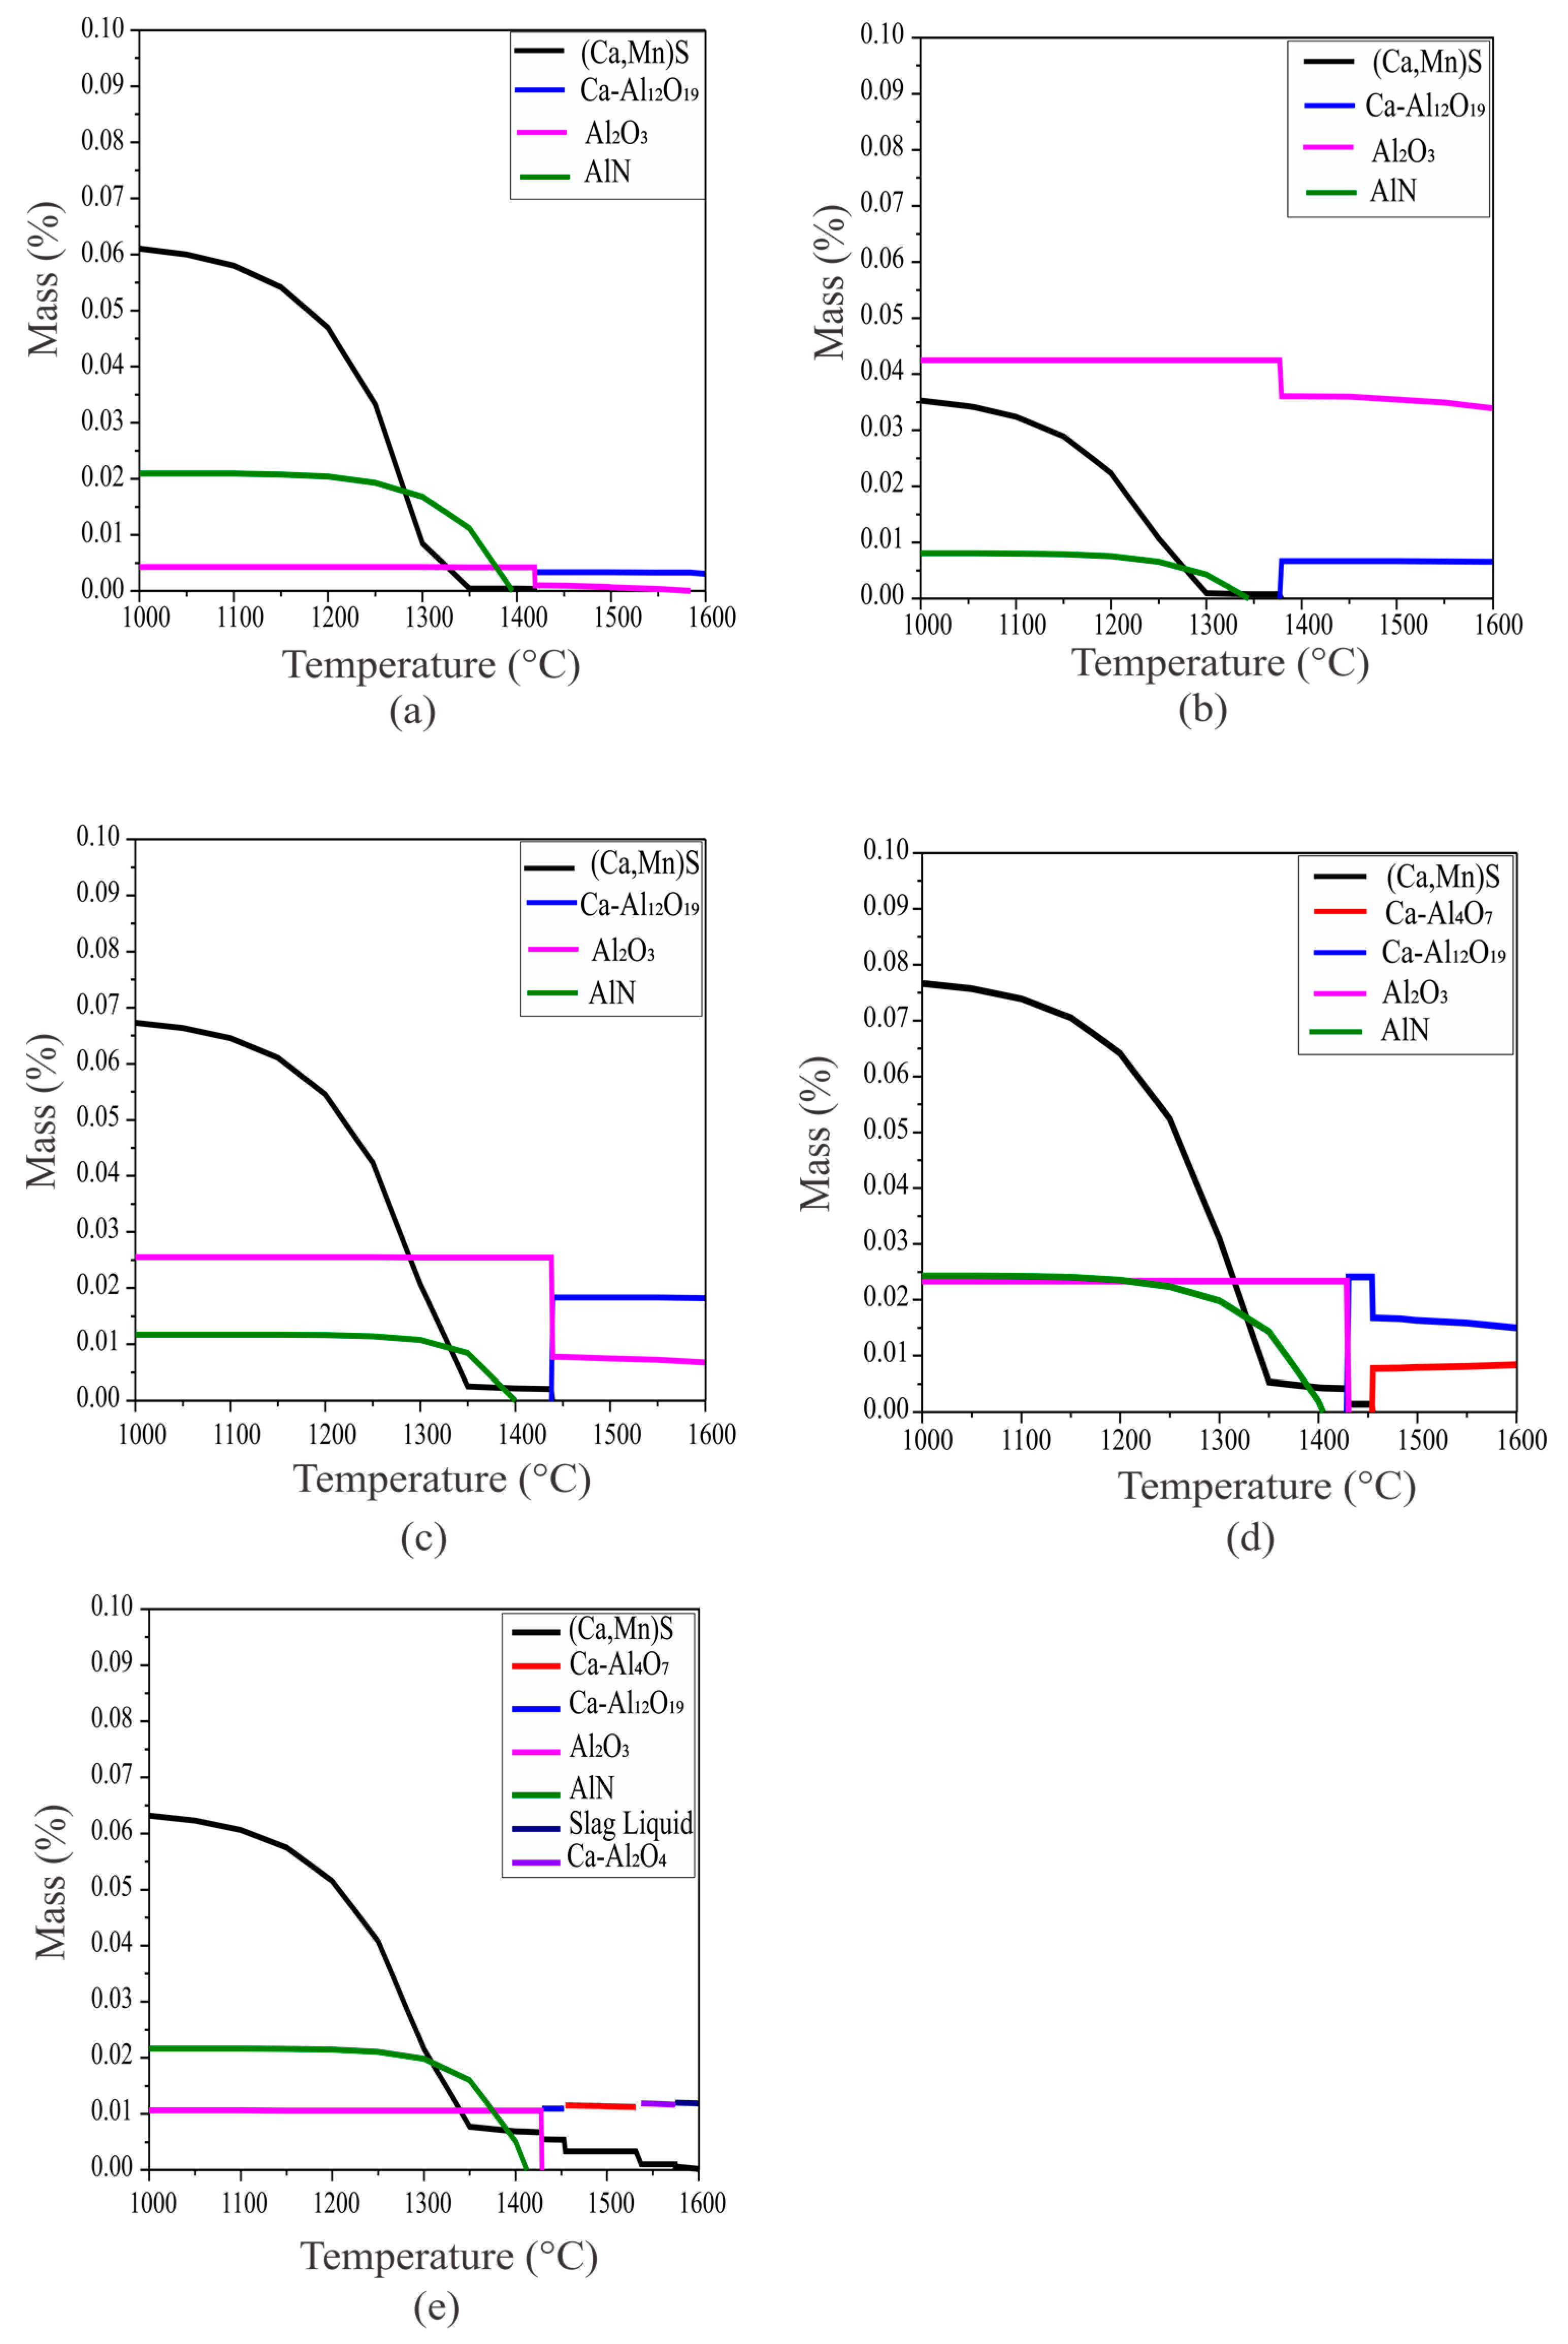
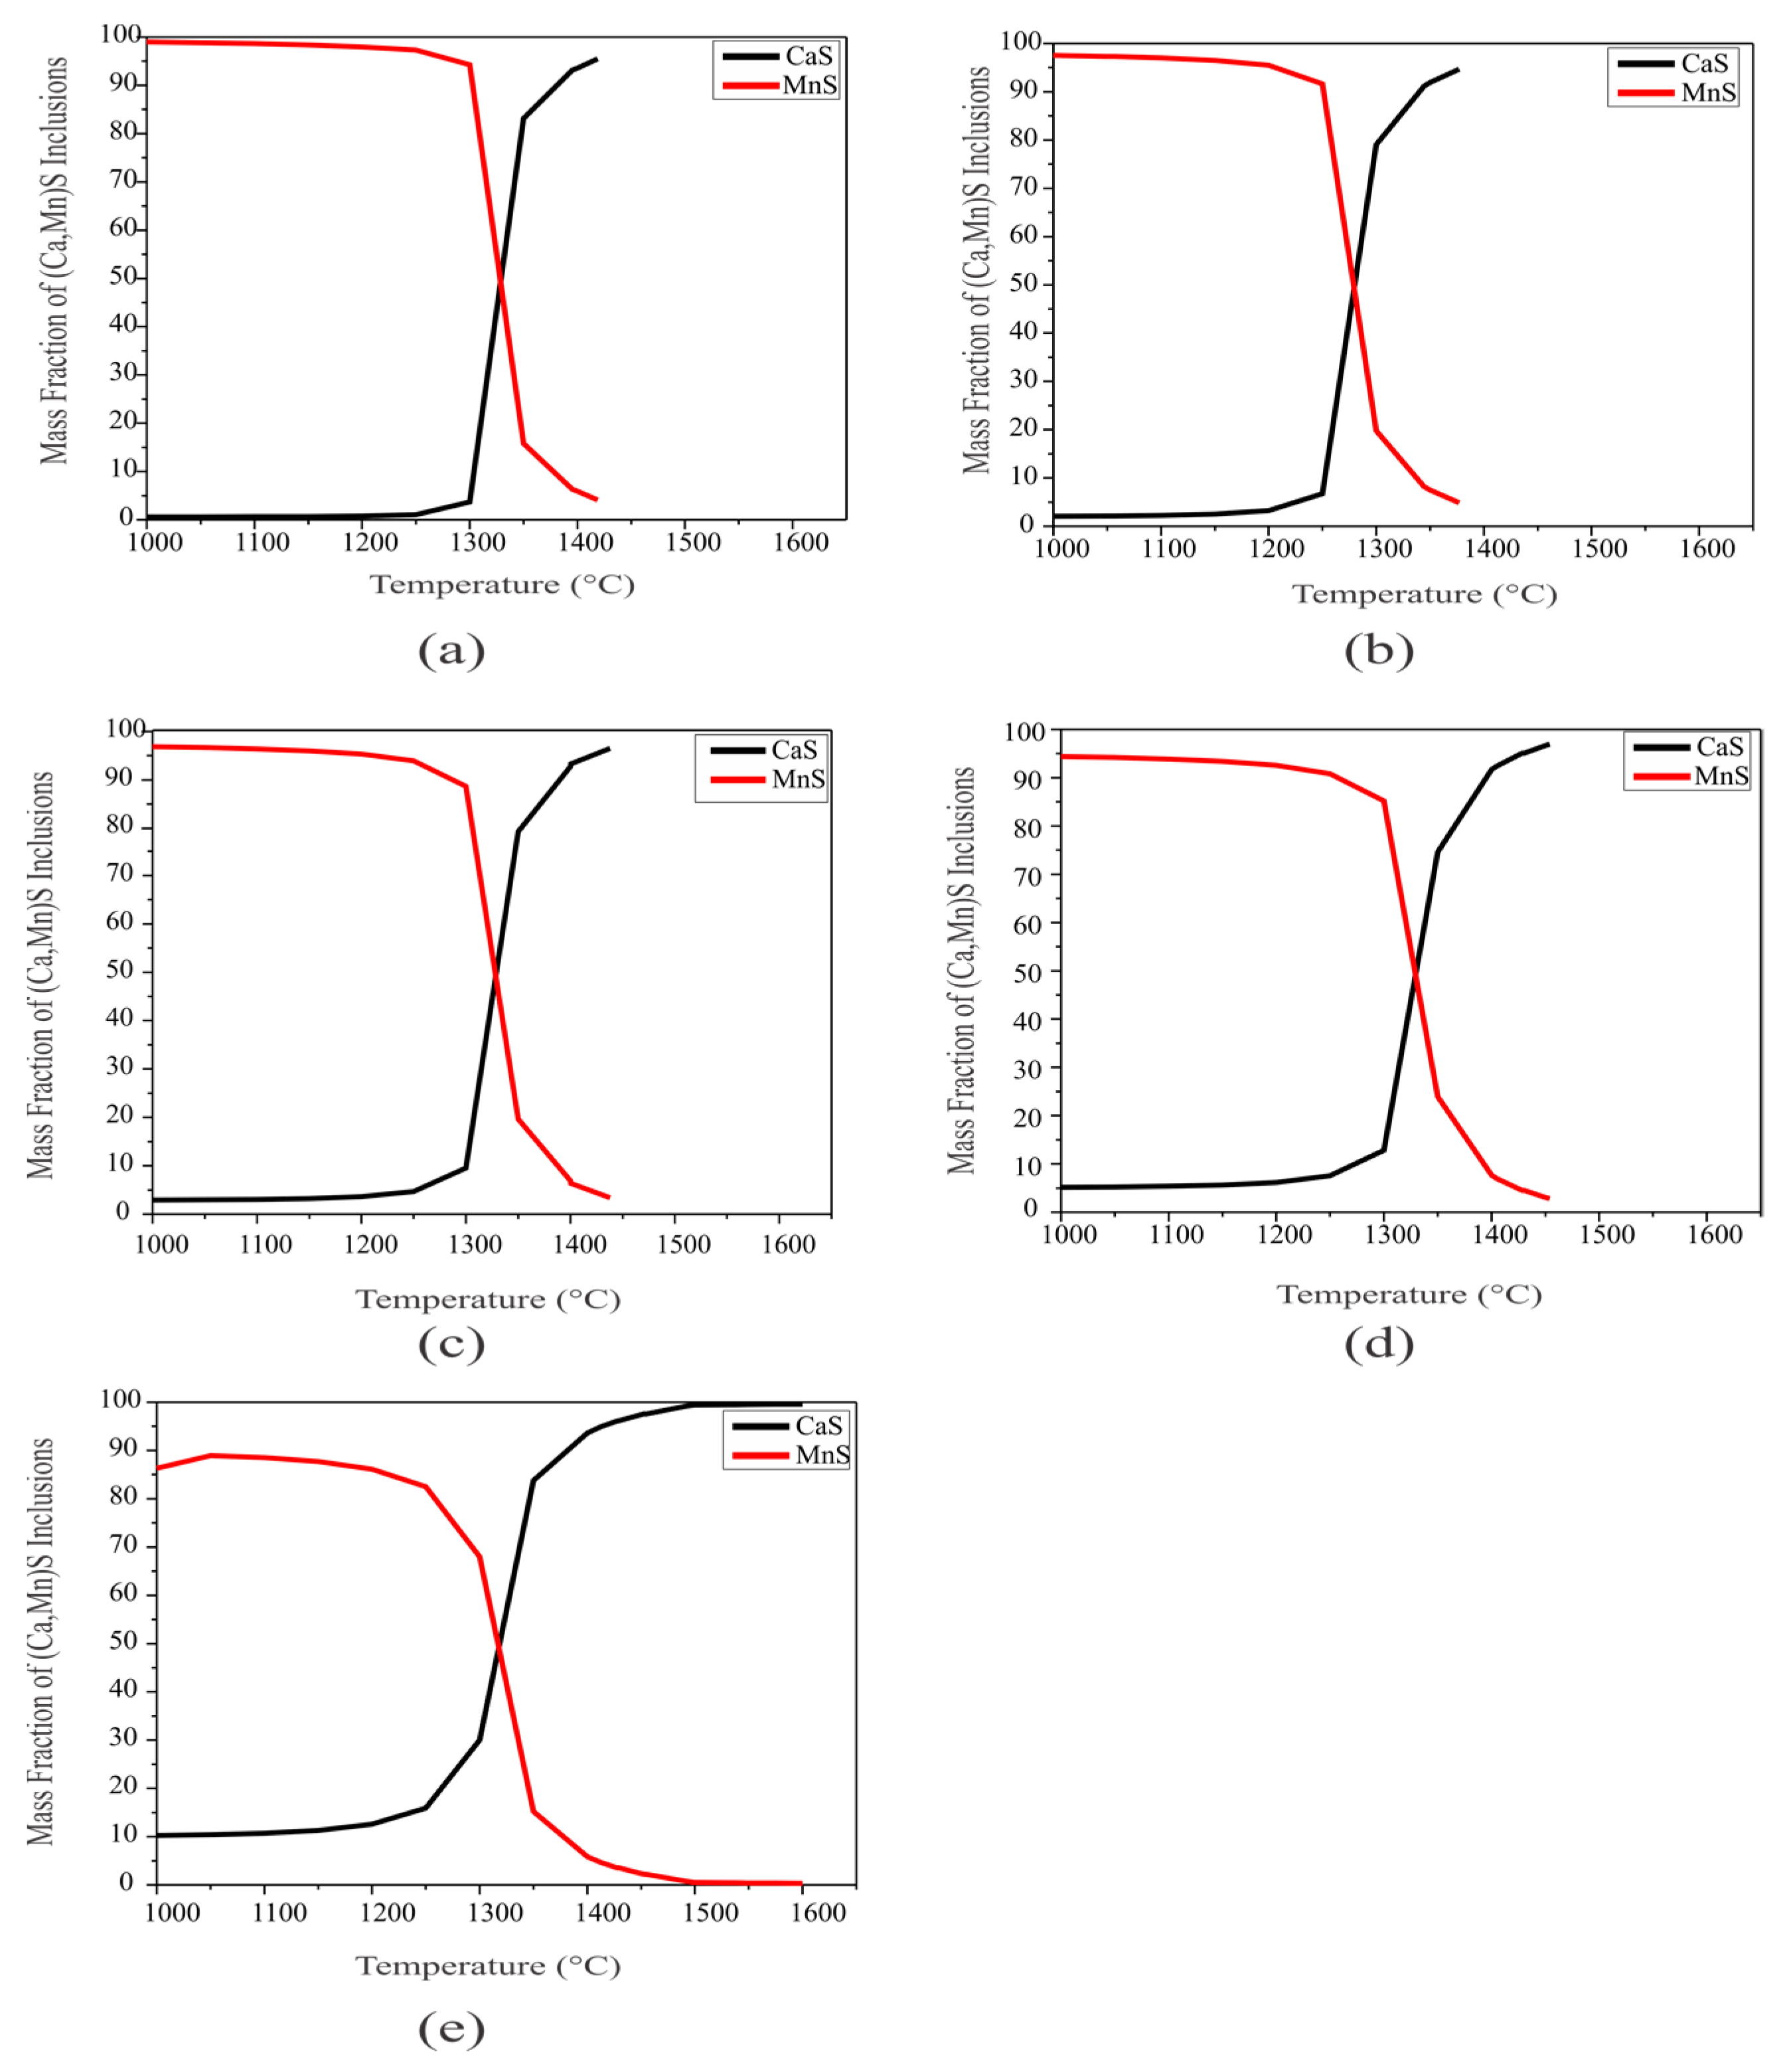
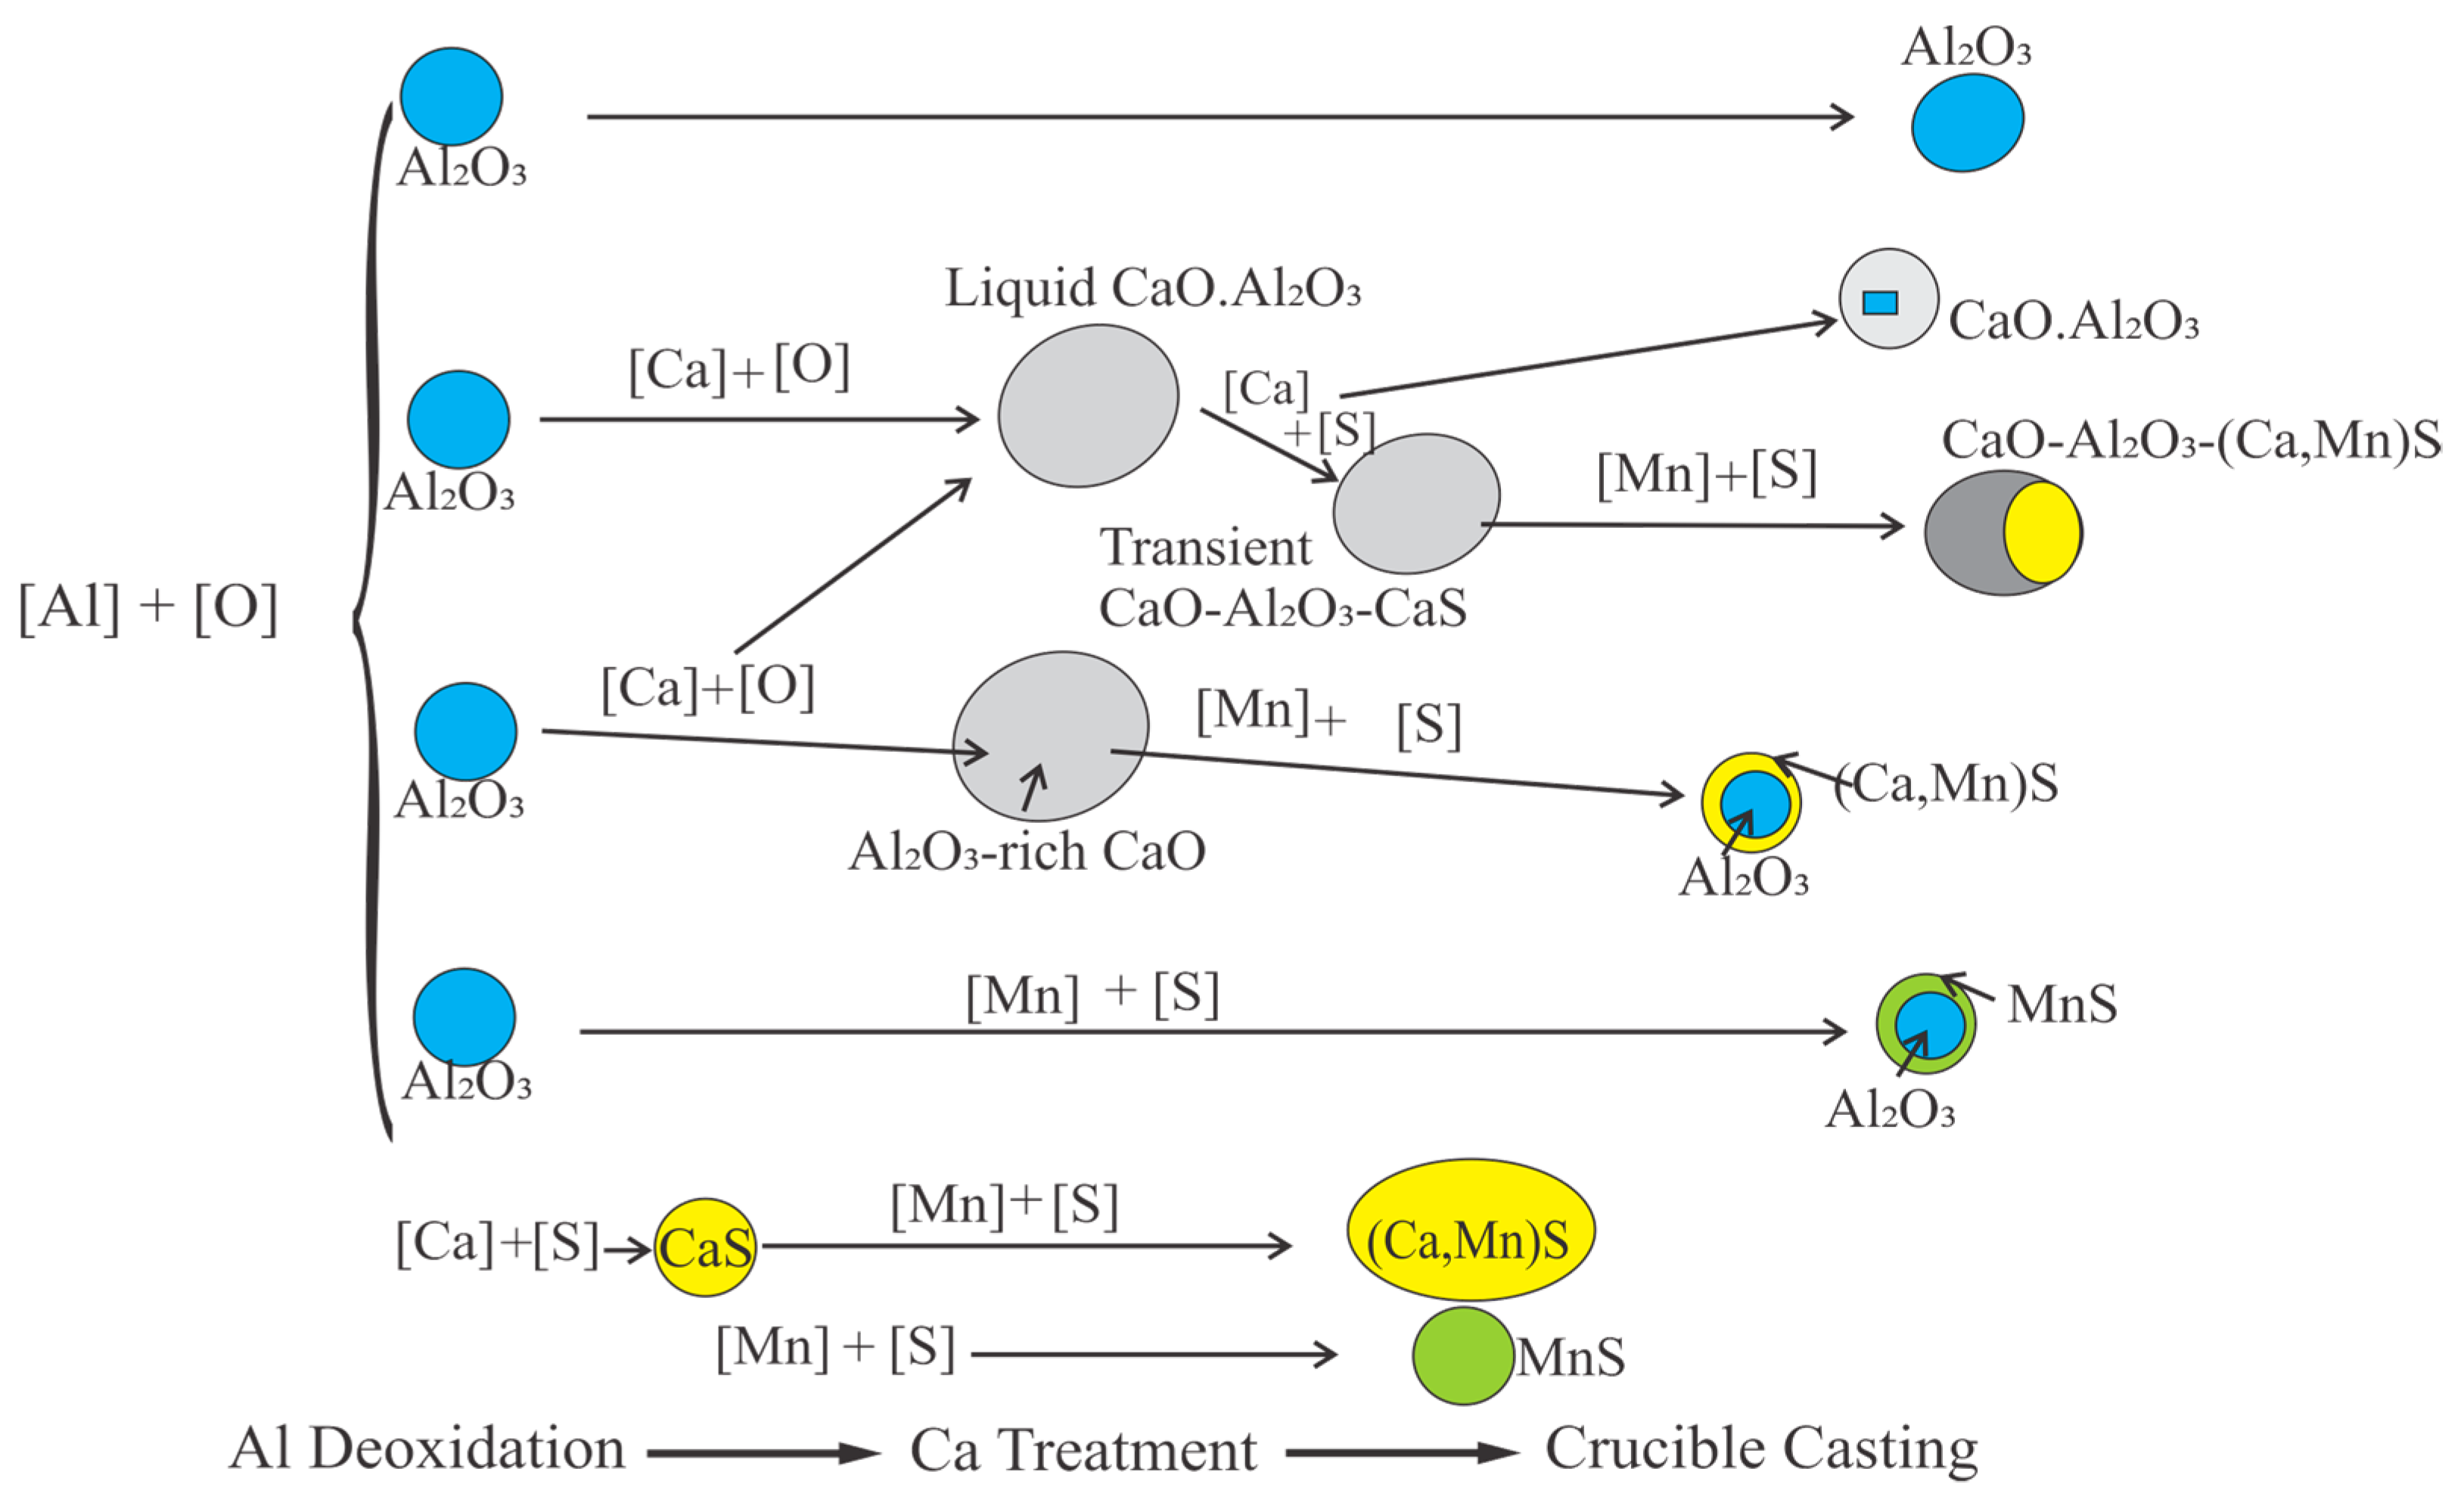
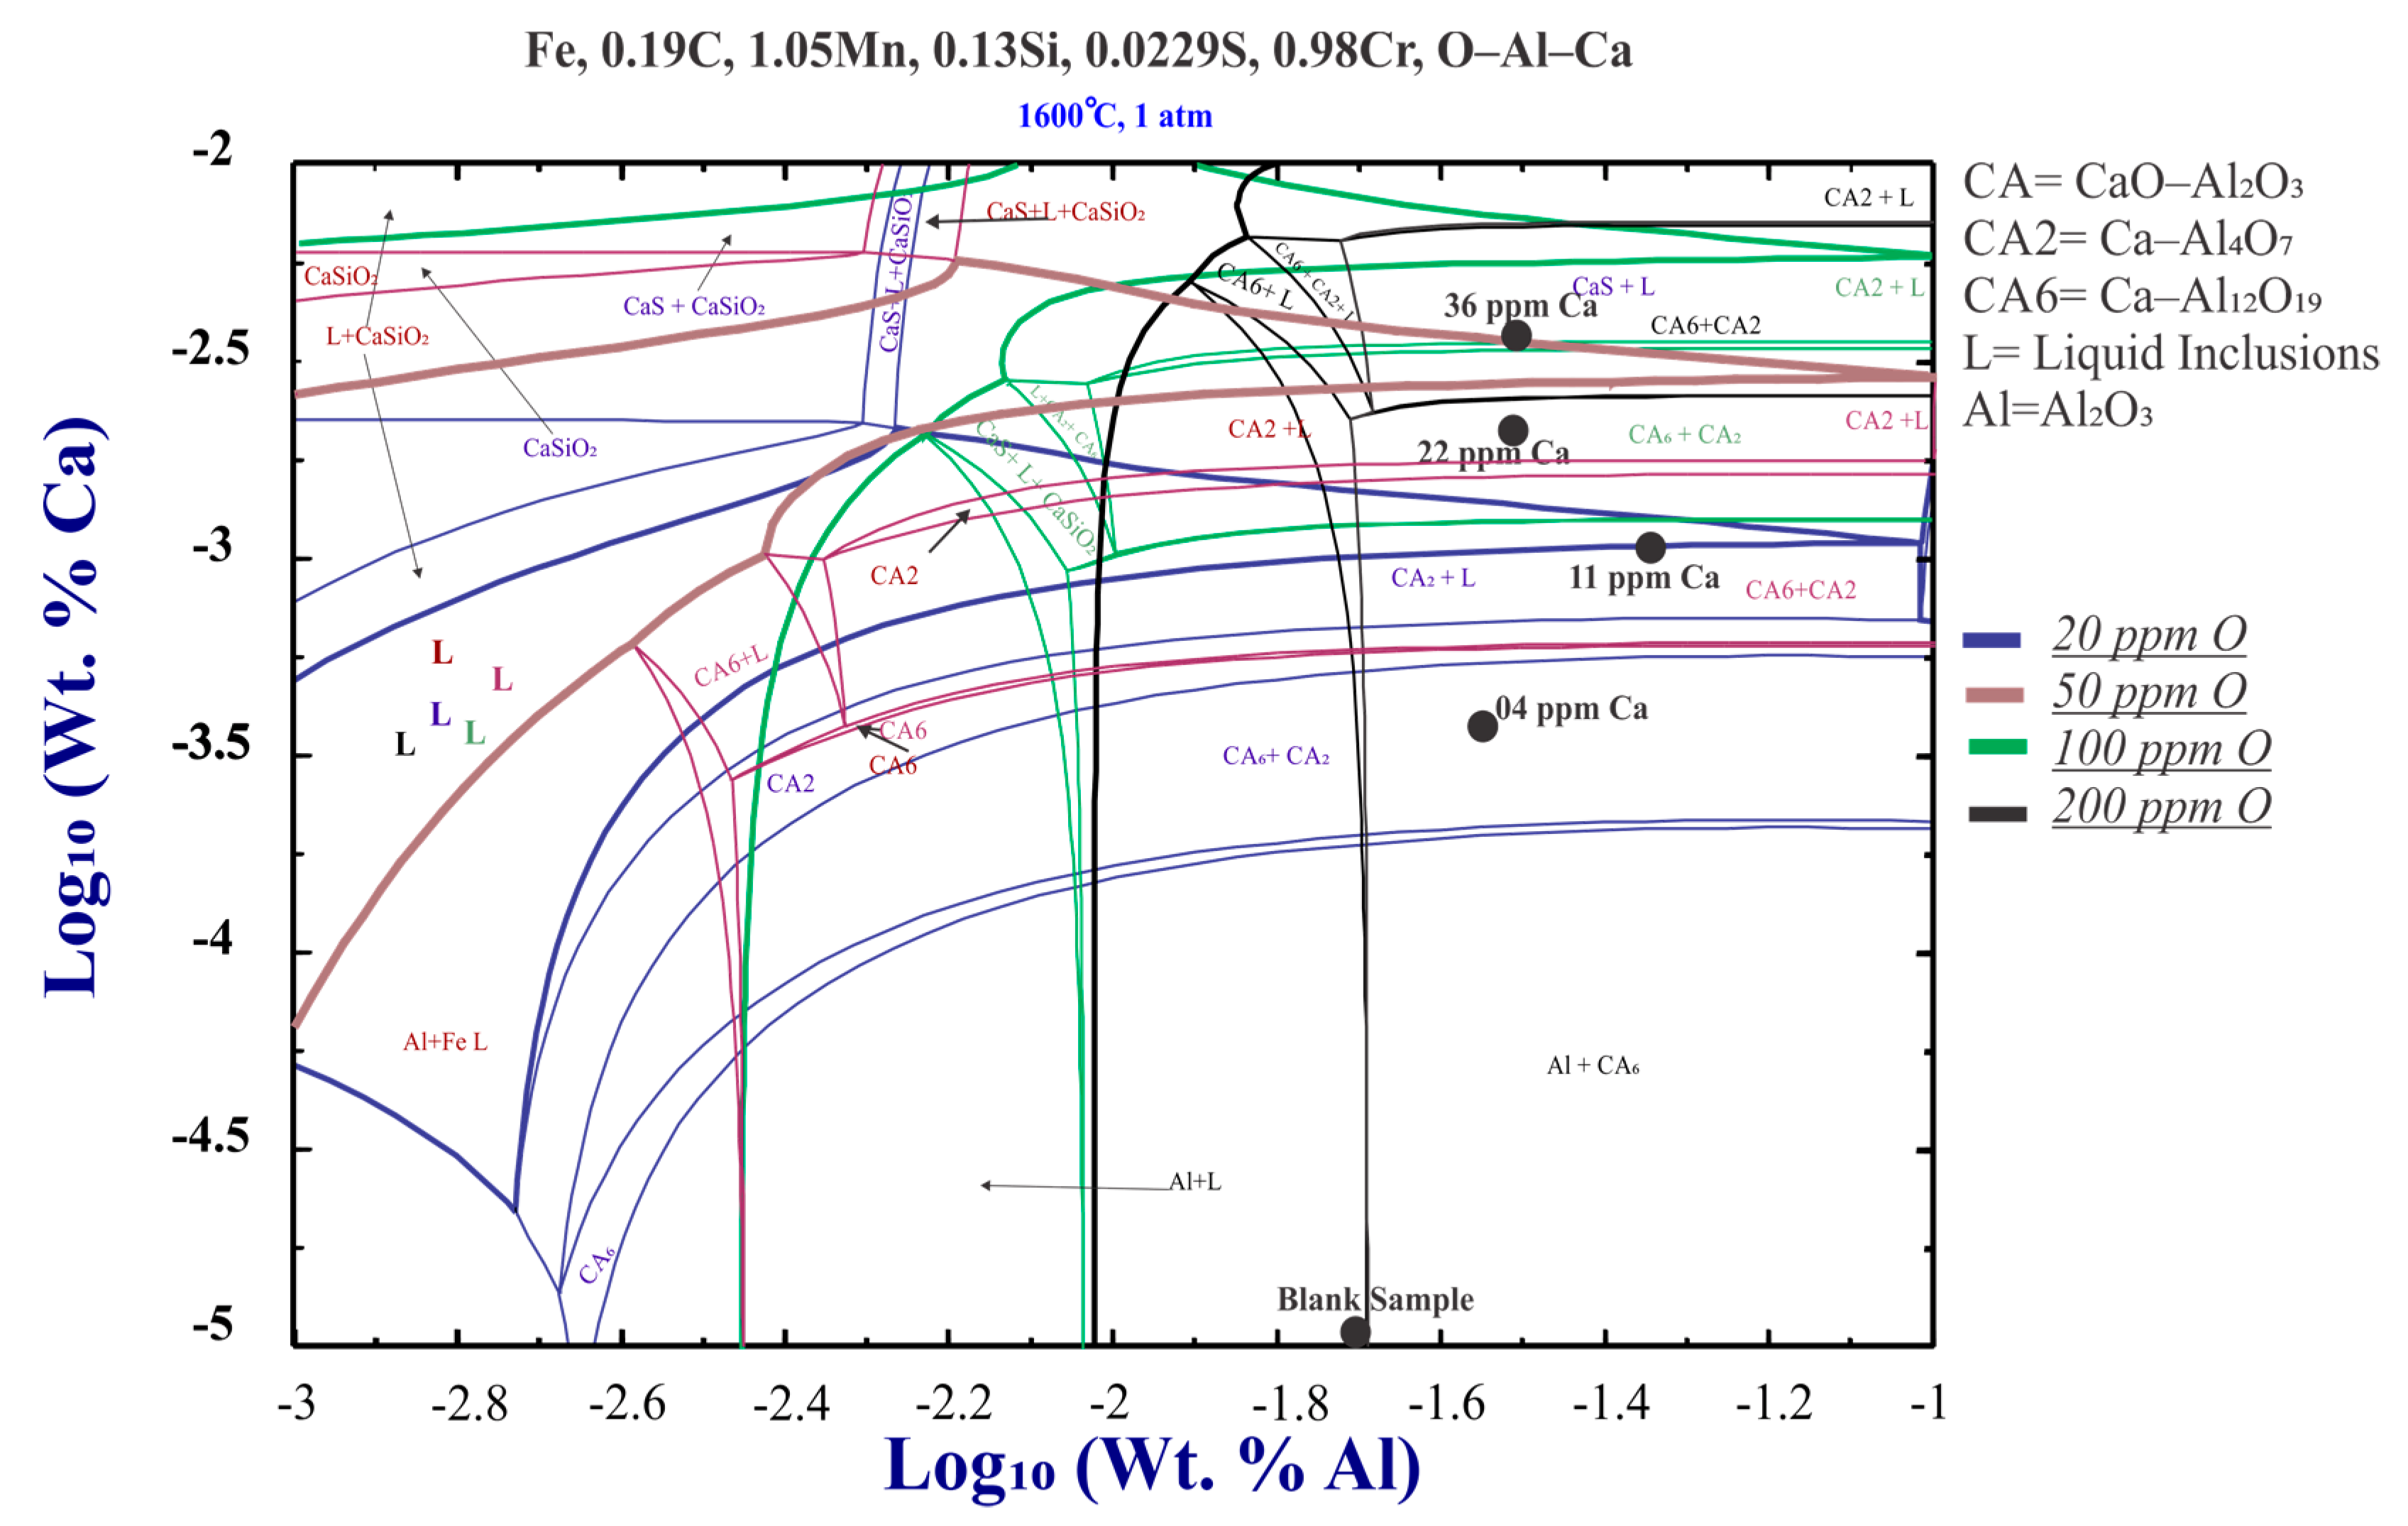
3.3. Thermodynamics of Inclusion Formation

The chemical compositions of the inclusions, measured through EPMA-WDS analysis of Al2O3, CaO and Al2O3–CaO, are projected onto the Al2O3–MgO–CaO ternary system as shown in Figure 12. The liquidus temperature of the inclusions can be predicted from the figure. The liquidus temperature of the Al2O3, Al2O3-rich CaO and CaO-rich Al2O3 inclusions was much higher than 1600 °C—which is normally the molten steel refining temperature—while some Al2O3–CaO inclusions in the sample containing 22 and 36 ppm Ca contents were below 1600 °C. As has been discussed before, when Al was added into molten steel as a deoxidizer, Al2O3 inclusions were initially formed; Ca addition was unable to completely transform the solid alumina inclusions into liquid ones, and some percentage of solid alumina inclusions remained in the steel.
To understand the thermodynamics of the inclusion formation/precipitation and the evolution of the equilibrium cooling of the steel samples from 1600 °C to 1000 °C, FactSage v7.3 commercial software was employed as shown in Figure 13a–e; based on the chemical compositions given in Table 1, no assumptions were taken, and the pressure used was 1 atm. The modification extent of Al2O3 by Ca mainly depends on the ratio of CaO/Al2O3 to form liquid calcium aluminates, as well as the levels of dissolved Ca, Al and O in the steel. According to Faulring et al., the ratio of added calcium to aluminum (Ca/Al ratio) should be greater than about 0.14, and preferably 0.22. By adding Ca or Ca-bearing material before casting is one way to establish a calcium concentration that exceeds the aluminum content by a value greater than about 0.14, and preferably 0.22 [26]. According to the FactSage calculations shown in Figure 13, decreases in the CaO concentration in the inclusions resulted in the transformation of liquid calcium aluminate (CaO–Al2O3) inclusions to Al2O3 inclusions below 1400 °C. The liquid calcium aluminate inclusions transformed to the CaAl2O4 (CA) phase at around 1600 °C. As the blank sample had no Ca, it showed the formation of pure Al2O3 at 1600 °C. Increases in Ca content in the steel caused the formation of liquid inclusions with 36 ppm Ca addition. The amount of CaAl4O7 (CA2) and CA6 inclusions began to decrease with increases in Ca content as the amount of CaO formation in the steel increased with increases in Ca. The thermodynamic calculations regarding the transformation of solid alumina inclusions into liquid calcium aluminates does not seem to agree in the case of 22 ppm Ca addition; as can be seen in Figure 13d, there was no liquid calcium aluminate inclusion formation, but the experiments and ternary diagram of CaO–Al2O3–MgO showed the formation of some liquid inclusions. The thermodynamics studies using FactSage were carried out using ideal conditions—i.e., 1 atm pressure with no other assumptions—but in real time experiments, the conditions change, as many factors influence inclusion formation such as cooling rate furnace conditions, etc.
As explained in the earlier section, the amount of CaS in (Ca,Mn)S cannot be considered constant due to the dissolution of MnS into CaS. This section explained the degree of CaS variation during (Ca,Mn)S formation. The variation of CaS and MnS percentages in the (Ca,Mn)S solid solution in equilibrium solidification in all the samples is shown in Figure 14. It is well known that the formation of solid CaS is usually caused by excessive sulfur and calcium in liquid steel; additionally, both Ca and S have high activities at this temperature range. The blank sample also showed the precipitation temperature of CaS and MnS; it can be seen from the figure that with increases in the Ca content in the steel, the precipitation temperature of the CaS began to increase from 1420 °C to 1600 °C, and the percentage of precipitated CaS began to increase from almost no CaS to around 10% precipitates in the solidified steel. Additionally, by increasing the Ca content from 0 ppm to 36 ppm, the 50/50 mass balance CaS/MnS ratio (Ca,Mn)S precipitation temperature almost remained the same—i.e., 1330 °C—other than in the sample containing 4 ppm Ca, where the 50/50 balance temperature dropped to around 1270 °C. According to the FactSage calculations, CaS should precipitate and be retained in the steel, but in the actual case, there were no pure CaS inclusions observed during WDS or EDS scanning.
The experimental results and thermodynamic calculations apparently do not seem to agree in this case, but there is a possibility of CaO–Al2O3–CaS transient inclusion formation during cooling, with CaO–Al2O3 as the core and CaS at the outer layer, acting as the nucleation site for segregated Mn and S to precipitate at the CaS outer layer and form either CaO–Al2O3–(Ca,Mn)S or Al2O3–(Ca,Mn)S. The formation of later inclusions may be due to Al2O3-rich CaO inclusions with a CaS layer, which may help Mn and S to precipitate and form Al2O3–(Ca,Mn)S. A schematic diagram of possible inclusion formations from Al deoxidation followed by Ca treatment is shown in Figure 15 below.
Figure 16 below shows the inclusion stability diagram, made with the help of FactSage v.3 software by fixing the oxygen content with 20, 50, 100 and 200 ppms—all the calculated figures were merged into one. The Ca and Al percentages of each sample were drawn on the figure, which showed exactly which inclusions were stable at 1600 °C. Merging all the figures onto one figure gave different perspectives on the Ca, Al and O content in the steel. The different coloured lines in the figure shows the different amount of oxygen in the system, bold lines represent the liquid region (target region). Increases in oxygen content reduced and shifted the liquid window to the top right-hand side, which resulted in increases in the Ca content for the successful modification of the inclusions. During actual practice, too much Ca addition is dangerous, as it causes violent reactions and splashing. According to the inclusion stability diagram, an O content of less than 50 ppm is required for successful modification, while keeping the Ca content in the range of 15 to 25 ppm. In this way, the oxide and sulfide inclusions will be transformed, and no violent reaction will occur.

4. Conclusions

A laboratory study of the formation and characterization of sulfide inclusions in gear steel deoxidized with aluminum and subsequent calcium treatment was undertaken. Based on the results, the following conclusions were drawn:
  • The calcium treatment of aluminum-killed steel samples leads to the globularization and modification of a considerable amount of pure MnS inclusions into either oxy-sulfides or solid solutions of (Ca,Mn)S inclusions.
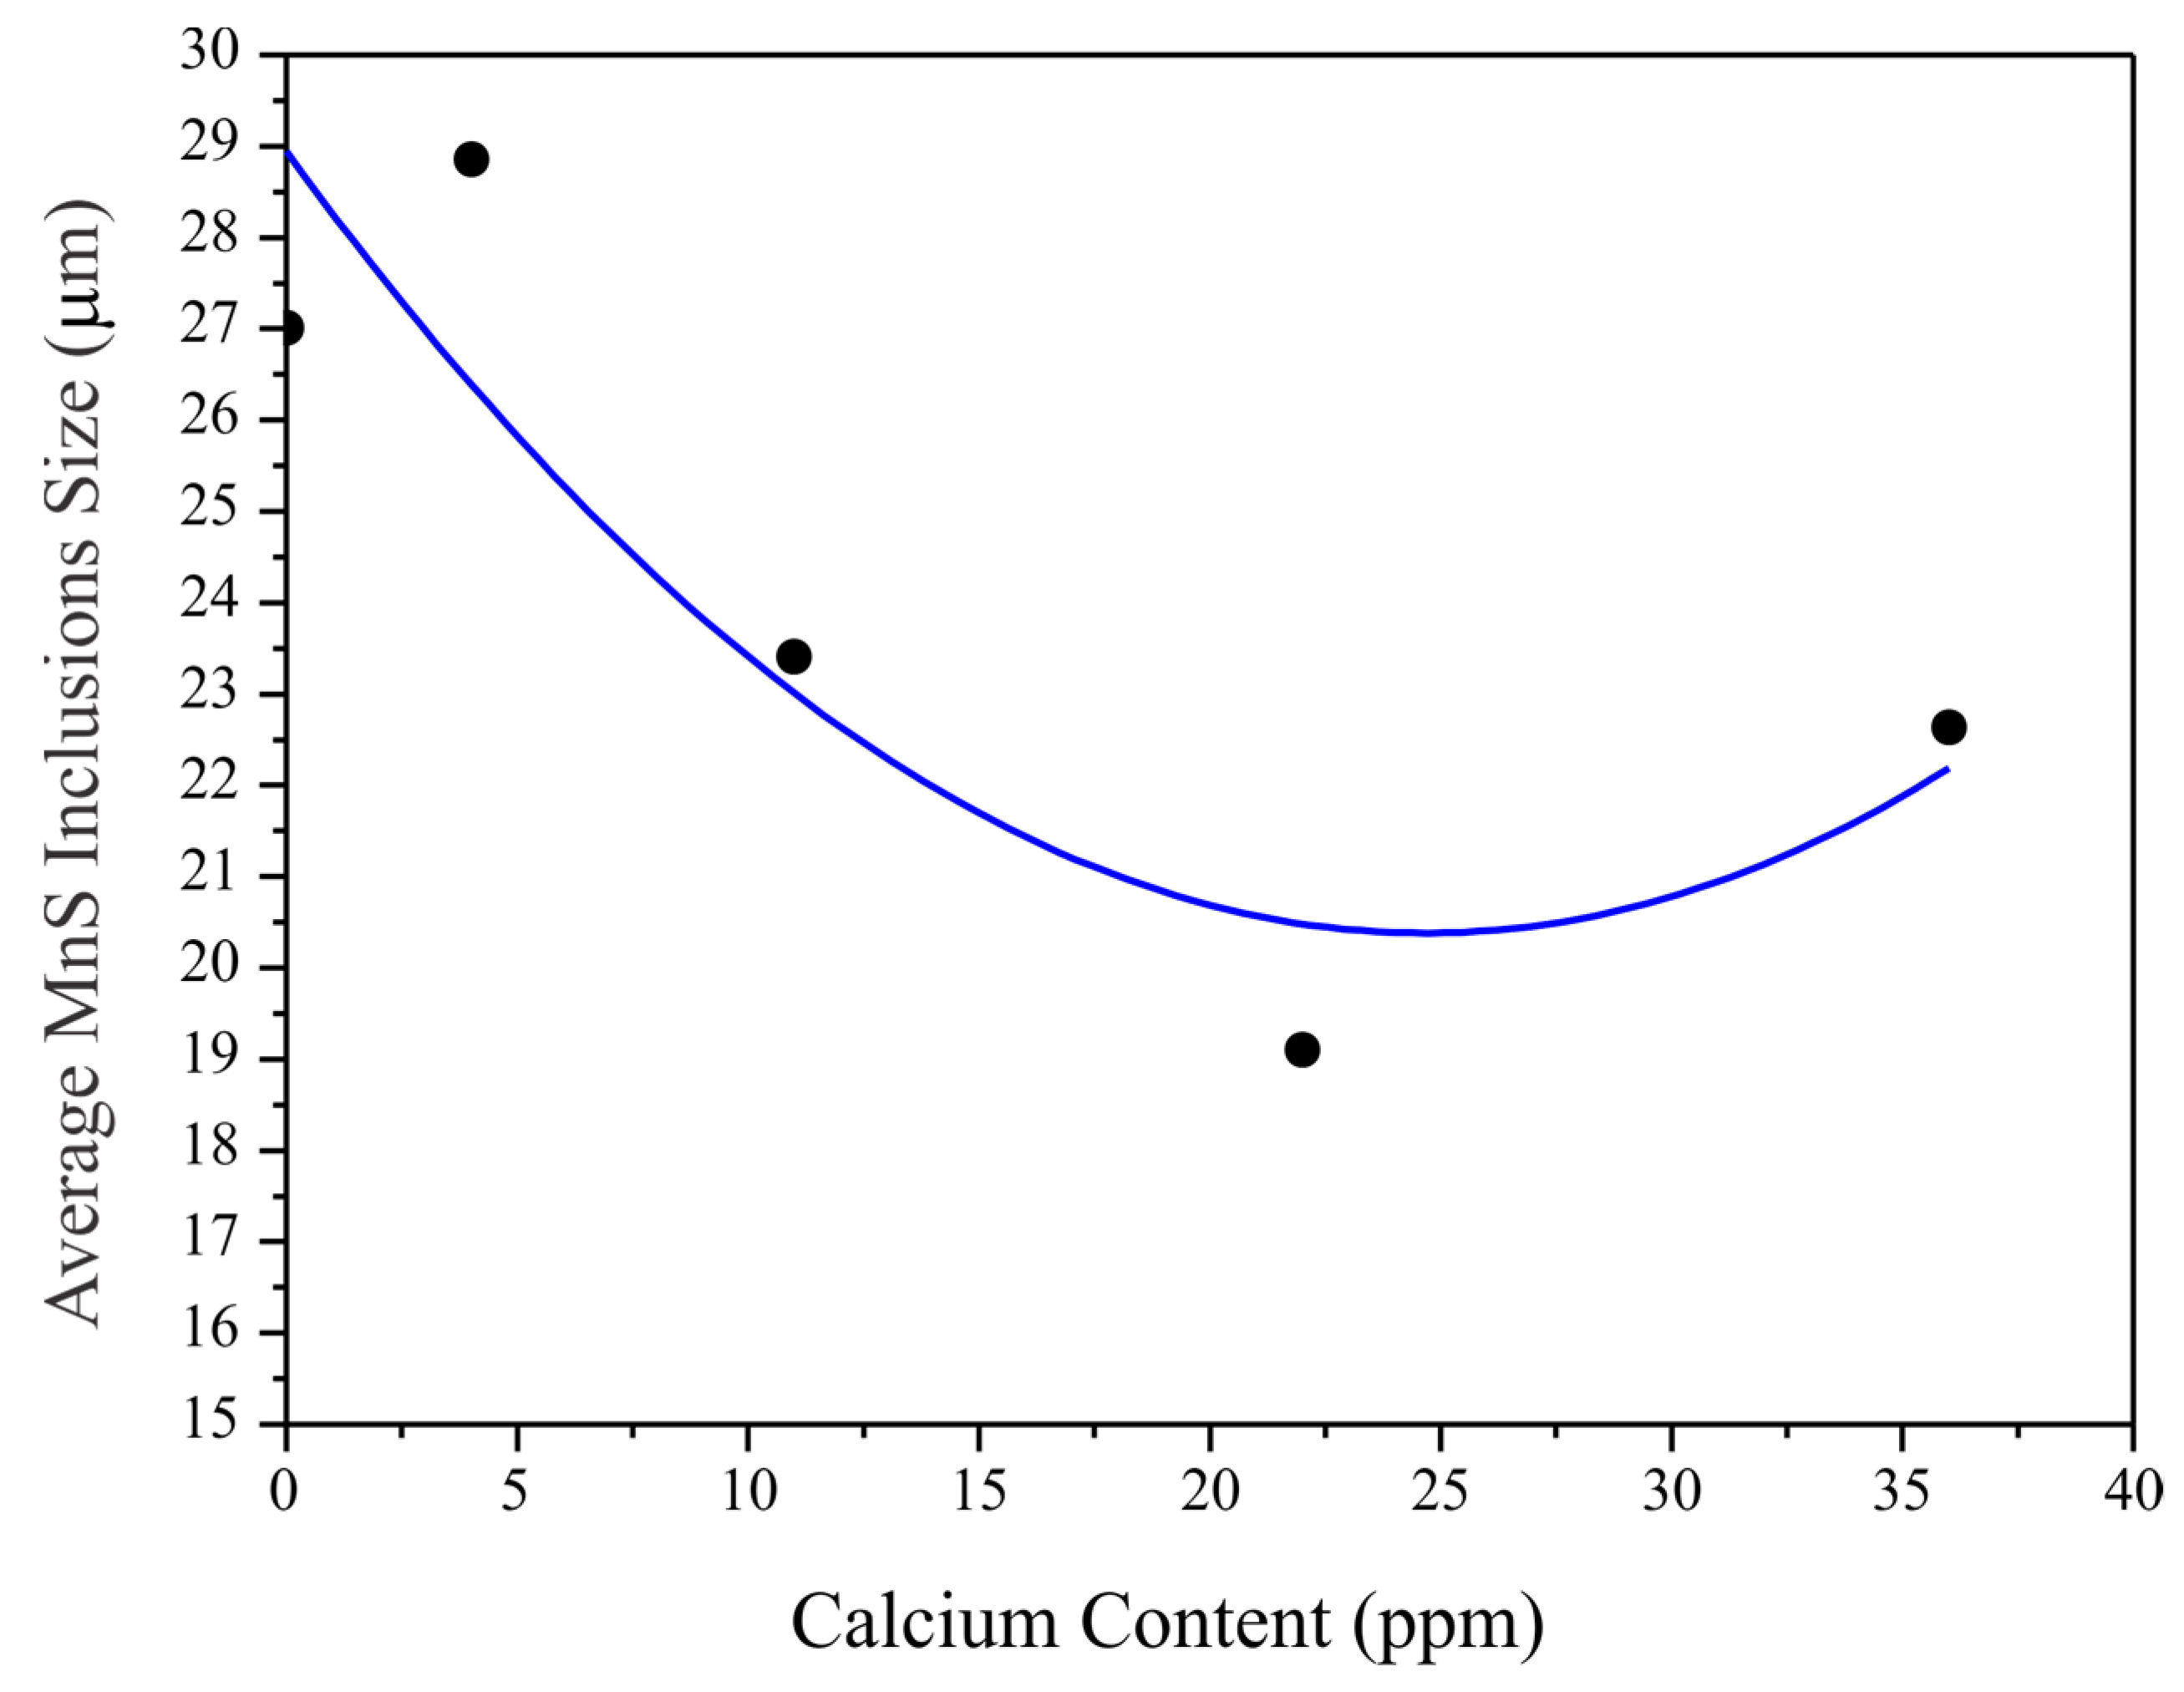
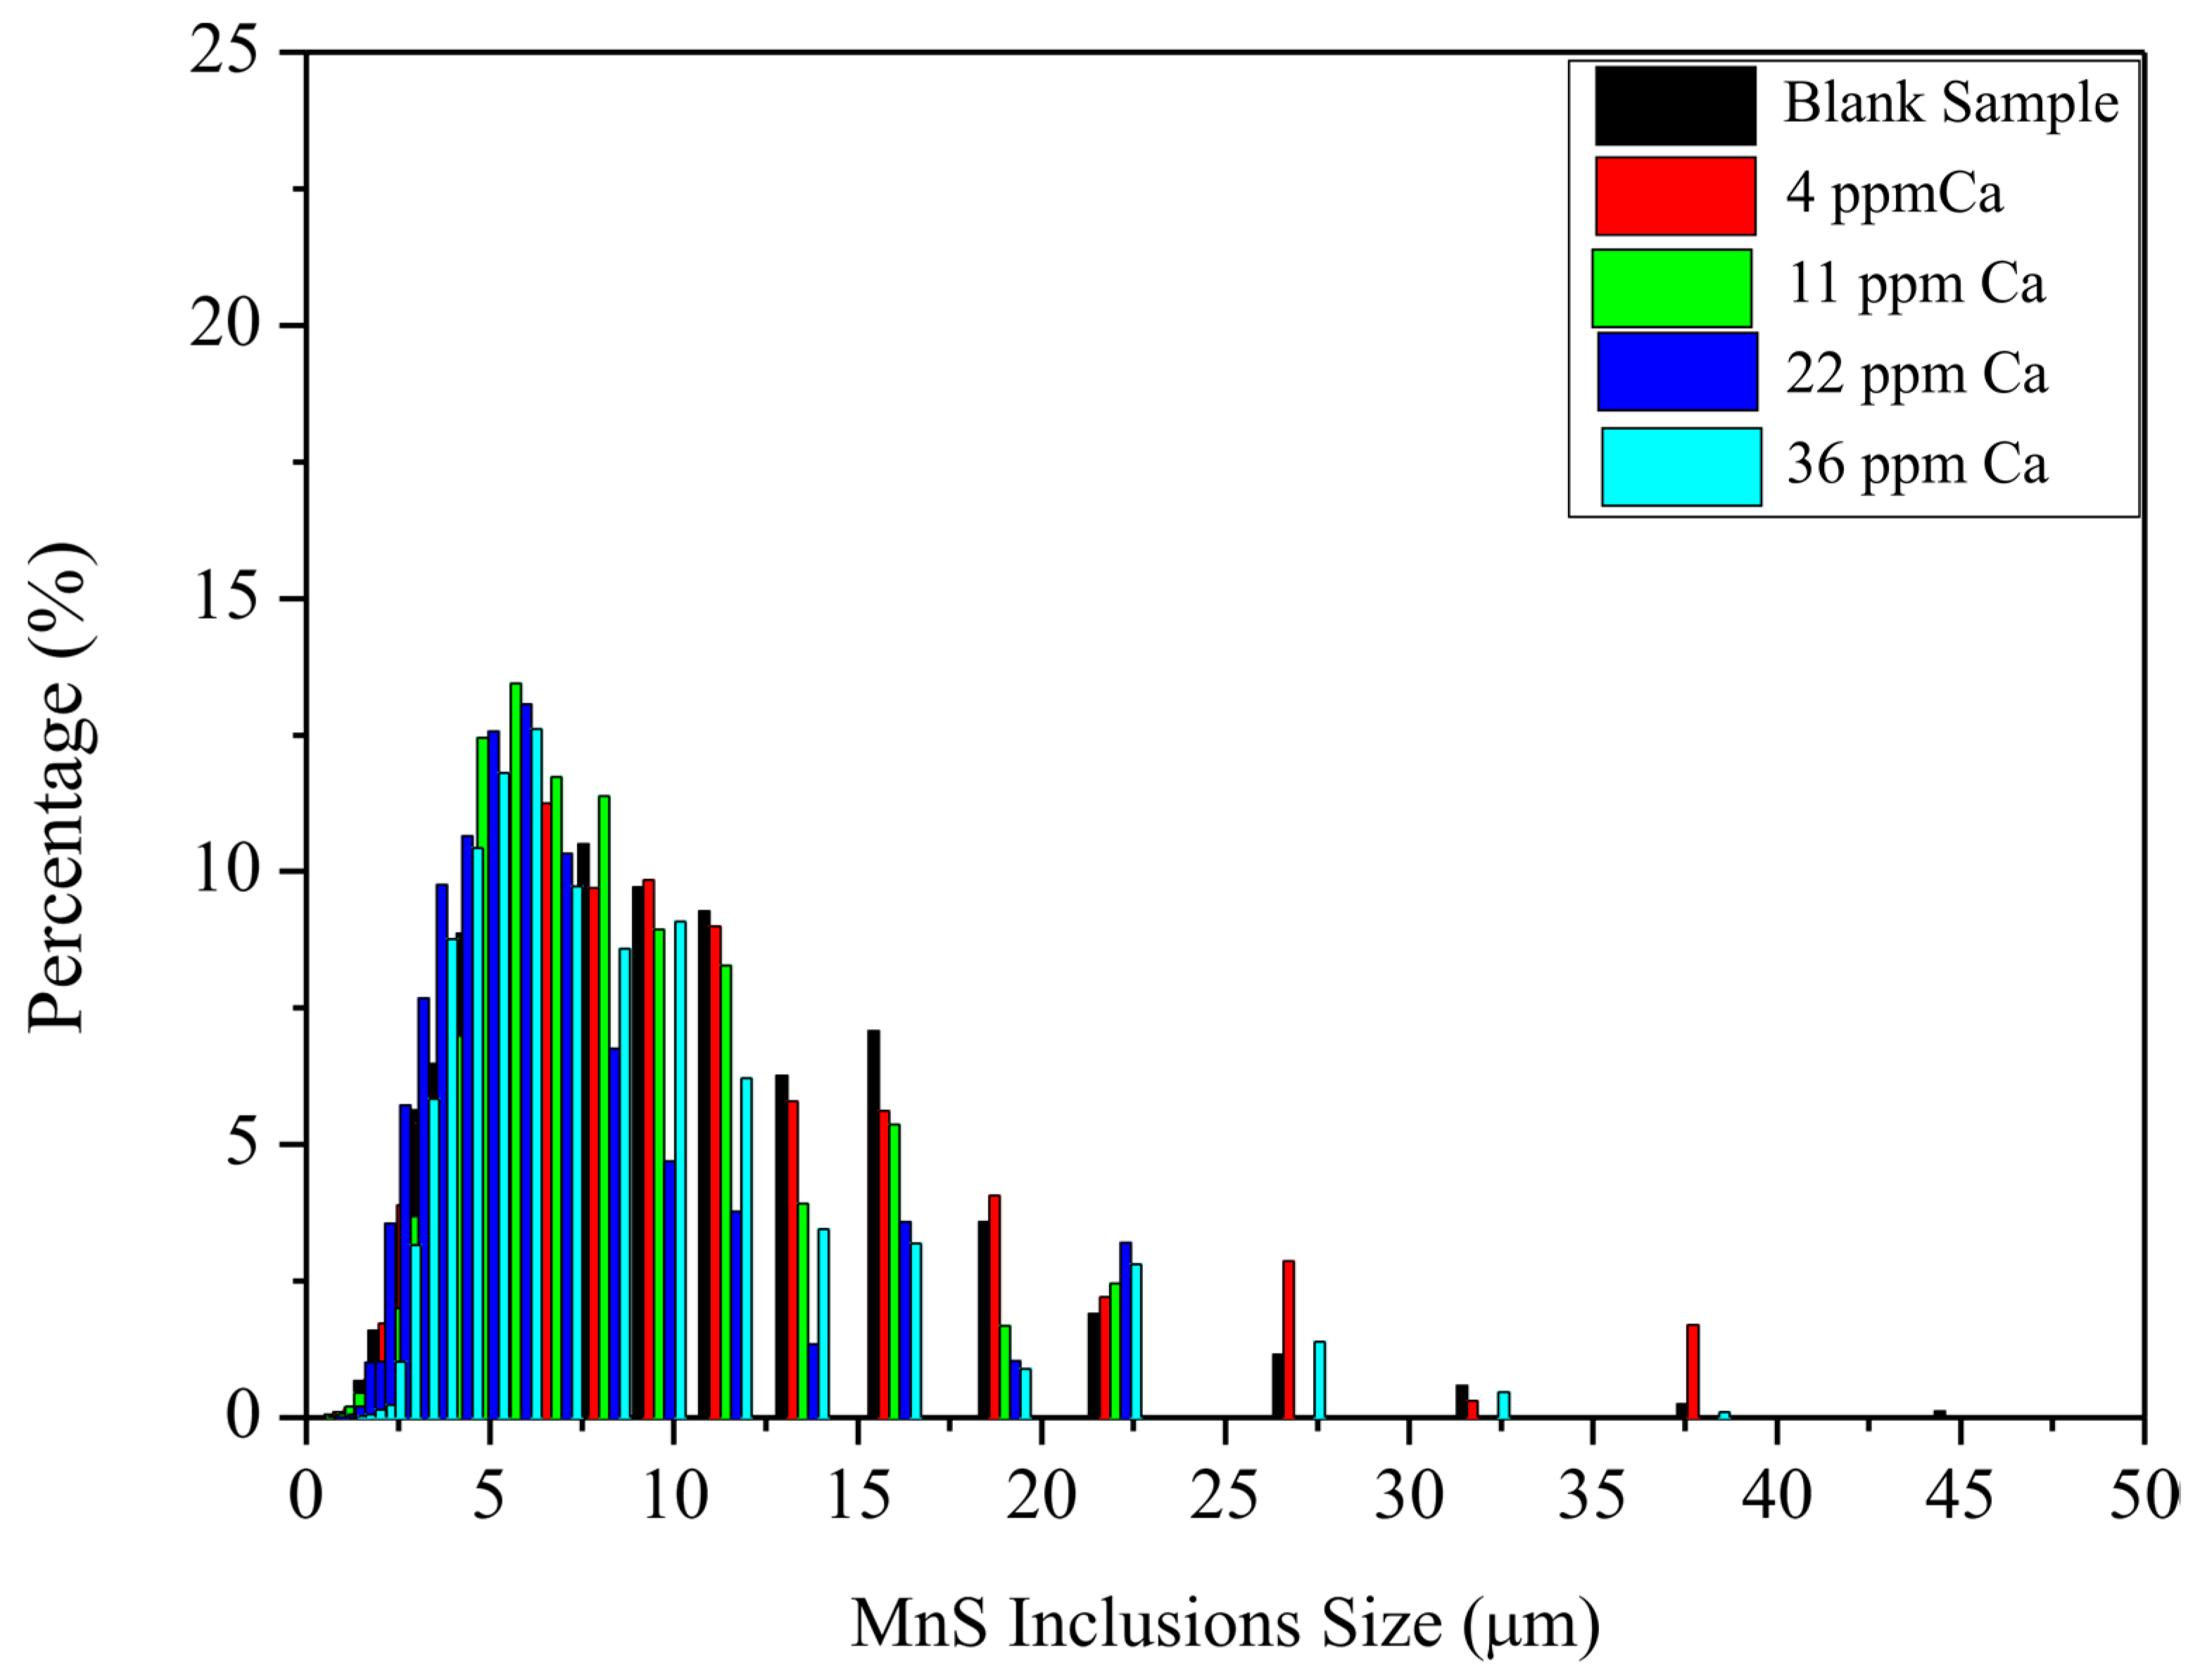
  • By using automated SEM coupled with EDS, the number of pure MnS inclusions was measured, and it was found that with increases in Ca content, the number of pure MnS inclusions gradually decreased, resulting in the formation of a solid solution of (Ca,Mn)S or dual oxy-sulfides; the size of the remaining pure MnS inclusions decreased with increases in Ca content in the steel.
  • According to the inclusion stability diagram, in order to have effective inclusion transformation with the help of Ca addition, the oxygen content should be controlled at below 50 ppm. Increasing the oxygen content results in the narrowing of the liquid window, and the amount of Ca required to transform both oxides and sulfides increases.

Author Contributions

Conceptualization, Y.X. and H.A.; methodology, Z.Y., Y.X. and Z.H.; software, H.A.; validation, X.M. and B.Z.; formal analysis, H.A., Z.Y. and Y.X.; investigation, F.T. and H.A.; resources, Z.Y., Y.X. and Z.H.; data curation, H.A., Y.X. and Z.Y.; writing—original draft preparation, H.A. and F.T.; writing—review and editing, F.T., B.Z. and X.M.; supervision, X.M., Z.H. and B.Z.; funding acquisition, B.Z. and Z.H. All authors have read and agreed to the published version of the manuscript.

Funding

This research was supported by the Australian Government through the Australian Research Council Research Hub and Baosteel through the Baosteel–Australia Joint Research and Development Centre with grant number BA18004.

Institutional Review Board Statement

Not applicable.

Informed Consent Statement

Not applicable.

Data Availability Statement

Not applicable.

Acknowledgments

The Australian Microscopy and Microanalysis Research Facility is acknowledged for providing characterization facilities. Technical support for the EPMA facility from Ron Rasch and Ying Yu of the Centre for Microscopy and Microanalysis at the University of Queensland is gratefully acknowledged.

Conflicts of Interest

The authors declare no conflict of interest.

References

  1. Valdez, M.E.; Wang, Y.; Sridhar, S. In-situ observation of the formation of MnS during solidification of high sulfur steels. Steel Res. Int. 2004, 75, 247–256. [Google Scholar] [CrossRef]
  2. Bielefeldt, W.V.; Vilela, A.C.F. Study of inclusions in high sulfur, Al-killed Ca-treated steel via experiments and thermodynamic calculations. Steel Res. Int. 2015, 86, 375–385. [Google Scholar] [CrossRef]
  3. Väinölä, R.; Holappa, L.; Karvonen, P. Modern steelmaking technology for special steels. J. Mater. Process. Technol. 1995, 53, 453–465. [Google Scholar] [CrossRef]
  4. You, D. Modeling inclusion formation during solidification of steel: A review. Metals 2017, 7, 460. [Google Scholar] [CrossRef] [Green Version]
  5. Bigelow, L.; Flemings, M. Sulfide inclusions in steel. Metall. Trans. B 1975, 6, 275. [Google Scholar] [CrossRef] [Green Version]
  6. Sims, C.; Dahle, F. Effect of aluminum on the properties of medium carbon cast steel. Trans. Am. Foundrym. Soc. 1938, 46, 65–132. [Google Scholar]
  7. Ånmark, N.; Karasev, A.; Jönsson, P.G. The effect of different non-metallic inclusions on the machinability of steels. Materials 2015, 8, 751–783. [Google Scholar] [CrossRef] [Green Version]
  8. Kim, H.S.; Lee, H.-G.; Oh, K.-S. MnS precipitation in association with manganese silicate inclusions in Si/Mn deoxidized steel. Metall. Mater. Trans. A 2001, 32, 1519. [Google Scholar] [CrossRef] [Green Version]
  9. Zhang, Q. Formation and evolution of inclusions in Si-killed resulfurized free-cutting steel. ISIJ Int. 2018, 58, 1250–1256. [Google Scholar] [CrossRef] [Green Version]
  10. Byun, J.-S. Non-metallic inclusion and intragranular nucleation of ferrite in Ti-killed C–Mn steel. Acta Mater. 2003, 51, 1593–1606. [Google Scholar] [CrossRef]
  11. Xie, J.-B.; Zhang, N.; Yang, Q.-K.; An, J.-M.; Huang, Z.-Z.; Fu, J.-X. Exploration of morphology evolution of the inclusions in Mg-treated 16MnCrS5 steel. Ironmak. Steelmak. 2019, 46, 564–573. [Google Scholar] [CrossRef]
  12. Oikawa, K. The control of the morphology of MnS inclusions in steel during solidification. ISIJ Int. 1995, 35, 402–408. [Google Scholar] [CrossRef] [Green Version]
  13. Kim, H.S.; Lee, H.-G.; Kyung-Shik, O. Precipitation behavior of MnS on oxide inclusions in Si/Mn deoxidized steel. Met. Mater. 2000, 6, 305–310. [Google Scholar] [CrossRef]
  14. Hu, Y. Effect of deoxidation process on inclusion and fatigue performance of spring steel for automobile suspension. Metall. Mater. Trans. B 2018, 49, 569–580. [Google Scholar] [CrossRef]
  15. Ma, Q. Microstructure and hardness evolution during deformation near Ae3 in a Cr–Mn–Ti gear steel. Steel Res. Int. 2019, 90, 1800332. [Google Scholar] [CrossRef]
  16. Deng, Z.; Zhu, M. Deoxidation mechanism of Al-killed steel during industrial refining process. ISIJ Int. 2014, 54, 1498–1506. [Google Scholar] [CrossRef] [Green Version]
  17. Higuchi, Y. Inclusion modification by calcium treatment. ISIJ Int. 1996, 36, 151–154. [Google Scholar] [CrossRef] [Green Version]
  18. Lis, T. Modification of non-metallic dispersion phase in steel. Metall. Foundry Eng. 2002, 28, 29–45. [Google Scholar]
  19. Bielefeldt, W.V.; Vilela, A.C.F. Thermodynamic study of non-metallic inclusion formation in SAE 1141 steel. Materials 2010, 15, 275–282. [Google Scholar] [CrossRef]
  20. Holappa, L.; Helle, A. Inclusion control in high-performance steels. J. Mater. Process. Technol. 1995, 53, 177–186. [Google Scholar] [CrossRef]
  21. Gleinig, J. Characterization of nonmetallic inclusions in 18CrNiMo7-6. Metall. Mater. Trans. B 2019, 50, 337–356. [Google Scholar] [CrossRef]
  22. Yang, W. Characteristics of inclusions in low carbon Al-killed steel during ladle furnace refining and calcium treatment. ISIJ Int. 2013, 53, 1401–1410. [Google Scholar] [CrossRef] [Green Version]
  23. Fandrich, R. Modern SEM-based mineral liberation analysis. Int. J. Miner. Process. 2007, 84, 310–320. [Google Scholar] [CrossRef]
  24. Ghosh, A. Thermodynamic evaluation of formation of oxide–sulfide duplex inclusions in steel. ISIJ Int. 2008, 48, 1552–1559. [Google Scholar]
  25. Blais, C. Development of an integrated method for fully characterizing multiphase inclusions and its application to calcium-treated steels. Mater. Charact. 1997, 38, 25–37. [Google Scholar] [CrossRef]
  26. Faulring, G.M.; Hilty, D.C. Process for Continuous Casting of Aluminum-Deoxidized Steel. U.S. Patent 4,317,678, 2 March 1982. [Google Scholar]
Figure 1. Typical inclusions observed in the blank sample.
Metals 13 01153 g001
Figure 2. Typical inclusions observed after 4 ppm Ca addition.
Metals 13 01153 g002
Figure 3. Typical inclusions observed after 11 ppm Ca addition.
Metals 13 01153 g003
Figure 4. Typical inclusions observed after 22 ppm Ca addition.
Metals 13 01153 g004
Figure 5. Typical inclusions observed after 36 ppm Ca addition.
Metals 13 01153 g005
Figure 6. Inclusions size distribution in the samples with varying amounts of Ca.
Metals 13 01153 g006
Figure 7. Types of inclusions observed in samples containing varying amounts of Ca.
Metals 13 01153 g007
Figure 8. Number of pure MnS inclusions plotted against calcium content in the steel.
Metals 13 01153 g008
Figure 9. Changes in the average size of MnS inclusions with increases in Ca content in the steel.
Metals 13 01153 g009
Figure 10. Percentage of MnS inclusions based on size distribution.
Metals 13 01153 g010
Figure 11. Typical EDS mappings of inclusions found in the steel samples.
Metals 13 01153 g011
Figure 12. The composition distribution of Al2O3–MgO–CaO inclusions on the Al2O3–MgO–CaO phase diagram.
Metals 13 01153 g012
Figure 13. Equilibrium precipitation of inclusions and evolution during steel solidification: (a) Blank sample, (b) 4 ppm Ca, (c) 11 ppm Ca, (d) 22 ppm Ca and (e) 36 ppm Ca.
Metals 13 01153 g013
Figure 14. Mass percentage of CaS and MnS in the solid solution of (Ca,Mn)S. (a) Blank sample, (b) 4 ppm Ca, (c) 11 ppm Ca, (d) 22 ppm Ca and (e) 36 ppm Ca.
Metals 13 01153 g014
Figure 15. The Schematic diagram of inclusion formation at different stages of Al deoxidation and Ca treatment.
Metals 13 01153 g015
Figure 16. Inclusion stability diagram for calculating stable inclusions at 1600 °C.
Metals 13 01153 g016
Table 1. Chemical composition of the samples used for the study.
SampleCSiMnNNiCrS *Al *Ca *O *Fe
Ca-10.190.1301.050.0070.180.98229195Blank20Bal.
Ca-20.170.1301.040.0040.181.021342784200Bal.
Ca-30.160.1301.050.0040.181.0325344811120Bal.
Ca-40.180.1041.070.0080.181.0128830522110Bal.
Ca-50.170.1201.080.0070.181.022413123650Bal.
* S, Al, Ca, O are in ppm.
Table 2. Classification of inclusions in all the samples based on their chemical composition.
Inclusion TypeComposition Range Wt.%
Al2O3CaOSiO2FeOCaSMnS
Single oxidesAl2O3>80<05<01<05<05<05
CaO–Al2O3>50>30<01<05<05<05
Sulfides(Ca,Mn)S<05<05<01<05>45>45
MnS<05<05<01<05<05>90
Dual oxy-sulfidesAl2O3–(Ca,Mn)S>50<05<01<05>20>20
Al2O3–CaO–(Ca,Mn)S>40>20<01<05>15>05
Al2O3–MnS>50<05<01<05<05>30
Al2O3–CaO–CaS>40>20<01<05>15<05
Disclaimer/Publisher’s Note: The statements, opinions and data contained in all publications are solely those of the individual author(s) and contributor(s) and not of MDPI and/or the editor(s). MDPI and/or the editor(s) disclaim responsibility for any injury to people or property resulting from any ideas, methods, instructions or products referred to in the content.

