Article

Spatial-Time Inhomogeneity Due to the Portevin-Le Chatelier Effect Depending on Stiffness

by
Tatyana Tretyakova
* and
Mikhail Tretyakov
Center of Experimental Mechanics, Perm National Research Polytechnic University, 614990 Perm, Russia
*
Author to whom correspondence should be addressed.
Metals 2023, 13(6), 1054; https://doi.org/10.3390/met13061054
Submission received: 24 April 2023 / Revised: 24 May 2023 / Accepted: 25 May 2023 / Published: 31 May 2023
(This article belongs to the Topic Microstructure and Properties in Metals and Alloys)

Abstract

:
This work is devoted to the study of the influence of the rigidity of the loading system on the kinetics of the initiation and propagation of the Portevin-Le Chatelier (PLC) strain bands due to the jerky flow in Al-Mg alloy. To estimate the influence of the loading system, the original loading attachment, which allows reducing the stiffness in a given range, was used. Registration of displacement and strain fields on the specimen surface was carried out with the Vic-3D non-contacting deformation measurement system based on the Digital Image Correlation (DIC) technique. The mechanical uniaxial tension tests were carried out using samples of Al-Mg alloy at the biaxial servo-hydraulic testing system Instron 8850. As a result of tensile tests, deformation diagrams were obtained for Al-Mg alloy samples tested at different values of stiffness of the loading system: 120 MN/m (nominal value), 50 MN/m, 18 MN/m, and 5 MN/m. All diagrams show discontinuous plastic deformations (the Portevin-Le Chatelier effect). It is noted that a decrease in the rigidity of the loading system leads to a change in the type of jerky flow. At constant parameters of the loading rate, temperature, and chemical composition of the material, the PLC effects of types A, B, and C are recorded in tests.

1. Introduction

By understanding the physical, mechanical, and strength properties of materials, we can ensure the high reliability of structures and prevent industrial accidents caused by mechanical failures. It is necessary to take the influence of real external impacts and the material response into account. Inelastic behavior and failure of critical structural elements are related to elastoplastic deformation of the material, accompanied by a change in its structure, physical and mechanical properties during loading. Some structural materials, for example, Al-Mg, Al-Cu, Ni-Cr, and Ni-Fe-Cr alloys, are characterized by the manifestation of the effects of discontinuous yield in certain ranges of temperatures and loading rates [1,2,3].
Under uniaxial tension, the effect of the jerky flow manifests itself in the formation of teeth on the deformation curve in the case of kinematic loading (the Portevin-Le Chatelier effect) or in the form of steps in the case of force loading (the Savart-Masson effect). The PLC effect reduces the surface quality of the material, causes non-uniform development of deformations, and causes a significant decrease in strength and ductility. In this case, the formation of strain bands and macroscopic localization of plastic flows lead to a difference in thickness of structural elements, stress concentration, defects, and, therefore, the initiation of macroscopic failure processes [4,5,6,7,8]. It is a promising approach to obtaining and systematizing experimental data on the jerky flow under various types of mechanical effects. The study analyzes the kinetics of strain fields during the initiation and development of macroscopic localization and instability of plastic flow based on the example of Al-Mg alloys [6,8].
This work considers the failure as a result of the stability loss of inelastic deformation processes [9,10,11,12]. The theoretical and experimental study of the basic laws of post-critical deformation makes it possible to predict conditions of destruction of deformable bodies and analyze possibilities for controlling destruction. At the postcritical stage of deformation, the formation of macroscopic failure conditions occurs, which are not uniquely associated with the stress-strain state. The diagram breaks off at the highest point only at zero stiffness of the loading system in the case of “soft” (force) loading. Under ‘hard’ (kinematic) loading, a complete diagram characterizes the relationship between the load and displacement and shows a decrease in the force applied to the sample to zero. The loading system [13,14,15] plays a key role in the transition from the stage of equilibrium accumulation of damage to the nonequilibrium, avalanche-like stage of destruction. As the effects of the intermittent flow are characterized by instability of the ongoing deformation processes [1,6,10], we expect a significant dependence of this phenomenon on parameters of the loading system’s stiffness.
Special attention should be paid to the experimental study and theoretical description of the spatio-temporal inhomogeneity of inelastic deformation, the development of defects, and destruction, taking into account the influence of the type of complex stress-strain state of the material. It is well known, that in most cases, the material in a structure works under complex stress states and complex thermomechanical influences [16,17,18,19,20,21,22]. Mechanical tests are associated with significant methodological difficulties and technical limitations of the schemes and loading modes, as well as the methods of recording and interpreting the results obtained [22,23,24,25,26,27]. Of interest is the development of existing techniques and the creation of new scientifically grounded approaches to the experimental study of inelastic behavior and fracture of advanced structural metals and alloys based on original techniques that allow creating the required characteristics of the loading system in the working part of the sample. Thus, the aim of the work is to study how the stiffness of the loading system affects the manifestation of the jerky flow effect in an Al-Mg alloy using an original device of variable stiffness and the digital image correlation technique.

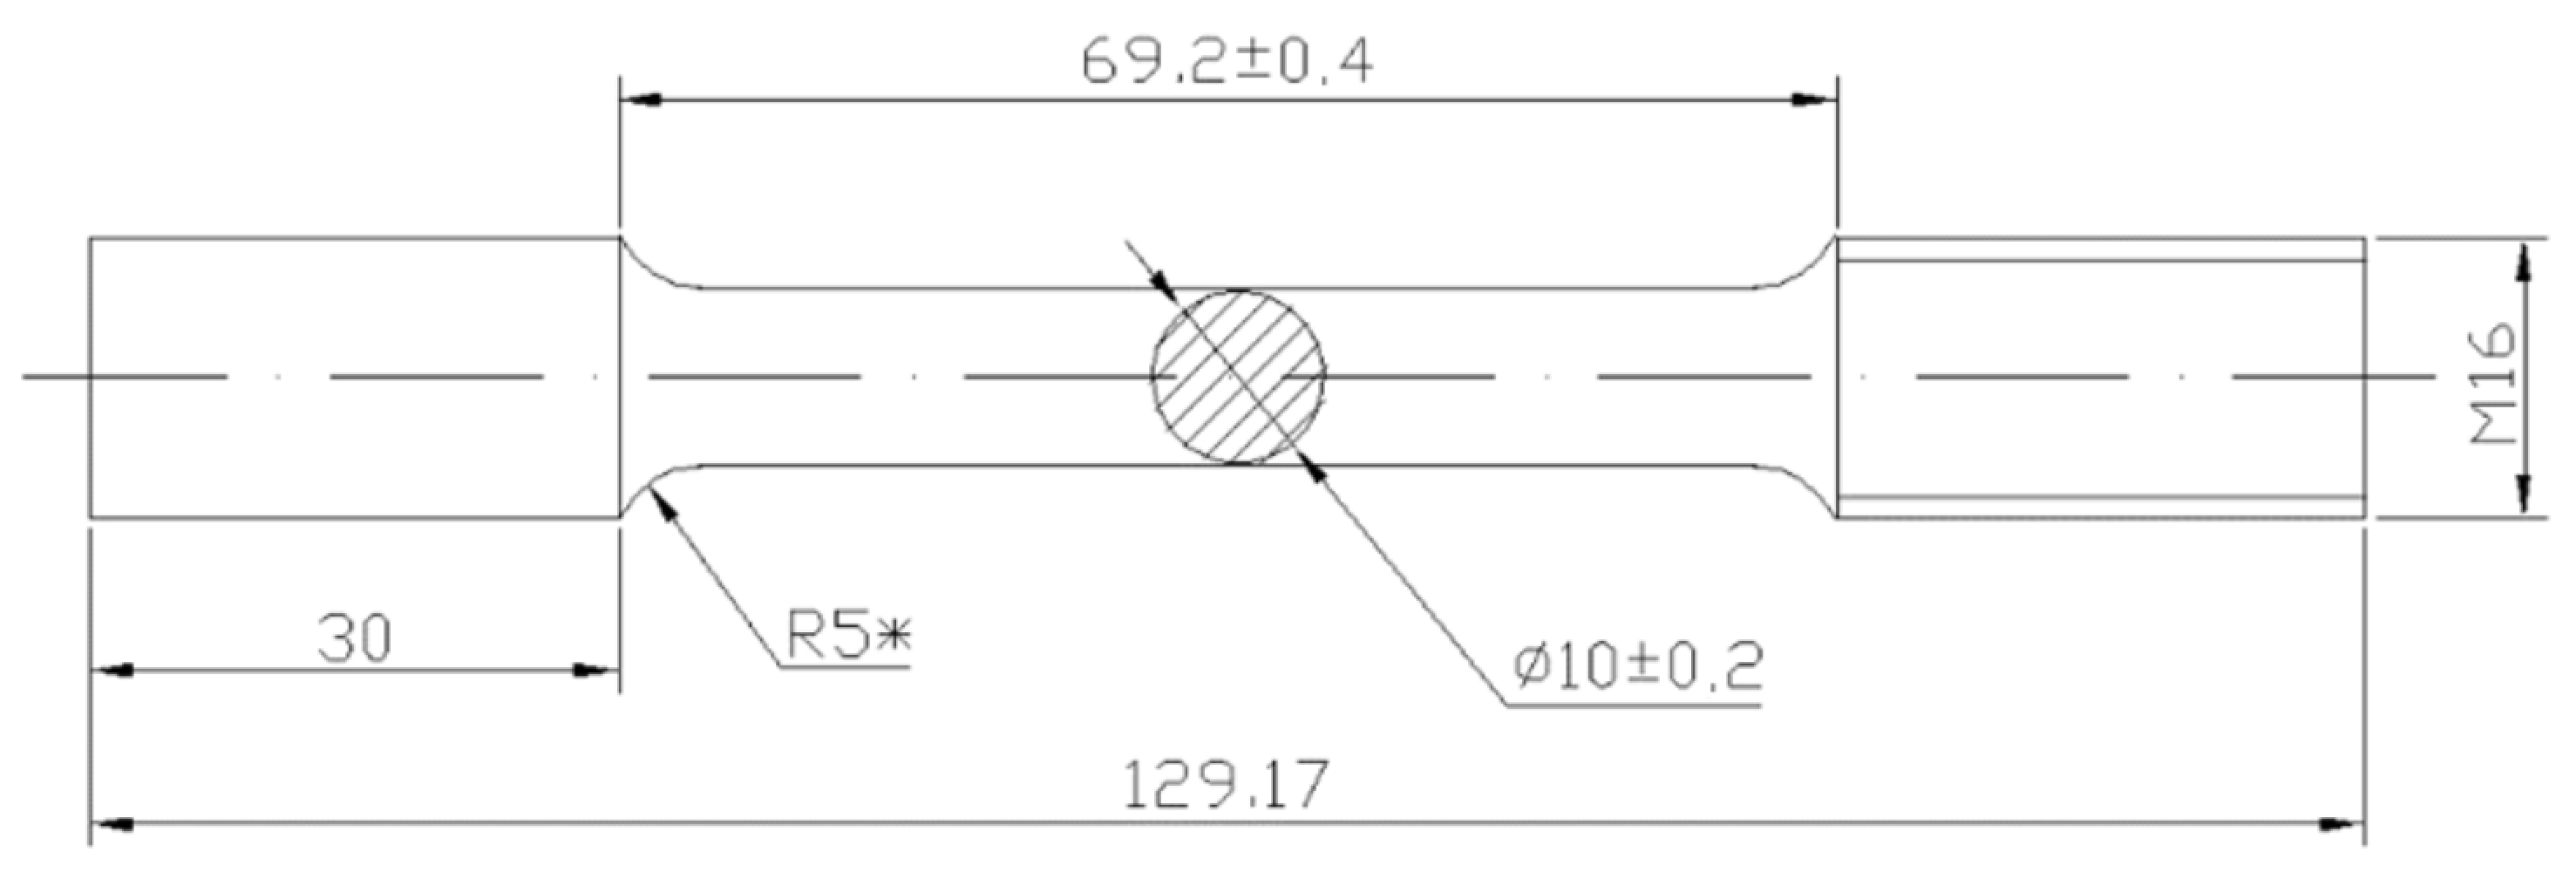
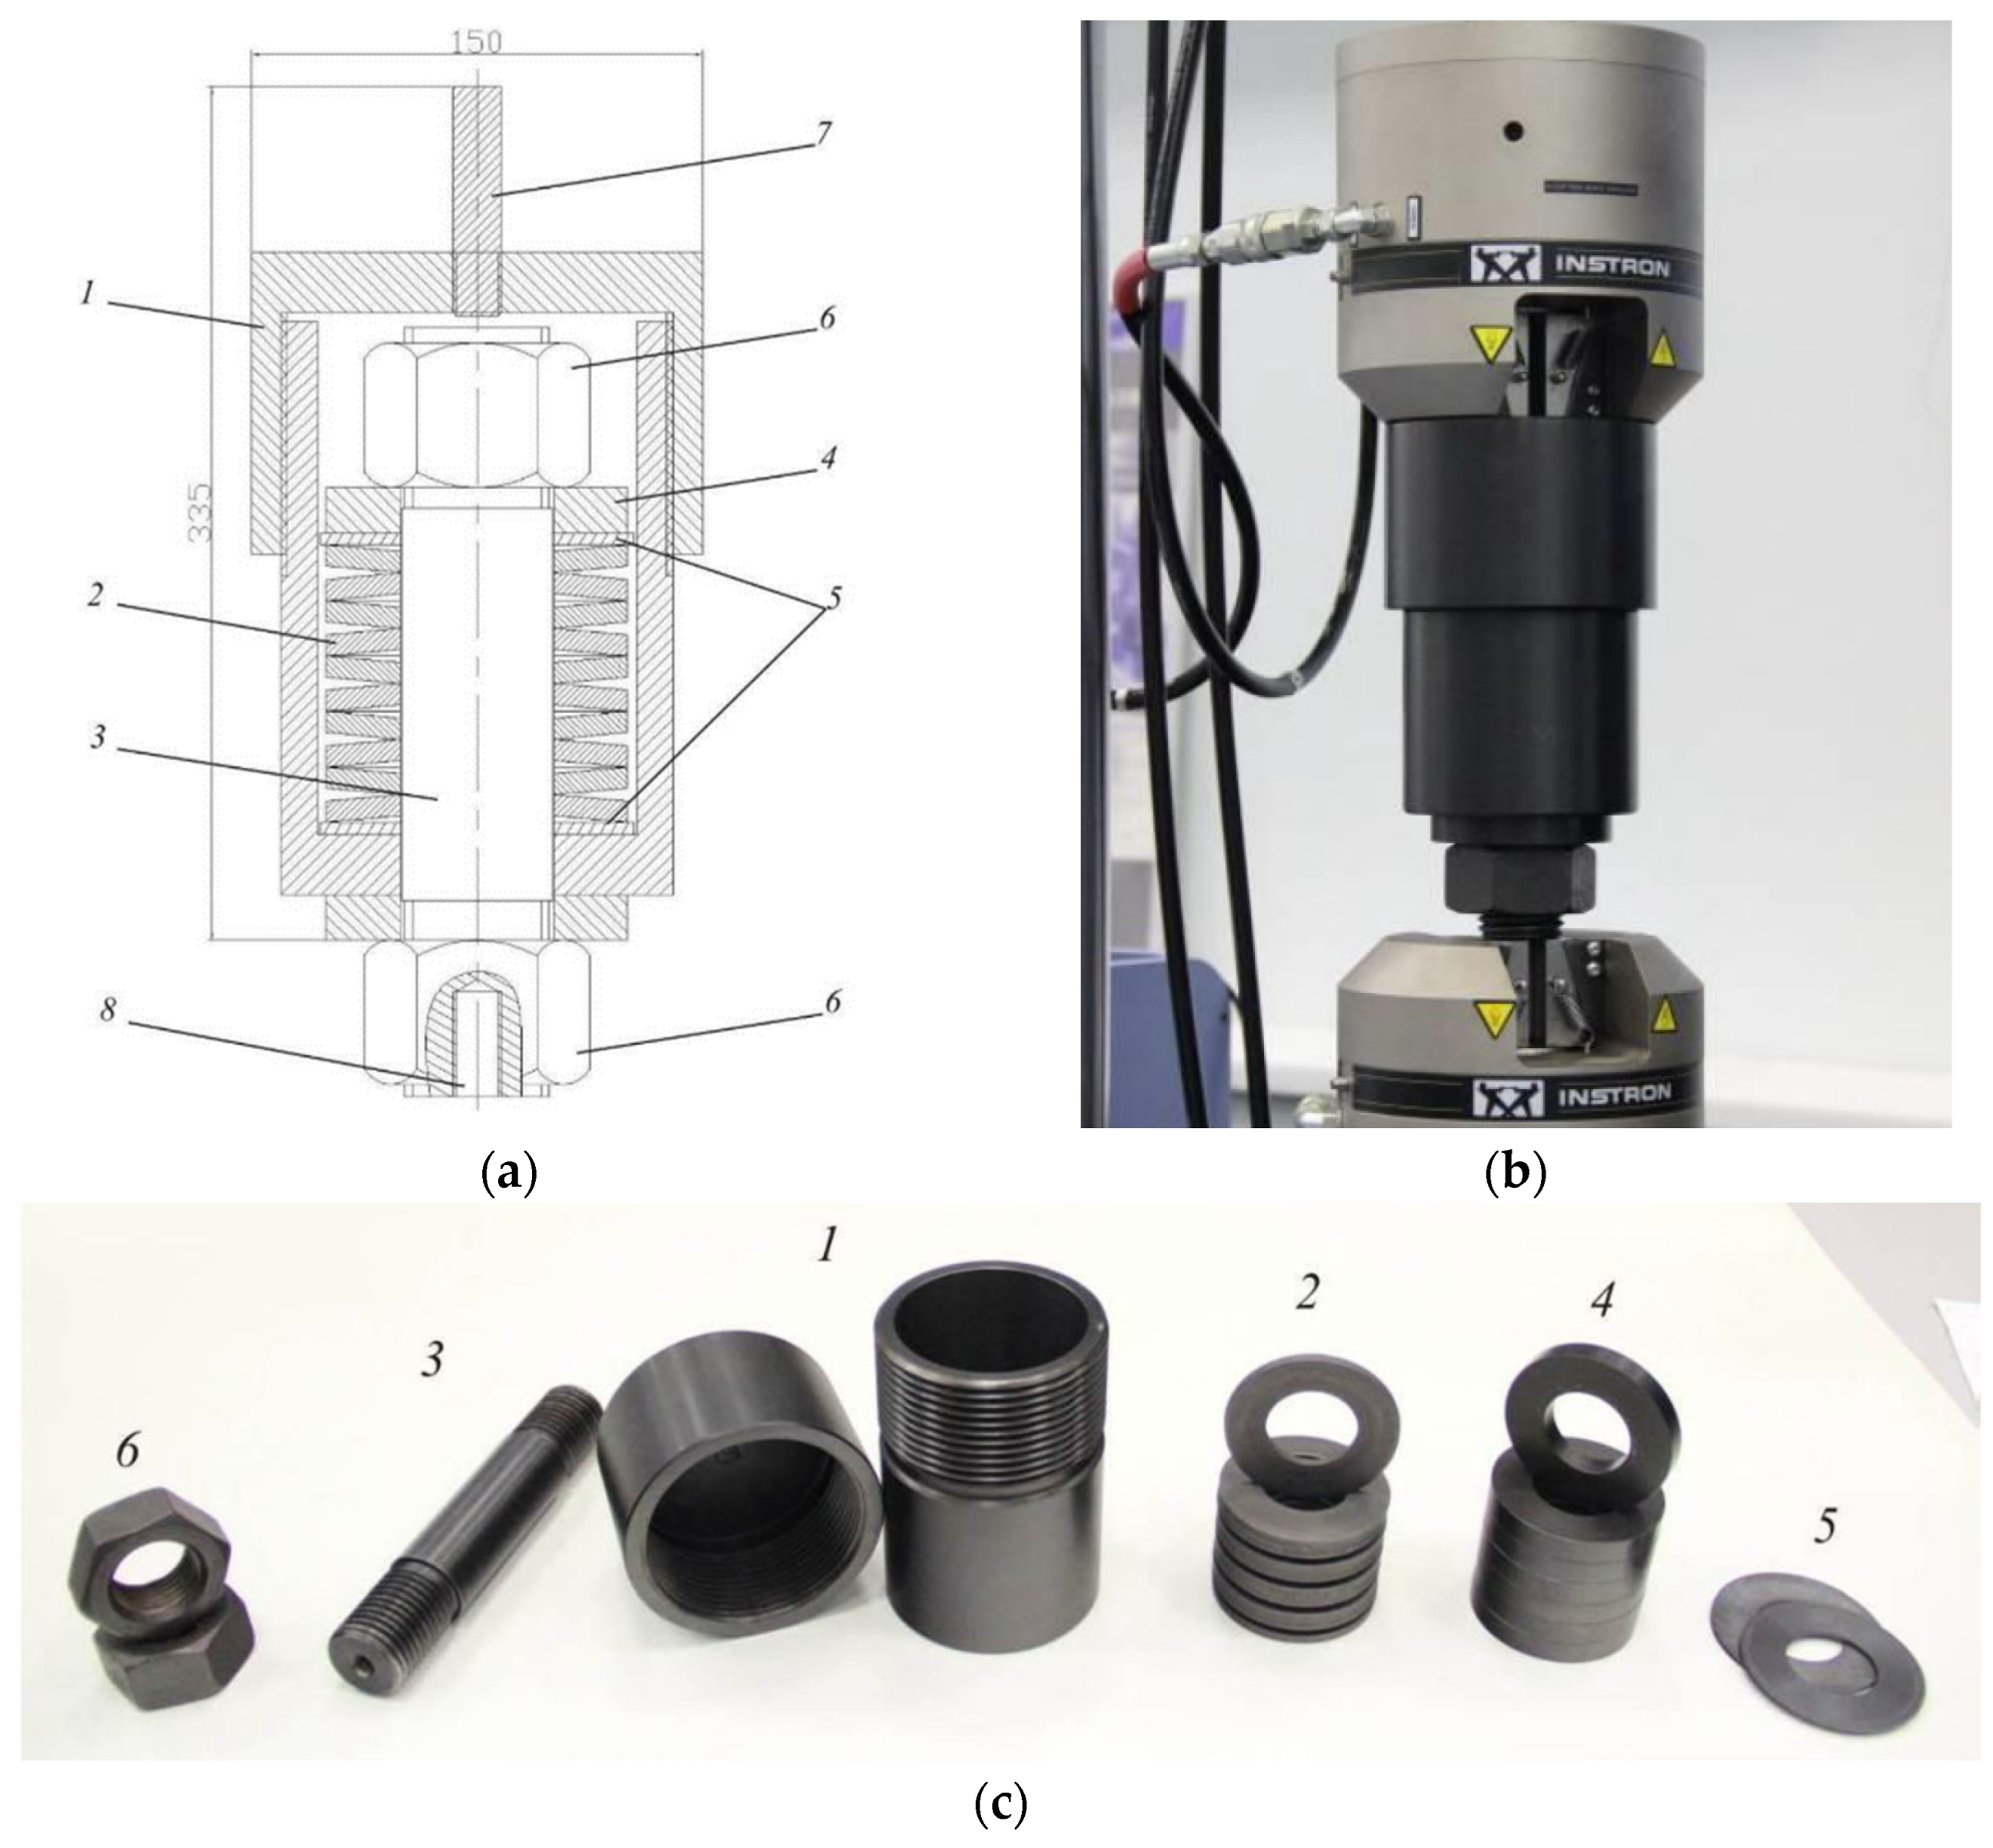
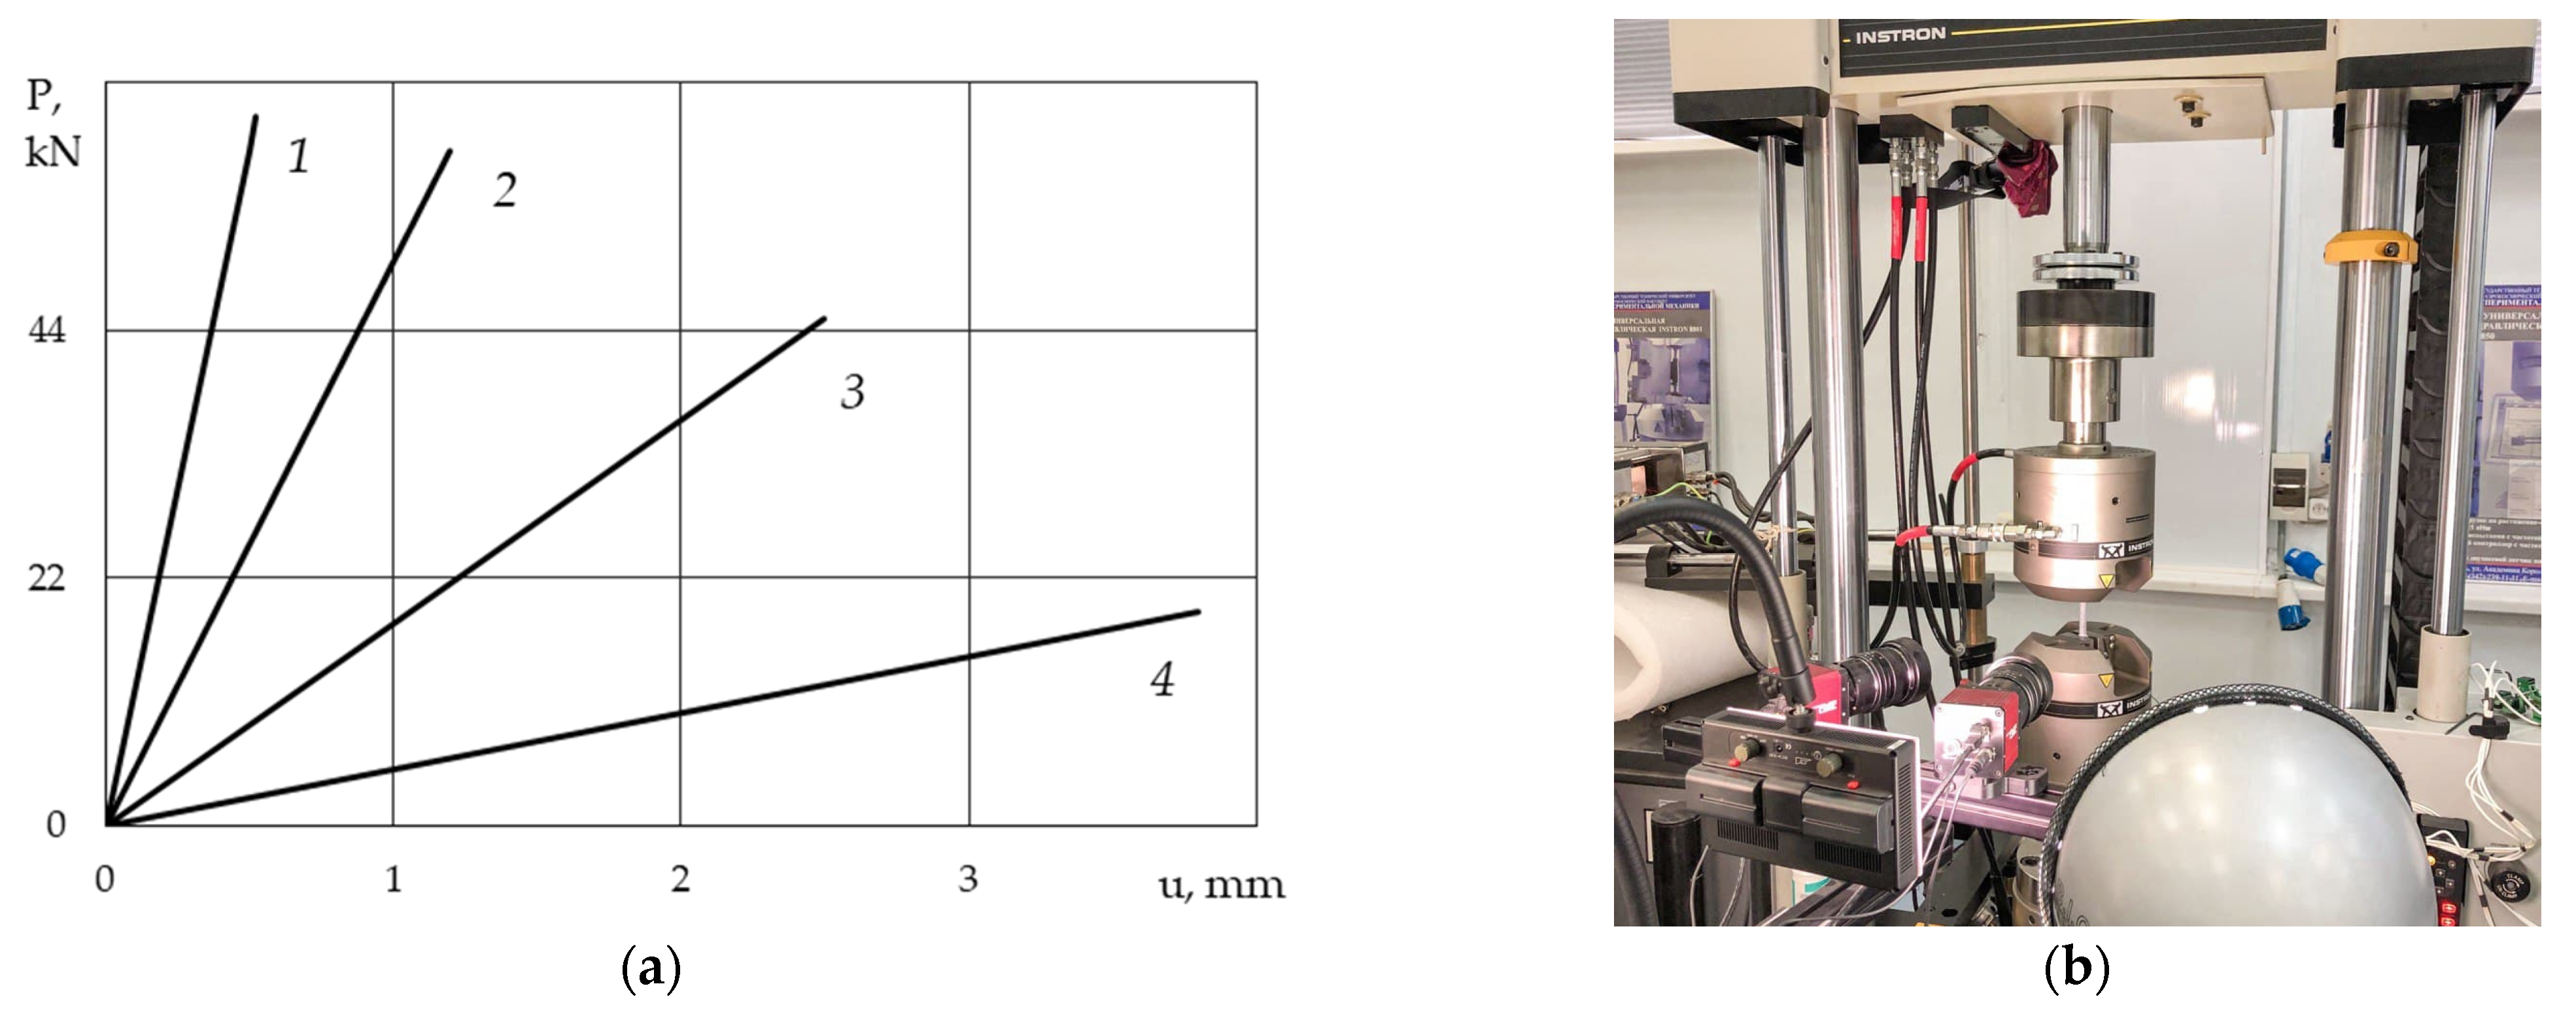
2. Materials and Methods
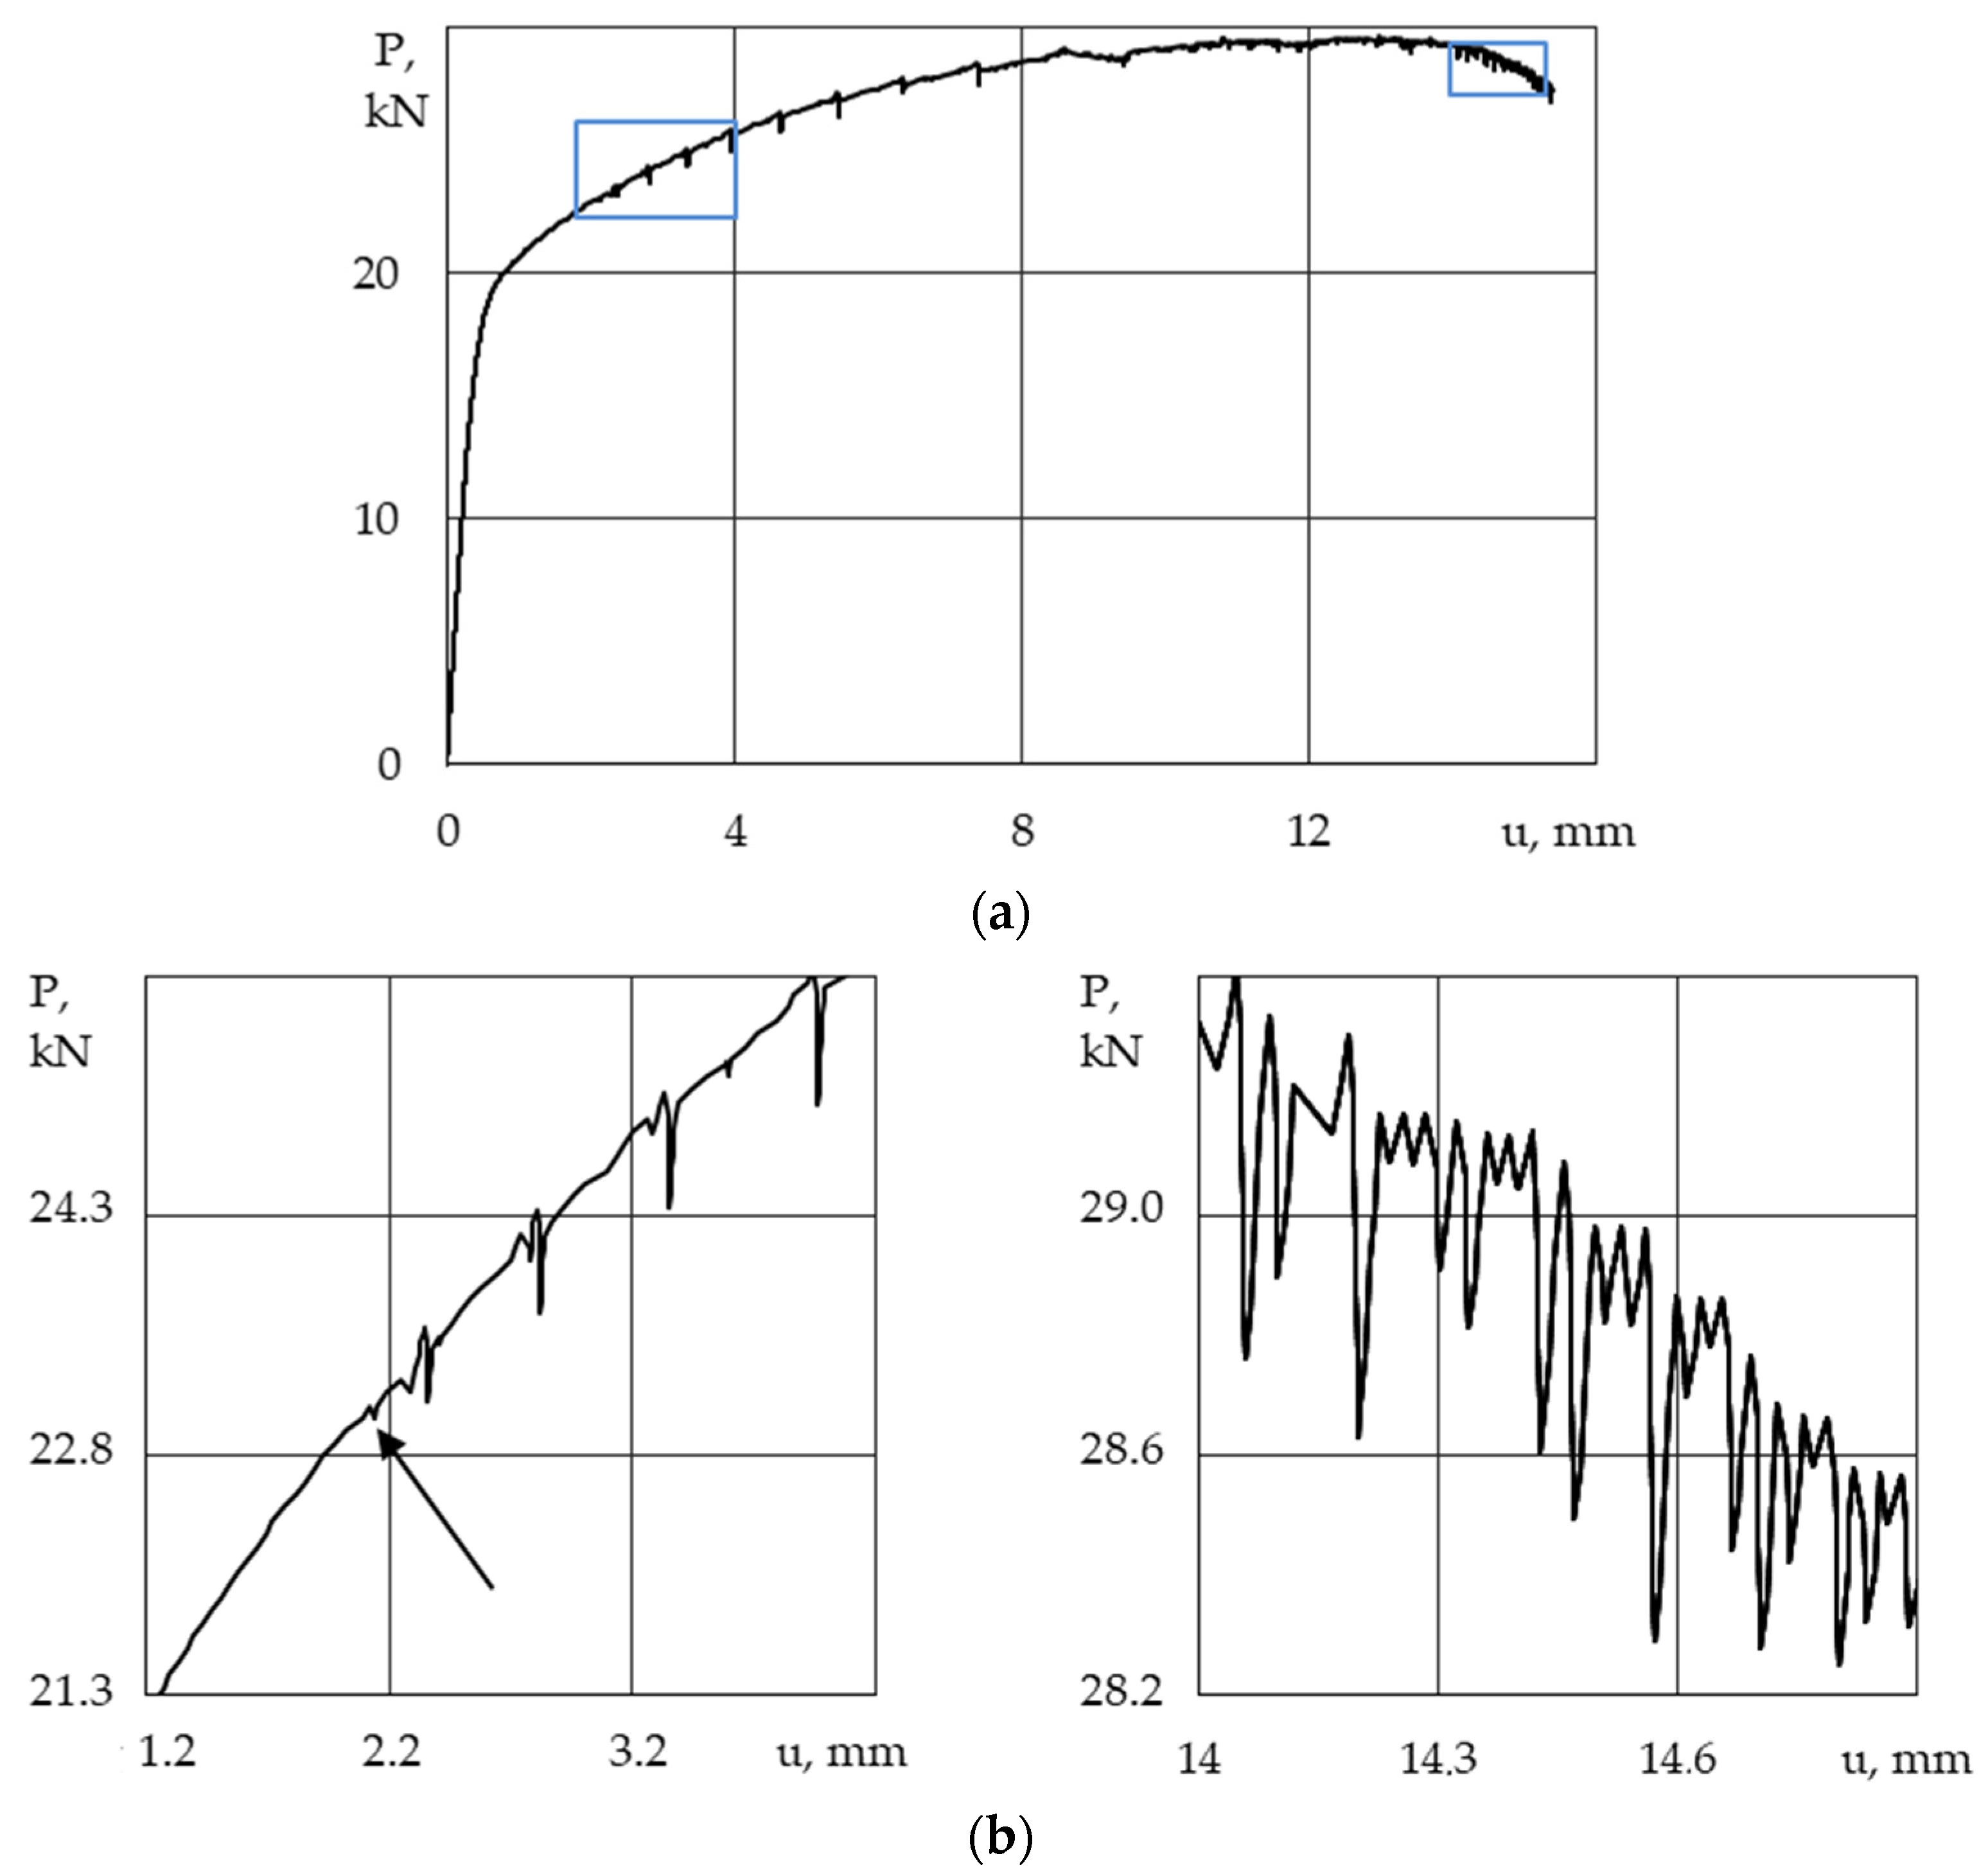
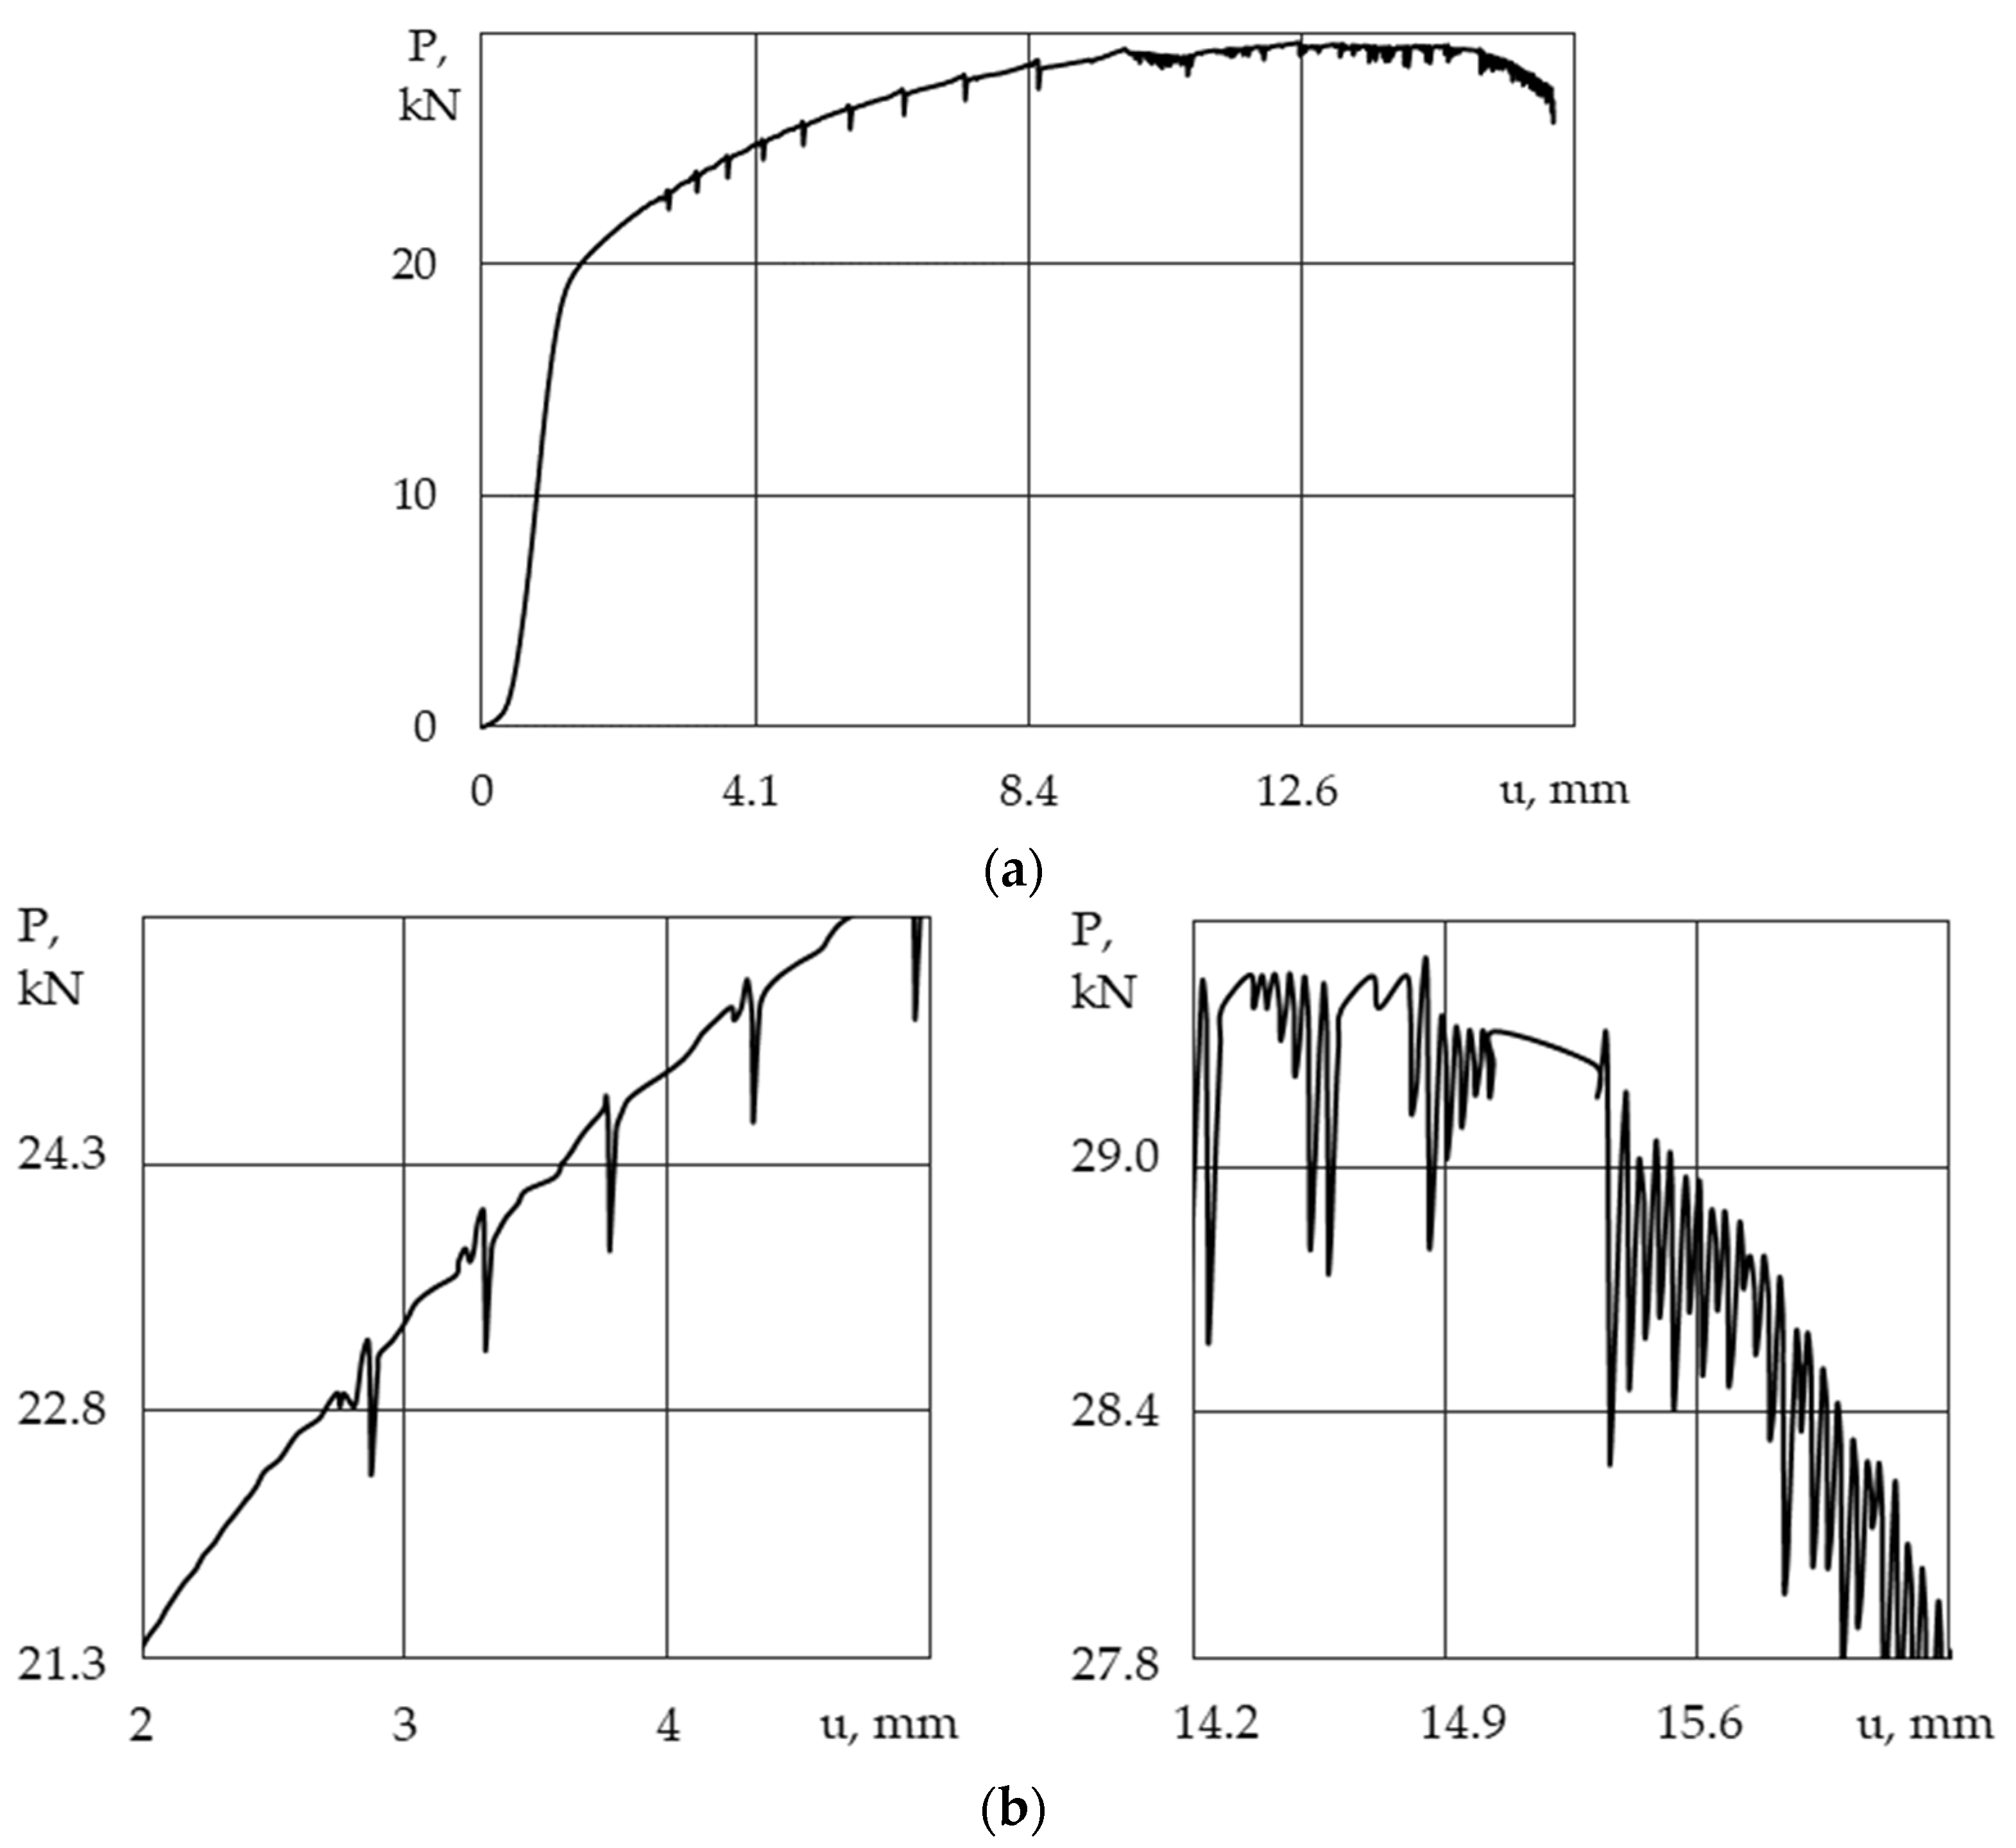
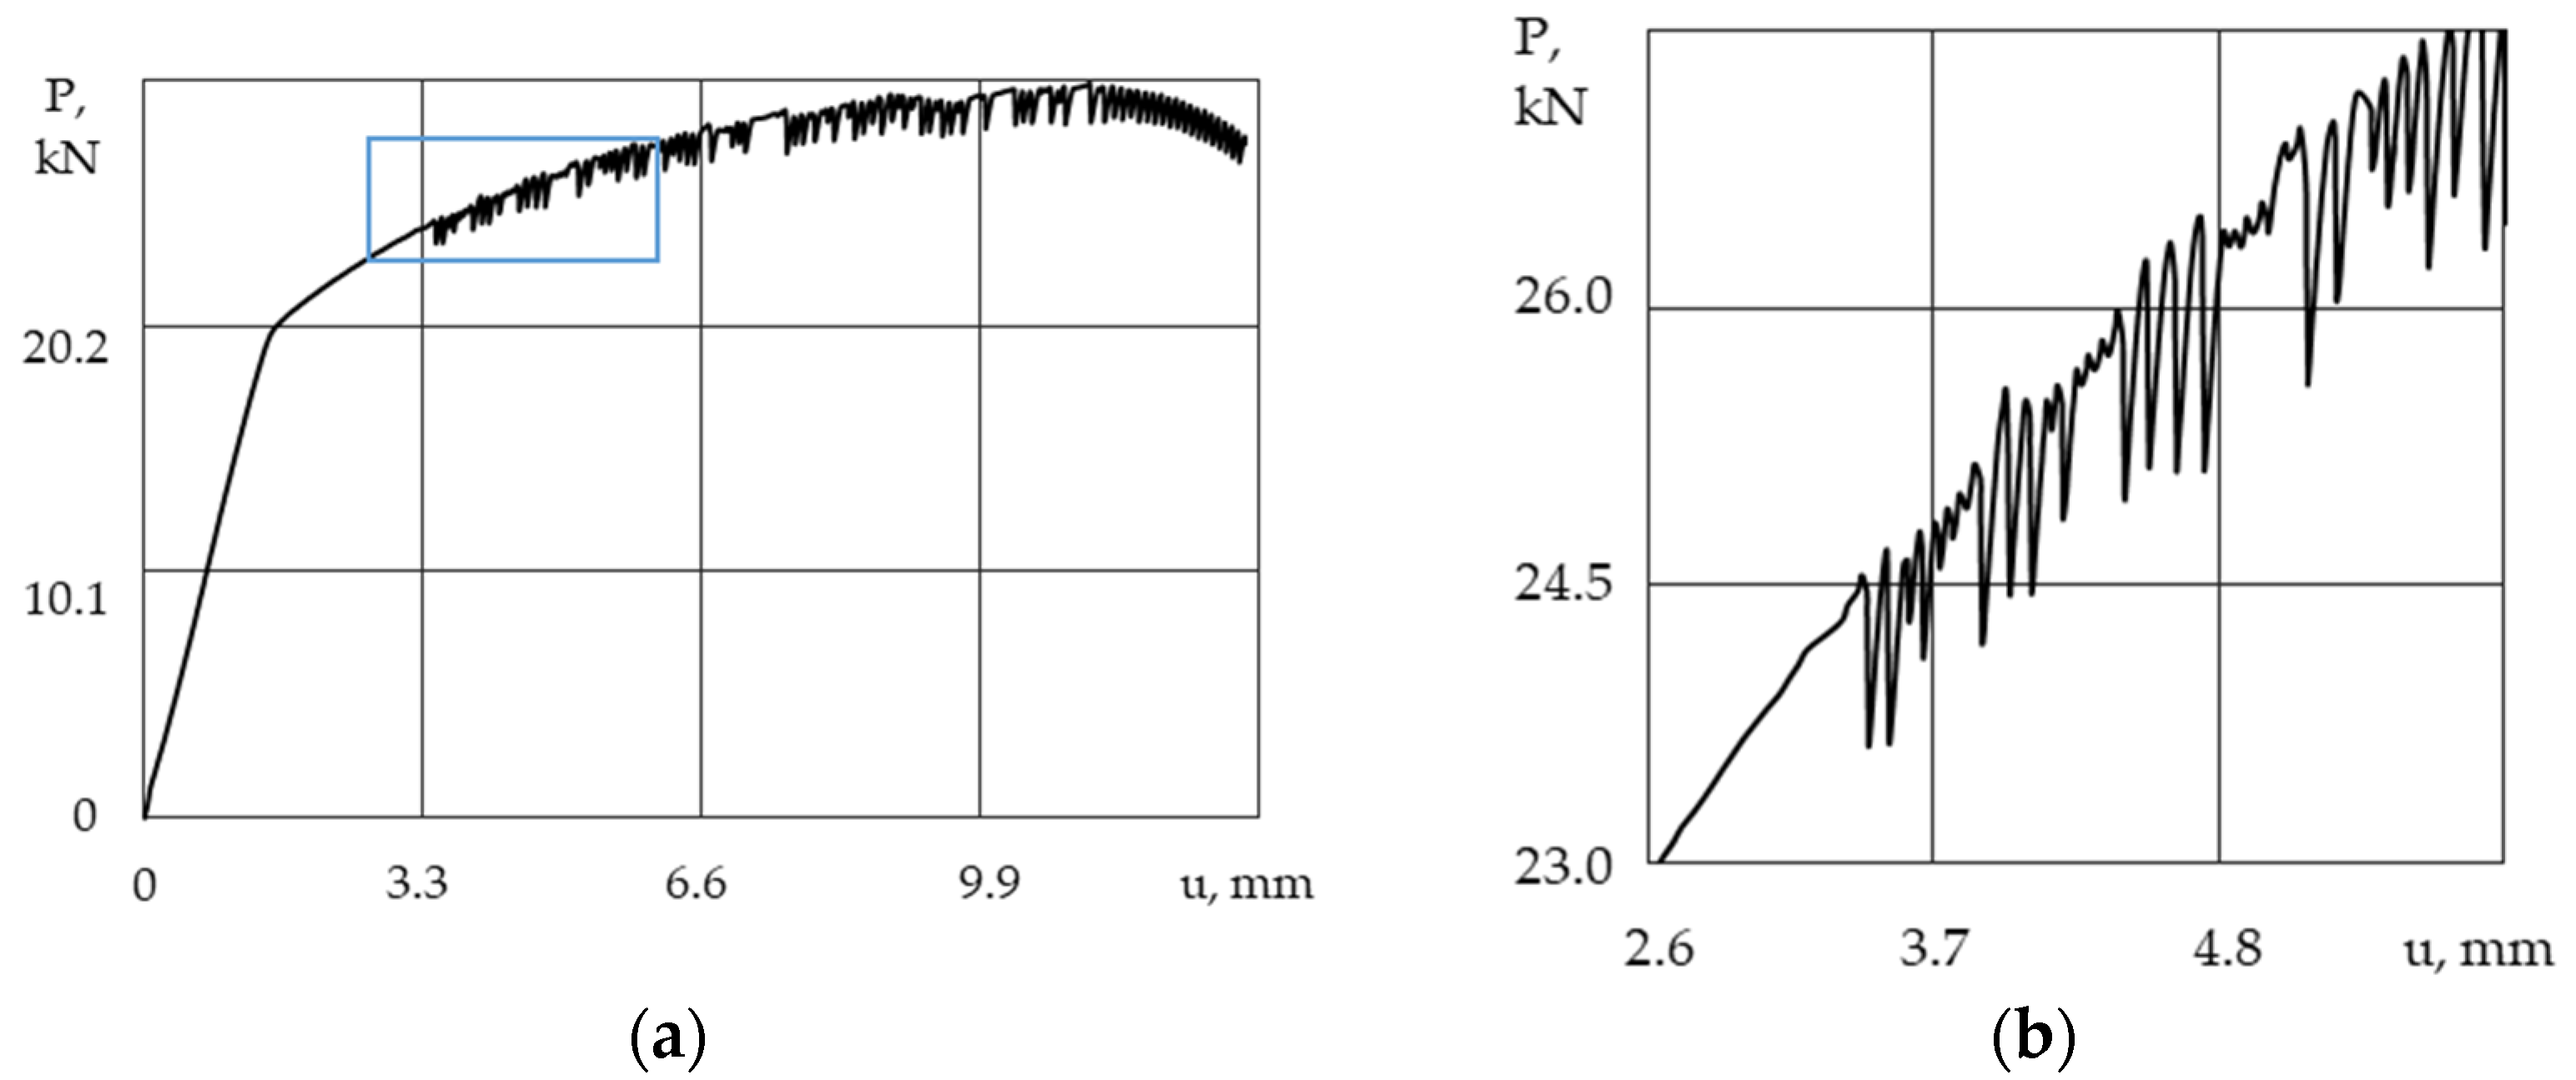
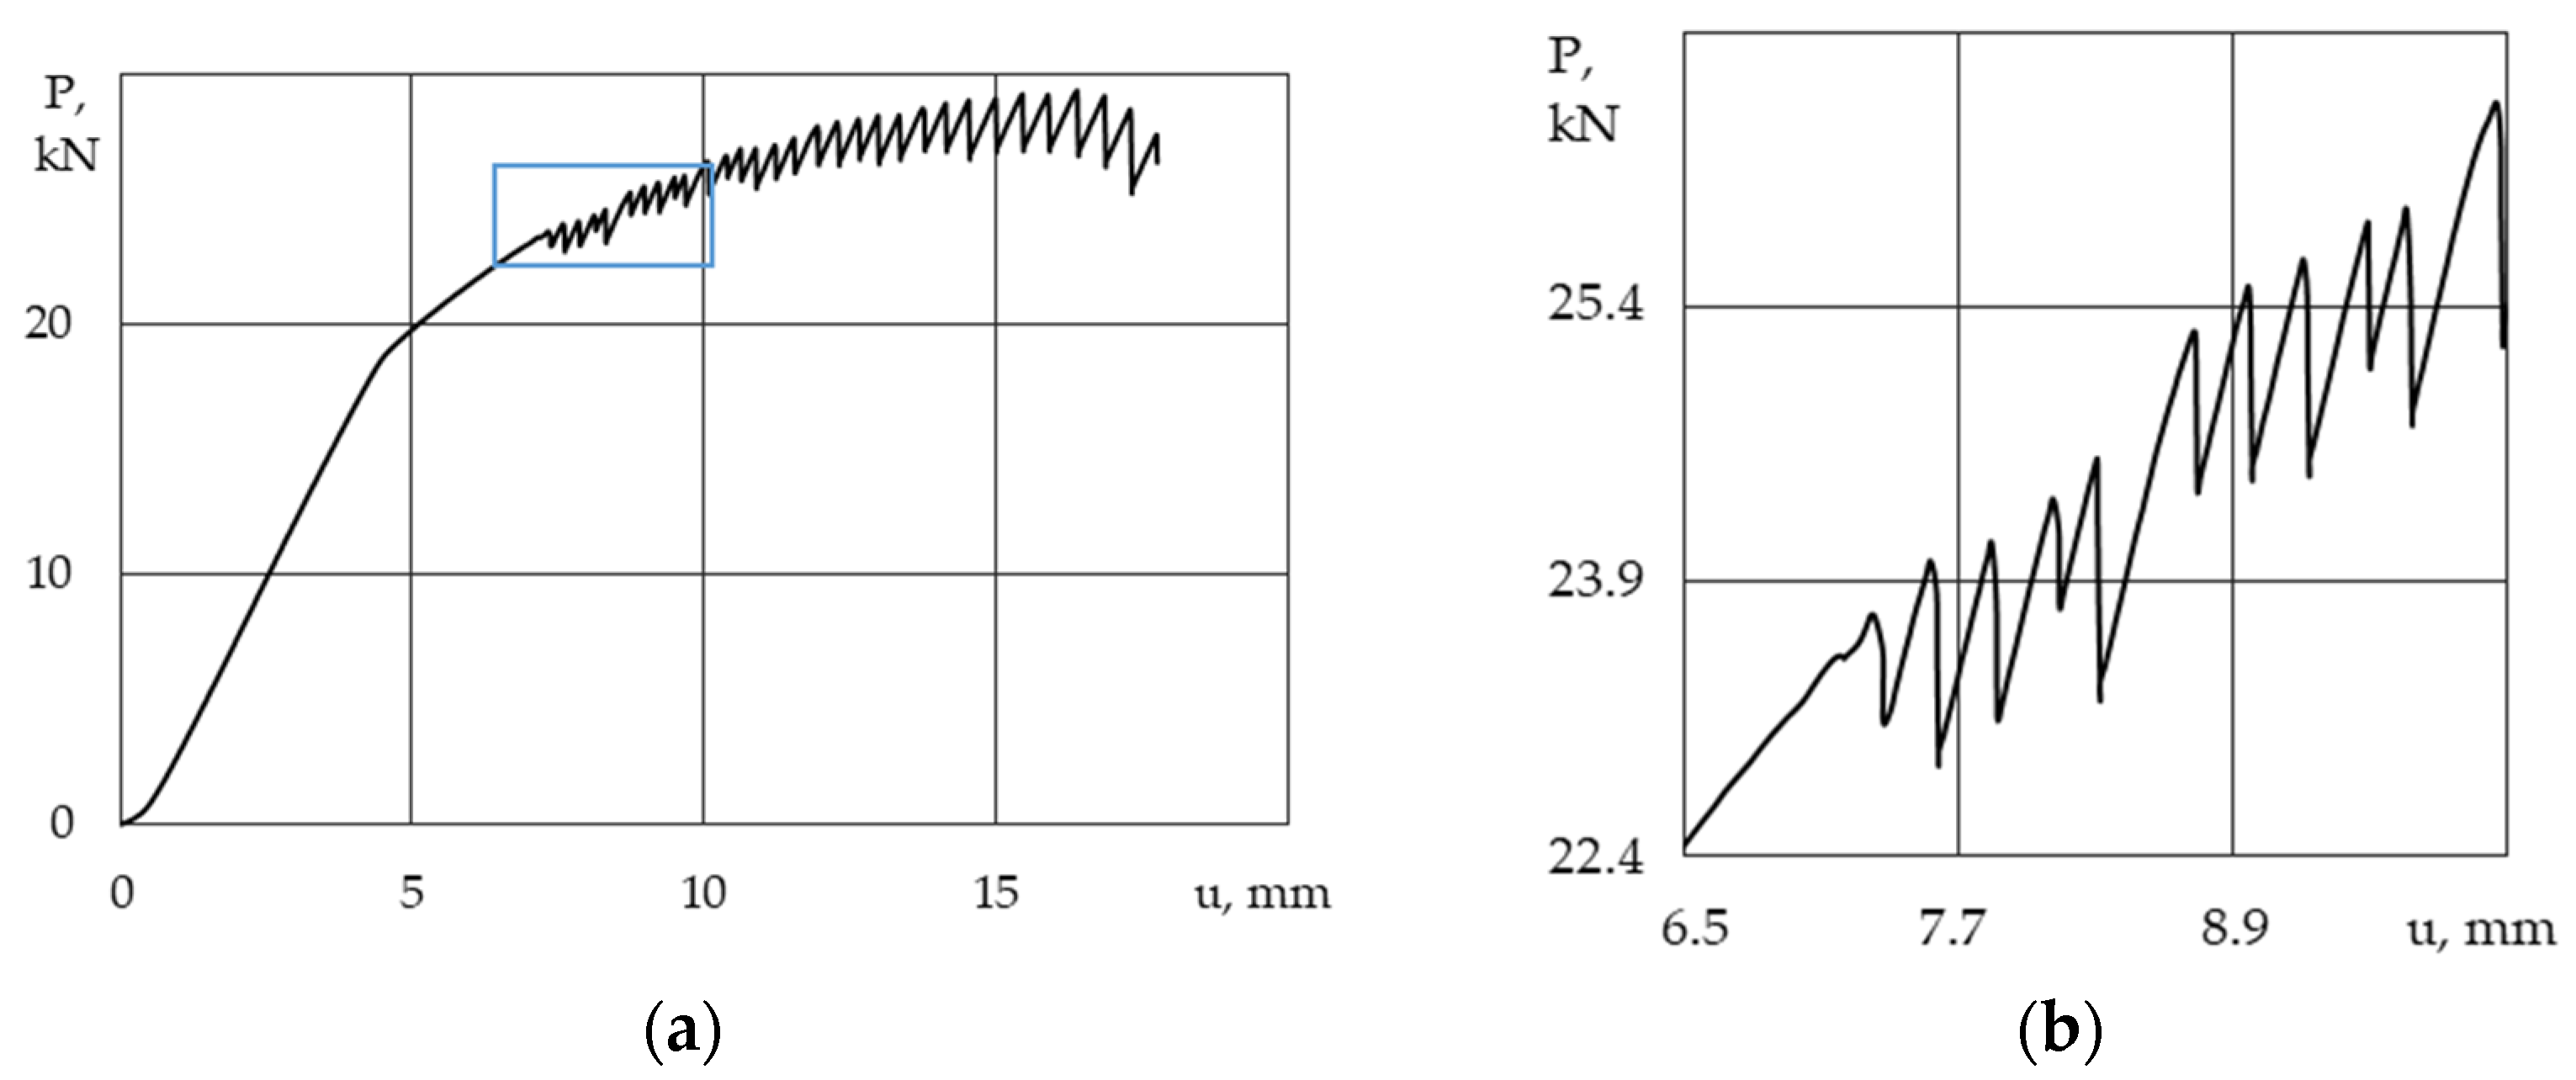
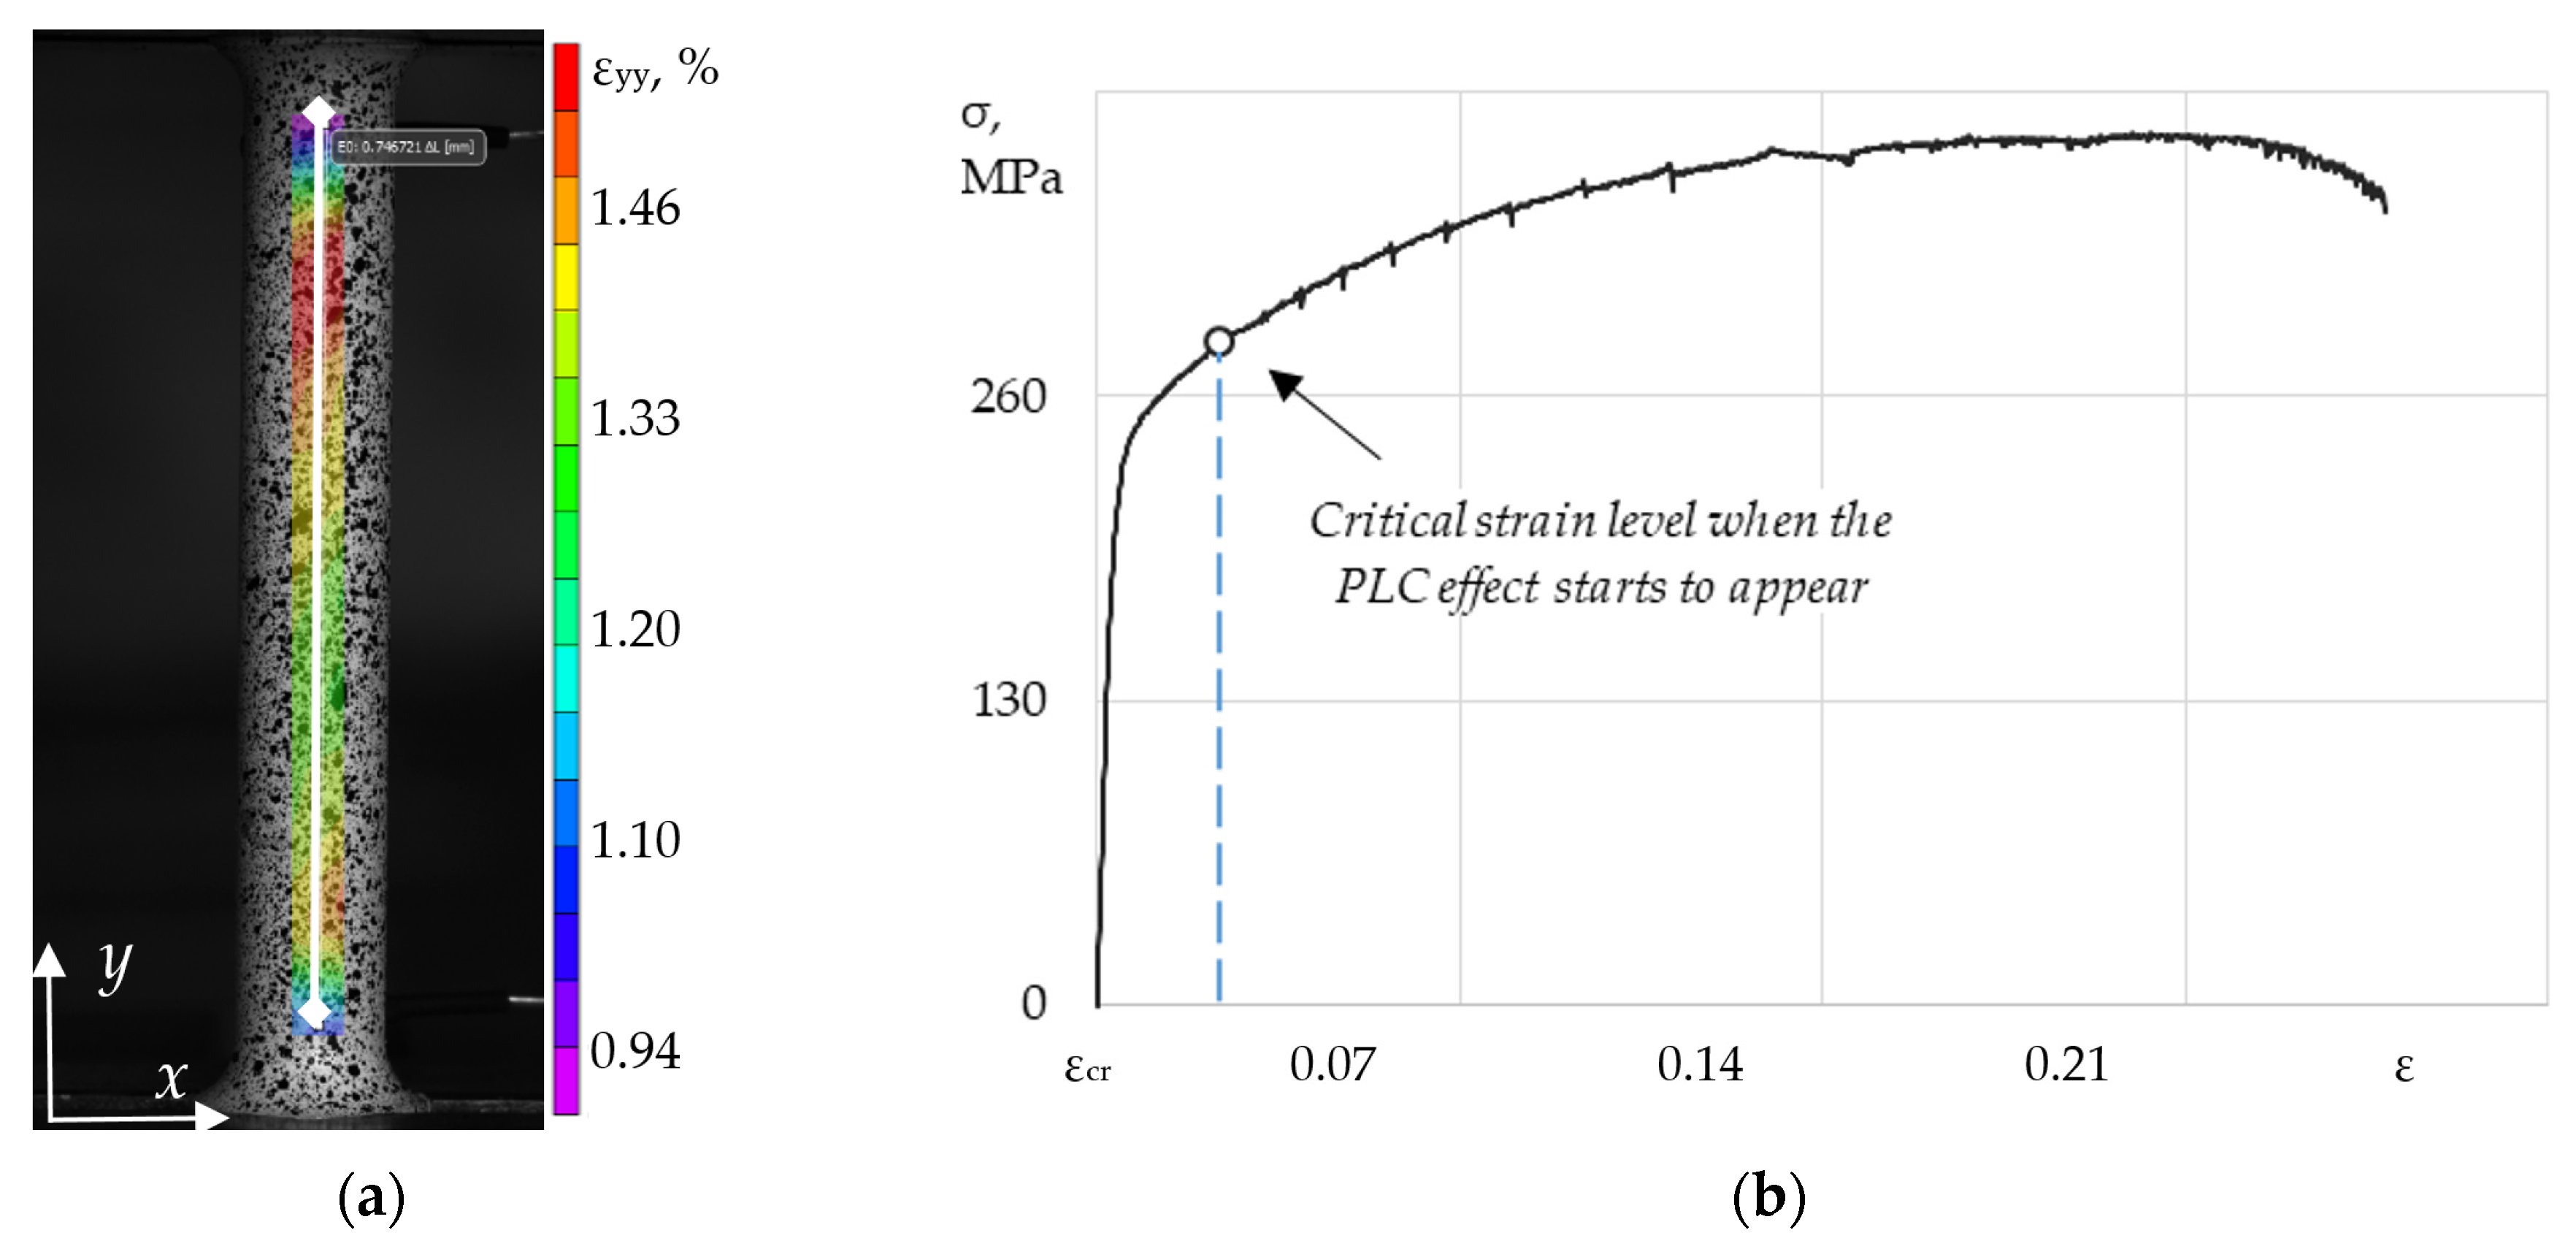
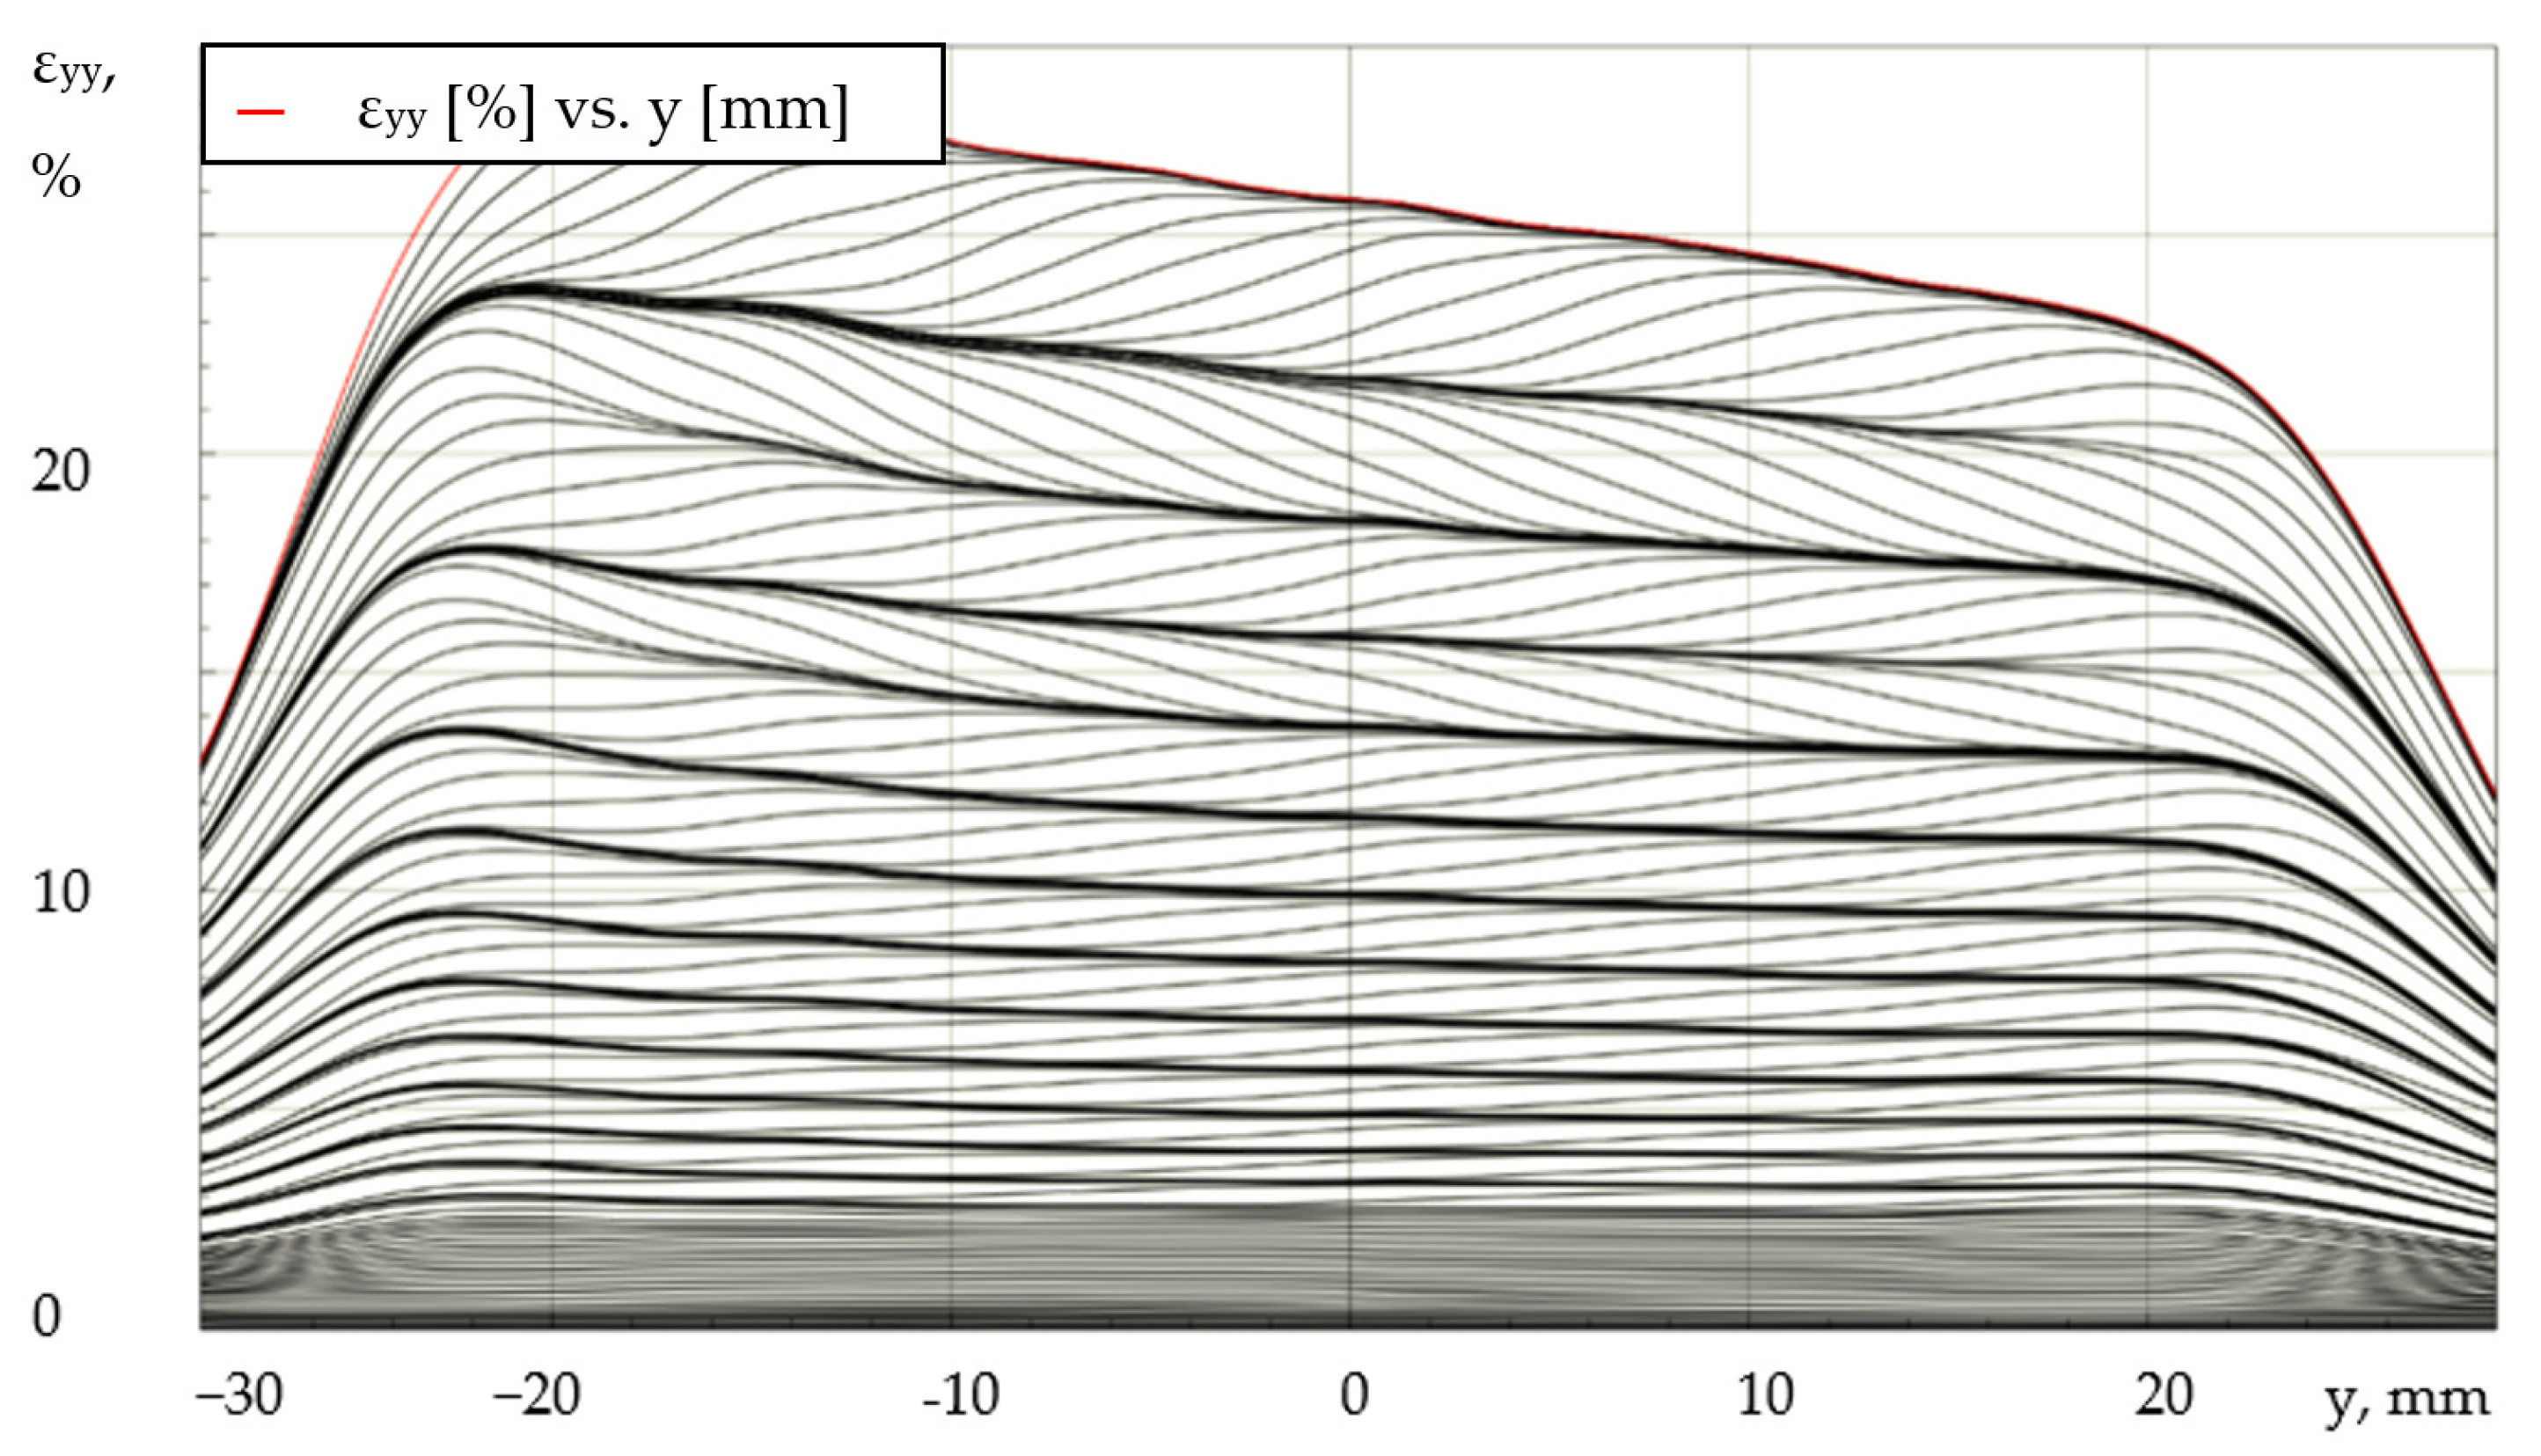
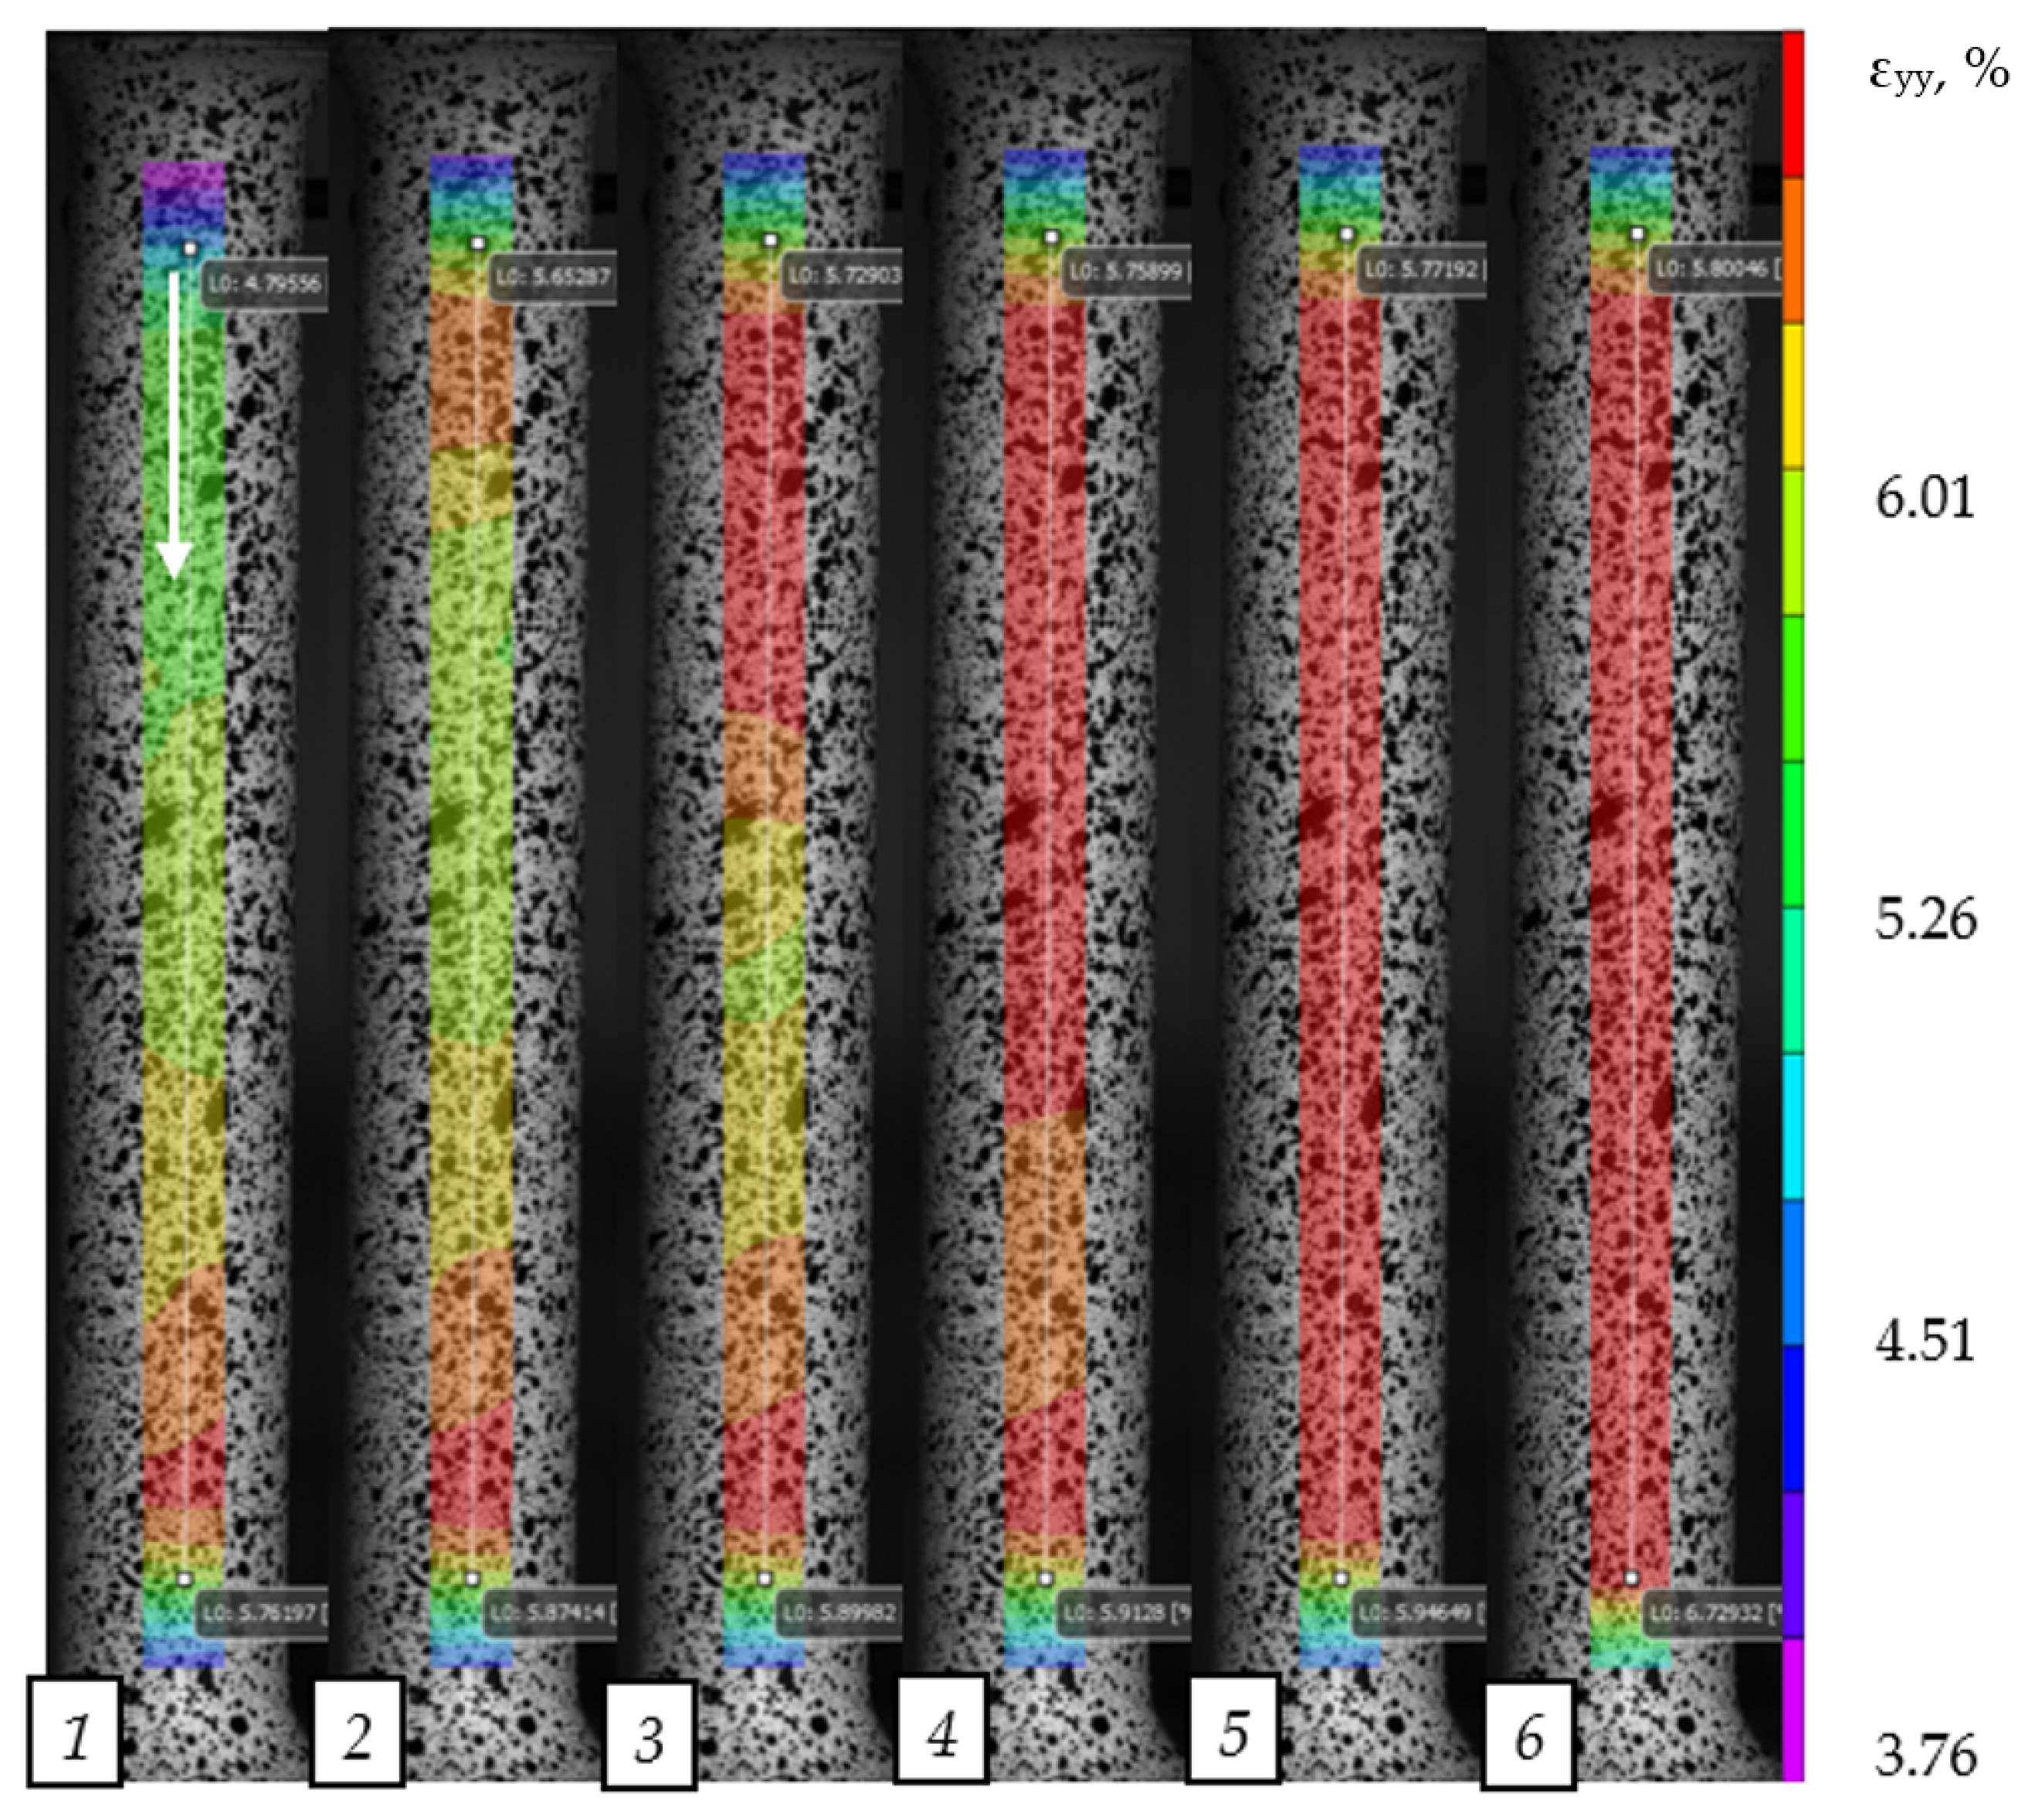
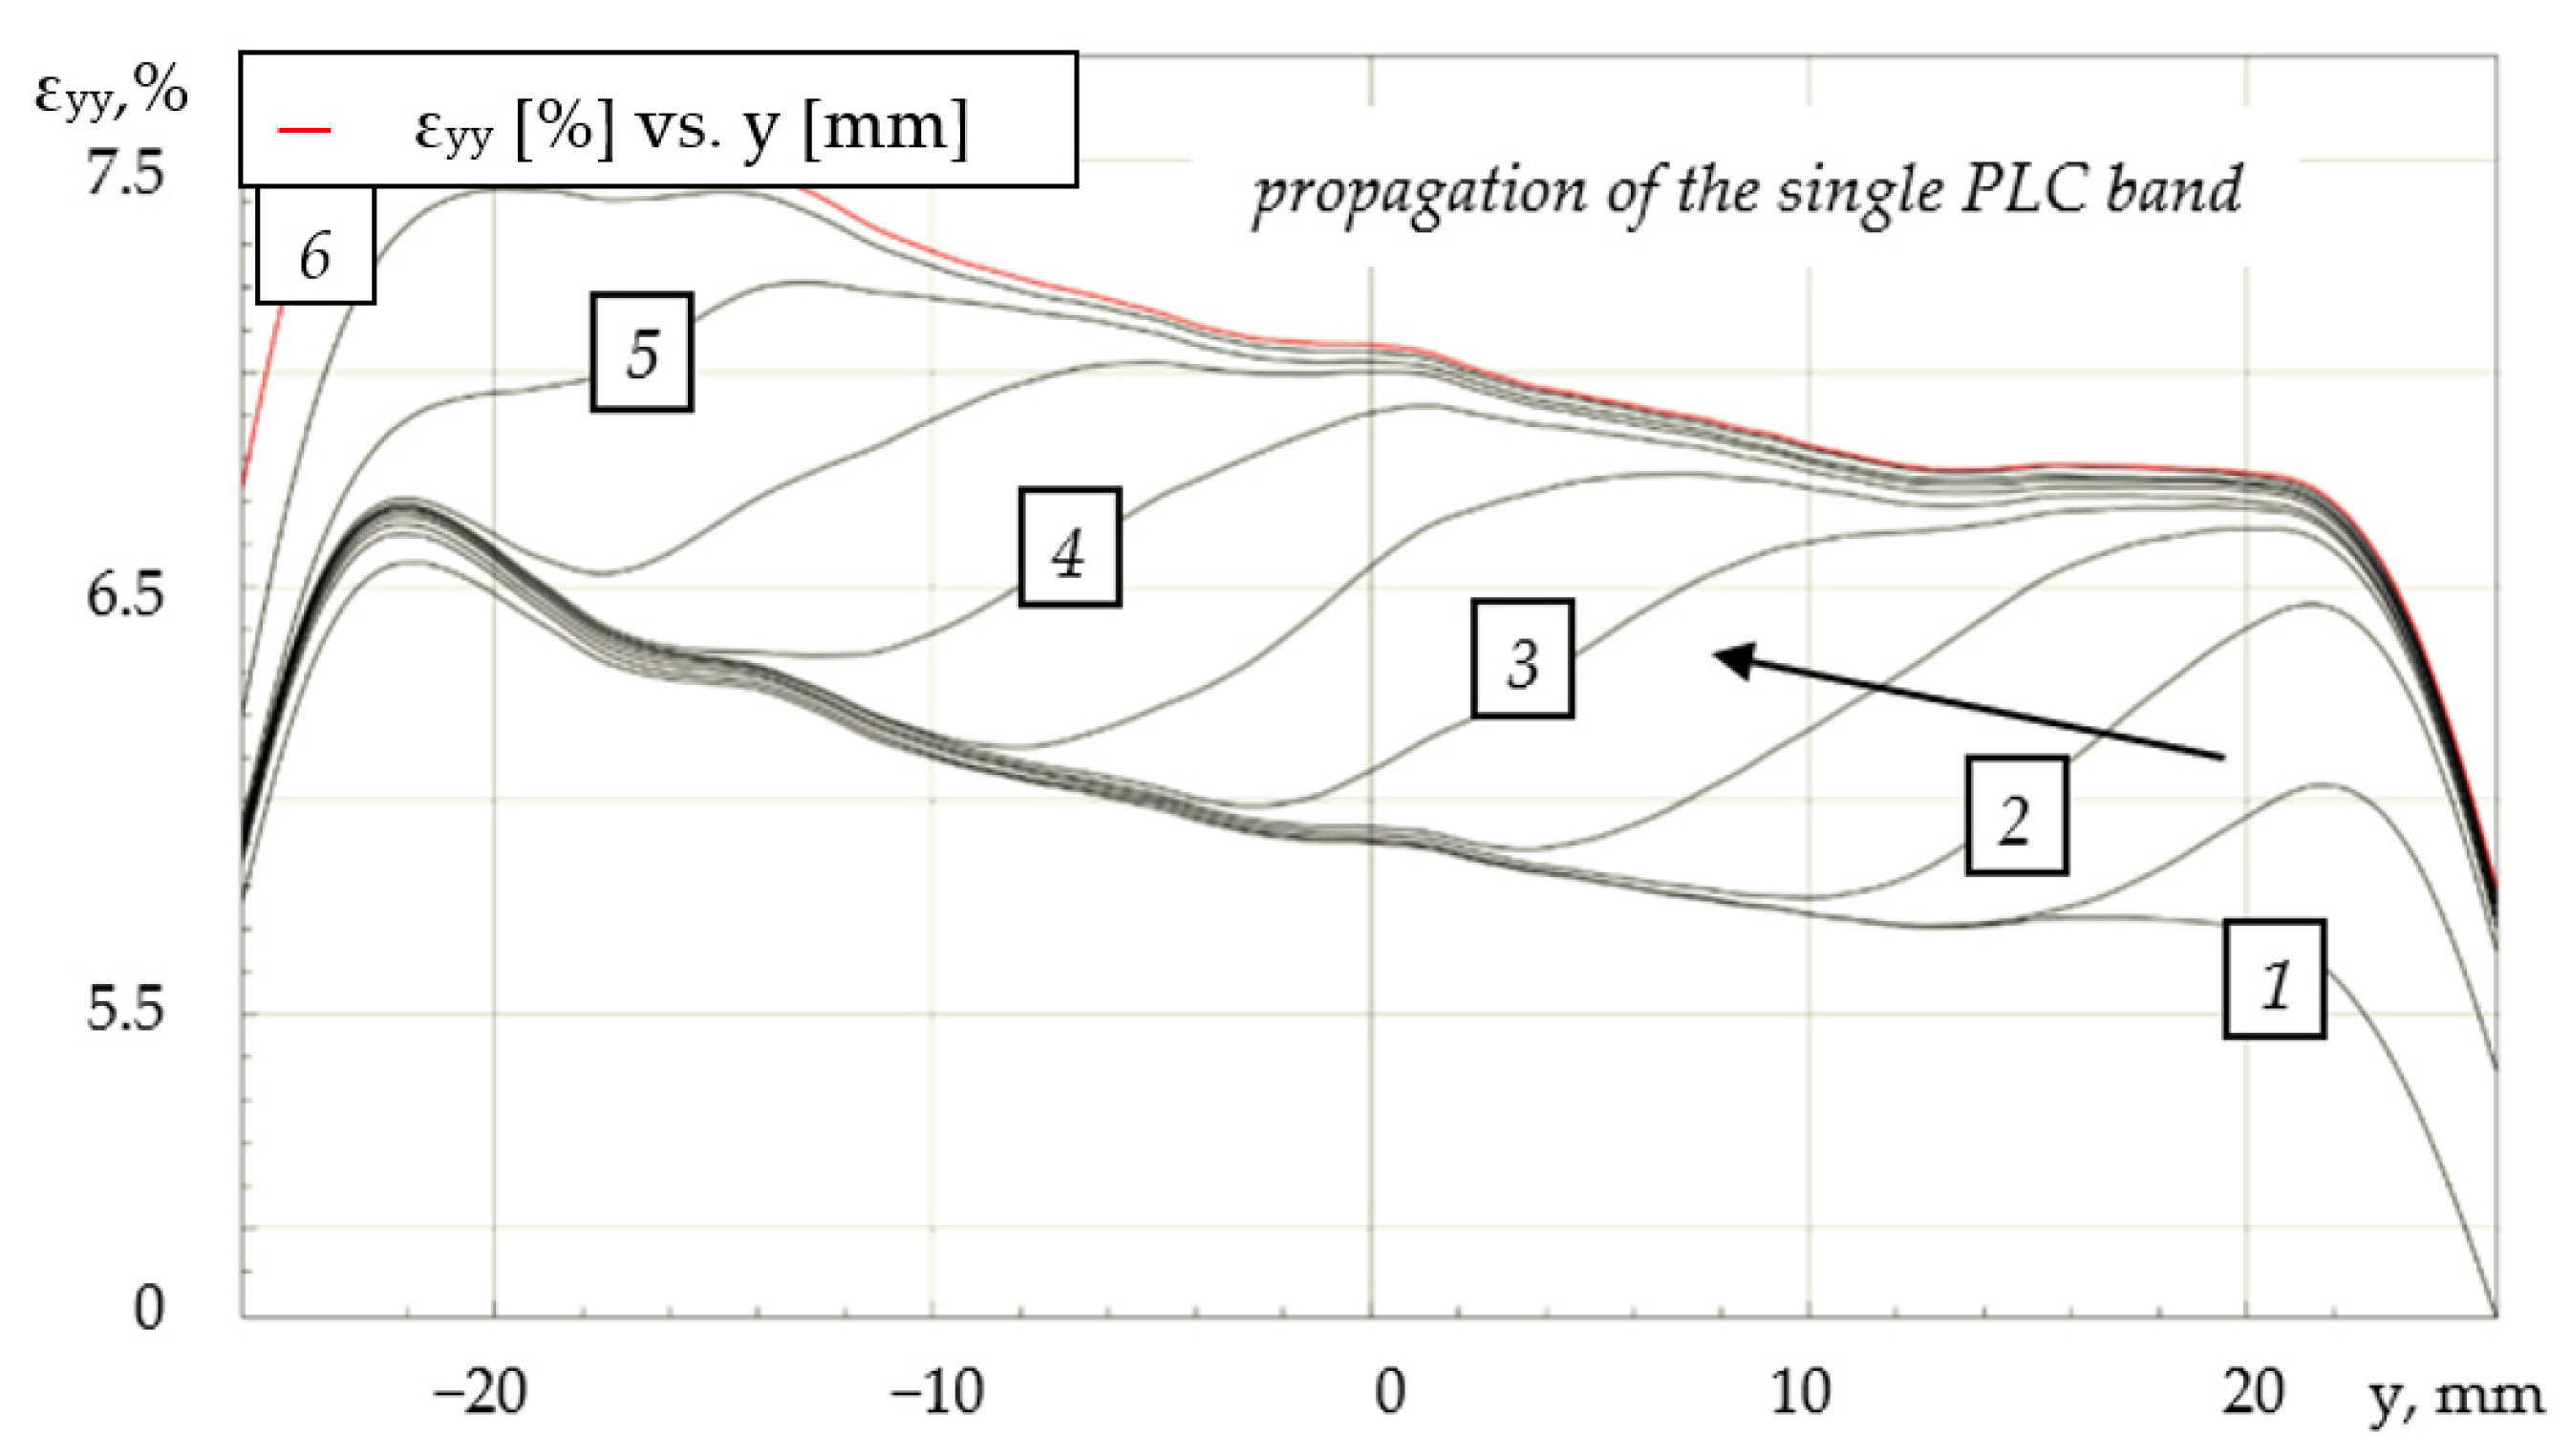
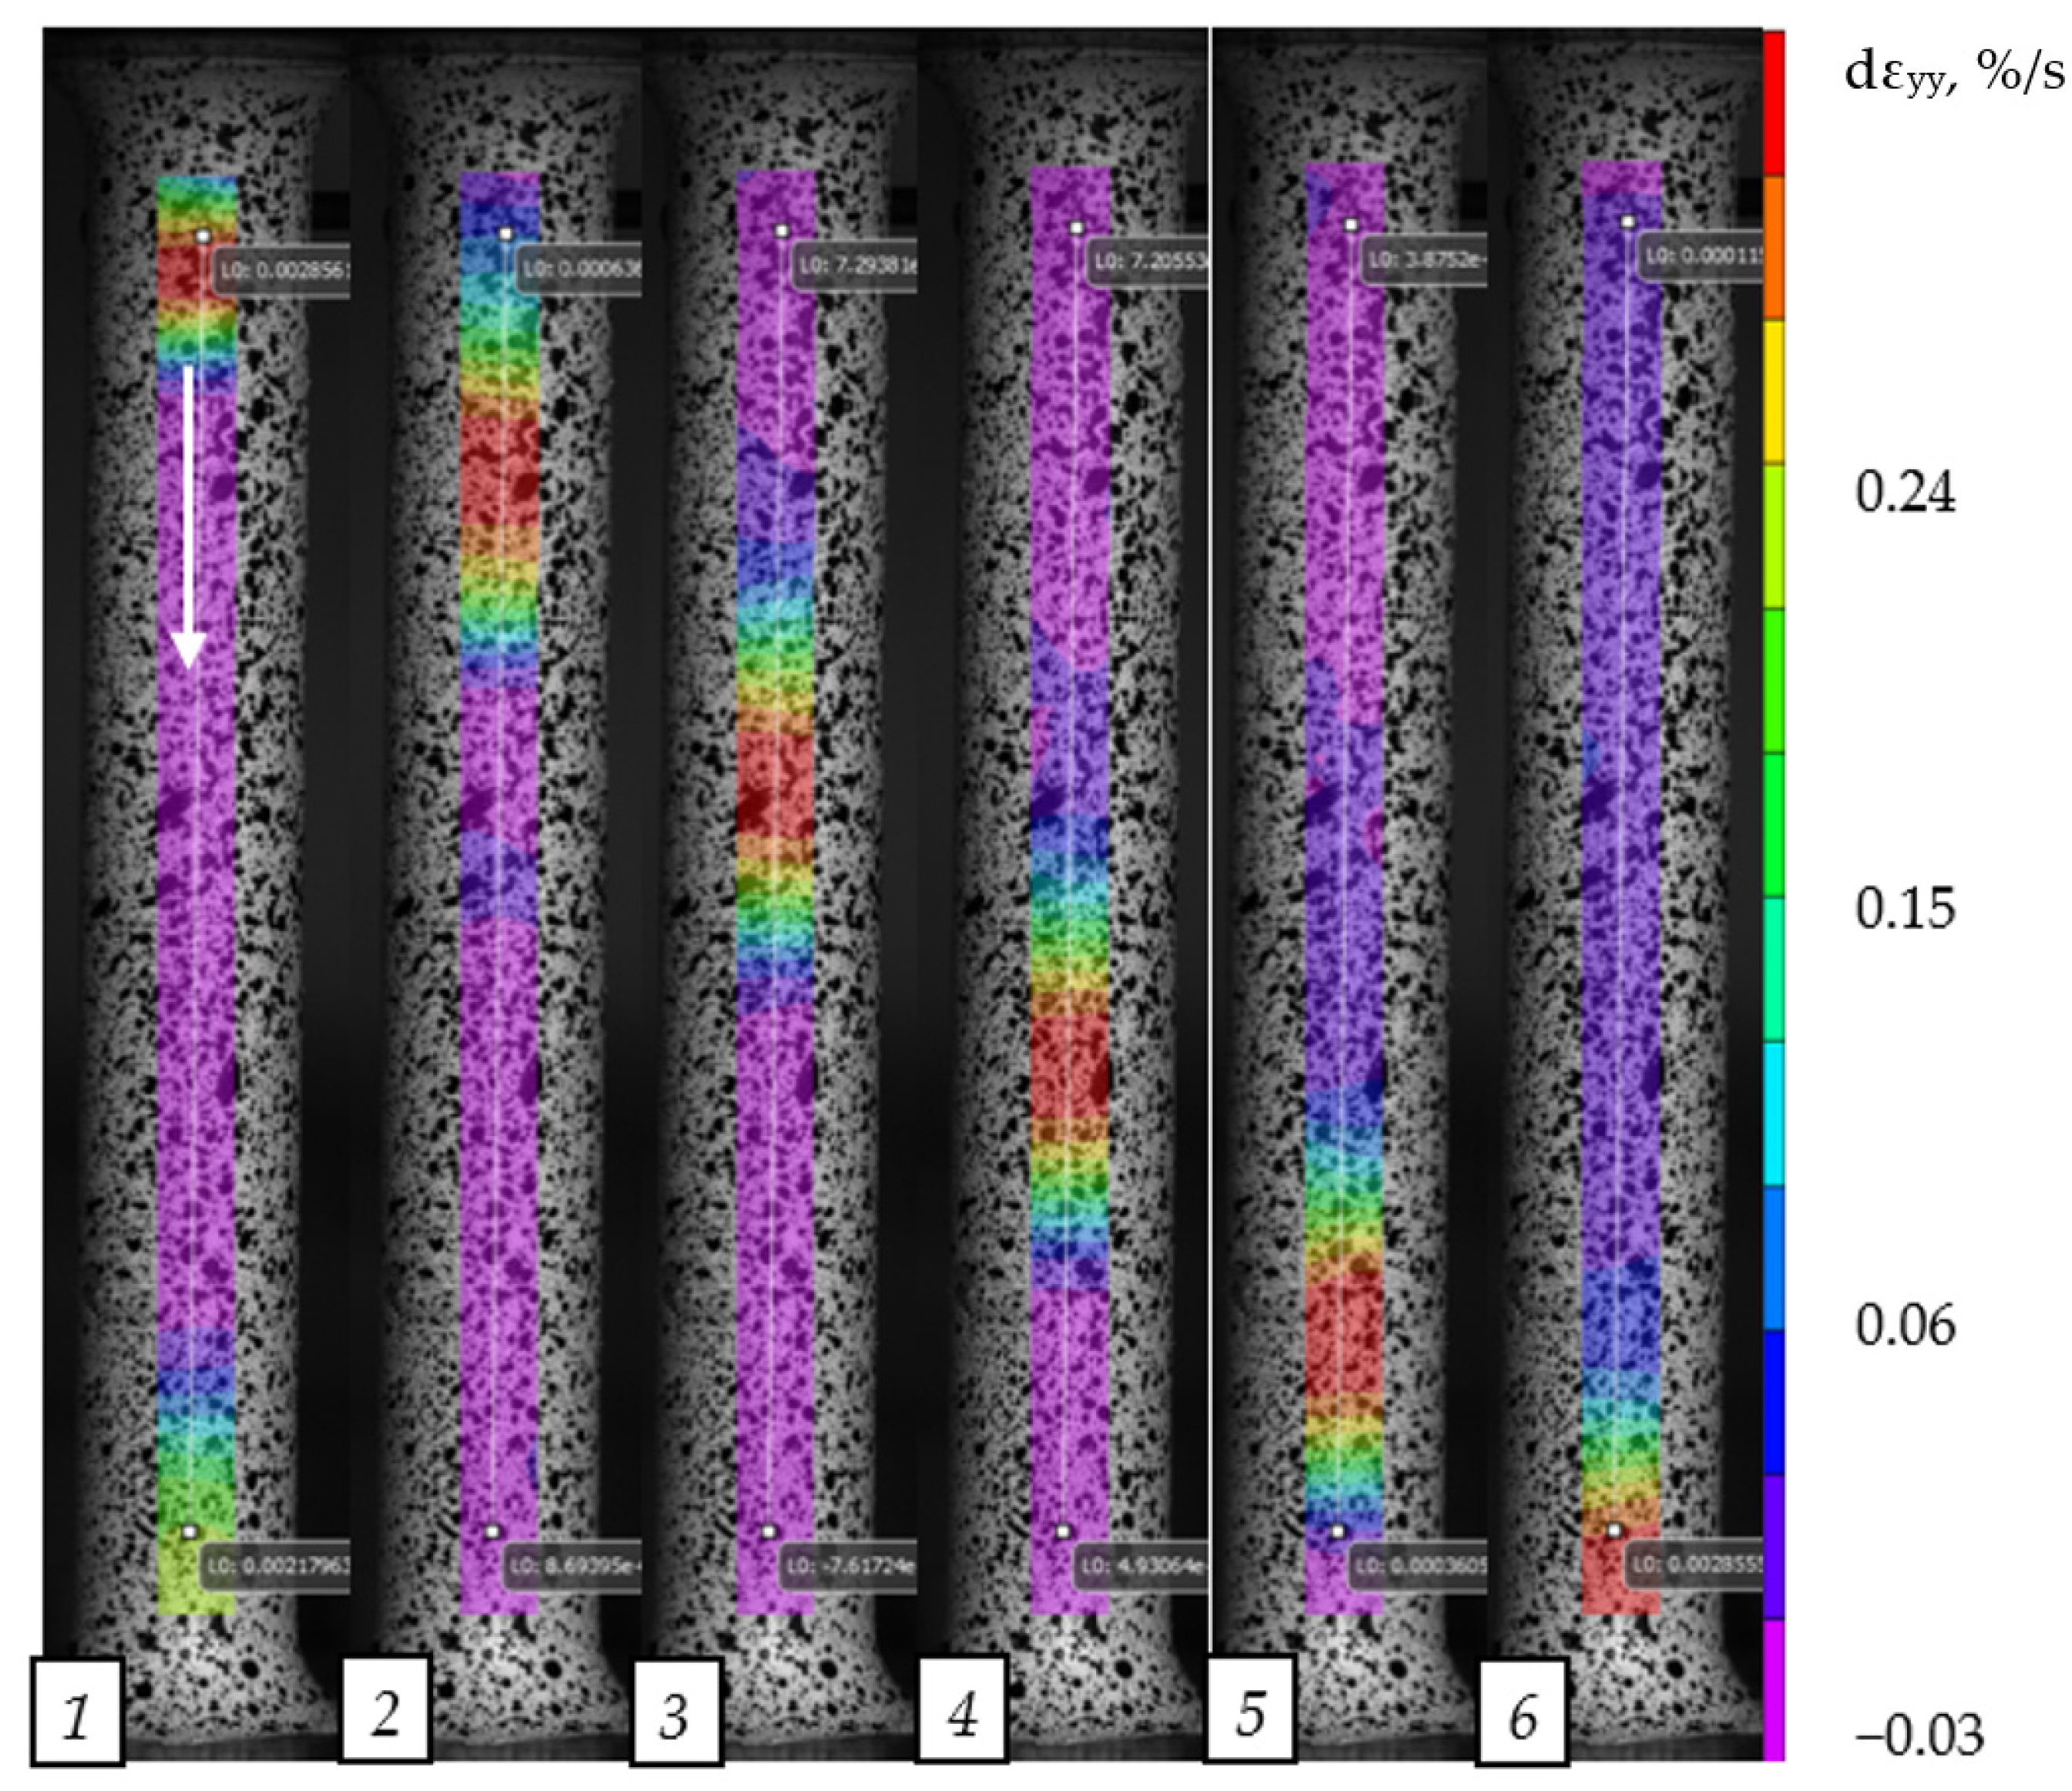
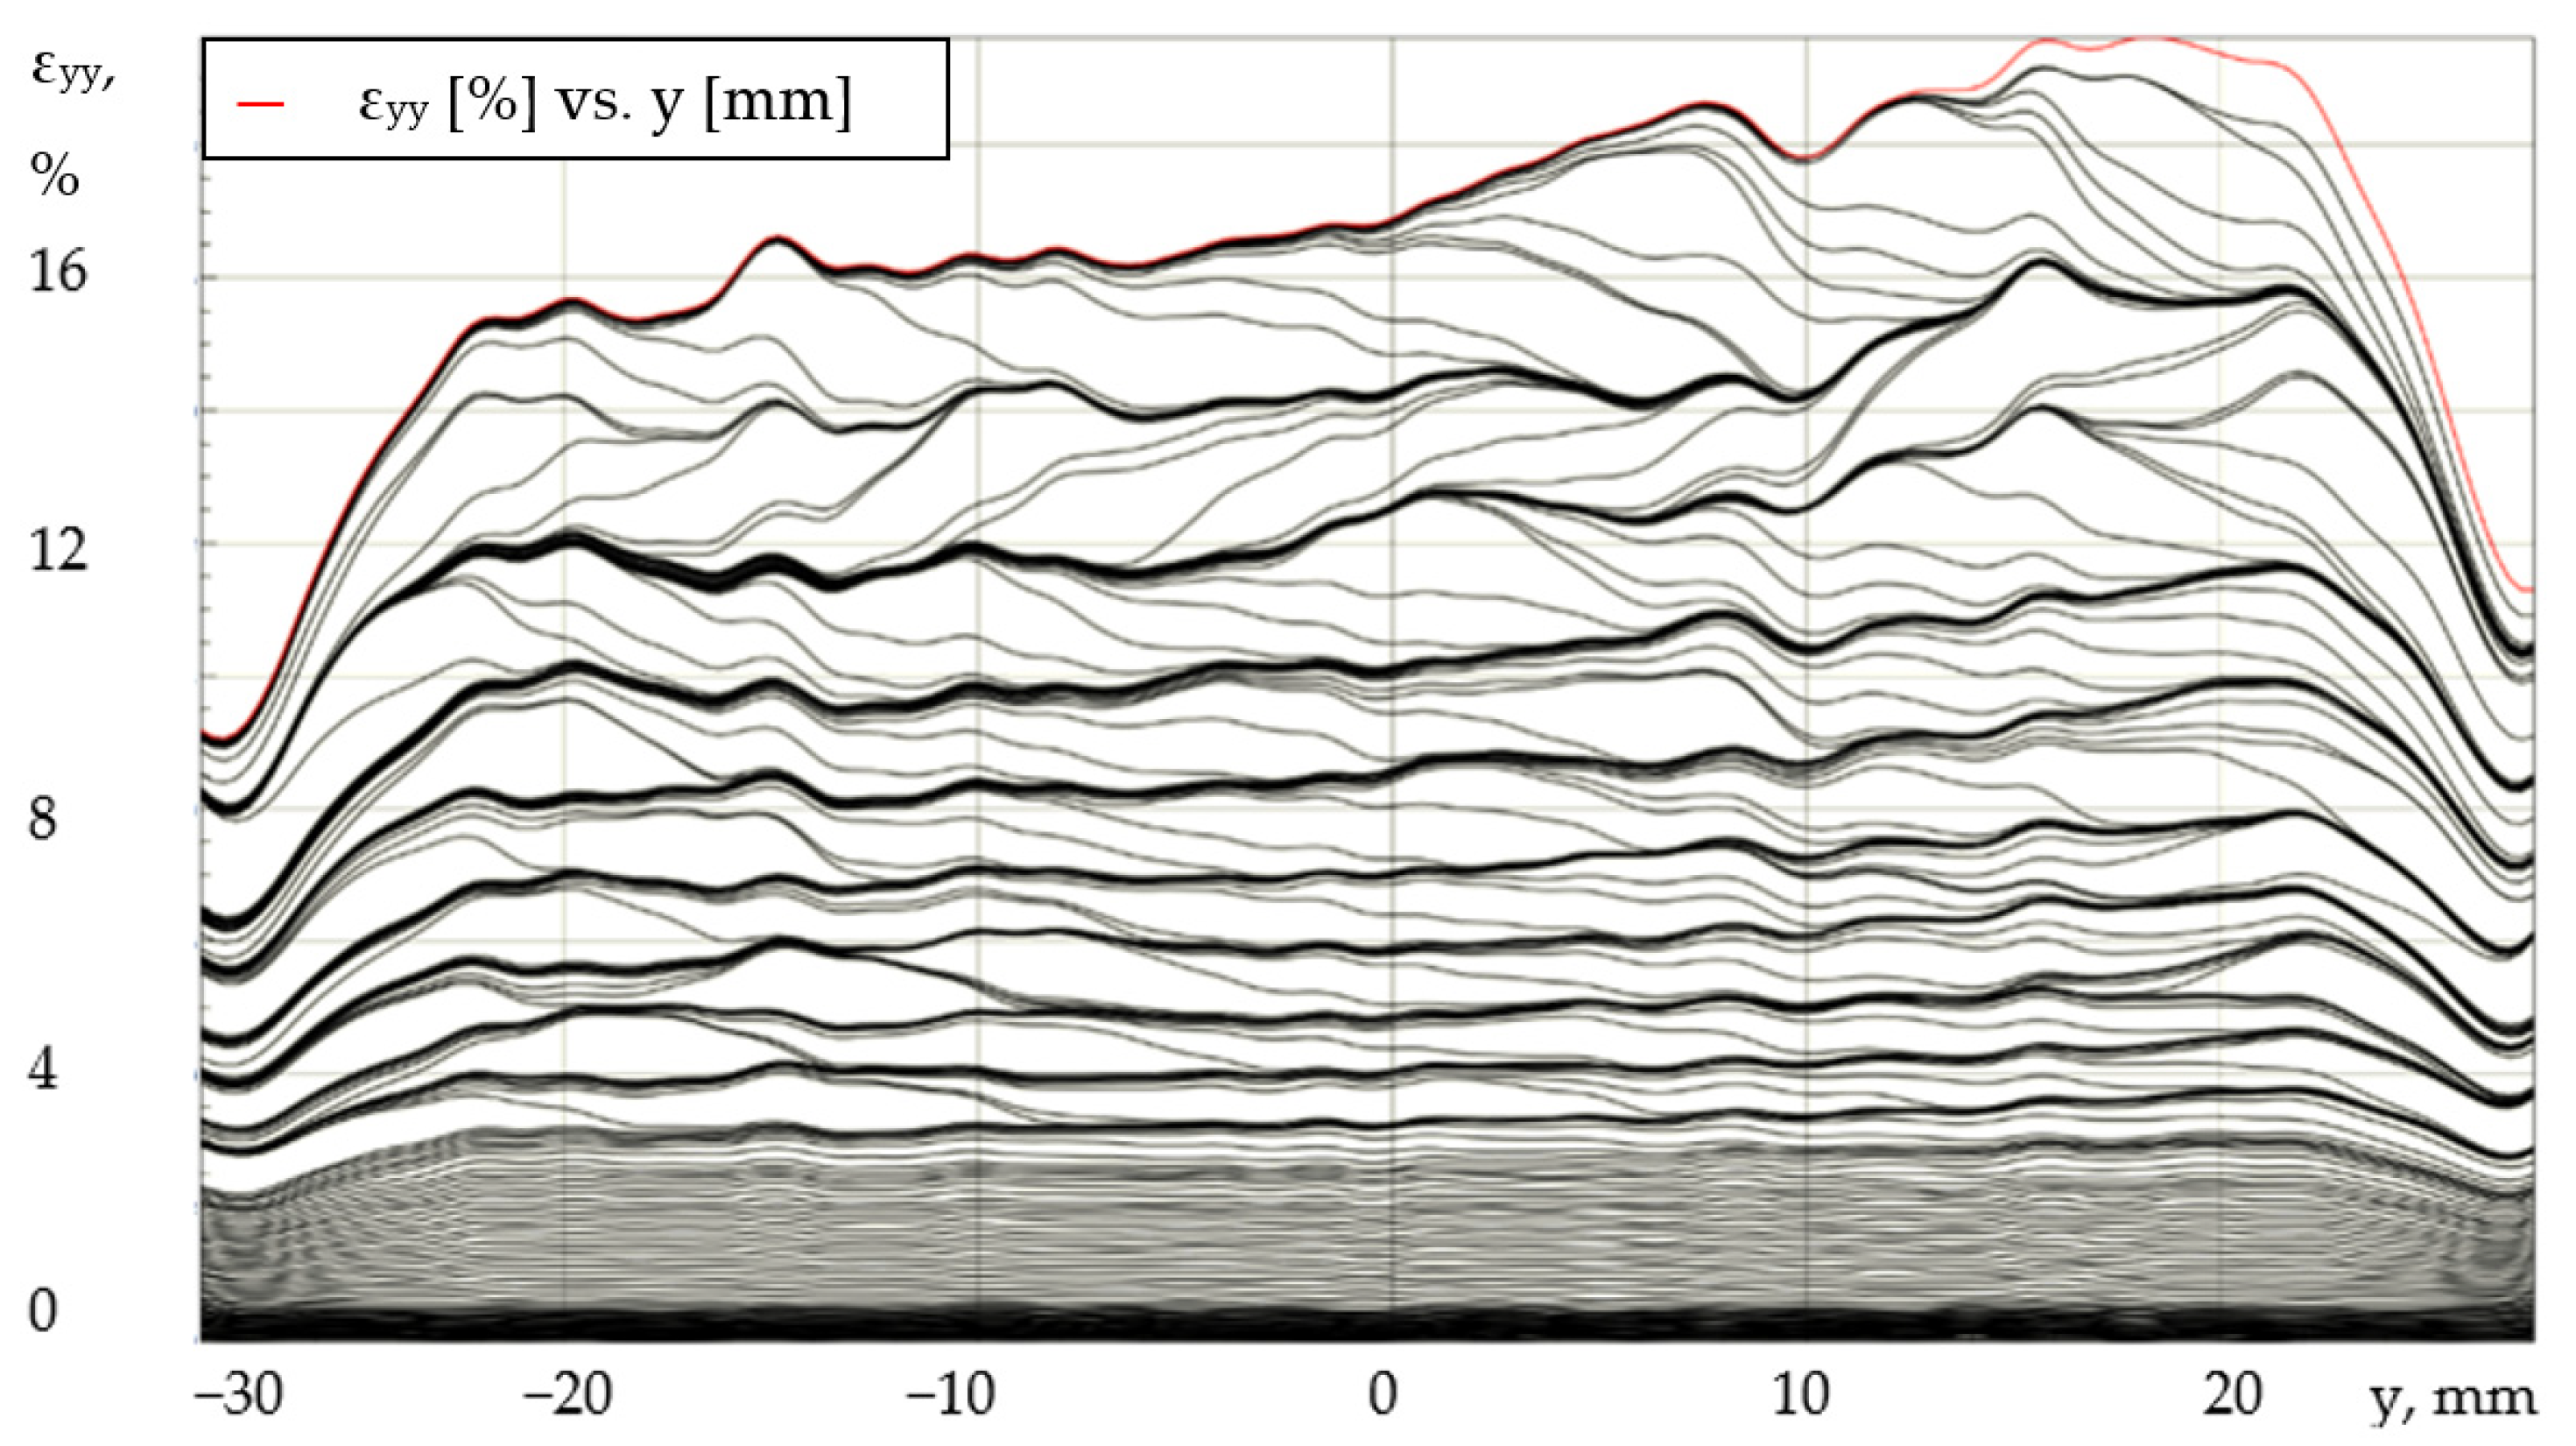
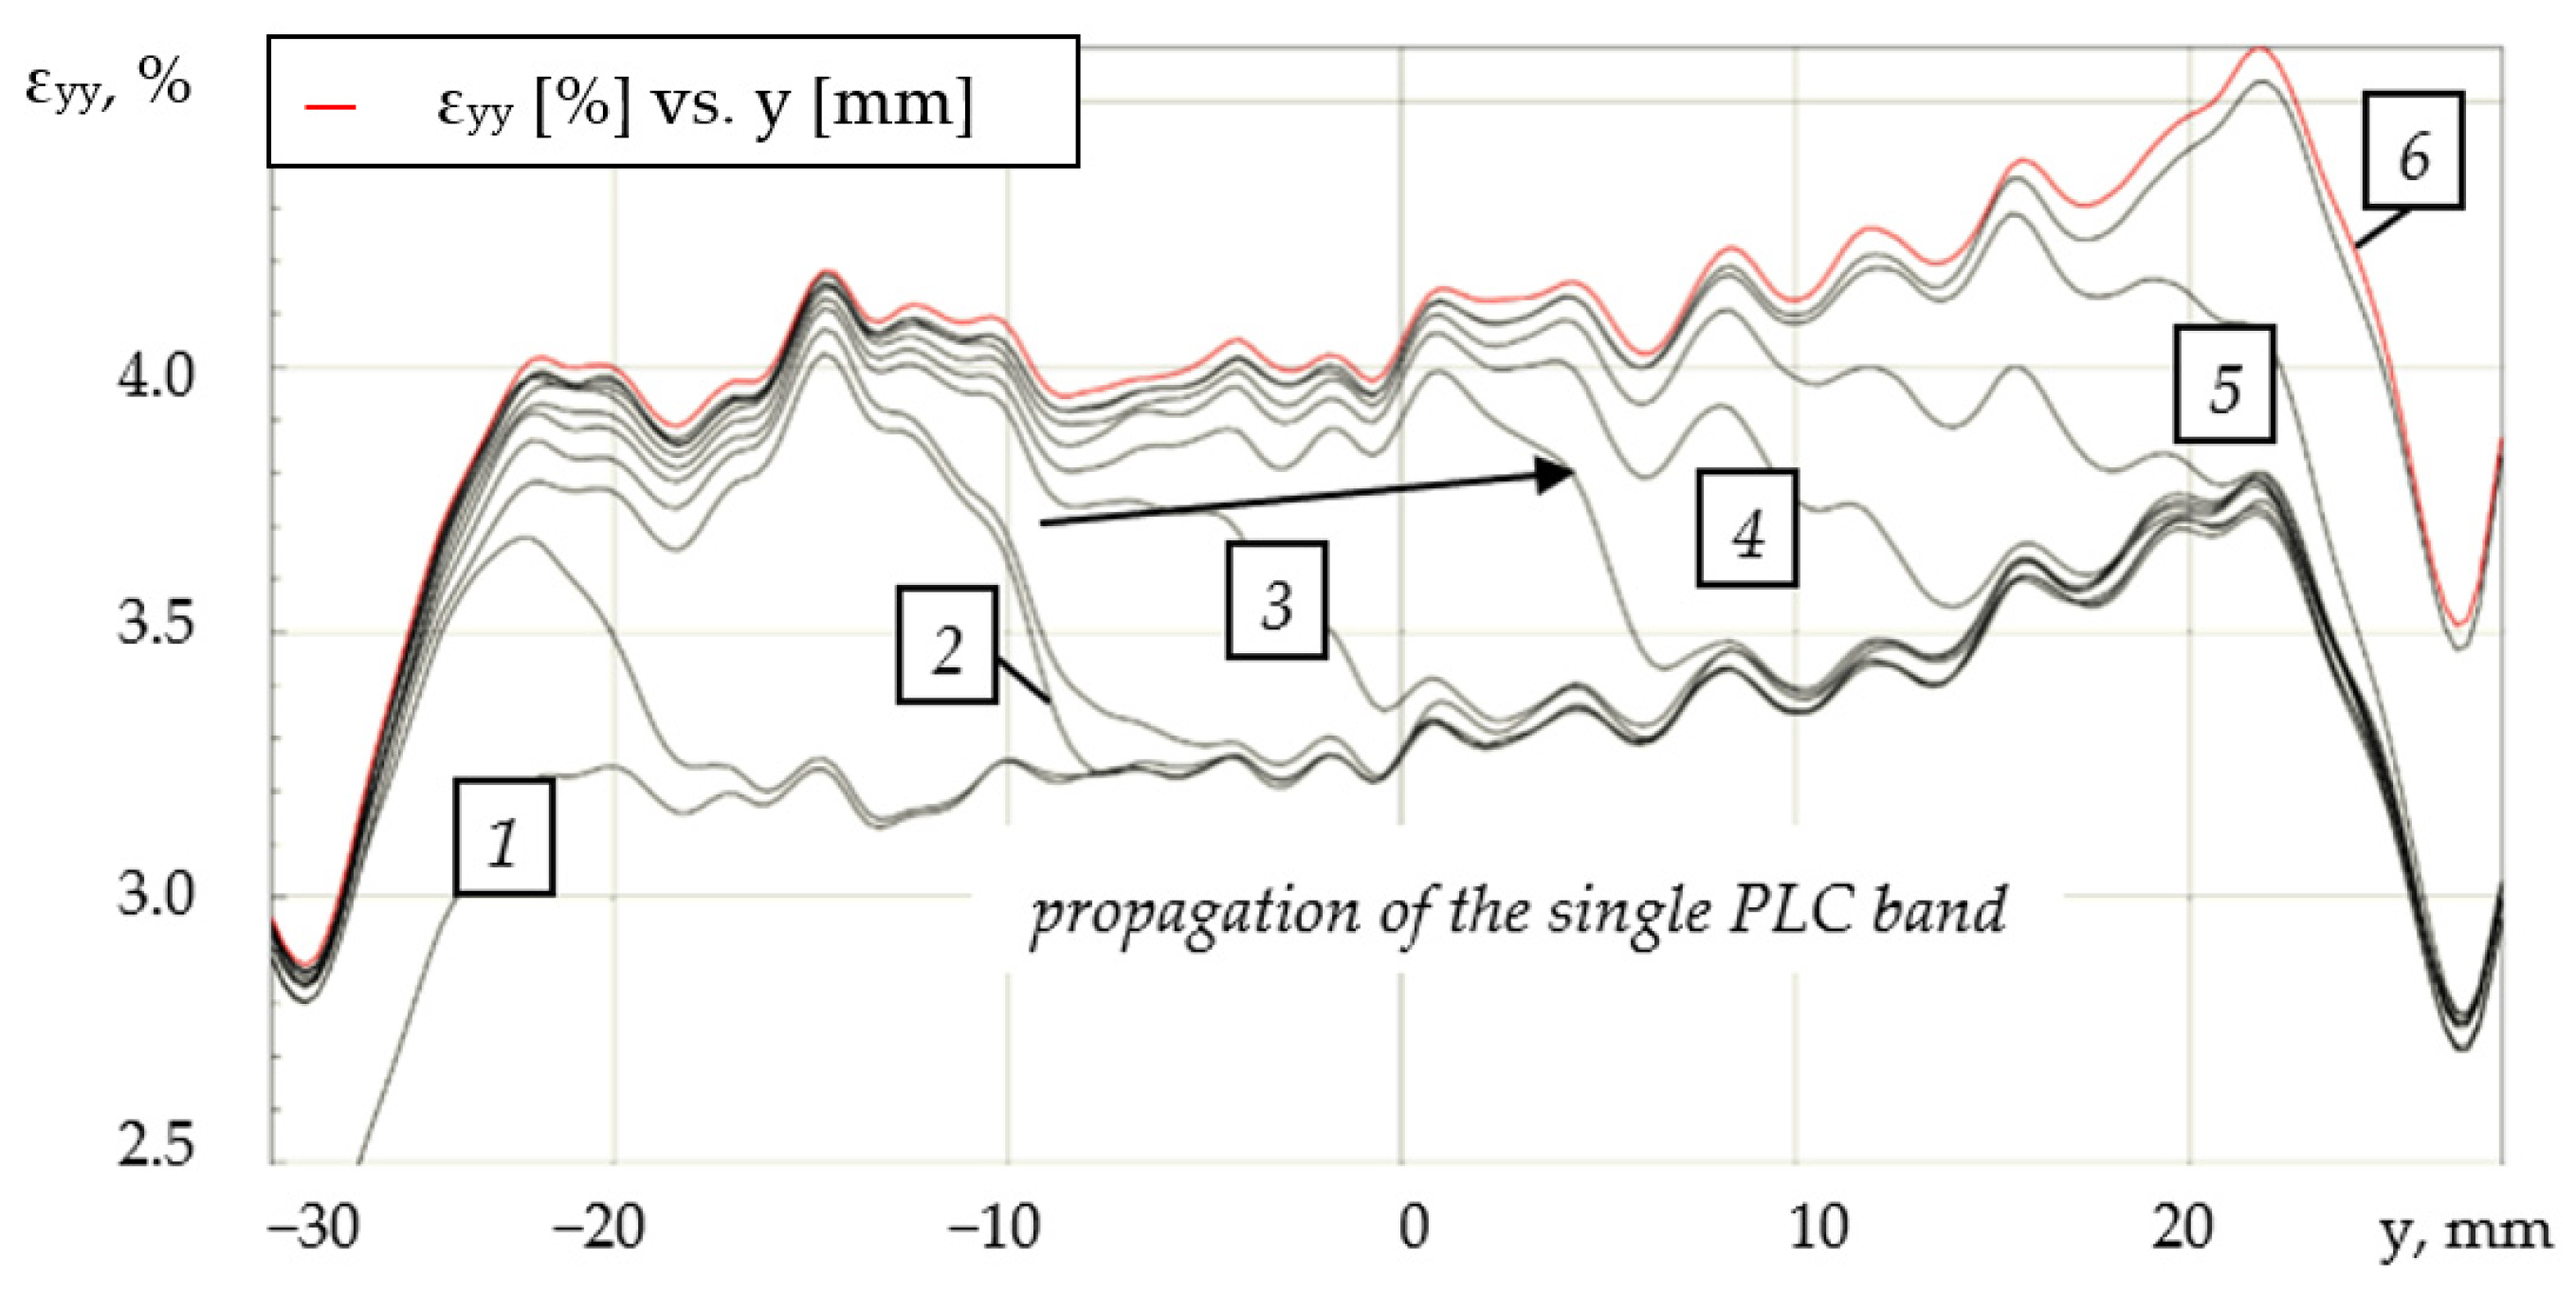
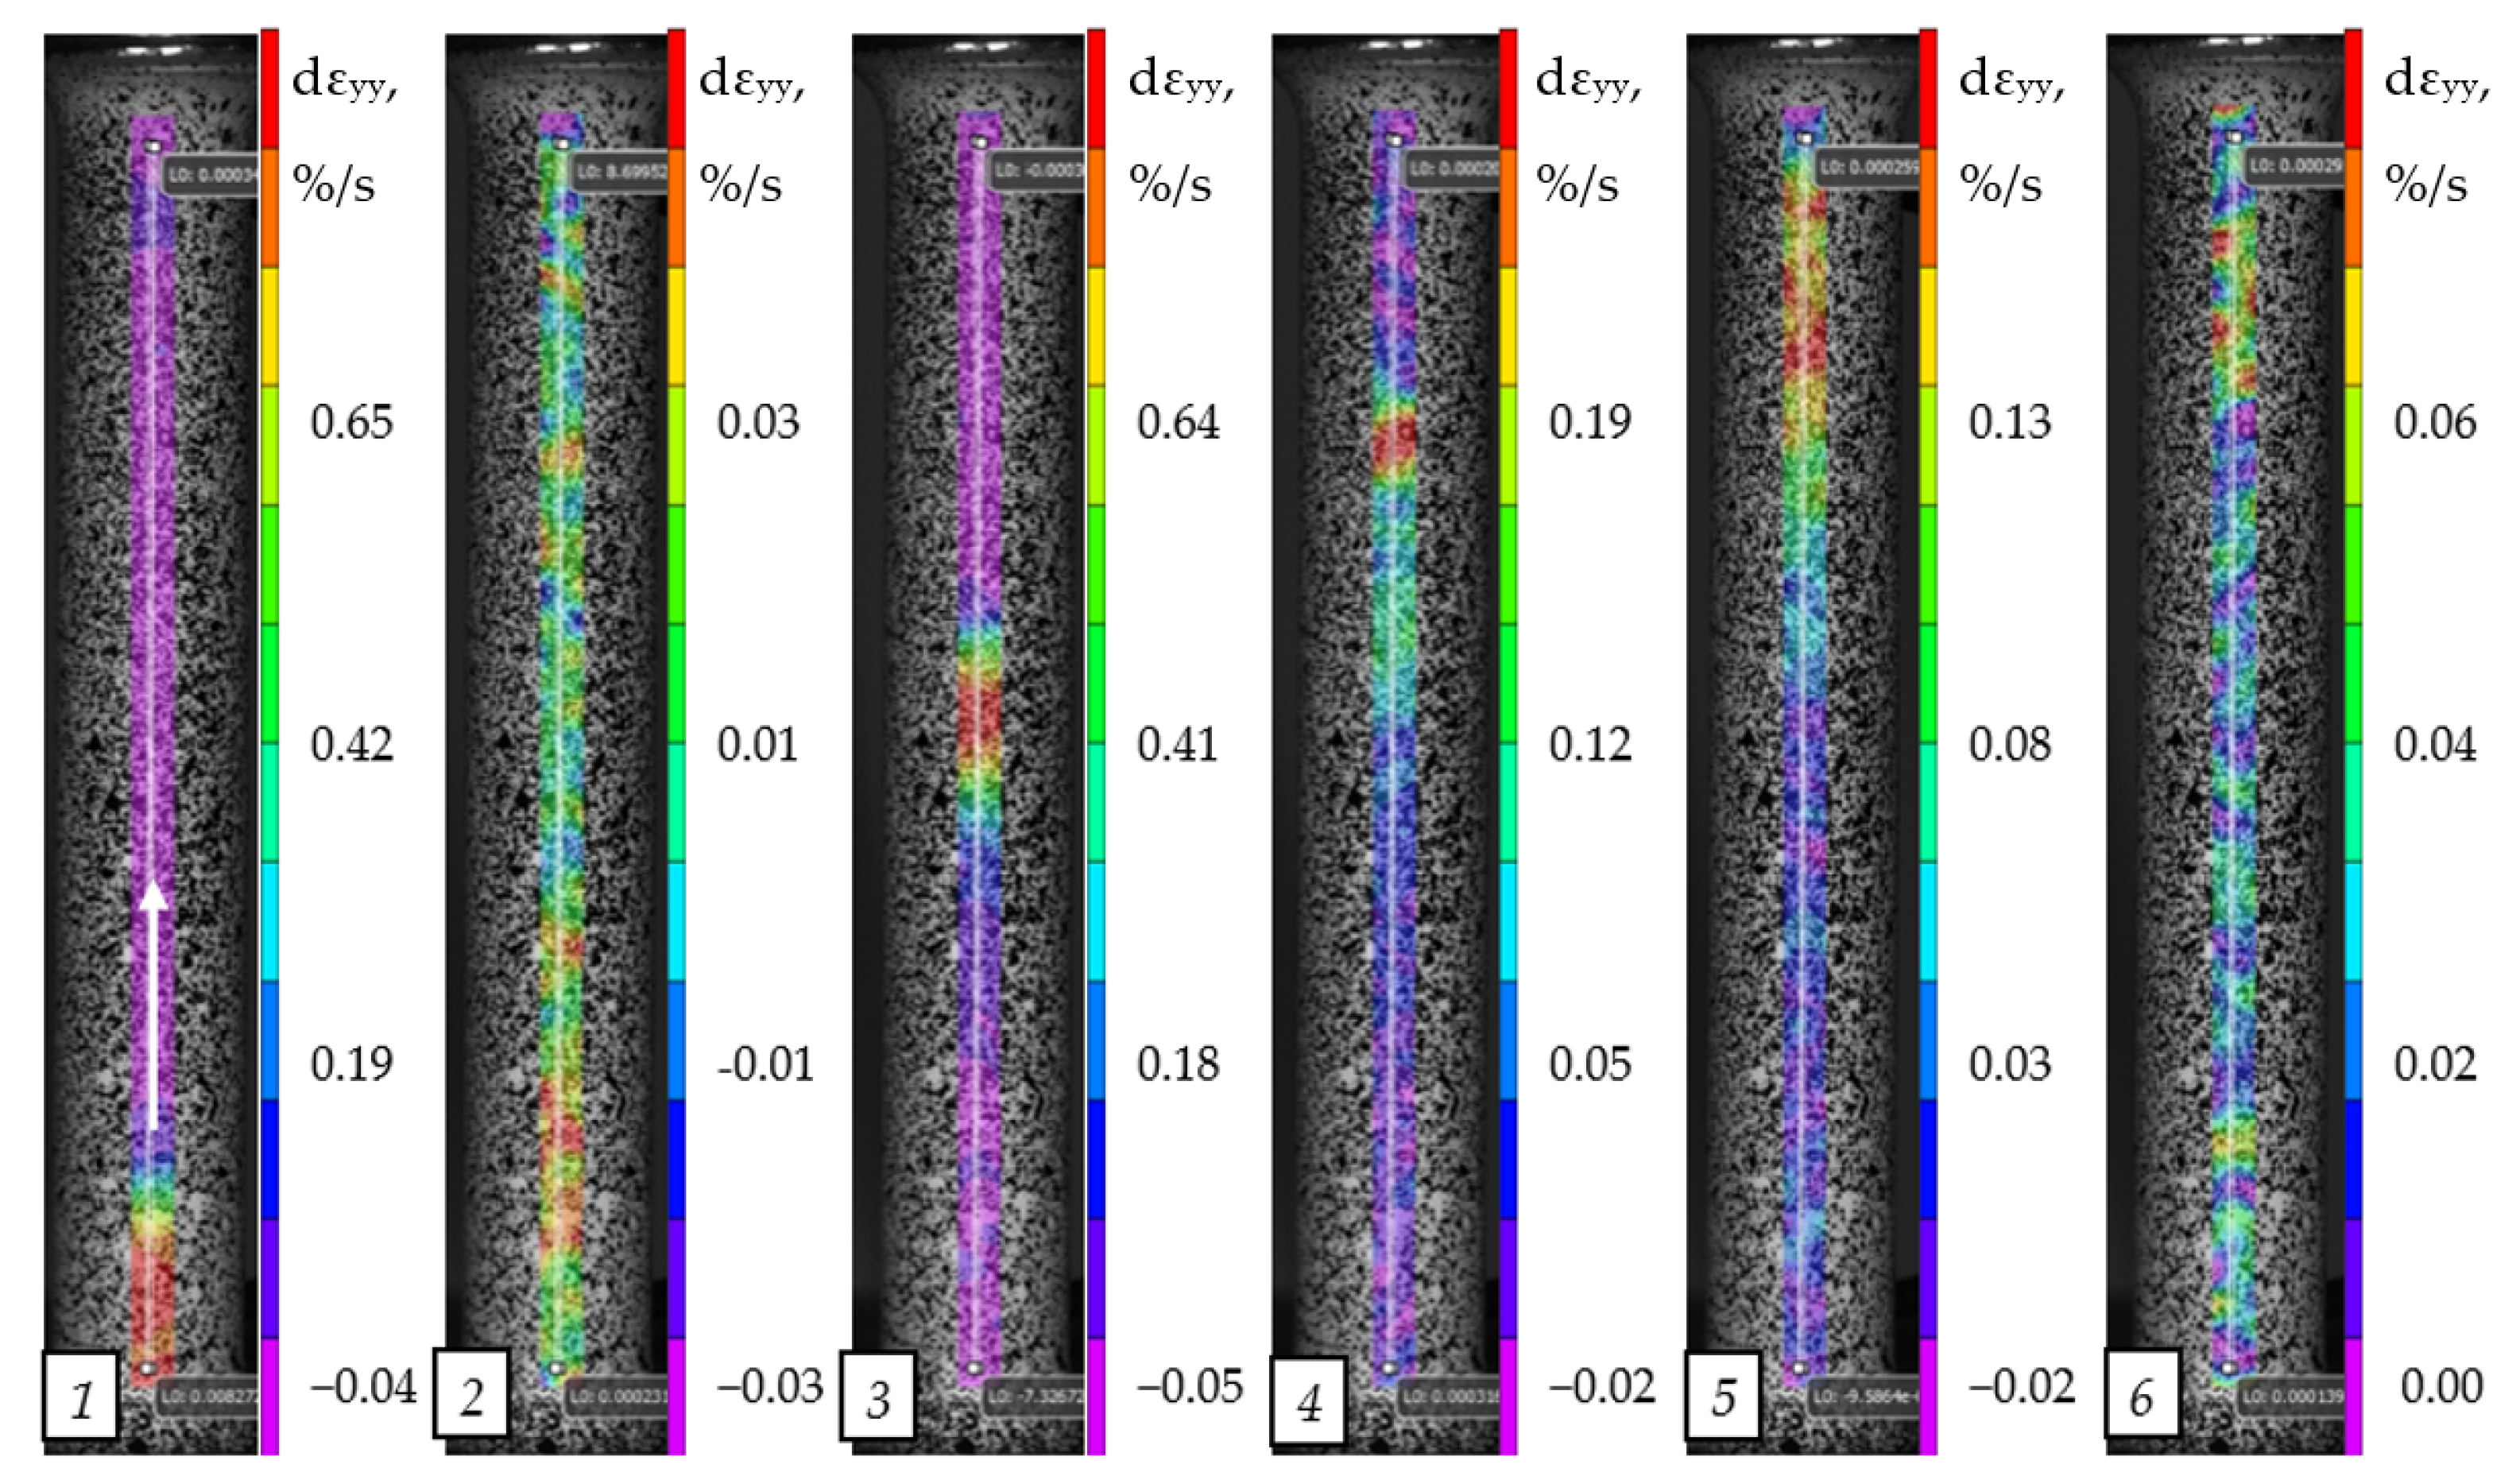
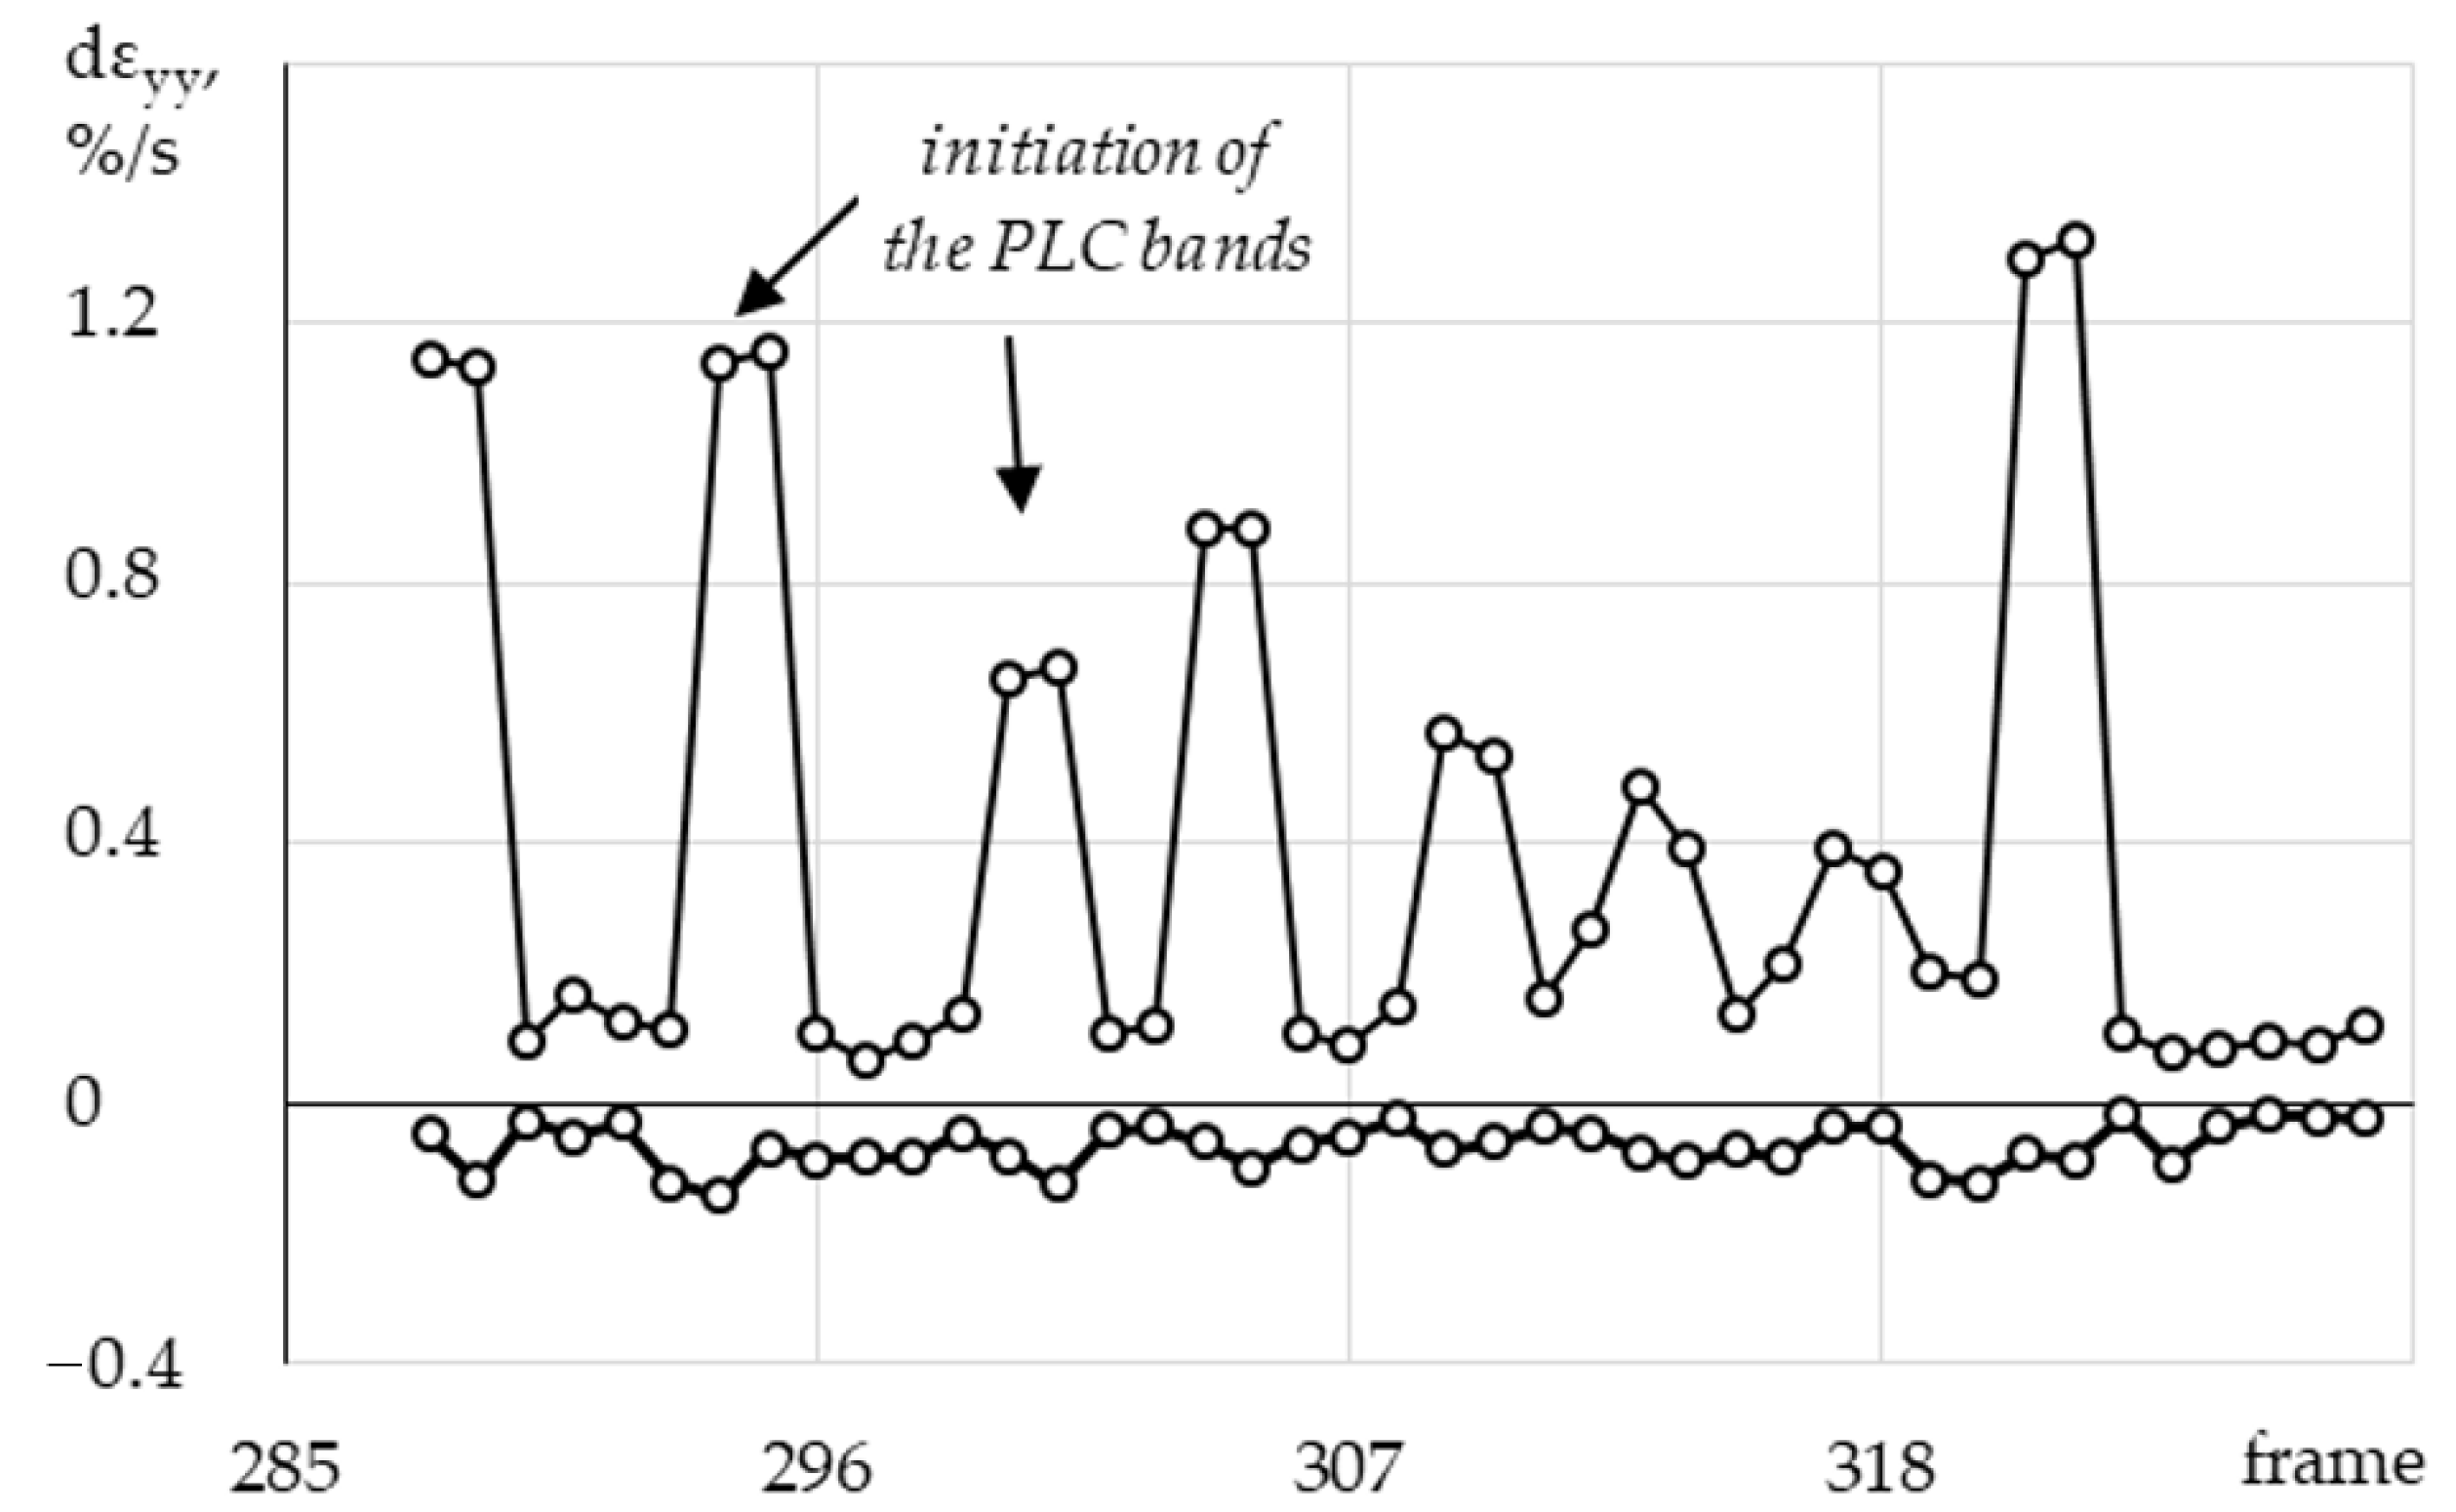
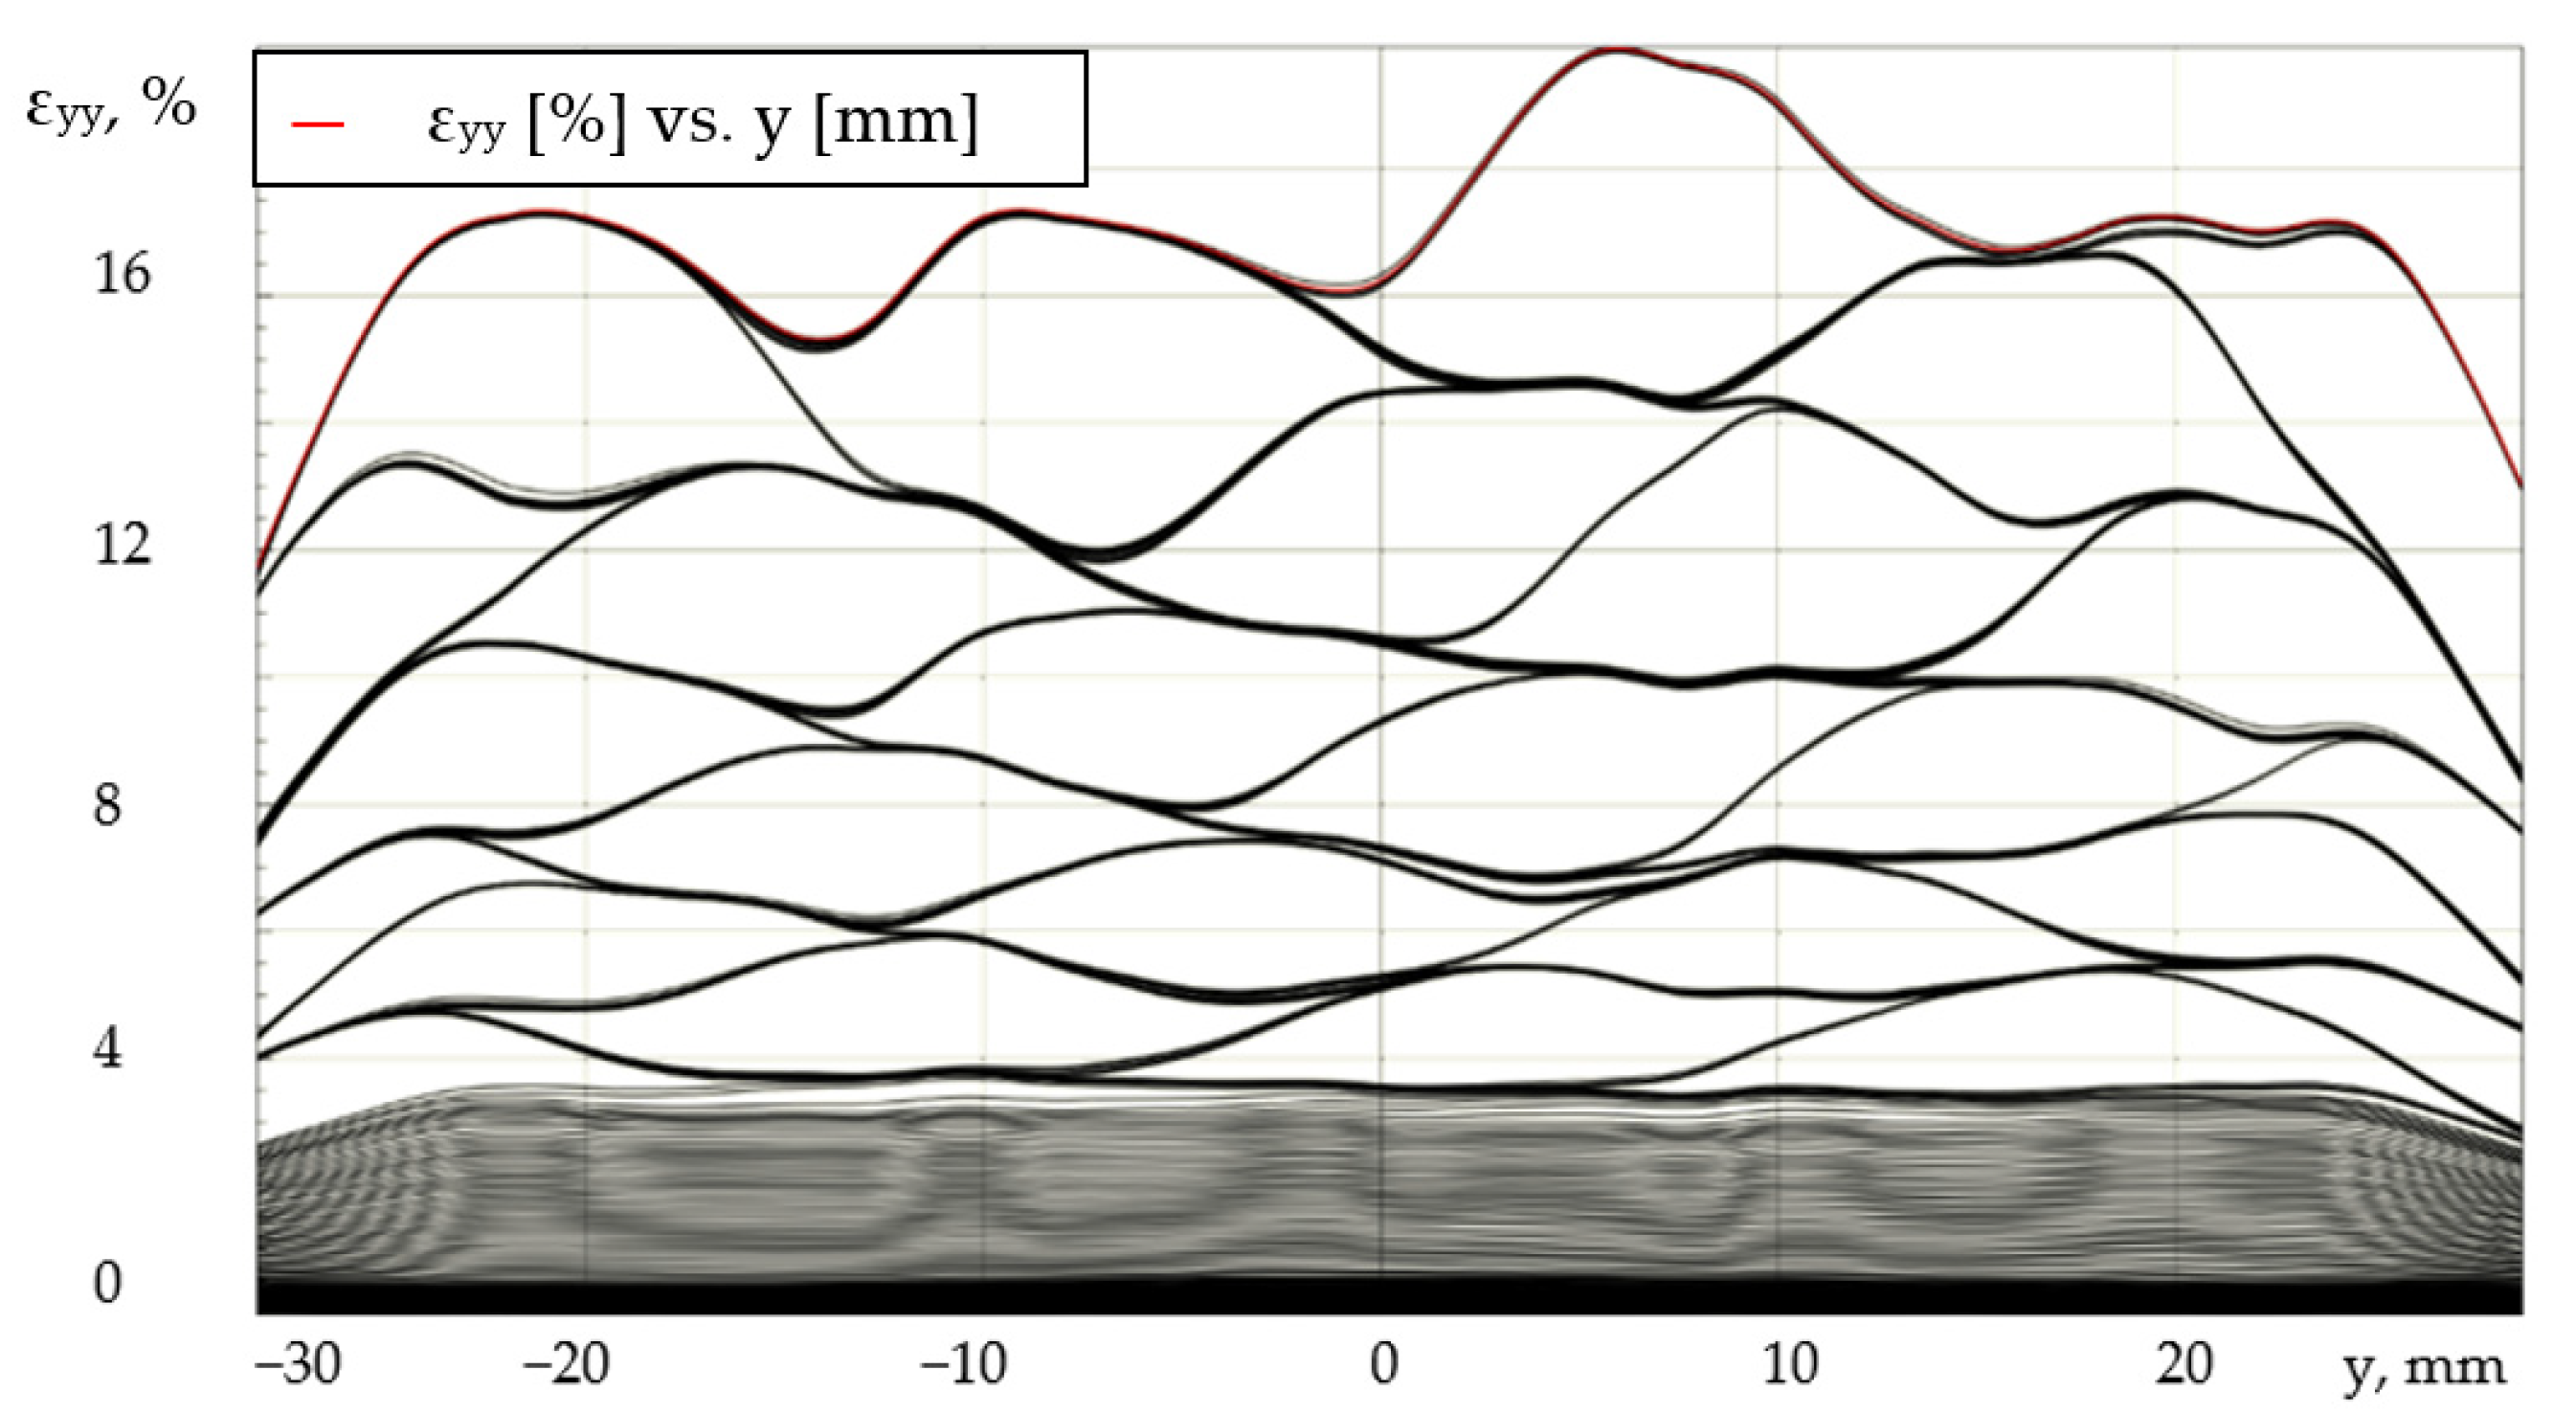
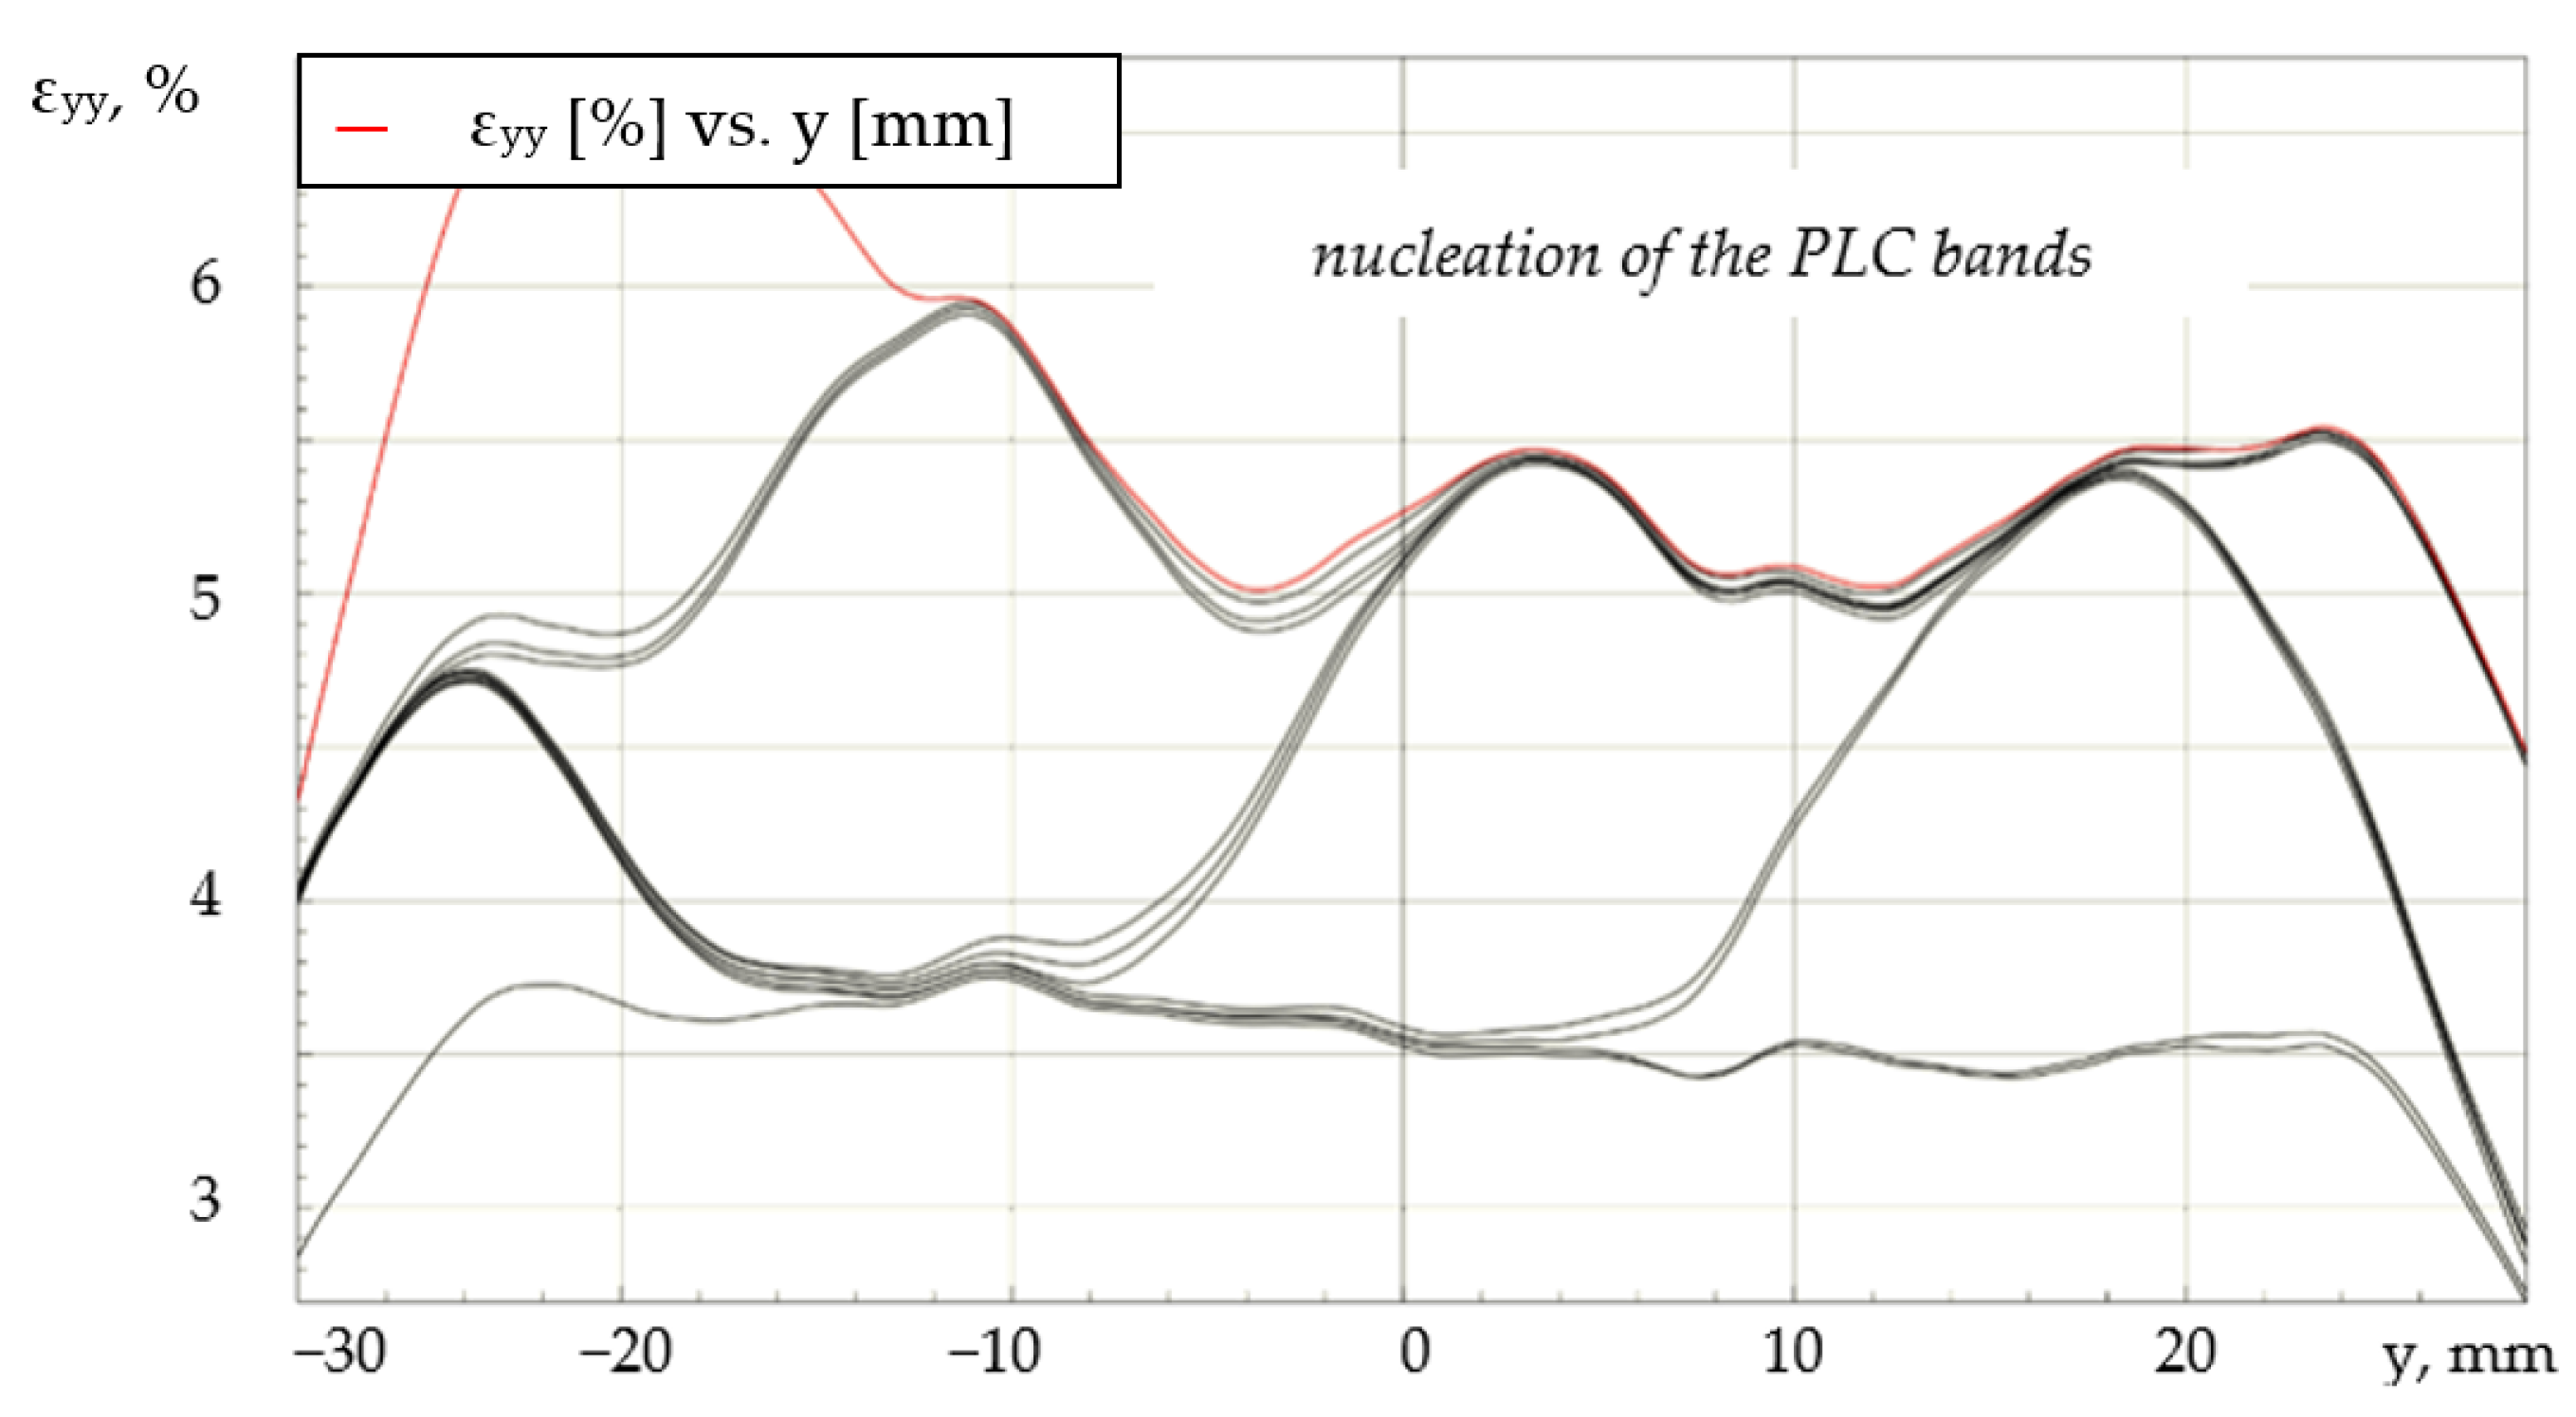
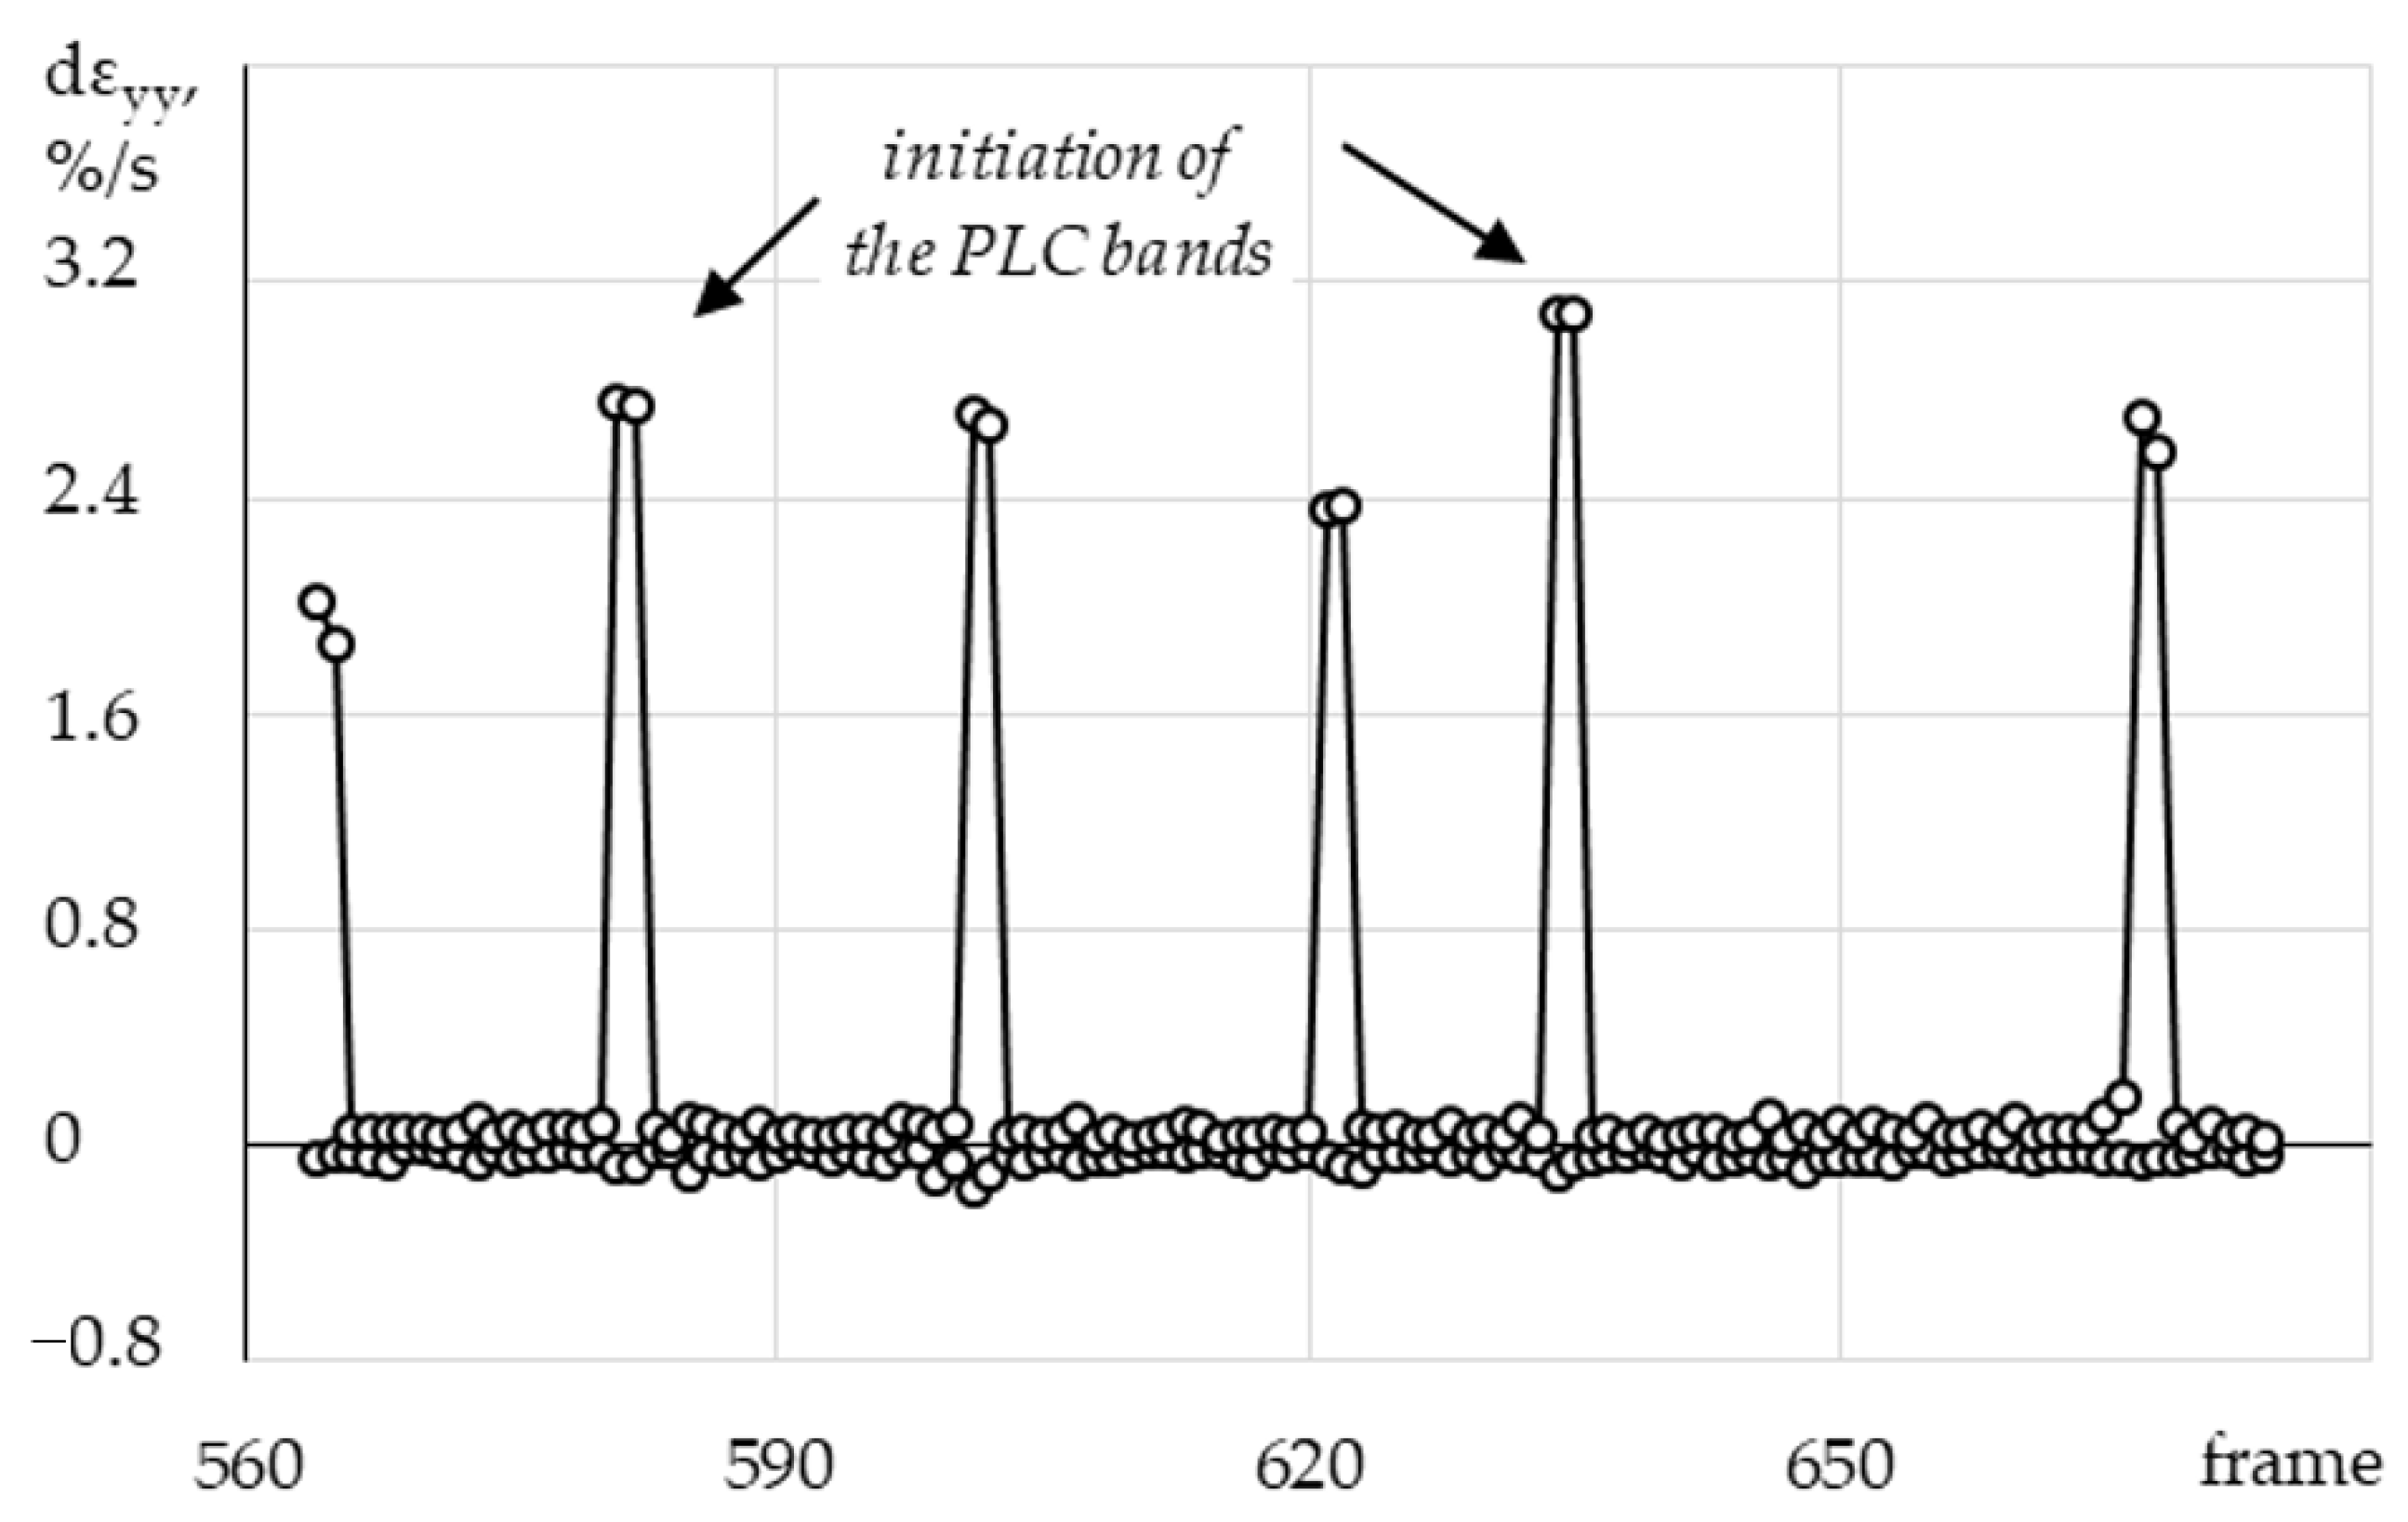
A structural Al-Mg alloy was chosen as the material for the study. The chemical composition, according to GOST 4784-97, is shown in Table 1. Specimens were made from a rod with a diameter of 20 mm as delivered (without additional heat treatment) on a lathe.
In tensile tests with the attachment having a variable stiffness, solid cylindrical specimens were used, a scheme of which is shown in Figure 1. On one of the gripping parts, a thread is cut to fix it to the tooling rod. This sample geometry meets the requirements of GOST 1497-84 “Metals. Tensile Test Methods “.
Mechanical uniaxial tensile tests are carried out at the Instron 8850 biaxial servo-hydraulic testing system, which allows tensile-compression tests with a maximum load of 100 kN and torsion with a maximum torque of 1000 Nm. Kinematic loading is realized with a traverse speed of 2.4 mm/min, which corresponds to a material strain rate of 6.67·10−4 s−1. The stiffness of the loading system is changed by using specialized equipment with a variable stiffness.
The equipment shown in Figure 2 consists of the following elements: body—1, consisting of two parts connected by means of a threaded connection, a package of plate springs—2; a guide rod—3; compensation rings—4; hardened washers—5; fastening nuts for fixing the package of springs—6; a rod to install the equipment in the grips of the testing machine—7; and a threaded hole for fastening in the equipment of the test specimen—8. Elements 3 and 5 are hardened to prevent damage and bite to the springs when the package is loaded. There is a patent (RU 153985 U1) for the rigging with a variable stiffness used in the work for tensile tests with various loading parameters.
By changing the stacking order and the number of plate springs (see Table 2) we provided the required stiffness of the loading system in the range of 5 MN/m to 120 MN/m.
In total, four values of the rigidity of the loading system are implemented during the work: 120 MN/m (nominal value), 50 MN/m, 18 MN/m and 5 MN/m (Figure 3). The maximum stiffness of the tooling coincides with the stiffness of the Instron 8850 testing machine when using hydraulic grips.
Plate springs are installed according to the required scheme. Further, the tooling is installed in the grips of the testing machine in series with the sample. The sample is fixed to the tooling rod by means of a threaded connection. Then a constant velocity displacement is applied to the sample, the change in loading is recorded, and the evolution of the deformation field on the surface of the working part of the sample is recorded. The test system controller allows synchronization with the Vic-3D non-contact video system based on the digital image correlation (DIC) method.

3. Results

As a result, the ‘load-elongation’ curves were obtained for samples of the Al-Mg alloy at different values of stiffness of the loading system: 120 MN/m (Figure 4), 50 MN/m (Figure 5), 18 MN/m (Figure 6), and 5 MN/m (Figure 7). To demonstrate the jerky type flow, enlarged fragments of these diagrams are additionally shown. The curves are plotted according to the built-in sensor of the testing system.
For the values of the loading system’s stiffness of 120 MN/m (Figure 4b) and 50 MN/m (Figure 5b), the loading diagrams show single load drops (or ‘teeth’), which are maintained by the initiation and propagation of a single PLC band. Up to a certain load level, uniform deformation of the sample is observed, which corresponds to a smooth section of elastic deformation and the initial stage of hardening. At the stage of supercritical deformation, the diagram is characterized by the presence of a large number of closely spaced teeth (Figure 4b and Figure 5b).
A decrease in the level of the loading system’s stiffness in relation to the sample leads to a change in the type of jerky flow of the Al-Mg alloy and an increase in the frequency and amplitude of the load jumps. Figure 6 shows the loading curve for a sample installed in a special gripping device, which realizes a stiffness of 18 MN/m. At a minimum stiffness level of 5 MN/m, we noted a decrease in the frequency of jumps on the diagram but an increase in their amplitude (Figure 7). An increase in the load leads to an increase in the amplitude of the load disruptions (Figure 7b).
To determine the level of critical deformation (εcr), at which the effect of the jerky flow begins to appear, deformation diagrams were constructed by using an additional software module of the video system called the ‘virtual’ extensometer (Figure 8a). The ‘virtual’ extensometer allows for the non-contact determination of the deformation in the gauge length of the specimen based on the displacement fields’ analysis. Thus, the ‘stress-strain’ curves for each group of the samples were obtained. As an example, Figure 8b shows a deformation diagram for a specimen tested at the maximum level of the loading system (120 MN/m).
This figure shows the moment of the onset of unstable plastic deformation at a result of the initiation of the effect of the jerky flow of the material. The level of critical deformation of the onset of the PLC effect is 2.36%. The εcr values for different levels of stiffness of the loading system are shown in Table 3.

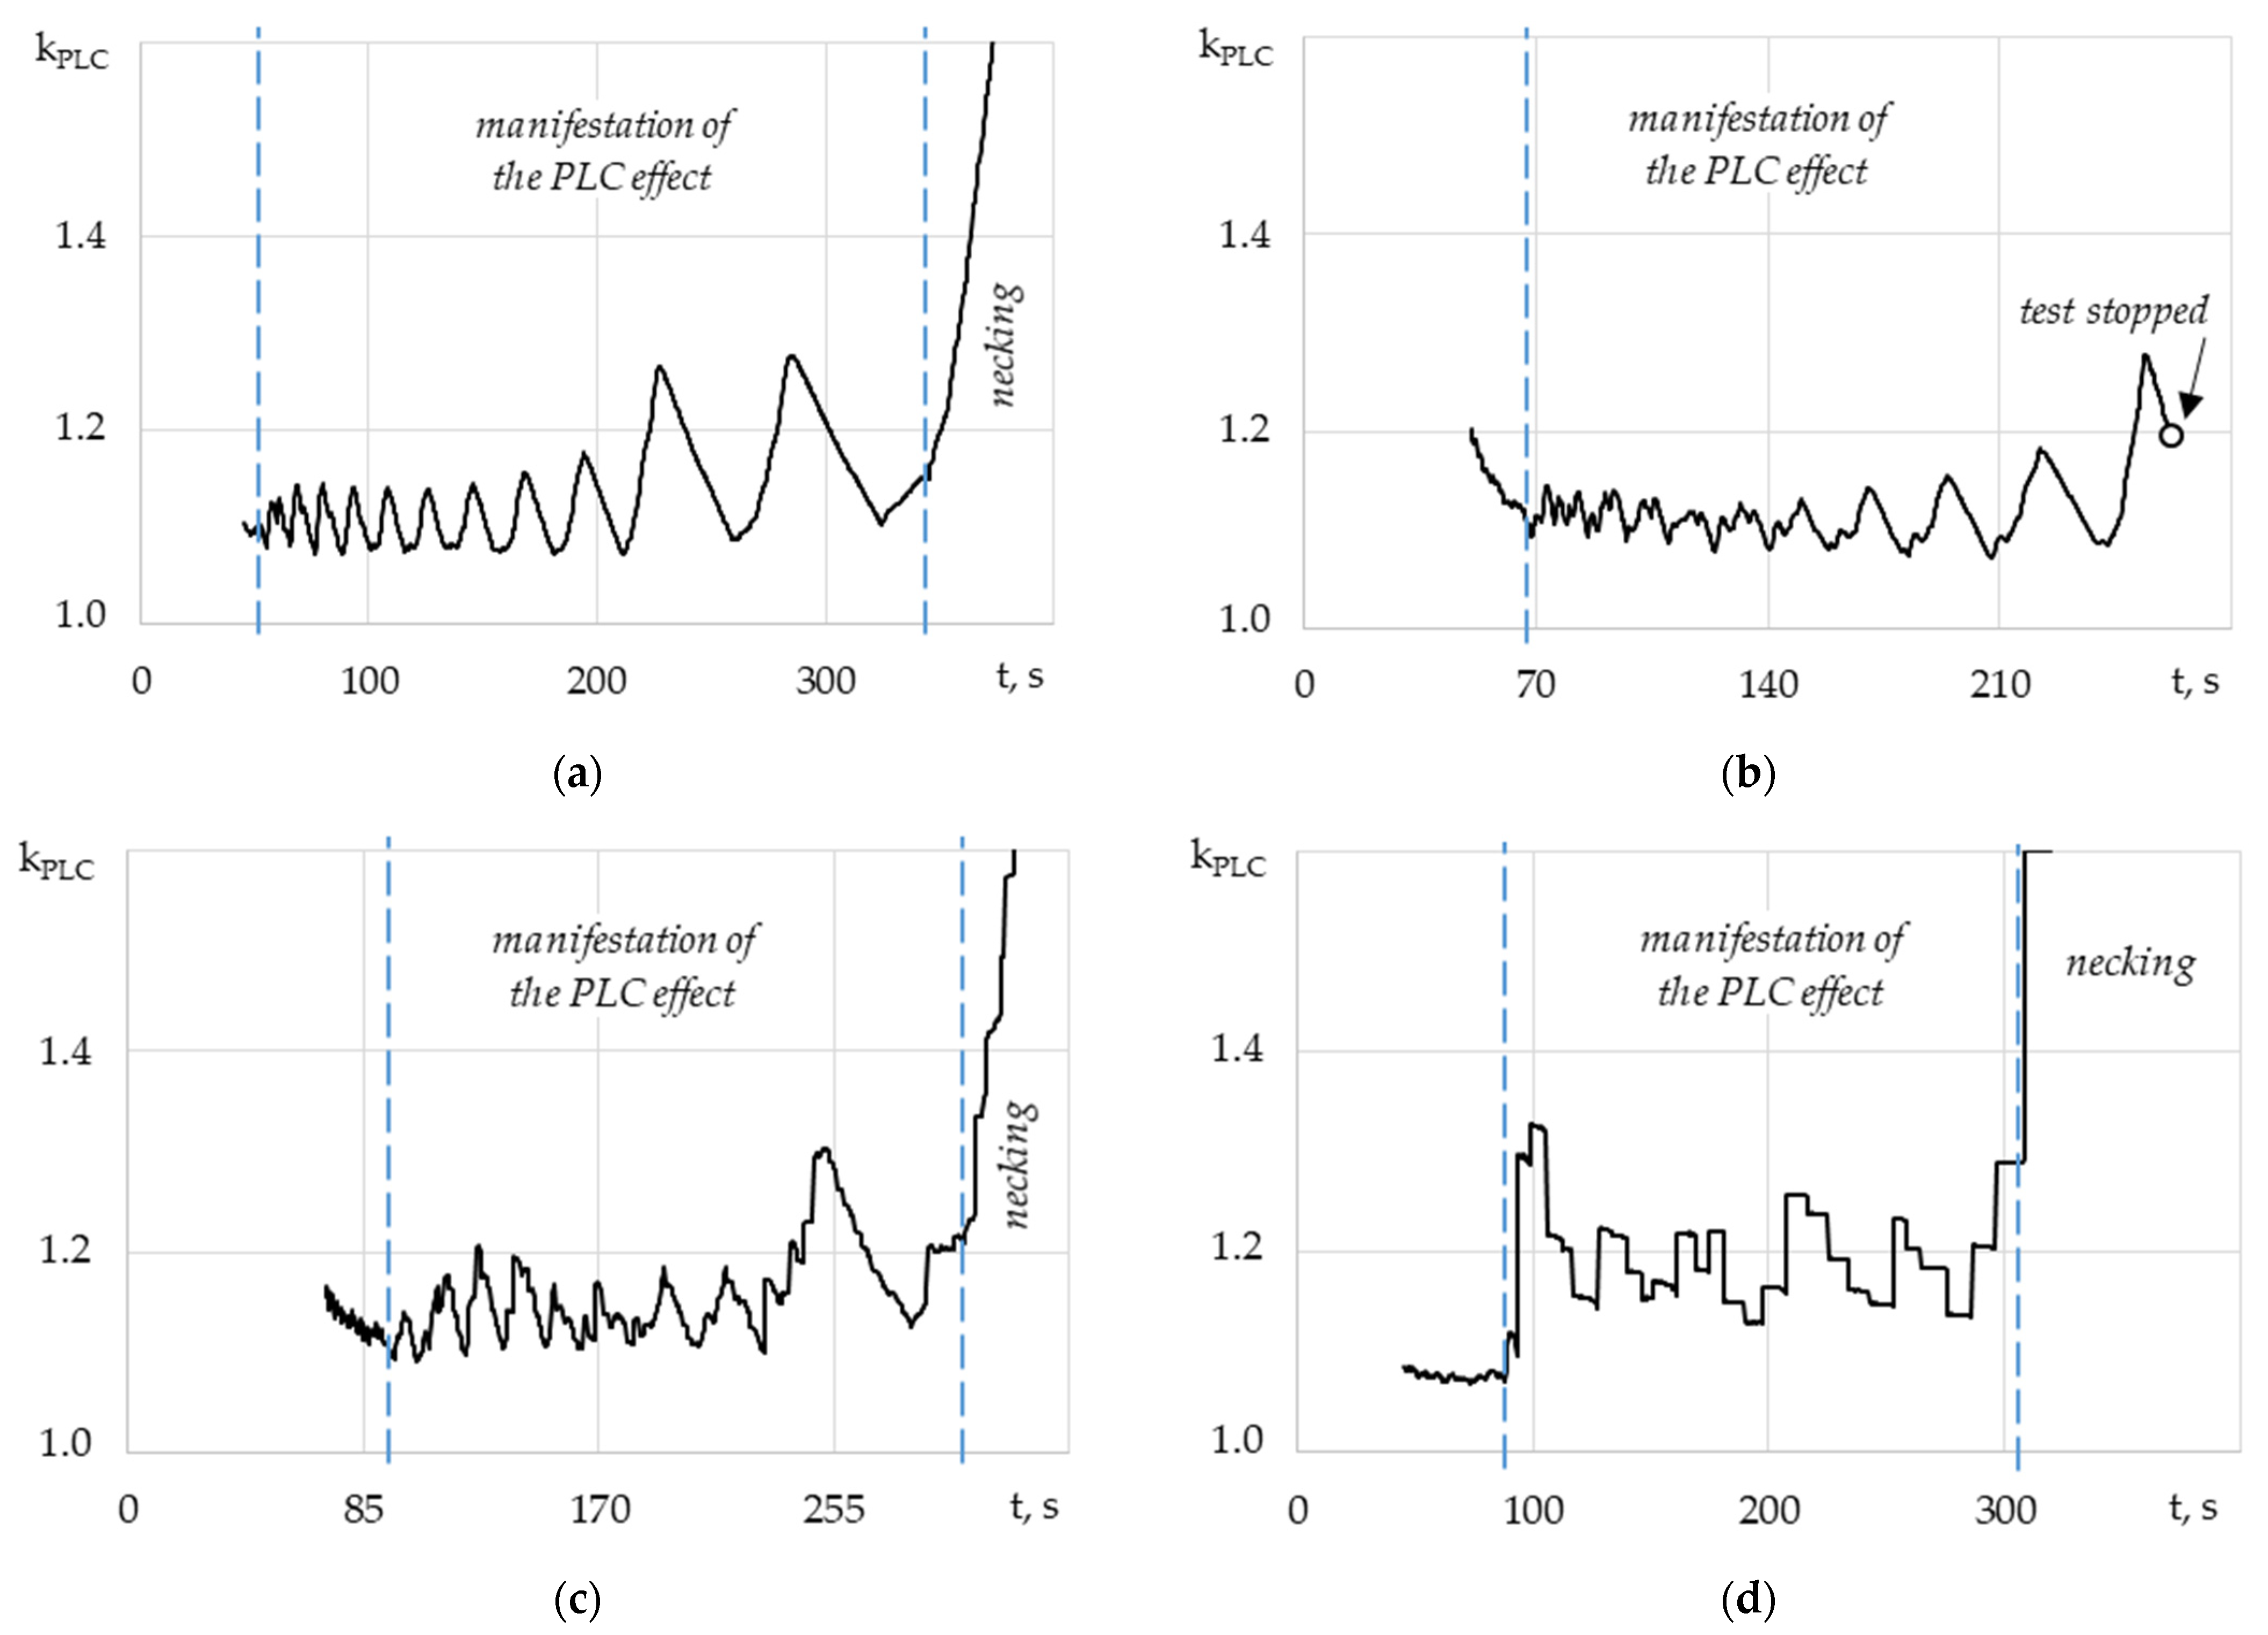
Spatial-Time Inhomogeneity Depending on the Stiffness of Loading System

The analysis of the evolution of inhomogeneous deformation fields and local rates of longitudinal deformation is carried out to study the kinetics of the development of the macroscopic localization of the plastic flow depending on the loading system’s stiffness. At the moment of the breakdown of the load on the diagram, a sharp localization of the plastic flow occurs in the sample, and the front of the PLC strip is formed. Depending on the type of jerky flow (type A, B, or C), the deformation band begins to either move uniformly along the length of the sample (in the case of the discontinuous flow according to type A). A random occurrence of PLC bands is observed in the sample, causing frequent drops in the load of small amplitude (type B) or drops in the load of large amplitude (type C).
To visualize the formation and propagation of PLC bands, the authors proposed the presentation of the results in the form of a series of deformation profiles (εyy) plotted along the length of the sample at equal time intervals. With the help of this representation, it is possible to characterize the basic laws and kinetics of the spatial-time inhomogeneous fields. As an example, Figure 9 shows a series of εyy profiles for a specimen tested at the loading system stiffness of 120 MN/m. The time interval between the deformation profiles is 2 s. The origin of coordinates for the abscissa axis (Oy) is fixed in the center of the gauge length of the specimen. Under uniaxial tension of the aluminum-magnesium alloy, the effect of quasi-periodic homogenization of plastic deformation is observed, which consists of alternating stages of localization of the plastic flow when PLC bands appear and propagate, as well as stages of macroscopic leveling of longitudinal deformations on the surface of the cylindrical sample.
For the values of the loading system’s stiffness of 120 MN/m and 50 MN/m, the jerky flow of type A is found. Figure 10 shows the development of longitudinal deformation fields at a stiffness of 120 MN/m, illustrating the formation and development of a single PLC band (marked with a white arrow).
We consider a series of longitudinal strain profiles (Figure 11) for a single strain band shown in Figure 9. Numbers 1–6 (Figure 11) denote the profiles of longitudinal deformations, for which Figure 10 shows the corresponding strain fields. The propagation of a single strain band proceeds uniformly from one capture to the opposite one with a constant speed of the band’s front movement.
The deformation of the material is interrupted after the crossing of the front of a single PLC band. The process of active plastic deformation is concentrated in a small area, in the area of the strain band. To illustrate this process, data on the evolution of local rates of longitudinal strain (dεyy) are given (Figure 12).
In Figure 12, the white arrow indicates the direction of movement of the PLC band. Based on the obtained data, a series of profiles of local rates of longitudinal strain with equal time intervals was plotted as well (Figure 13).
Figure 14 shows the change in the maximum and minimum local rates of longitudinal deformation depending on the frame number. The values of the rates are given in the interval of frames during which the initiation and propagation of the PLC band occurred (Figure 12). At the moment when a single band occurs, the deformation rate of the material in the region of the band is 0.66%/s, while in the rest of the sample, elastic unloading is recorded (negative values of the strain rates). The formed strain band flows at a constant rate of deformation of the order of 0.32%/s.
A similar analysis of the spatio-temporal inhomogeneity and influence of the loading system’s stiffness on the kinetics of PLC bands was carried out for the remaining samples from the test program presented in the work. When the stiffness is 50 MN/m, a series of longitudinal strain profiles (Figure 15) and a graph of maximum/minimum local rates of longitudinal strain (Figure 16) are similar to the results obtained when the stiffness is 120 MN/m. In the course of uniaxial tension, the manifestation of discontinuous flow type A is observed. At the moment when the single strain band occurs, the strain rate of the material in the region of the band front is slightly higher and amounts to about 0.74%/s. The advance of the formed band proceeds at a constant strain rate of 0.36%/s.
The reduction of the loading system’s stiffness to 18 MN/m significantly affects the jerky flow. The frequency of load drops and their amplitude are higher. The effect of quasi-periodic homogenization of the plastic flow becomes less pronounced (Figure 17). The discontinuous flow type is mixed (A + B).
At times on the sample surface, the propagation of the single bands of the localized plastic flow can be recorded (Figure 18). Nevertheless, unlike the previous values of stiffness (120 MN/m and 50 MN/m), the movement of the strip along the length of the sample takes place at different speeds. It is of interest that the profiles designated by numbers 1–6 in Figure 19 bring inhomogeneous fields of local rates of longitudinal deformation (Figure 20) in order to estimate at what rate the material is deformed at the front of the band.
The deformation rate at the front of the strain band increases and takes values in the range from 0.39%/s to 1.33%/s (Figure 20). The deformation rate of the material when the PLC band appears exceeds the applied rate in the test (0.67%/s) due to an increase in the compliance of the loading system. Consequently, elastic unloading of the peripheral regions of the sample is observed at a rate of −0.14%/s.
At the minimum level of stiffness of the loading system, implemented in this work, RLS = 5 MN/m, load drops of a large amplitude are observed in the diagram, which corresponds to type C discontinuous flow. Figure 21 shows a series of longitudinal deformation profiles illustrating the kinetics of PLC bands. It should be noted that due to the high compliance of the loading system at the moment when the next PLC strip appears, a significant drop in the load is observed (Figure 7). Strain bands are formed randomly on the sample surface.
For a more detailed analysis of the kinetics of the discontinuous flow at stiffness of 5 MN/n, a series of longitudinal deformation profiles was derived for a part of the loading (Figure 22). In this case, PLC stripes appear in the sample, but do not advance along the length. On the graph ‘local rate of longitudinal deformation—frame’ (Figure 23), one can distinguish a rather high intensity of the plastic flow at the front of the strip at the moment of its formation; values of the order of 3%/s are recorded.

4. Discussion

To estimate the degree of inhomogeneity of the process of macro-localization of the plastic flow under the Portevin-Le Chatelier effect, the coefficient of inhomogeneity of plastic deformation of the material (kPLC) during loading is considered. The coefficient is equal to the ratio of the maximum value of longitudinal deformation (εyy (max)) to the average value of deformations (εyy (mean)) for each frame recorded by the video system (1):
kPLC = εyy(max)/εyy(mean),
Based on the analysis of the evolution of inhomogeneous fields of longitudinal deformations, the time dependence of the kPLC coefficient for the stage of material hardening, which is characterized by the presence of the effect of intermittent flow of the material, was constructed (Figure 24). For the stage of tooth formation and yield area, as well as for the stage of material softening, the change in kPLC was not considered.

5. Conclusions

Thus, this work shows the high efficiency of using the specialized equipment to reduce the stiffness of the loading system in order to experimentally study the spatial-time inhomogeneity of the plastic flow of the aluminum-magnesium alloy. Mechanical tests for uniaxial tension of standard cylindrical specimens in the range with the stiffness of the loading system equal to 120 MN/m, 50 MN/m, 18 MN/m, and 5 MN/m have been implemented. We carried out the analysis of the kinetics of the occurrence and propagation of the deformation bands of the localized plastic flow under the Portevin-Le Chatelier effect using the digital image correlation method. Experimental data have been obtained that illustrate how the properties of the loading system affect the unstable plastic flow.
It is shown that despite the constant chemical composition of the material, external loading factors (temperature, stretching rate), the type of discontinuous yield depends on the value of the loading chain compliance. At higher values of the loading system’s stiffness (120 MN/m and 50 MN/m), the initiation of single PLC bands and their uniform distribution along the length of the sample (type A) are recorded on the material surface. With an increase in the compliance of the loading system, the intermittent fluidity passes to types B and C. On the loading curves, the amplitude of the load disruptions increases, which is accompanied by plastic deformation of the material in the area of the front of the PLC bands and the unloading of elastic deformations in the rest of the sample’s volume (outside the front of the strip). Reducing the stiffness of the loading system leads to multiple increases in the maximum values of the local rate of longitudinal strain during the initiation and propagation of the single PLC band. At high loading stiffness (120 MN/m), the maximum values of the local rate of longitudinal strain during the initiation of the single PLC band were 0.69%/s, at a loading stiffness of 50 MN/m–0.76%/s, at a loading stiffness of 18 MN/m–1.33%/s, and at a minimum loading stiffness (5 MN/m)–3.11%/s. In this case, the minimum values of the local rate of longitudinal strain during the propagation of the single PLC band decreased from 0.39%/s to 0.1%/s. These results are consistent with the experimental stretching diagrams obtained. Thus, at the maximum loading stiffness (120 MN/m), the diagrams show extended sections between single teeth, which correspond to the stage of propagation of the single PLC band. At the minimum loading stiffness (5 MN/m), the diagrams show successive teeth that correspond to the initiation of the single PLC band. This kind of research is relevant and requires further comprehensive theoretical and experimental studies and the implementation of a wider range of properties of the loading system.
The practical significance of the work is determined by the fact that the manifestation of the effects of intermittent flow in Al-Mg alloys leads to a significant decrease in the strength and plasticity of material in structures. The processes of strip formation and spontaneous macroscopic localization of plastic flow lead to the appearance of different thicknesses of structural elements, a decrease in the surface quality of parts, the appearance of concentrators, defects, and, as a result, to subsequent destruction or violation of the structural strength of parts. The study of the influence of the stiffness of the loading system on the of the Portevin-Le Chatelier effects has not been previously considered. The presented work shows that the stiffness of the loading system, as well as other parameters (deformation rate, temperature, chemical composition), has a direct effect on the kinetics of initiation and propagation of PLC deformation bands and the type of intermittent fluidity. Therefore, the loading stiffness must be considered along with other parameters when designing structures and planning experimental research programs that use materials that exhibit of the Portevin-Le Chatelier effects.

Author Contributions

Conceptualization, T.T.; methodology, M.T. and T.T.; software, T.T.; validation, T.T. and M.T.; formal analysis, T.T.; investigation, T.T. and M.T.; resources, T.T.; data curation, T.T. and M.T.; writing—original draft preparation, T.T.; writing—review and editing, T.T. and M.T.; visualization, T.T.; supervision, T.T.; project administration, T.T.; funding acquisition, T.T. All authors have read and agreed to the published version of the manuscript.

Funding

This research was funded by the Russian Science Foundation (No. 20-79-10235).

Data Availability Statement

Not applicable.

Acknowledgments

The work was carried out by using the capabilities of a large unique scientific facility (UNU) ‘A set of test and diagnostic equipment for studying the properties of structural and functional materials under complex thermomechanical influences’, which is part of the Center of Experimental Mechanics, PNRPU (Perm, Russia).

Conflicts of Interest

The authors declare no conflict of interest.

References

  1. Tretyakova, T.V.; Wildemann, V.E. Plastic Strain Localization and Its Stages in Al–Mg Alloys. Phys. Mesomech. 2018, 21, 314–319. [Google Scholar] [CrossRef]
  2. Bell, J.F. Eksperimental’nye Osnovy Mekhaniki Deformiruemykh Tverdykh tel. Ch.2. Konechnye Deformatsii [The Experimental Foundations of Solid Mechanics. Part 2. Finite Deformation]; Nauka: Moscow, Russia, 1984; 432p. [Google Scholar]
  3. Klueh, R.L. Discontinuous creep in short-range order alloys. Mater. Sci. Eng. 1982, 54, 65–80. [Google Scholar] [CrossRef]
  4. Yilmaz, A. The Portevin-Le Chatelier effect: A review of experimental findings. Sci. Technol. Adv. Mater 2011, 12, 063001. [Google Scholar] [CrossRef] [PubMed]
  5. Aguirre, F.; Kyriakides, S.; Yun, H.D. Bending of steel tubes with Lüders bands. Int. J. Plast. 2004, 20, 1199–1225. [Google Scholar] [CrossRef]
  6. Tretyakova, T.V.; Wildemann, V.E. Spatial-Time Inhomogeneity of the Processes of Inelastic Deformation of Metals; Fizmatlit: Moscow, Russia, 2016; p. 120. [Google Scholar]
  7. Trusov, P.V.; Chechulina, E.A. Serrated yielding: Physical mechanisms, experimental dates, macro-phenomenological models. PNRPU Mech. Bull. 2014, 3, 186–232. [Google Scholar]
  8. Tretyakova, T.V.; Wildemann, V.E. Experimental study of the influence of strain-stress state on the jerky flow in metals and alloys. Procedia Struct. Integr. 2019, 17, 906–913. [Google Scholar] [CrossRef]
  9. Vildeman, V.E.; Sokolkin, Y.V.; Tashkinov, A.A. Mechanics of Inelastic Deformation and Fracture of Composite Materials; Nauka: Moscow, Russia, 1997; p. 288. [Google Scholar]
  10. Wildemann, V.E.; Lomakin, E.V.; Tretyakov, M.P.; Tretyakova, T.V.; Lobanov, D.S. Experimental Studies of Postcritical Deformation and Fracture of Structural Materials; PNRPU: Perm, Russia, 2018; 156p. [Google Scholar]
  11. Tretyakov, M.P.; Wildemann, V.E.; Lomakin, E.V. Failure of materials on the postcritical deformation stage at different types of the stress-strain state. Procedia Struct. Integr. 2016, 2, 3721–3726. [Google Scholar] [CrossRef]
  12. Tretyakov, M.P.; Tretyakova, T.V.; Wildemann, V.E. Regularities of mechanical behavior of steel 40Cr during the postcritical deformation of specimens in condition of necking effect at tension. Frat. Ed Integrità Strutt. 2018, 43, 145–153. [Google Scholar] [CrossRef]
  13. Vildeman, V.E.; Tretyakov, M.P. Analysis of the effect of loading system rigidity on postcritical material strain. J. Mach. Manuf. Reliab. 2013, 42, 219–226. [Google Scholar] [CrossRef]
  14. Wildemann, V.E.; Lomakin, E.V.; Tretyakov, M.P. Effect of vibration stabilization of the process of postcritical deformation. Dokl. Phys. 2016, 61, 147–151. [Google Scholar] [CrossRef]
  15. Bazant, Z.P.; Di Luizo, G. Nonlocal microplane model with strain-softening yield limits. Int. J. Solids Struct. 2004, 41, 7209–7240. [Google Scholar] [CrossRef]
  16. Mansouri, L.Z.; Coër, J.; Thuillier, S.; Laurent, H.; Manach, P.Y. Investigation of Portevin-Le Châtelier effect during Erichsen test. Int. J. Mater. Form. 2020, 13, 687–697. [Google Scholar] [CrossRef]
  17. Rousselier, G.; Morgeneyer, T.F.; Ren, S.; Mazière, M.; Forest, S. Interaction of the Portevin–Le Chatelier phenomenon with ductile fracture of a thin aluminum CT specimen: Experiments and simulations. Int. J. Fract. 2017, 206, 95–122. [Google Scholar] [CrossRef]
  18. Dahdouh, S.; Mehenni, M.; Ait-Amokhtar, H. Kinetics of formation and propagation of type A Portevin-Le Chatelier bands in the presence of a small circular hole. J. Alloy. Compd. 2021, 885, 160982. [Google Scholar] [CrossRef]
  19. Choi, Y.; Ha, J.; Lee, M.G.; Korkolis, Y.P. Observation of Portevin-le Chatelier effect in aluminum alloy 7075-w under a heterogeneous stress field. Scr. Mater. 2021, 205, 114178. [Google Scholar] [CrossRef]
  20. Ren, S.C.; Morgeneyer, T.F.; Mazière, M.; Forest, S.; Rousselier, G. Effect of Lüders and Portevin–Le Chatelier localization bands on plasticity and fracture of notched steel specimens studied by DIC and FE simulations. Int. J. Plast. 2021, 136, 102880. [Google Scholar] [CrossRef]
  21. Ren, S.C.; Morgeneyer, T.F.; Mazière, M.; Forest, S.; Rousselier, G. Portevin-Le Chatelier effect triggered by complex loading paths in an Al–Cu aluminium alloy. Philos. Mag. 2019, 99, 659–678. [Google Scholar] [CrossRef]
  22. Le Cam, J.B.; Robin, E.; Leotoing, L.; Guines, D. Calorific signature of PLC bands under biaxial loading conditions in Al-Mg alloys. Residual Stress Infrared Imaging Hybrid Tech. Inverse Probl. 2018, 8, 29–35. [Google Scholar] [CrossRef]
  23. Skripnyak, V.V.; Skripnyak, V.A. Localization of Plastic Deformation in Ti-6Al-4V. Alloy Met. 2021, 11, 1745. [Google Scholar] [CrossRef]
  24. Brünig, M.; Gerke, S.; Koirala, S. Biaxial Experiments and Numerical Analysis on Stress-State-Dependent Damage and Failure Behavior of the Anisotropic Aluminum Alloy EN AW-2017A. Metals 2021, 11, 1214. [Google Scholar] [CrossRef]
  25. Chen, Y.; Ji, C.; Zhang, C.; Sun, S. The Application of DIC Technique to Evaluate Residual Tensile Strength of Aluminum Alloy Plates with Multi-Site Damage of Collinear and Non-Collinear Cracks. Metals 2019, 9, 118. [Google Scholar] [CrossRef]
  26. Mäkinen, T.; Ovaska, M.; Laurson, L.; Alava, M.J. Portevin–Le Chatelier effect: Modeling the deformation bands and stress-strain curves. Mater Theory 2022, 6, 15. [Google Scholar] [CrossRef]
  27. Xu, J.; Holmedal, B.; Hopperstad, O.S.; Maník, T.; Marthinsen, K. Dynamic strain ageing in an AlMg alloy at different strain rates and temperatures: Experiments and constitutive modelling. Int. J. Plast. 2022, 151, 103215. [Google Scholar] [CrossRef]
Figure 1. Scheme of a solid cylindrical sample for testing with fixtures with variable stiffness.
Metals 13 01054 g001
Figure 2. A scheme containing the main elements (a), a general view (b) and elements of attachment with a variable stiffness (c).
Metals 13 01054 g002
Figure 3. Stiffness characteristics for various setting-ups of plate springs corresponding to the values: 1—120 MN/m, 2—50 MN/m, 3—18 MN/m, 4—5 MN/m (a), testing equipment set-up (b).
Metals 13 01054 g003
Figure 4. The load-displacement curve for the loading system stiffness of 120 MN/m (a) and enlarged sections (blue boxes) of the curve illustrating the discontinuity of the plastic flow (b).
Metals 13 01054 g004
Figure 5. The load-displacement curve for the loading system’s stiffness of 50 MN/m (a) and enlarged sections of the curve illustrating the discontinuity of the plastic flow (b).
Metals 13 01054 g005
Figure 6. The load-displacement curve for the loading system’s stiffness of 18 MN/m (a) and the enlarged section (blue box) of the curve illustrating the discontinuity of the plastic flow (b).
Metals 13 01054 g006
Figure 7. The load-displacement curve for the loading system’s stiffness of 5 MN/m (a) and the enlarged section (blue box) of the curve illustrating the discontinuity of the plastic flow (b).
Metals 13 01054 g007
Figure 8. The location of the ‘virtual extensometer’ of the Vic-3D measurement system (a); the stress-strain curve in the case of the loading system’s stiffness of 120 MN/m (b).
Metals 13 01054 g008
Figure 9. Series of plots of longitudinal deformations plotted at equal time intervals along the specimen length in the case of a stiffness of 120 MN/m.
Metals 13 01054 g009
Figure 10. Evolution of the longitudinal strain fields on the surface of an Al-Mg alloy specimen in the case of a stiffness of 120 MN/m.
Metals 13 01054 g010
Figure 11. Series of plots of longitudinal deformations plotted at equal time intervals along the specimen length during the single PLC band propagation.
Metals 13 01054 g011
Figure 12. Evolution of local rates of the longitudinal strain fields on the surface of an Al-Mg alloy specimen in the case of a stiffness of 120 MN/m, numbers 1-6 corresponded to the plots of longitudinal deformations in the Figure 11.
Metals 13 01054 g012
Figure 13. Series of plots of the local rate of longitudinal strain plotted at equal time intervals along the specimen length in the case of 120 MN/m.
Metals 13 01054 g013
Figure 14. Frame dependence of maximum and minimum values of the local rate of longitudinal strain during the initiation and propagation of the single PLC band in the case of 120 MN/m.
Metals 13 01054 g014
Figure 15. Series of plots of longitudinal deformations at equal time intervals along the specimen length in the case of stiffness 50 MN/m.
Metals 13 01054 g015
Figure 16. Frame dependence of the maximum and minimum values of the local rate of longitudinal strain during the initiation and propagation of the single PLC band in the case of 50 MN/m.
Metals 13 01054 g016
Figure 17. Series of plots of longitudinal deformations at equal time intervals along the specimen length in the case of a stiffness of 18 MN/m.
Metals 13 01054 g017
Figure 18. Series of plots of longitudinal deformations at equal time intervals along the specimen length during the single PLC band propagation.
Metals 13 01054 g018
Figure 19. Evolution of local rates of the longitudinal strain fields on the surface of Al-Mg alloy specimen in case of stiffness 50 MN/m, numbers 1-6 corresponded to the plots of longitudinal deformations in the Figure 18.
Metals 13 01054 g019
Figure 20. Frame dependence of maximum and minimum values of the local rate of the longitudinal strain during the initiation and propagation of the single PLC band in the case of 18 MN/m.
Metals 13 01054 g020
Figure 21. Series of plots of longitudinal deformations plotted at equal time intervals along the specimen length in the case of a stiffness of 5 MN/m.
Metals 13 01054 g021
Figure 22. Series of plots of longitudinal deformations plotted at equal time intervals along the specimen length during the several PLC bands propagation.
Metals 13 01054 g022
Figure 23. Frame dependence of maximum and minimum values of the local rate of longitudinal strain during the initiation and propagation of the single PLC band in the case of 5 MN/m.
Metals 13 01054 g023
Figure 24. Time dependence of the coefficient of inhomogeneity of plastic deformation due to the Portevin-Le Chatelier effect in the case of the loading system’s stiffness: 120 MN/m (a), 50 MN/m (b), 18 MN/m (c), and 5 MN/m (d), blue dotted line corresponds to beginning and ending of the manifestation of the PLC effect.
Metals 13 01054 g024
Table 1. Chemical composition of Al-Mg alloy.
ElementAlMgMnFeSiZnTiCuBe
Composition, %.wt.92.556.120.840.270.170.0050.0390.0010.005
Table 2. Setting up of plate springs inside the attachment with a variable stiffness.
SetNumber of Plate SpringsSetting-Up of Plate SpringsStiffness, MN/m
1--120
210< <50
32< >18
410< >5
Table 3. Influence of the loading system’s stiffness on the critical strain value at the onset of the PLC effect.
Stiffness of the Loading System, MN/m12050185
Critical strain of the onset of the PLC effect, %2.362.512.853.18
Disclaimer/Publisher’s Note: The statements, opinions and data contained in all publications are solely those of the individual author(s) and contributor(s) and not of MDPI and/or the editor(s). MDPI and/or the editor(s) disclaim responsibility for any injury to people or property resulting from any ideas, methods, instructions or products referred to in the content.

