Article

Study on the Behavior of Assembled T-Shaped Aluminum Alloy Specimens under Axial Compression

1
Shanghai Tongzheng Aluminum Engineering Co., Ltd., Shanghai 200030, China
2
School of Civil Engineering, Hebei University of Engineering, Handan 056038, China
3
State Key Laboratory of Hydraulic Engineering Simulation and Safety, Tianjin University, Tianjin 300072, China
*
Author to whom correspondence should be addressed.
Metals 2023, 13(5), 919; https://doi.org/10.3390/met13050919
Submission received: 4 April 2023 / Revised: 24 April 2023 / Accepted: 30 April 2023 / Published: 9 May 2023

Abstract

:
Assembled T-shaped aluminum alloy components represent a new type of structural member in aluminum alloy structures with broad application prospects. In this study, axial compression tests were carried out on 32 aluminum alloy components, considering parameters such as the cross-sectional type and slenderness ratio of the components, to obtain the ultimate bearing capacity and failure mode of the members. The test results show that, for the equilateral assembled T-shaped aluminum alloy components with obvious strong and weak axes, bending instability was most common, and local buckling of the plate occurred when the slenderness ratio of the component was relatively small. For the unequal T-shaped aluminum alloy structures without an obvious strong or weak axis, torsional buckling instability occurred, accompanied by local deformation of the connecting limbs due to mutual compression. A verified finite element model was also established. Based on this model, a parametric analysis was conducted to study the influence of parameters such as initial defects, slenderness ratio, and cross-sectional type on the axial compressive bearing capacity of the assembled T-shaped aluminum alloy components. The experimental and numerical results were then compared with Chinese and European standards, revealing that the standard calculation methods tend to be unsafe. Finally, the calculation parameters for component defects in Chinese and European standards were revised.

1. Introduction

Aluminum alloys have a beautiful appearance, good corrosion resistance, and density only 1/3 that of steel, so they are widely used in large-span space grids and tower structures. However, the modulus of elasticity for aluminum alloys is only 1/3 that of steel, and the deformation of an aluminum alloy structure and its specimens tends to be significant when the material is stressed. Therefore, the stability of compressed aluminum alloy specimens needs to be further explored.
A large number of studies have been conducted on the stability of aluminum alloy compression rods, including biaxially symmetric sections such as H-sections [1,2,3,4,5,6,7], rectangular sections [1,3,5,8,9,10,11,12,13,14,15], circular tubes [5,10,16,17,18], etc., as well as uniaxially symmetric sections such as L-sections [4,19,20], slotted sections [21], T-sections [22], and asymmetric unequal L-sections [23,24]. Compared to biaxially symmetrical sections, uniaxially symmetrical sections and asymmetrical sections have more complex and diverse instability patterns under pressure. Wang et al. [19] conducted an experimental and finite element study on 7A04 high-strength aluminum alloy L-type rods in the range of a 15–100 slenderness ratio and compared the load-carrying capacity of the rods obtained from the tests with Chinese, American, and European codes. The results showed that the method in the American code is relatively unsafe, while the method in the Chinese code is too conservative; thus, the design formula for the load-carrying capacity of the rods was modified based on the European code. Wang [20] also studied a 7A04 high-strength aluminum alloy L-rod with end fastening and predicted the load capacity of the rod using an improved DSM-based method. Zhai et al. considered the effect of eccentric loading on a 6082-T6 aluminum alloy box and L-type specimens and conducted experimental and finite element analyses, which found that the predicted values of Chinese and European codes were conservative. By modifying the parameter values of the Chinese code, more accurate predictions of the rod load capacity were achieved. Zhu et al. [21] have studied slotted aluminum alloy rods with welded ends via numerical methods, and improved the method for predicting the load capacity of rods considering the effects of welding based on the direct strength method (DSM) and the continuous strength method (CSM). Zhang et al. [23,24] conducted experimental and numerical studies on unequal L-type aluminum rods and found that the interaction of the overall and local initial defects of the rods will have a large impact on the load capacity. Additionally, the existing code was found to produce inaccurate load capacity assessments because it did not consider the impact. Zhang et al. developed a more accurate prediction method considering the interaction effects of initial defects.
Compared to a single rod, there are interactions between two rods of double specimens, which may have an effect on the damage mode and load capacity of the rods. When predicting the axial compressive stability-bearing capacity of single-axis symmetric section members composed of double members, it is unclear whether the calculation formulas in existing specifications for solid-section members are applicable. However, there is currently no research on the axial compressive stability-bearing capacity of assembled T-shaped aluminum alloy rods, and there are no calculation methods included in the specifications for determining the load capacity of aluminum alloy composite members. Therefore, further research on the combined action and mechanical properties of double specimens is needed to establish more accurate calculation models for studying the stability-bearing capacity.
In this paper, an axial compression test of 32 assembled T-shaped aluminum alloy specimens with different cross-sectional forms and different slenderness ratios was conducted, and a numerical simulation and theoretical analysis were carried out to determine the formula for calculating the stability coefficients of assembled T-shaped aluminum alloy specimens, so as to provide technical support for further promoting the design of a trussed aluminum alloy double-layered space grid structure.

2. Experimental Studies

2.1. Specimen Design

The aluminum alloy 6061-T6 (produced by Shanghai Tongzheng Aluminum Engineering Co., Ltd., Shanghai, China) was selected as the material, and four types of aluminum alloy specimens were designed and assembled in the form of a cross-section, including two types of equal T-shaped specimens and two types of unequal T-shaped specimens, as shown in Figure 1. Combined with the common slenderness ratio of the project, 4 types of specimens with lengths of 900, 1200, 1500, and 1800 mm were processed for each type of cross-sectional specimen. There were 16 kinds of specifications, and 2 specimens of each specification were processed, for a total of 32 specimens. The dimensions of the specimens, which are shown in Table 1, were numbered as follows: 2L75-6-900A, where “75” indicates the nominal limb width of the specimen, “6” indicates the limb thickness, “900” indicates the length of the rod, and “A” indicates the same specimen number; and 2L75-65-6-900A, where “75” indicates the width of the connecting limb in the unequal T-shaped specimen, “65” indicates the width of the non-connecting limb, and the rest of the symbols mean the same as those of the equal T-shaped specimen.

2.2. Material Properties

In order to determine the basic mechanical specifications of the material, we carried out tensile property tests on standard specimens of aluminum alloy materials. The material specimens were cut from the same batch of test rods. During the test, there was no obvious necking of each specimen. The pull-off was sudden and accompanied by a loud sound. The specimen size is shown in Figure 2. The stress–strain curves and basic mechanical indexes obtained from the test are shown in Figure 3 and Table 2. Here, “E0” indicates the modulus of elasticity of the specimen, “f0.2” is the nominal yield strength of the aluminum alloys, “fu” is the ultimate tensile strength of the aluminum alloys, and “n” is the hardening index according to Equation (1).

2.3. Loading Scheme and Measurement Point Arrangement

A 500-ton hydraulic servo pressure tester (produced by Jinan Shidaishijin Testing Machine Co., Ltd., Jinan, China) was used for loading, and a double-knife hinge device (produced by Tianjin Sizhengluoixin Steel Structure Technology Co., Ltd., Tianjin, China) was arranged at the upper and lower ends of the specimen, which allowed the specimen to rotate freely around the two orthogonal directions, as shown in Figure 4.
We placed the axial pressure test specimen into the double-knife hinge support and used a level for alignment. Pre-loading was carried out before the formal test to verify the good operation of the loading device and to eliminate the gap between the loading device and the test piece.
The estimated load-carrying capacity of the specimen was used as the basis for graded loading, and the load value of each level was a multiple of 10 kN. After loading, the load was held for 2 min. Graded loading helped us to observe the deformation law of the specimen when the load changed and understand the working performance of each stage. When the load reached 70% of the estimated load-carrying capacity, displacement loading was carried out at a rate of 0.2 mm/s, and the load was held for 2 min after each loading before the next loading. When the load applied by the servo machine dropped to 80% of the ultimate load or when the knife mouth reached the limit of its rotation due to bending instability damage or bending and torsion instability damage of the test piece, the servo machine stopped loading.
Twelve strain gauges and six displacement gauges were arranged at the midspan cross-section of each specimen to measure the strain and lateral deformation, as shown in Figure 5. Strain gauges were arranged along the rod length. Four displacement transducers were arranged at the upper and lower double-knife hinge base of each specimen to measure the vertical deformation of the specimens, as shown in Figure 6.

3. Experimental Results and Design

3.1. Specimen Phenomena and Damage Patterns

At the beginning of loading, the specimens were in the linear elastic working stage. The midspan deflection of the specimen was basically proportional to the increase in the load, and the larger the slenderness ratio of the specimen, the faster the change in the midspan deflection. When the load reached close to the ultimate load-carrying capacity, the midspan deflection of the specimen changed rapidly. A total of three damage modes were observed for all test specimens: bending instability accompanied by local buckling of the connecting limb, bending and torsional instability accompanied by local buckling of the connecting limb, and pure bending instability damage. The damage to the rods is summarized in Table 3.
Except for the 2L100-75-8 specimen, when the length of the rod was small, bending instability around the weak axis (asymmetric axis) occurred, along with local bulging deformation of the connected limb. As the length of the rod increased, the damage mode was simply transformed into bending instability around the weak axis, without local buckling. For the 2L60-5, 2L75-65-6, and 2L75-6 sections, the bending stiffness around the weak axis increased in order, as did the length of the rod corresponding to the transformation of the damage mode. The damage patterns of some rods are shown in Figure 7. In the tests of the 12 aluminum alloy axial compression specimens of the above three types of cross-sections, the double-knife hinge enabled all specimens to rotate in the direction of the weak axis of the specimen.
The bending stiffness values of the 2L100-75-8 specimen around the symmetry axis and the asymmetry axis were similar under bending torsional buckling instability damage, with no obvious strong or weak axis. Deformation occurred slightly before the load reached its ultimate load-carrying capacity. When the load reached its ultimate load-carrying capacity, the specimen deformed rapidly, and its bearing capacity quickly dropped. Additionally, the connected limb presented obvious local bulge deformation, as shown in Figure 8. In the 2L100-75-8 cross-sectional double aluminum alloy specimen test, the double-knife hinge supports rotated in both directions of the symmetry axis and asymmetry axis of the specimen section.

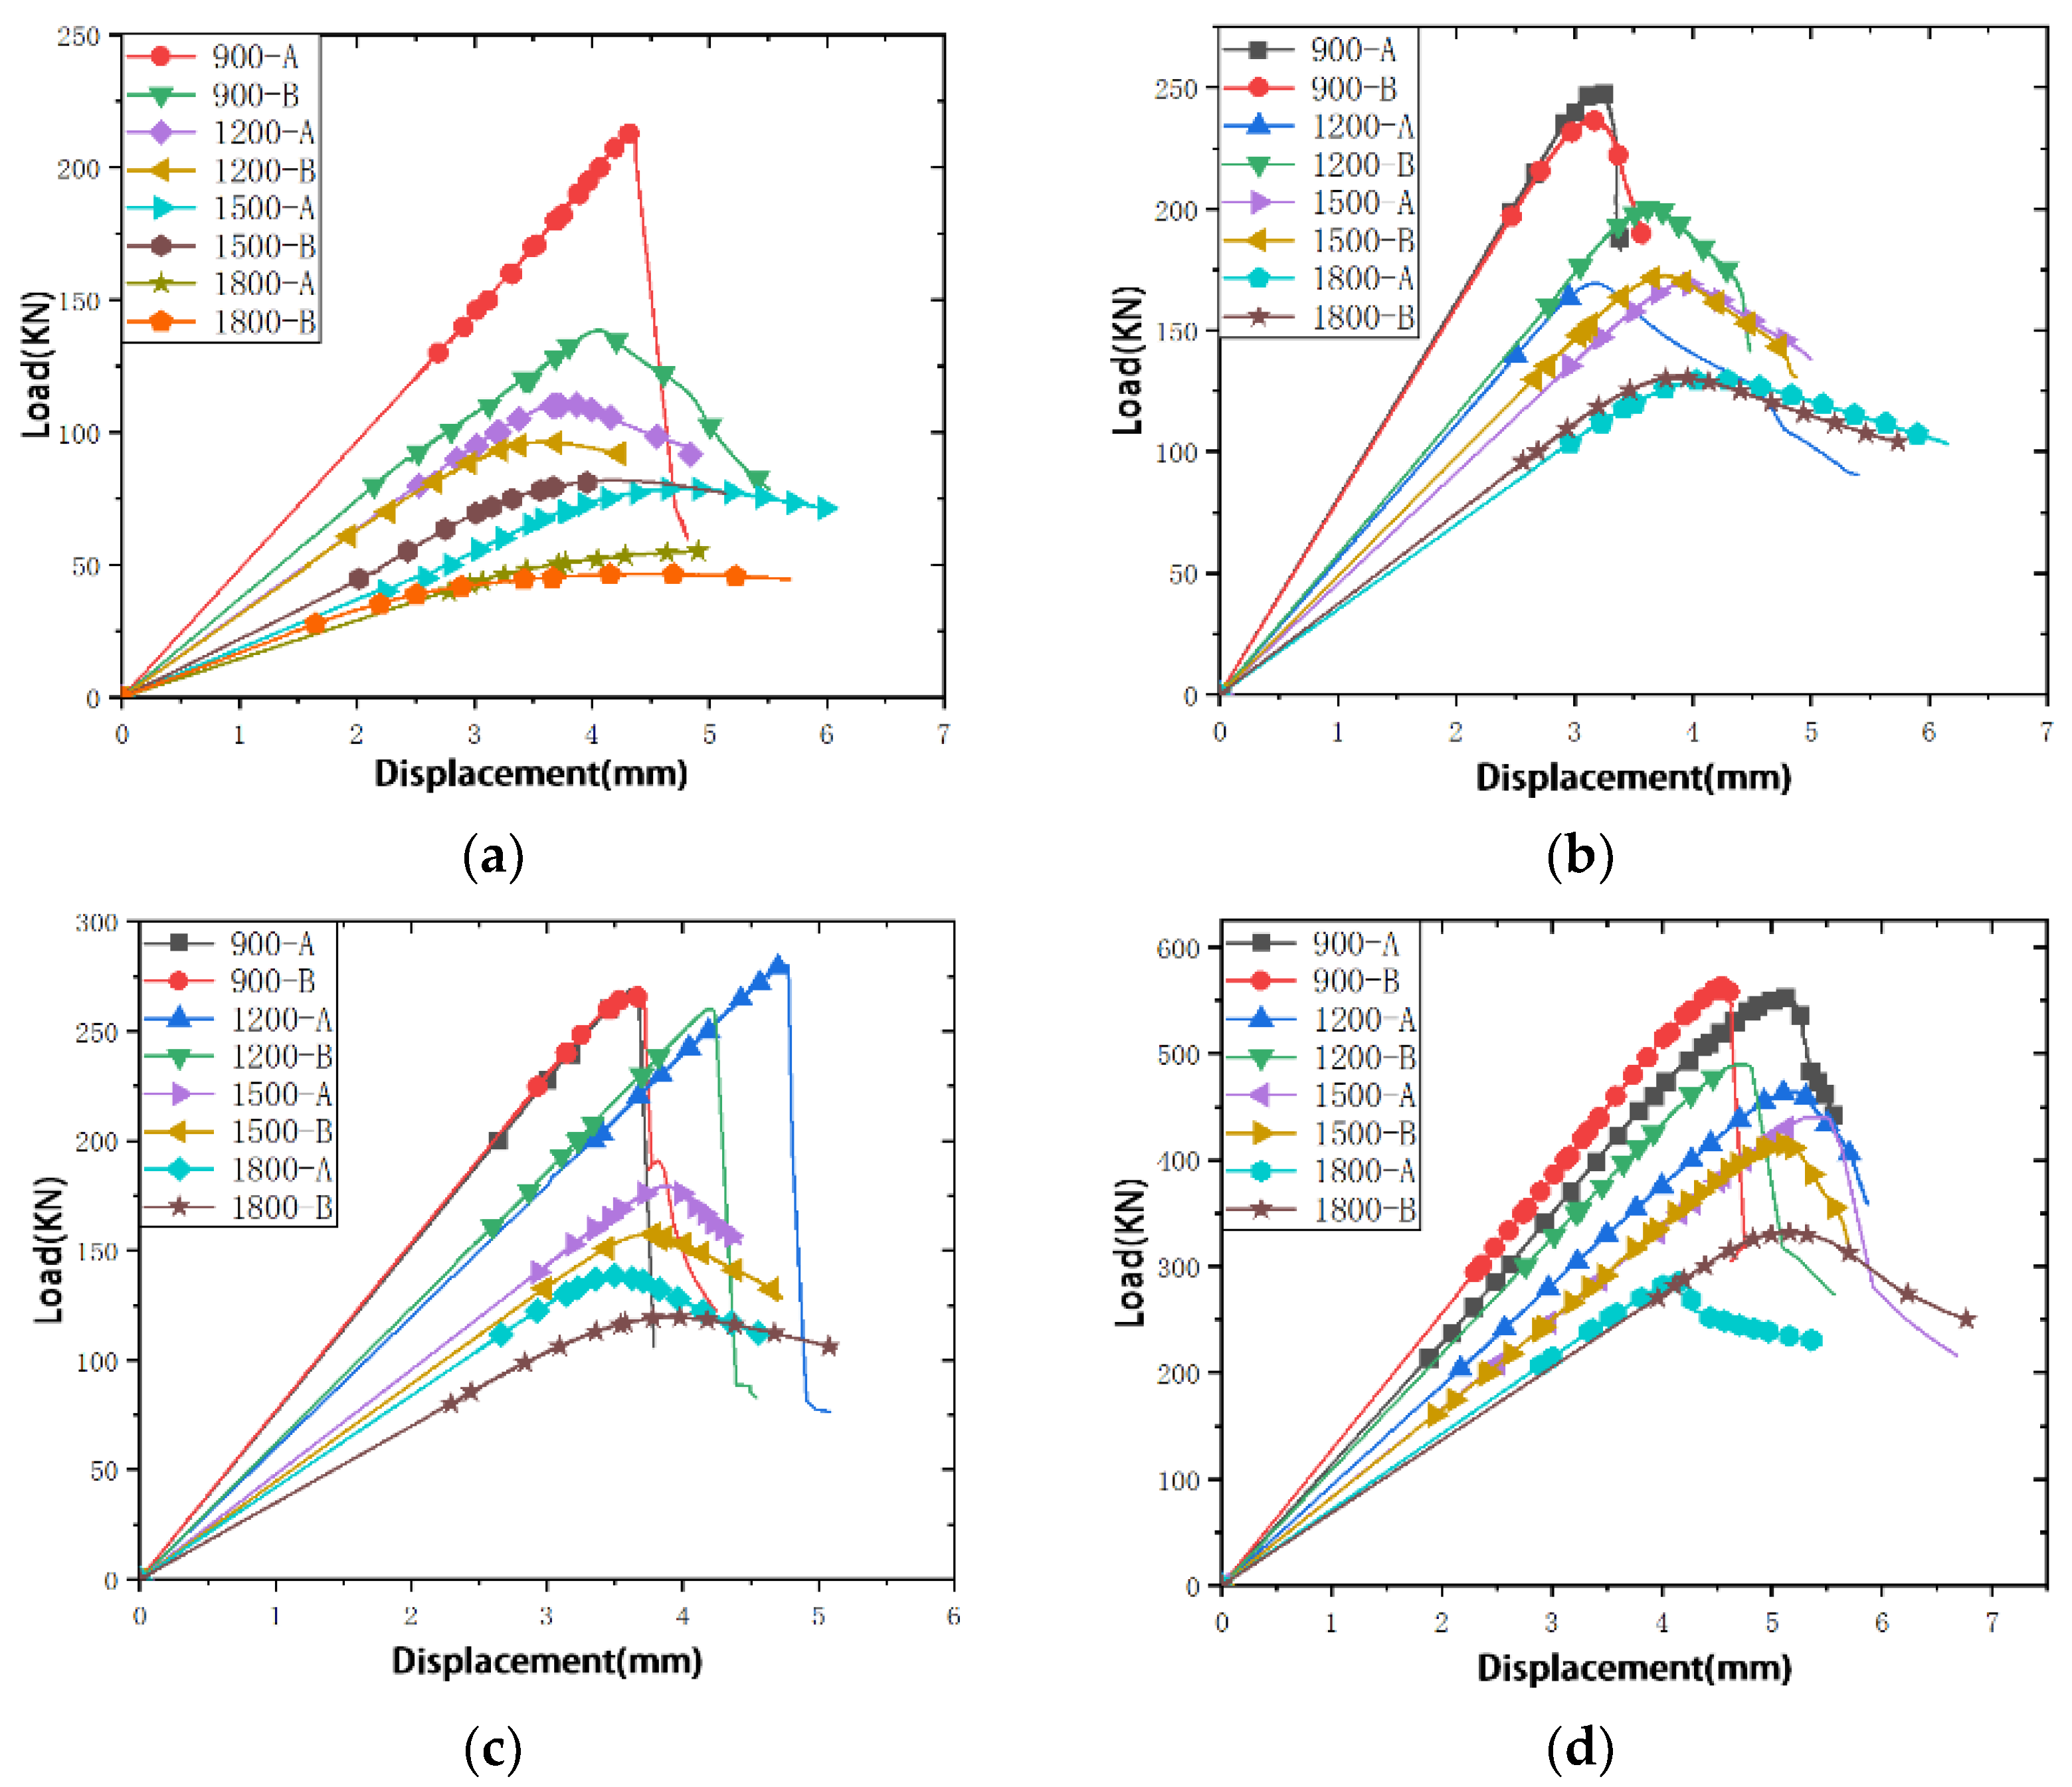
3.2. Load-Axial Displacement Curve

The axial displacement and loading curves of the four cross-sectional axial compression specimens are shown in Figure 9.
As can be seen in Figure 9, the load–displacement curve of the axial compression specimen grew linearly at the beginning of loading, with no significant change in the axial stiffness of the specimen, before approaching the damage load. When approaching the ultimate load, the load increased slowly with increasing displacement until reaching the ultimate load. Here, the smaller the length of the rod was, the steeper the load–displacement curve became when approaching the ultimate load. After damage to the specimen, the descending segment tended to flatten out with an increase in the slenderness ratio. From the load–displacement curve, it can be seen that the smaller the length of the same type of section, the greater the axial stiffness at the beginning of loading, but the faster the rate of decline in axial stiffness after damage. Additionally, the load–displacement curves of axial compression specimens with different cross-sectional dimensions show that the larger the cross-sectional dimensions are, the greater the axial stiffness of the specimens becomes before damage.
As can be seen from Table 3, the ultimate load-carrying capacity of the specimen decreased with an increase in the length of the rod. With an increase in the cross-sectional size, the ultimate load-carrying capacity of the specimen increased and became more prone to local buckling.

4. Finite Element Analysis

4.1. Finite Element Modeling

The finite element model of the assembled T-shaped aluminum alloy specimen was established using the ABAQUS 14.4 software (produced by Dassault Systemes, Paris, French). The constitutive model of the aluminum alloy was the Ramberg–Osgood model [25,26], and the model expression is shown in Equation (1) below.
ε = σ E 0 + 0.002 ( σ f 0.2 ) n
According to the material test results, we found that the material parameters of each cross-sectional component were different. Therefore, when verifying the finite element models of different cross-sectional components, different parameters obtained from the tests were used, and the parameters of the four types of cross-sections were selected according to Table 2. The hardening index “n” was obtained by fitting the Ramberg–Osgood model based on the material test results. A comparison between the fitting results and the test results is shown in Figure 4. During the parameter analysis, since the influence of material performance parameters was not considered, those parameters were uniformly selected according to GB/T 50,429 as E0 = 68 GPa, f0.2 = 240 MPa, fu = 240 MPa, and n = 24.
An eight-node three-dimensional solid-reduced integral cell (C3D8R) was used for meshing, and the thickness direction of the plate was divided into two layers of mesh with a mesh size of 10 × 10 mm.
The size of the grid in the model directly affected the accuracy of the calculations. In order to explore the influence of the grid size on the numerical simulation results, we used 2L75-6-1500 as an example. The mesh sizes of the aluminum alloy specimens were 10, 20, 30, and 40 mm. Then, we calculated the load-bearing capacity of the specimens under different grid sizes. The numerical calculation results are shown in Table 4.
With an improvement in the accuracy of the mesh division, the load-bearing capacity of the specimen gradually increased and became closer to the test value. However, the smaller the accuracy, the longer the calculation time. When the mesh size was less than a certain value, the difference of the load-bearing capacity of the specimen was smaller. Therefore, considering the time cost and simulation accuracy, the mesh size of the numerical simulation in this paper was 10 mm.
In order to better simulate the loading of the specimen as a hinged connection at both ends, a reference point is set at each end of the member model when building the finite element model. The reference point coincides with the section center in XY plane and the distance from the end face of the member is L = (a + b – 2 × c). The created reference points are coupled with the end faces of the axially compressed member. Based on the practical constraints of the axially compressed member test, the three directional degrees of freedom of the reference point RF-1 are restricted, and the two horizontal degrees of freedom of the reference point RF-2 and the rotational degrees of freedom of the longitudinal axis in the length direction of the member are restricted.
The calculated length Le of the specimen was taken as the distance between the rotation center of the upper and lower distal knife-hinge support, according to the following formula:
L e = L + ( a + b 2 × c ) × 2 = L + 166
where “L” is the actual length of the test specimen, “a” is the thickness of the knife-mouth plate, “b” is the thickness of the knife-slot plate, and “c” is the depth of the knife slot.

4.2. Verification of the Reasonableness of the Simplified Model for the Axial Compression Test of Assembled T-Shaped Aluminum Alloy Specimens

Nonlinear buckling analysis was performed on the members to simulate their mechanical behavior under axial compression. However, prior to the formal calculation, a linear eigenvalue buckling analysis was conducted to introduce the first-order mode shape of the member as the initial bending shape in the nonlinear buckling calculation. The amplitude of the initial bending shape was set to 1/1000 of the member length. To verify the correctness of the numerical model, numerical simulations were performed for all the test specimens. The simulated damage modes were found to match the test damage modes.
Taking the 2L75-6-900 and 2L100-75-8-1800 specimens as an example (as shown in Figure 10), the splicing T-type aluminum 2L75-6-900 specimen in the simulated damage experienced bending damage, and there was an obvious local buckling deformation in the midspan. The 2L100-75-8-1800 specimen in the simulated damage experienced bending and torsional instability and had a more obvious plate buckling phenomenon. The assembled T-shaped aluminum component 2L75-6-900 experienced bending failure around the symmetric (weak) axis due to a significant difference in bending stiffness between the symmetric and non-symmetric axes. The midspan connection plate experienced a significant increase in compressive stress after the component underwent bending deformation (caused by the axial compressive stress and eccentricity), leading to local buckling. In contrast, the 2L100-75-8-1800 component, with a similar bending stiffness around both symmetric and non-symmetric axes, experienced bending deformation around two axes with accompanying section torsion. The connection plates of this component, subjected to mutual compression, experienced significant local deformation.
A comparison between the load-carrying capacity obtained via numerical simulation and the test results is shown in Table 5, where Fexp is the ultimate load-carrying capacity of the specimen obtained by the test, and Ffe is the ultimate load-carrying capacity of the specimen obtained via numerical simulation. It can be seen that the numerical simulation analysis results match well with the test results, with the load-carrying capacity errors almost all within 10%. The finite element analysis results of specimen 2L60-5-1800 showed a significant difference from the test results, possibly due to the relatively long length of the specimen making it more difficult to find the centroid of the member during testing. This longer length created certain initial eccentricities. Additionally, the small cross-sectional dimensions of the specimen may have resulted in a greater impact on the bearing capacity due to the same initial eccentricity. Therefore, the bearing capacity obtained from the test was found to have a significant and negative deviation from the numerical calculation results under an ideal axial load.

4.3. Parameter Analysis

In this paper, the initial bending, cross-sectional dimensions, infill plate thickness, and other factors were considered. A parameter analysis of the assembled T-shaped aluminum alloy specimens was carried out based on numerical modelling to obtain the effects of different factors on the force performance of the specimens. In Figure 11, the abscissa represents the relative slenderness ratio of the member calculated according to Formula (8), and the ordinate represents the overall stability coefficient of the member.
(1)
Initial bending
In the nonlinear buckling analysis of the member, the first mode of the linear eigenvalue buckling analysis was introduced as the initial bending shape of the member, with amplitudes of 1/250, 1/500, 1/1000, and 1/2000 L. The effect of initial bending on the stability coefficient of the axial compression specimen according to FE analysis is shown in Figure 11a. The larger the initial bending, the lower the stability coefficient of the specimen. However, with an increase in the slenderness ratio, the effect of initial bending on the stability coefficient decreased.
(2)
Section size
A numerical model of members with different cross-sectional sizes was established, and nonlinear buckling analysis was conducted. Figure 11b shows the stability coefficients of specimens with different slenderness ratios under different cross-sectional width–thickness ratios. A change in the cross-sectional width–thickness ratio had a greater influence on the stability coefficient of axial compression specimens with a smaller slenderness ratio. The axial compression stability coefficients of different cross-sectional specimens tended to be the same when the slenderness ratio was larger. Therefore, the influence of changes in the width–thickness ratio on the overall stability of the axial compression specimen should be considered when the slenderness ratio is smaller.
(3)
Thickness of infill plate
The numerical model of the 2L115-87-9 cross-section member was used as the reference model, and the thickness of the infill panel was varied for parameter analysis. Figure 11c presents the column curves of cross-sectional 2L80-7 aluminum alloy specimens at different infill plate thicknesses. It can be seen that for specimens with medium or large slenderness ratios, the stability coefficient under axial compression increased with an increase in infill plate thickness. However, for specimens with smaller slenderness ratios, the stability coefficient under axial compression decreased instead with an increase in infill plate thickness, which was caused by a decrease in the synergistic working ability of double-corner aluminum.

5. Design Method for Assembled T-Shaped Aluminum Alloy Axial Compression Specimens

5.1. Load-Carrying Capacity Formula for Assembled T-Shaped Axially Compressed Specimens

According to the Code for Structural Design of Aluminum Alloy (GB50429-2007) [27], the overall stable bearing capacity of an axially compressed specimen with a non-welded uniaxial symmetrical section is calculated as follows:
N φ ¯ A f
where “N” represents the axial force applied to the specimen, “A” is the cross-section of the specimen, “f” is the design value of the compressive strength of the aluminum according to the specification, and “ φ ¯ ” is the overall stability coefficient of the modified axially compressed specimen:
φ ¯ = η e η a s φ
where “ η e ” is the section correction factor for the local buckling of the plate, “ η a s ” is the section asymmetry factor, and “ φ ” is the overall stability factor. The width-to-thickness ratio in this study was less than the specification requirements, so “ η e ” was taken as 1. The specimen in this test was not a welded connection, so “ η a s ” was also taken as 1.
To study the combined performance of the assembled T-shaped aluminum alloy axial compression specimens, the mechanical properties of single L-type aluminum alloy axial compression specimens and assembled T-shaped aluminum alloy specimens were compared based on numerical simulations (Figure 12, Figure 13, Figure 14 and Figure 15). The vertical coordinates in Figure 13 and Figure 15 represent the bearing capacity ratio of assembled T-shaped members to single L-type members.
Figure 12, Figure 13, Figure 14 and Figure 15 show that when the relative slenderness ratio λ ¯ < 0.75 ( λ ¯ can be calculated from Equation (8)), the axial pressure stability coefficient of the assembled T-shaped aluminum alloy specimen is significantly lower than that of the single L-type aluminum alloy specimen, and the load-carrying capacity of the assembled T-shaped specimen is only 1.2~1.4 times that of the single L-type specimen. However, when λ ¯ > 1.125, the stability coefficient of assembled T-shaped specimens is slightly larger than that of the single L-type specimens, and the load-carrying capacity is greater than two times that of the single L-type specimens. When the regularized slenderness ratio of the rods is small, due to the changes in the local boundary conditions of the plates of the connected limbs of the assembled T-shaped rods, the plates became more inclined to local buckling, which led to poor combined performance. However, the assembled T-shaped specimens presented better overall synergistic force performance in a wide range of regularized slenderness ratios.
For double-angle steel assembled T-shaped section members, Chinese standard GB50017 [28] stipulates that the spacing between the fillers should not exceed 40i (where i is the radius of the gyration of the flange about its axis), which will ensure the stability of the single member. Here, the assembled members can be treated as solid-web members for load-carrying capacity calculations. When the stability of the single member is guaranteed, and local buckling of the plate is avoided by limiting the width–thickness ratio of the plates, the load-carrying capacity of the assembled member will not be significantly lower than twice that of a single-angle steel. In this study, the spacing between the fillers also satisfies the requirement of being less than 40i. However, because aluminum alloy structures retain their strength after local buckling of the plates (that is, the occurrence of local buckling of the plates is not strictly avoided), when the slenderness ratio is small, the load-carrying capacity of the assembled T-shaped aluminum alloy members may be less than twice that of a single L-shaped member. This result also indicates that when calculating the load-carrying capacity of assembled T-shaped aluminum alloy members, it may not be possible to simply use the calculation formula for solid-web members in the specifications, and some adjustments may be necessary.

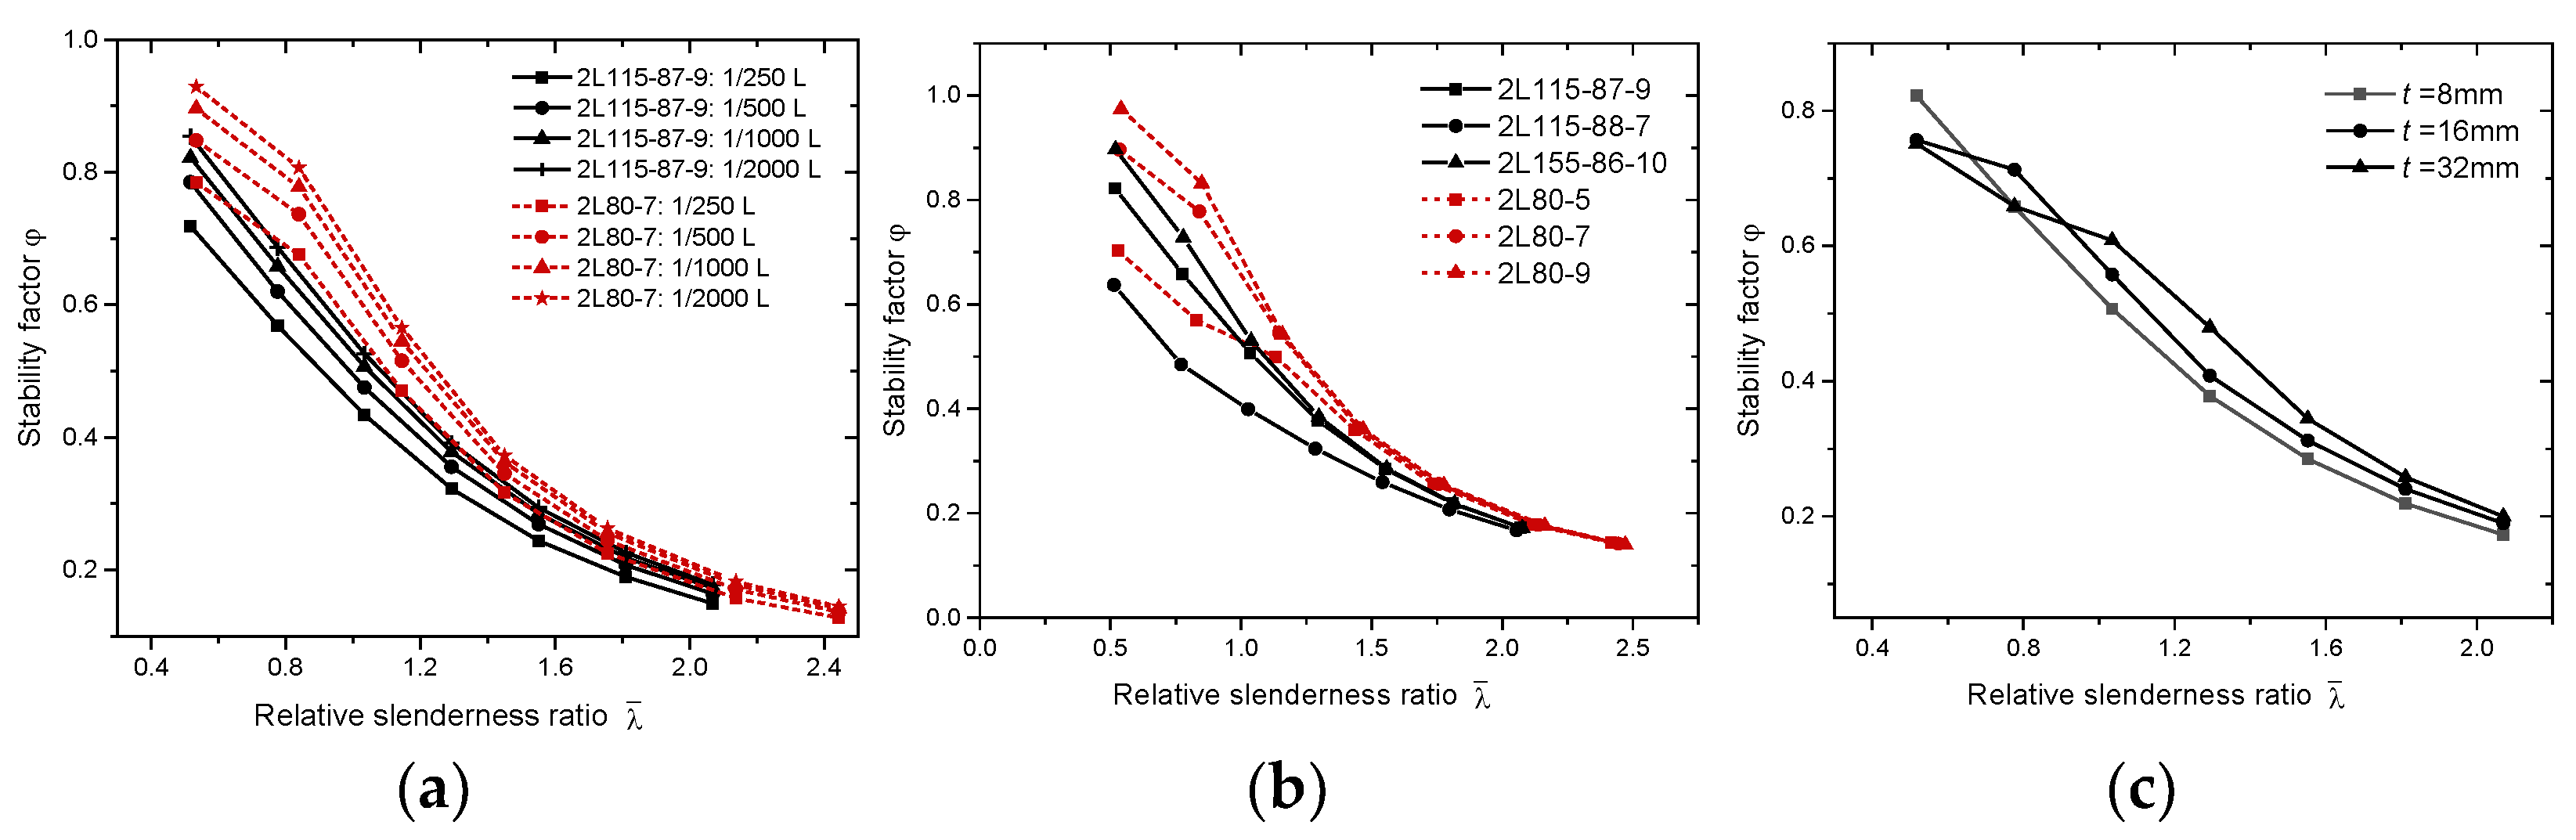
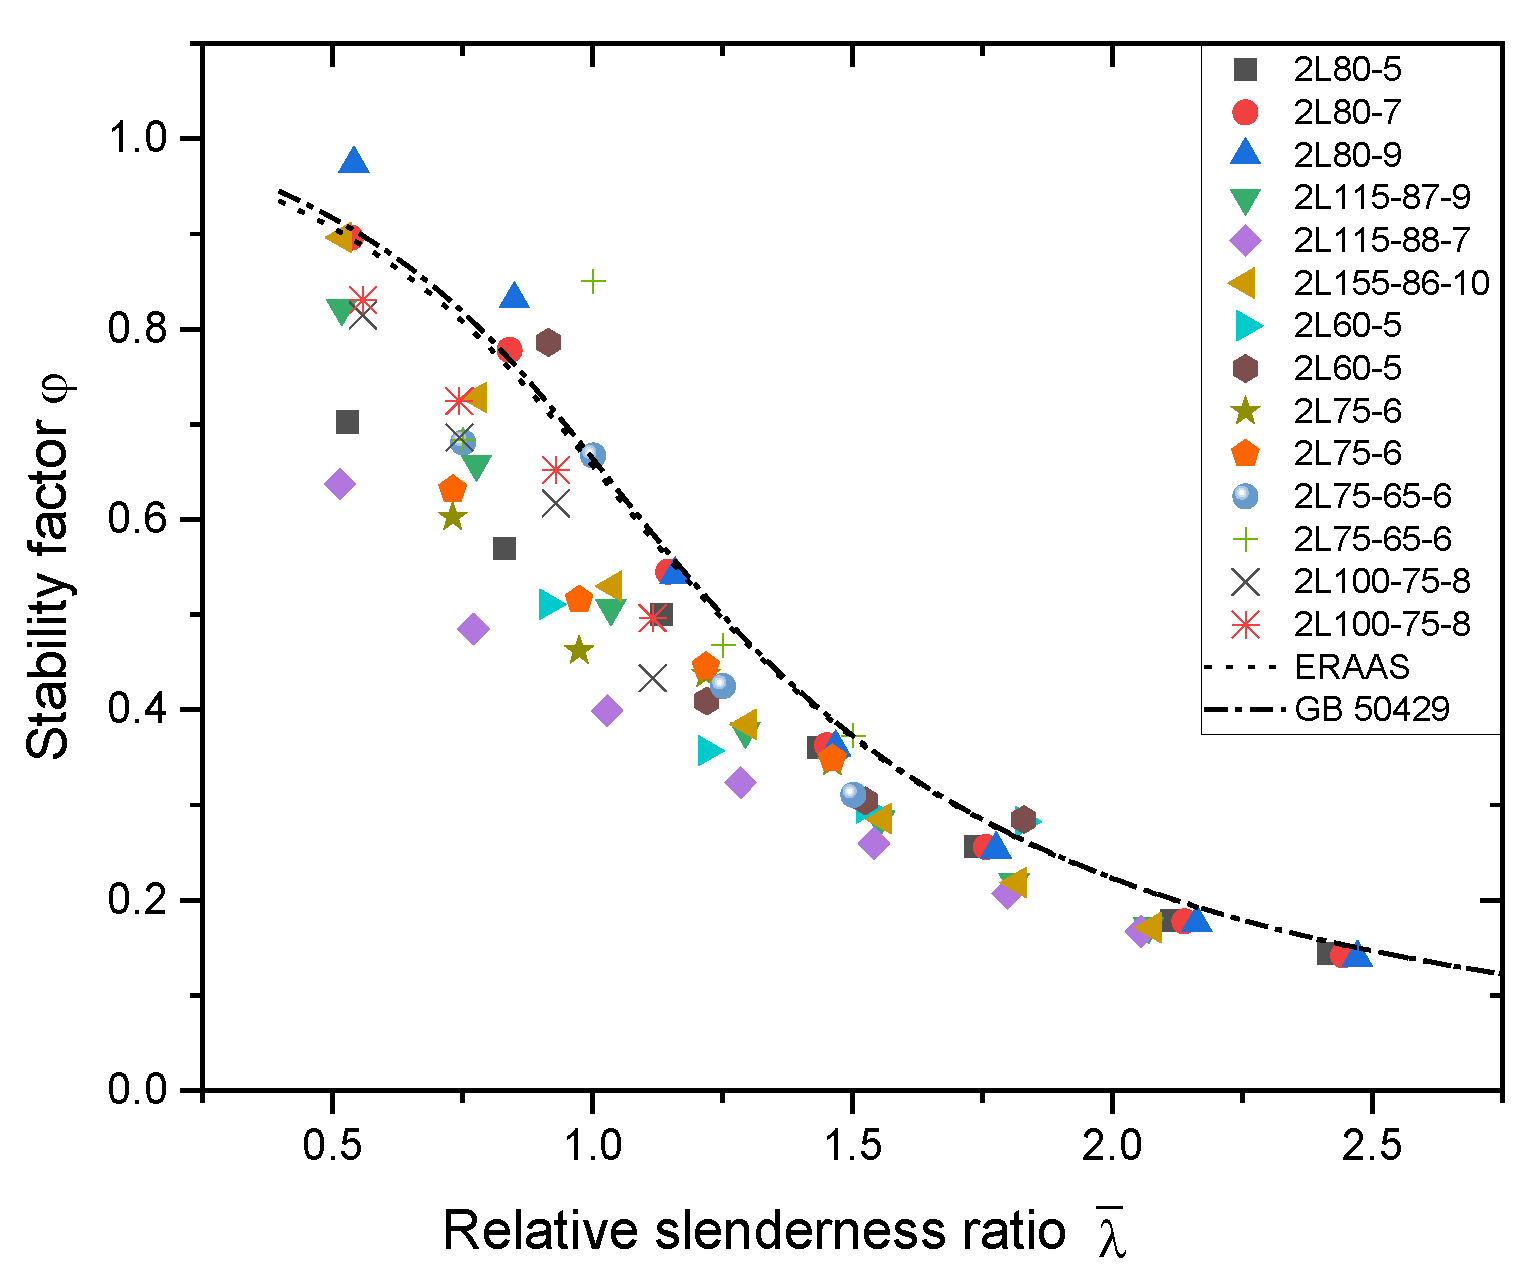
5.2. Study on the Formula for Calculating the Stability Coefficient of Axially Compressed Specimens

To further study the calculation method for the stability coefficient “φ” in the axial compressive load-carrying capacity formula, two calculation formulas are available.
The formula for the stability coefficient is obtained from the ERAAS code (1978) [29]:
φ = 1 2 λ ¯ 2 [ ( 1 + ε 0 + η λ ¯ 2 ) ( 1 + ε 0 + λ ¯ 2 ) 4 λ ¯ 2 ]
η = 1 2 β ( γ λ ¯ ) μ λ ¯ 2 λ ¯ 0 2
ε 0 = α λ ¯ 2 λ ¯ 0 2
where β = 0.172 for λ ¯ < 1.4, β = 0.000 for λ ¯ > 1.4, γ = 1.4, μ = 1.478, and “ λ ¯ ” indicates the relative slenderness ratio:
λ ¯ = A e f 0.2 N c r
where “Ae” is the gross cross-sectional area of the specimen, and “Ncr” is the Eulerian critical force based on the gross cross-section. Additionally, “φ” is the overall stability factor, and “Multiple” is the ratio of the load-bearing capacity of different specimens.
The formula for calculating the stability factor obtained from the Chinese Aluminum Alloy Design Code [27] is consistent with Perry’s formula:
φ = 1 2 λ ¯ 2 [ ( 1 + ε 0 + λ ¯ 2 ) ( 1 + ε 0 + λ ¯ 2 ) 4 λ ¯ 2 ]
ε 0 = α ( λ ¯ λ ¯ 0 )
The parameter values of the defect formula (Equations (7) and (9)) are listed in Table 6.
Numerical methods were used to calculate 42 assembled T-shaped aluminum alloy specimens with common cross-sectional specifications and 32 specimens with test sections, for 74 specimens in total. The material parameters here are taken as E = 68, f0.2 = 240, and fu = 265 MPa. The obtained numerical simulation results were then compared with the code formulas, as shown in Figure 16.
By comparing the results obtained via numerical simulation with the specifications, we determined the following: (1) the column curves of Chinese specifications and European specifications are very close; (2) the numerical simulation results decreased discretely with an increase in the slenderness ratio; (3) the curve obtained from the specifications was close to the upper envelope of the numerical simulation results, indicating that the use of the specification definition for the assembled T-shaped aluminum alloy specimens is on the unsafe side and that the Perry formula for the stability coefficient of compressed specimens needs to be revised.
Without altering the stability coefficient calculation formulas of the European standards and Chinese standards [11,12], only the coefficients in the defect calculation formulas Equations (7) and (10) were modified. The coefficients obtained from fitting the lower envelope of the numerical simulation results are shown in Table 7.
According to Figure 17, we determined the following: (1) the column curve obtained after being modified based on the Chinese code was smoother, and the stability coefficient was underestimated at λ ¯ > 1; the result was also conservative; (2) the column curve modified based on the ERAAS code consisted of two line segments, which was similar to the lower envelope of the numerical simulation results and more accurate; (3) compared to the column curves of European norms and Chinese norms, which were close to the upper envelope of the numerical simulations, the relative positions of the column curves of the modified formulas provided in this paper were lower than the numerical simulation results, which were on the safe side.

6. Conclusions

(1)
The experimental results indicate that, for equilateral and non-equilateral assembled T-shaped aluminum alloy components with clear strong and weak axes, primarily bending instability occurs, accompanied by local buckling of the plates when the aspect ratio is relatively small. For non-equilateral assembled T-shaped aluminum alloy components without clear strong and weak axes, torsional buckling instability occurs, accompanied by local deformation of the connecting limbs due to mutual compression.
(2)
The numerical model established in this paper can effectively simulate the mechanical properties of assembled T-shaped aluminum alloy components under axial compression.
(3)
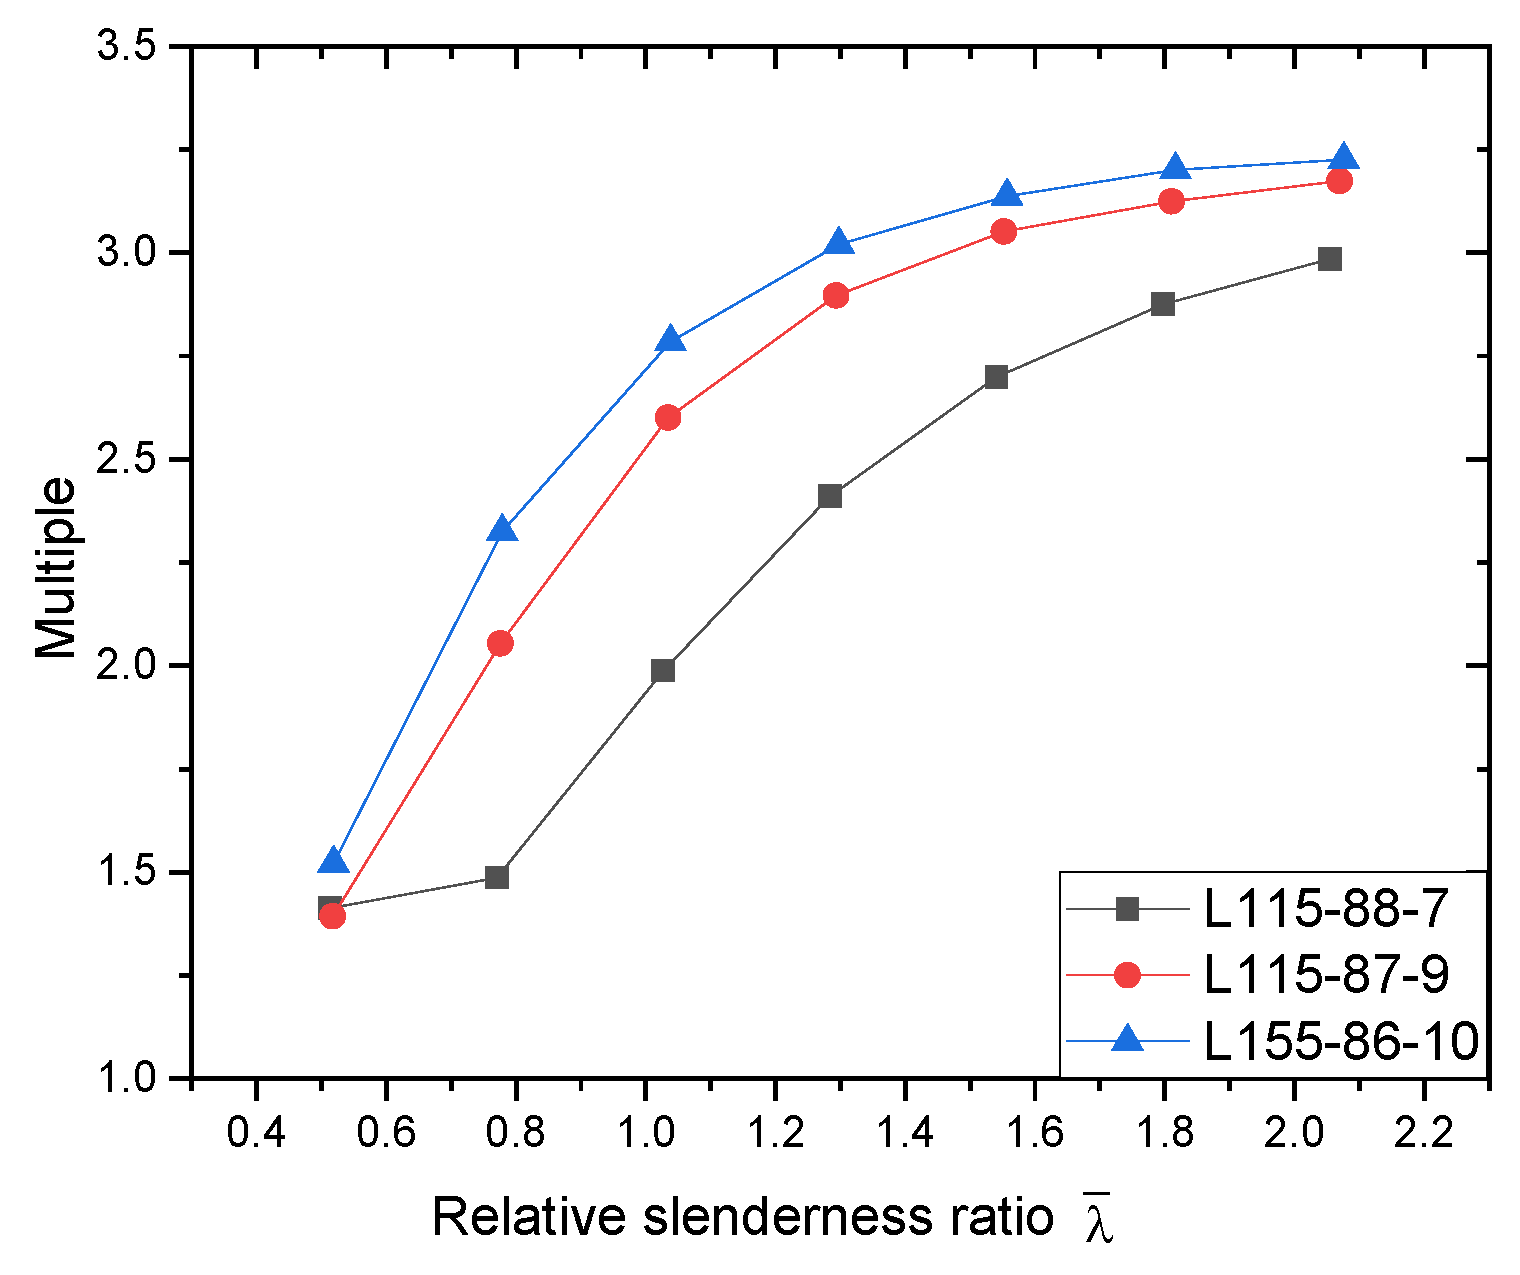
Based on the numerical models, the composite performance of assembled T-shaped members was investigated. When the relative slenderness ratio of the members was less than 0.75, the boundary conditions of the plate components in the assembled T-shaped members changed, resulting in a tendency for local buckling of the plates and poor composite performance, with the bearing capacity found to be significantly lower than that of the double L-shaped aluminum alloy members. When the relative slenderness ratio was greater than 1.125, the assembled T-shaped aluminum alloy members exhibited good overall synergistic force performance, with the bearing capacity significantly greater than that of the double L-shaped aluminum alloy members (up to twice as much).
(4)
The experimental and numerical results were compared with Chinese and European standards, and it was found that the calculation methods in the standards tended to be unsafe. Parameters for calculating the defects of the members were modified based on Chinese and European standards. The modified column curve was the lower envelope of the numerical calculation results, which enabled a more accurate and safe prediction of the bearing capacity of the assembled T-shaped aluminum alloy members.

Author Contributions

Conceptualization, Y.O. and H.L.; methodology, Y.O.; software, J.Y.; validation, Y.O. and H.L.; formal analysis, Y.O.; investigation, H.L.; resources, H.L.; data curation, Z.L.; writing—original draft preparation, Y.O. and Z.L.; writing—review and editing, J.Y., J.Z. and X.L.; visualization, X.L.; supervision, H.L.; project administration, H.L.; funding acquisition, H.L. All authors have read and agreed to the published version of the manuscript.

Funding

This research was funded by the National Natural Science Foundation of China, grant number 52178137.

Data Availability Statement

The data presented in this study are available on request from the corresponding author. The data are not publicly available due to the confidentiality agreement between the company and the university.

Conflicts of Interest

The authors declare no conflict of interest. The funders had no role in the design of the study; in the collection, analyses, or interpretation of data; in the writing of the manuscript; or in the decision to publish the results.

References

  1. Wang, Z.; Wang, Y.; Sojeong, J.; Ouyang, Y. Experimental investigation and parametric analysis on overall buckling behavior of large-section aluminum alloy columns under axial compression. Thin-Walled Struct. 2018, 122, 585–596. [Google Scholar] [CrossRef]
  2. Wang, Y.Q.; Yuan, H.X.; Chang, T.; Du, X.X.; Yu, M. Compressive buckling strength of extruded aluminum alloy I-section columns with fixed-pinned end conditions. Thin-Walled Struct. 2017, 119, 396–403. [Google Scholar] [CrossRef]
  3. Adeoti, G.O.; Fan, F.; Wang, Y.; Zhai, X. Stability of 6082-T6 aluminum alloy columns with H-section and rectangular hollow sections. Thin-Walled Struct. 2015, 89, 1–6. [Google Scholar] [CrossRef]
  4. Yuan, H.X.; Yuan, H.X.; Wang, Y.; Chang, T.; Du, X.; Bu, Y.; Shi, Y.J. Local buckling and post buckling strength of extruded aluminum alloy stub columns with slender I-sections. Thin-Walled Struct. 2015, 90, 140–149. [Google Scholar] [CrossRef]
  5. Guo, X.; Liang, S.; Shen, Z. Experiment on aluminum alloy specimens under axial compression. Front. Struct. Civ. Eng. 2015, 9, 48–64. [Google Scholar] [CrossRef]
  6. Zhi, X.; Wang, Y.; Zhang, Y.; Li, B.; Ouyang, Y. Study of local buckling performance of 7075-T6 high-strength aluminium alloy H-section stub columns. Thin-Walled Struct. 2022, 180, 109925. [Google Scholar] [CrossRef]
  7. Li, L.; Boissonnade, N. Local/global coupled instabilities of slender I-sections under compression. Thin-Walled Struct. 2022, 172, 108842. [Google Scholar] [CrossRef]
  8. Ali, S.B.; Georgantzia, E.; Kamaris, G.S.; Gkantou, M.; Kot, P. Experimental study of square and rectangular hollow section aluminum alloy columns. J. Phys. Conf. Ser. 2022, 2198, 012046. [Google Scholar] [CrossRef]
  9. Feng, R.; Wu, Z.; Haiying, W.; Chen, A.; Chen, Y. Tests of perforated aluminium alloy SHSs and RHSs under axial compression. Thin-Walled Struct. 2018, 130, 194–212. [Google Scholar] [CrossRef]
  10. Zhao, Y.; Zhai, X.; Wang, J. Buckling behaviors and ultimate strength of 6082-T6 aluminum alloy columns with square and circular hollow sections under eccentric compression—Part II: Parametric study, design provisions and reliability analysis. Thin-Walled Struct. 2019, 143, 106208. [Google Scholar] [CrossRef]
  11. Zhao, Y.; Zhai, X.; Sun, L. Test and design method for the buckling behaviors of 6082-T6 aluminum alloy columns with box-type and L-type sections under eccentric compression. Thin-Walled Struct. 2016, 100, 62–80. [Google Scholar] [CrossRef]
  12. Rong, B.; Guo, Y.; Li, Z. Study on the stability behavior of 7A04-T6 aluminum alloy square and rectangular hollow section columns under axial compression. J. Build. Eng. 2021, 45, 103652. [Google Scholar]
  13. Li, B.; Wang, Y.; Zhi, X.; Zhang, Y.; Baniotopoulos, C.C. Testing, modelling and design of 7A04-T6 high-strength aluminium alloy RHS columns under axial compression. J. Build. Eng. 2022, 57, 104910. [Google Scholar] [CrossRef]
  14. Zhi, X.; Wang, Y.; Li, B.; Zhang, Y.; Ouyang, Y. Axial compression behaviour of 7A04-T6 high-strength aluminium alloy SHS and RHS stub columns. Thin-Walled Struct. 2022, 180, 109816. [Google Scholar] [CrossRef]
  15. Hu, Y.; Rong, B.; Zhang, R.; Zhang, Y.; Zhang, S. Study of buckling behavior for 7A04-T6 aluminum alloy rectangular hollow columns. Thin-Walled Struct. 2021, 169, 108410. [Google Scholar] [CrossRef]
  16. Wang, Y.; Fan, F.; Lin, S. Experimental investigation on the stability of aluminum alloy 6082 circular tubes in axial compression. Thin-Walled Struct. 2015, 89, 54–66. [Google Scholar] [CrossRef]
  17. Li, Z.Y.; Wang, C.X.; Li, J.J.; Ding, Y.J.; Rong, B. 7A04. Study on the axial compression stability of aluminum alloy circular tube specimens. J. Tianjin Univ. Nat. Sci. Eng. Technol. Ed. 2020, 10, 1036–1044. [Google Scholar]
  18. Zhu, J.; Young, B. Experimental investigation of aluminum alloy circular hollow section columns. Eng. Struct. 2006, 28, 207–215. [Google Scholar] [CrossRef]
  19. Wang, Y.; Wang, Z.; Hu, X.G.; Han, J.; Xing, H.J. Experimental study and parametric analysis on the stability behavior of 7A04 high-strength aluminum alloy angle columns under axial compression. Thin-Walled Struct. 2016, 108, 305–320. [Google Scholar] [CrossRef]
  20. Wang, Z.; Wang, Y.; Yun, X.; Gardner, L.; Hu, X. Experimental and Numerical Study of Fixed-Ended High-Strength Aluminum Alloy Angle-Section Columns. J. Struct. Eng. Asce. 2020, 146, 04020206. [Google Scholar] [CrossRef]
  21. Zhu, J.; Li, Z.; Su, M.; Young, B. Numerical study and design of aluminum alloy channel section columns with welds. Thin-Walled Struct. 2019, 139, 139–150. [Google Scholar] [CrossRef]
  22. Yuan, L.; Zhang, Q. Buckling behavior and design of concentrically loaded T-section aluminum alloy columns. Eng. Struct. 2022, 260, 114221. [Google Scholar] [CrossRef]
  23. Zhang, Y.; Wang, Y.; Zhongxing, W.; Bu, Y.; Fan, S.; Zheng, B. Experimental investigation and numerical analysis of pin-ended extruded aluminum alloy unequal angle columns. Eng. Struct. 2020, 215, 110694. [Google Scholar] [CrossRef]
  24. Zhang, Y.; Bu, Y.; Wang, Y.; Wang, Z.; Ouyang, Y. Study of flexural–torsional buckling behavior of 6061-T6 aluminum alloy unequal-leg angle columns. Thin-Walled Struct. 2021, 164, 107821. [Google Scholar] [CrossRef]
  25. Ramberg, W.; Osgood, W.R. Description of Stress-Strain Curves by Three Parameters. Vol. Technical; National Advisory Committee for Aeronautics: Washington, DC, USA, 1943.
  26. Guo, X. Theoretical and Experimental Research on Aluminum Alloy Structural Members. Ph.D. Thesis, Tongji University, Shanghai, China, 2006. [Google Scholar]
  27. GB/T 50429-2007; Aluminum Alloy Structural Design Specification. China Planning Press: Beijing, China, 2007.
  28. GB50017-2017; Code for Design of Steel Structures. China Planning Press: Beijing, China, 2018.
  29. EN 1999 Eurocode 9; Design of Aluminum Structures: Part 1-1 to 1-5. CEN: Brussels, Belgium, 2007.
Figure 1. Cross-sections of specimens: (a) 2L60-5 Equal T-shaped Specimen, (b) 2L75-6 Equal T-shaped Specimen, (c) 2L75-65-6 Unequal double L-type specimen, (d) 2L100-75-8 Unequal T-shaped specimen.
Metals 13 00919 g001
Figure 2. Specimen size of material.
Metals 13 00919 g002
Figure 3. Stress–strain curve of material.
Metals 13 00919 g003
Figure 4. Loading setup. (a) Loading device. (b) Knife hinge support and fixing slot.
Metals 13 00919 g004
Figure 5. Layout of the strain and displacement measuring points at the midspan. (a) Strain measuring points; (b) Displacement measuring points.
Metals 13 00919 g005
Figure 6. Layout of the displacement gauge at the double-knife hinge base: (a) Front view; (b) Side view.
Metals 13 00919 g006
Figure 7. Bending instability failure specimen: (a) 2L60-5-900, (b) 2L60-5-1800, (c) 2L75-6-900, (d) 2L75-6-1800, (e) 2L75-65-6-900, (f) 2L75-65-6-1800.
Metals 13 00919 g007
Figure 8. Torsional–Flexural buckling specimens: (a) 900 mm, (b) 1200 mm, (c) 1500 mm, (d) 1800 mm.
Metals 13 00919 g008
Figure 9. Load–displacement curves of axial compression specimens: (a) 2L60-5 Load–displacement curve, (b) 2L75-6 Load–displacement curve, (c) 2L75-65-6 Load–displacement curve, (d) 2L100-75-8 Load–displacement curve.
Metals 13 00919 g009
Figure 10. Failure pattern of the numerical simulation specimen under axial compression: (a) 2L-75-6-900, (b) 2L-100-75-8-1800.
Metals 13 00919 g010
Figure 11. Failure patterns of the numerical simulation specimens under axial compression: (a) Initial bending, (b) Section size, (c) Thickness of infill plate.
Metals 13 00919 g011
Figure 12. Comparison of stability factors between equal L-type and double equal L-type aluminum alloy specimens.
Metals 13 00919 g012
Figure 13. Comparison of the load-carrying capacity between double equal L-type aluminum alloy specimens and equilateral L-type aluminum alloy specimens.
Metals 13 00919 g013
Figure 14. Comparison of the stability coefficients of unequal L-type aluminum alloy specimens and double unequal L-type aluminum alloy specimens.
Metals 13 00919 g014
Figure 15. Comparison of load capacity of double unequal L-type aluminum alloy specimens and unequal L-type aluminum alloy specimens.
Metals 13 00919 g015
Figure 16. Comparison of numerical simulation results with European and Chinese codes.
Metals 13 00919 g016
Figure 17. Comparison of numerical simulation results with the proposed formula.
Metals 13 00919 g017
Table 1. Geometric parameters of specimens (in mm).
Specimen NumberLengthA Limb WidthB Limb WidthA Limb ThicknessB Limb ThicknessSpecimen
Number
LengthA Limb WidthB Limb WidthA Limb ThicknessB Limb Thickness
2L75-6-900A89975.0075.005.906.002L75-65-6-900A89974.8664.905.885.92
2L75-6-900B90274.9275.006.006.002L75-65-6-900B89974.9665.005.925.90
2L75-6-1200A120275.0074.886.005.882L75-65-6-1200A120275.0064.925.945.90
2L75-6-1200B120075.0075.006.005.882L75-65-6-1200B120074.9264.865.906.00
2L75-6-1500A150074.9075.005.925.902L75-65-6-1500A150774.9064.885.865.84
2L75-6-1500B149675.0074.865.905.922L75-65-6-1500B150075.0064.905.965.92
2L75-6-1800A180174.9274.905.966.002L75-65-6-1800A180374.9264.906.005.90
2L75-6-1800B180374.8875.005.946.002L75-65-6-1800B180375.0265.005.865.94
2L60-5-900A89959.8659.724.844.902L100-75-8-900A902100.0475.008.268.26
2L60-5-900B90059.8259.705.004.882L100-75-8-900B895100.0075.028.108.08
2L60-5-1200A120159.8459.704.924.822L100-75-8-1200A1201100.0875.008.148.20
2L60-5-1200B119859.7259.684.884.902L100-75-8-1200B1198100.0674.968.128.14
2L60-5-1500A149759.8459.804.904.922L100-75-8-1500A1490100.0475.088.148.14
2L60-5-1500B149959.9059.885.004.922L100-75-8-1500B1510100.0874.988.128.10
2L60-5-1800A179159.8659.824.964.902L100-75-8-1800A1796100.0075.048.108.16
2L60-5-1800B179859.9259.844.864.882L100-75-8-1800B180099.9875.008.168.14
Table 2. Geometric parameters of specimens.
NumberE0/MPaf0.2/MPafu/MPanExtreme Elongation (%)
L60-561,92229130862.8414.34
L75-664,02321524425.8814.15
L75-65-660,67525928737.8416.50
L100-75-871,06028630174.9214.50
Table 3. Damage of the rods.
Specimen NumberUltimate Load
Capacity Fexp (kN)
Destruction Mode
2L60-5-900144Bending Instability + Local Buckling
2L60-5-1200106Bending Instability
2L60-5-150075Bending Instability
2L60-5-180053Bending Instability
2L75-6-900266Bending Instability + Local Buckling
2L75-6-1200213Bending Instability + Local Buckling
2L75-6-1500175Bending Instability + Local Buckling
2L75-6-1800133Bending Instability
2L75-65-6-900283Bending Instability + Local Buckling
2L75-65-6-1200230Bending Instability + Local Buckling
2L75-65-6-1500182Bending Instability
2L75-65-6-1800147Bending Instability
2L100-75-8-900545Bending Instability + Local Buckling
2L100-75-8-1200472Bending Instability + Local Buckling
2L100-75-8-1500390Bending Instability + Local Buckling
2L100-75-8-1800308Bending Instability + Local Buckling
Table 4. Numerical simulation time consumption table.
Mesh Size
(mm)
Number of NodesNumber of
Elements
Calculation Time
(s)
Load Bearing
Capacity
(kN)
554,536545,365,1564440148
1015,88299361520147
2053163190920143
3030511780565249
4021301214387247
Table 5. Comparison of the test results and numerical simulation results.
Specimen NumberFexp (kN)Ffe (kN)Fexp/Ffe
2L60-5-9001441500.960
2L60-5-12001061080.981
2L60-5-150075800.938
2L60-5-180053600.883
2L75-6-9002662461.081
2L75-6-12002132021.054
2L75-6-15001751681.042
2L75-6-18001331201.108
2L75-65-6-9002832571.101
2L75-65-6-12002302141.075
2L75-65-6-15001821761.034
2L75-65-6-18001471351.089
2L100-75-8-9005455500.991
2L100-75-8-12004724770.990
2L100-75-8-15003903960.985
2L100-75-8-18003083190.966
Table 6. Parameter values of the defect formula.
ParameterERAASGB50429
α 0.20.2
λ ¯ 0 0.10.15
Table 7. Modified value of the defect formula parameters.
ParameterERAAS-ModifiedGB50429-Modified
α 0.751
λ ¯ 0 00
Disclaimer/Publisher’s Note: The statements, opinions and data contained in all publications are solely those of the individual author(s) and contributor(s) and not of MDPI and/or the editor(s). MDPI and/or the editor(s) disclaim responsibility for any injury to people or property resulting from any ideas, methods, instructions or products referred to in the content.

