Article

Novel Approach to Prepare Magnesium and Mg-Al Alloy from Magnesia by Using the Closed Microwave Aluminothermic Method

1
School of Material Science and Engineering, Xi’an University of Science and Technology, Xi’an 710054, China
2
School of Metallurgical Engineering, Xi’an University of Architecture and Technology, Xi’an 710055, China
*
Author to whom correspondence should be addressed.
Metals 2023, 13(5), 905; https://doi.org/10.3390/met13050905
Submission received: 1 April 2023 / Revised: 27 April 2023 / Accepted: 4 May 2023 / Published: 7 May 2023
(This article belongs to the Special Issue Additive Manufacturing of Non-ferrous Alloys)

Abstract

:
Herein, we report a novel approach to obtaining magnesium and nanocrystal Mg-Al alloy from magnesia using a closed microwave aluminothermic method in order to solve the problems of high energy consumption, high pollution, and low productivity in the process of magnesium and its alloy production. The main idea of the paper is to design a technique for the preparation of magnesium–aluminum alloy during the reduction process of MgO directly under atmospheric pressure. Based on this experimental idea, we have established a closed microwave aluminothermic reduction reactor. The great advantage of the reaction device is that it can make the reaction material heat up quickly to the reaction temperature in the microwave heating process and produce high-pressure magnesium vapor, which reacts with aluminum dramatically to form Mg-Al alloy under microwave irradiation. By the calculation of the electromagnetic field of the reaction device and sample using ANSYS electronics desktop 2018, the optimum microwave heating conditions for samples have been established. Based on the calculation results, we demonstrate that magnesium and its alloy are prepared successfully by using this method. In addition, the reduction rate of MgO is greatly improved, which is higher up to 79.97 Wt% when the reduction time is 30 min, at 1273 K, and the Mg2Al3 and MgAl alloy is formed during the reduction process as well. Moreover, the formation mechanism of Mg-Al alloy during the reduction process under microwave irradiation was discussed further. Our findings could provide a new approach, insights, and research directions to obtain magnesium and Mg-Al alloy directly from magnesia under normal pressure.

1. Introduction

For the last few decades, the demand for magnesium has been increasing dramatically in the automotive industry, aviation, and aerospace fields on account of its excellent physical and mechanical properties, such as its lightweight, recyclable features, and high strength characteristics [1,2,3]. Currently, magnesium is mainly prepared using thermal reduction and electrolysis methods [4,5]. As a well-known process, the Pidgeon process is the most mature magnesium smelting method in China, which has the advantage of being a simple technical process, needing less investment to build a factory, having a flexible production scale, and higher purity of magnesium [6,7,8,9,10]. Nevertheless, the disadvantages of high energy consumption and environmental pollution of the Pidgeon process have brought a great challenge to the development of the economy and society. In order to improve the efficiency of magnesium production, the vacuum carbothermal reduction method to produce magnesium from MgO has attracted great research interest due to its lower energy consumption and higher production efficiency of magnesium production compared with the Pidgeon process of magnesium smelting, and this method has great application prospect if the problem of reverse reaction between Mg vapor and CO is effectively controlled [11,12,13,14,15,16,17,18]. Compared with the reducing agents ferrosilicon alloy and carbon, aluminum metal has stronger reducing power. Thus, lots of valuable research works have been focused on the reduction of MgO using the vacuum aluminothermic reduction method with a vacuum pressure of less than 20 pa [19,20,21,22,23]. Nevertheless, this method has some drawbacks; one is that the reduction process is performed under the lower vacuum pressure condition.
Presently, the magnesium smelting process under atmospheric pressure has become an important research direction for efficient magnesium production. The basic principle of this technology is that the condition of extracting magnesium from magnesia is achieved by reducing the partial pressure of magnesium vapor using high-speed argon gas flowing. Several investigators reported that magnesium could be extracted from MgO using the silicothermic reduction method in argon flowing environment, and they found that the diffusion of internal mass transfer and diffusion of reacted species are the limited steps and play an important role in magnesium smelting efficiency during the reduction of MgO [24,25,26,27,28]. Recently, it is worth noting that microwave irradiation which could solve the problems mentioned above in the magnesium smelting process, greatly improves the kinetic conditions of chemical reactions and speed up the heating transfer between reaction materials due to its three-dimensional heating, selective heating, and rapid heating characteristics. The materials with good microwave absorption characteristics could take up the energy from the microwave field and become heated very rapidly [29,30]. As a result, the rapid advancement of this heating technology has attracted lots of successful applications to metallurgy [31] and has been widely used in the field of speeding up mineral leaching rate [32] and efficient extraction of Fe, Ni, and V non-ferrous metal [33,34,35]. More recently, some results of the preparation of magnesium from MgO using the microwave heating method have been obtained [36,37,38], but there are still some obvious deficiencies in the current research. Firstly, the reduction reaction of MgO is still a solid–solid reaction process due to using C or ferrosilicon as a reductive agent, which greatly limits the heating transfer throughout the reactants and decreases the reduction ratio of MgO. Secondly, the reduction process needs a high vacuum or high reaction temperature, which leads to higher energy consumption, and it is worth noting that magnesium alloy cannot be obtained directly from this process. Thus, it is urgent to find a low energy consumption and high efficiency of magnesium and its alloy production method.
Here, we report the closed microwave aluminothermic reduction method to prepare magnesium and Mg-Al alloy directly from magnesia. In order to make full use of carbon resources and reduce the cost of magnesium production, the reaction between Al-C, Al-CaC2, and MgO-CaO is investigated as well based on our previous work [23]. Firstly, the electric and magnetic field intensity of the reaction device and the sample were calculated by using the computational simulation calculation software (ANSYS electronics desktop 2018) in order to obtain the best microwave heating conditions for the reaction sample. Furthermore, the formation mechanism of Mg-Al alloy during the microwave aluminothermic reduction of MgO is discussed as well.

2. Material and Methods

2.1. Raw Materials

The materials used in this study are MgO (purity ≥ 98.0 Wt%), CaO (purity ≥ 97.0 Wt%), Al (purity ≥ 99.5 Wt%), C (purity ≥ 99.5 Wt%), and CaC2 (purity ≥ 98 Wt%). In order to promote ball milling effect on sample, ball mill additive sodium stearate (purity ≥ 99.5 Wt%) was mixed with the sample during the ball milling process. These materials are all made in China.

2.2. Methods

2.2.1. Mechanically Activated Samples Preparation

The weighed samples are mixed well by the ball milling process, and the weight ratio of ball to sample is 5:1 (YXQM-1L, MITR, Changsha, China). Based on our previous experiment results [23], in order to obtain activated sample sufficiently, the ball milling speed and time are fixed at 600 r/min, 5 h, respectively. During the milling process, sodium stearate (ball mill additives 6 Wt%) was added to the mixtures to improve ball grinding efficiency of reaction materials.

2.2.2. The Closed Microwave Aluminothermic Method

The process of this method is divided into two steps, the formation of high-pressure magnesium vapor stream and the formation of Mg-Al alloy, which are shown in Figure 1A. Firstly, the ball-milled samples are compacted into circular cylinder (φ20 × 5 mm) under the pressure of 320 MPa. Samples and graphite flakes (20 mm in diameter and 5 mm in thickness) are placed at particular intervals in order to heat the samples rapidly under microwave irradiation conditions and prevent samples from sticking together during the reduction process. Moreover, in order to prevent the oxidation of reducing product magnesium vapor, the samples are coated onto soft graphite paper with thickness of 2–3 mm. Then, the samples are placed into alumina crucible, in which the crucible and the crucible cover are sealed by a high-temperature sealant, and the crucible is placed into the center of Microwave irradiation zone (HAMILab-C1500, SYNO THERM, Changsha, China). The microwave aluminothermic reduction process of MgO is shown in Figure 1B, and the schematic of the experimental equipment is shown in Figure 1C. The high-pressure magnesium vapor streams are formed during the reduction process, which reacted with Al metal to form Mg-Al alloy, and deposited on the graphite paper, and the crucible cover, and the reduction ratio of MgO could be calculated by Equation (1). where M0 and M1 are the content of MgO before and after the reduction.
η = M 0 M 1 M 0

2.3. Sample Analysis

After the reaction, the samples were cooled in the microwave irradiation zone, and weighed accurately. After that, Magnesium, Mg-Al alloys, reacted samples phase, and component analysis were carried out by using XRD with scanning rate of 7°/min, scanning angle from 10–80 °C, and SEM (TESCAN-VEGⅡXMU, Brno, Czech) coupled with EDS (OXFORD-7718, Oxford instruments, Abingdon, UK).

3. Results and Discussion

3.1. Thermodynamic Analysis of the Reduction Reaction

The temperature of the reaction sample is measured at one-minute intervals by the fiber optic probe when the temperature is higher than 973 K, as shown in Figure 2A. In order to reduce magnesium oxide to an atmospheric pressure of 1273 K, it is necessary to analyze and calculate the thermodynamics of the reaction between MgO and Al at normal pressure (105 Pa). Based on previous results [23], the reduzate of the reaction between MgO-CaO the Al are Ca2Al2O5, Ca3Al2O6, and Ca12Al14O33, and the reactions are expressed as the following equations. The calculation results of the Gibbs energy of reaction (2)-(4) varying with reaction temperature are shown in Figure 2B. It is found that MgO is not reduced by Al metal when the temperature is lower than 1500 K, which is consistent with the results reported in the literature [39]. Nevertheless, it is interesting to see that MgO is reduced by Al metal when the temperature is higher than 1500 K at normal pressure. It was reported that high-energy ball milling could increase the mechanical energy storage of reactants and thus decrease reaction temperature [40,41]. Recently, our results also demonstrate that ball milling could lower the reduction temperature of MgO by using Al metal as a reducing agent, with ball mill speed and time of 600 r/min and 5 h, respectively [22,23]. Therefore, in this article, the reactants are treated by a high-energy ball milling process with ball mill speed and time of 600 r/min and 5 h, respectively, in order to ensure that the reduction of magnesium oxide is carried out at 1273 K.
2 CaO + 3 MgO + 2 Al = 3 Mg ( g ) + Ca 2 Al 2 O 5
3 CaO + 3 MgO + 2 Al = 3 Mg ( g ) + Ca 3 Al 2 O 6
12 CaO + 21 MgO + 14 Al = 21 Mg ( g ) + Ca 12 Al 14 O 33

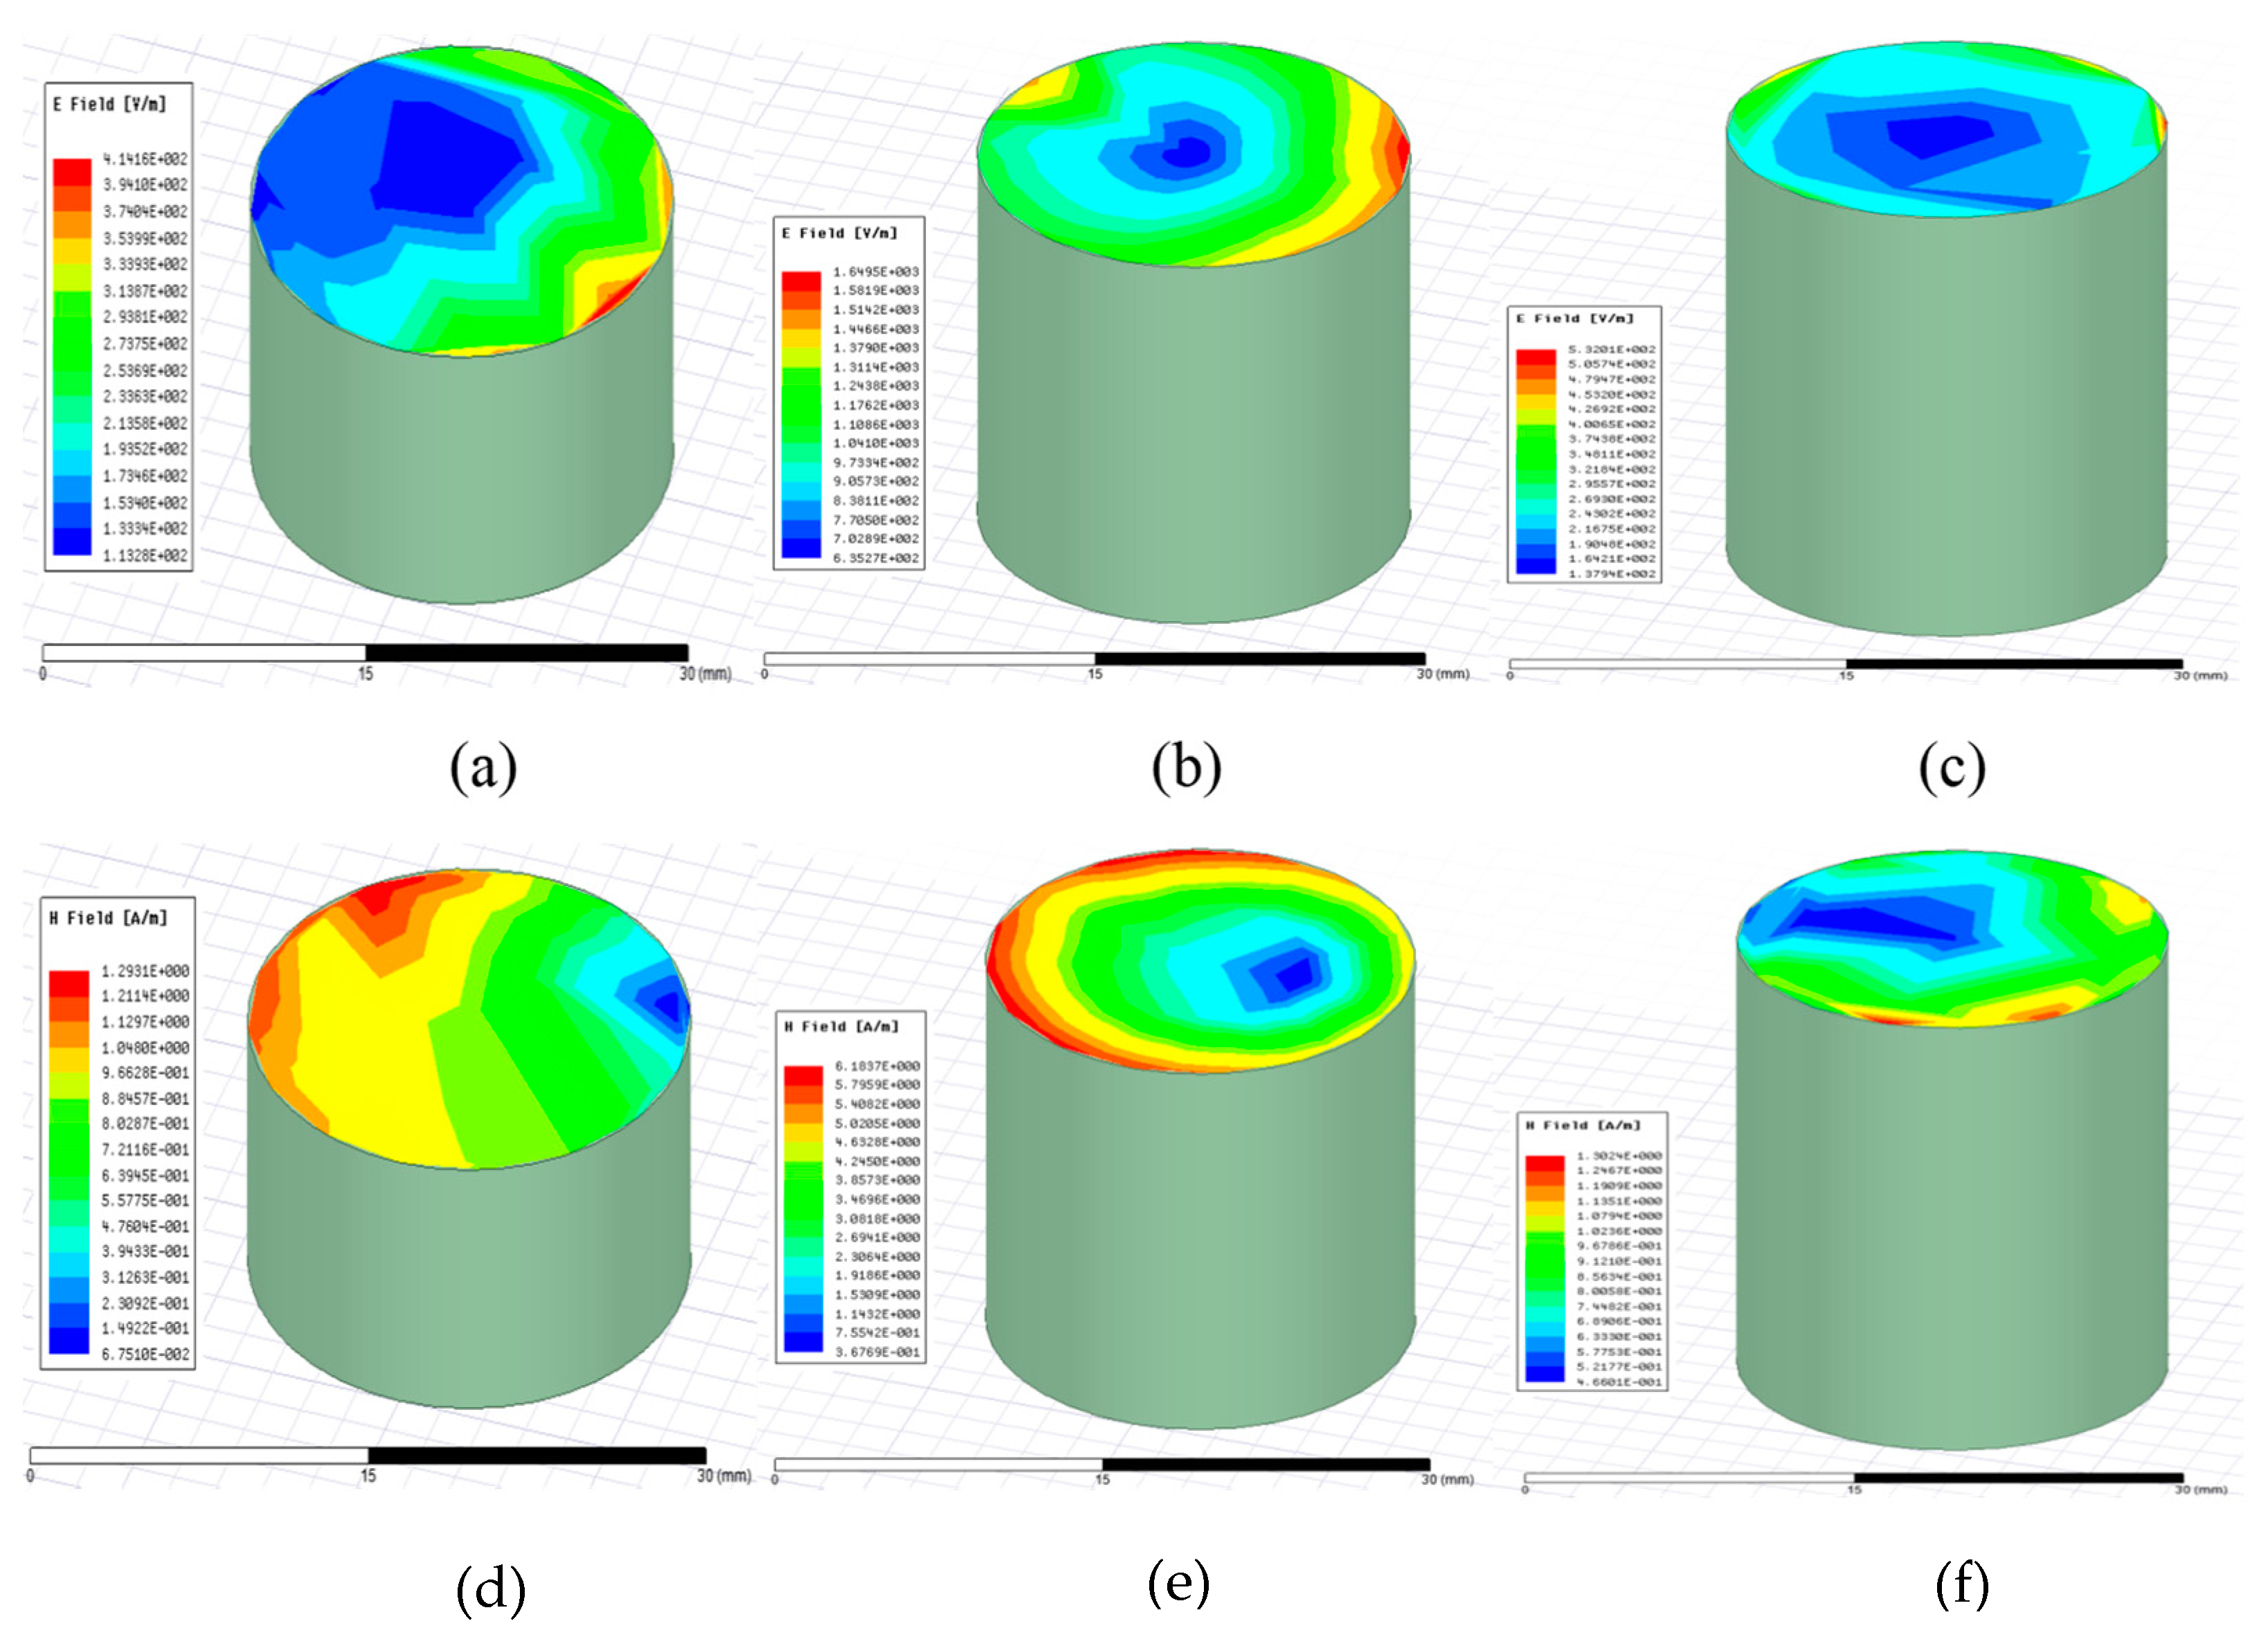
3.2. The Calculation of Microwave Heating Field for Reactor and Sample

In order to obtain the optimum microwave heating conditions for the reaction samples, the microwave heating electric and magnetic fields of the reaction device and sample were simulated and calculated by the software ANSYS electronics desktop 2018. The calculation process mainly includes the following parts, establish the computational geometry model, set material properties and set boundary conditions, and set excitation conditions. Firstly, the model established in this paper is based on the microwave heating equipment applied in the experiment, which is shown in Figure 3a. As shown in Figure 3b, the position of the coordinate origin of the model is set as (0,0,0), and the inner and outer cavity of the model is cubed with dimensions of 200 mm × 200 mm × 200 mm and 500 mm × 500 mm × 500 mm, respectively, the microwave heating frequency is 2.45 GHz. Secondly, when there is no sample in the reactor, the material in the cavity is set as air with the relative permittivity and relative permeability of 1.0, and the relative permittivity, relative permeability, and density of the sample are set as 8.3, 1.0, and 3157 kg/m3 respectively. Then, the inner wall boundary condition of the reaction chamber is set as the finite conductivity boundary, and the excitation condition is set as the wave port. As well known, the distribution of electric and magnetic field intensity varies greatly with the changing positions and height of the reaction sample in the reactor. Therefore, in order to determine the strongest electromagnetic field intensity in the reactor, the distribution of electric field intensity and magnetic field intensity in the reaction chamber was calculated. As shown in Figure 3c, it can be seen that the bottom surface of the reaction chamber is divided into two parts, high electric field intensity zone and low electric field intensity zone. Obviously, the dark blue parts represent the low electric field intensity region with electric field intensity values ranging from 1.6615 × 10⁻³ to 6.0161 × 10² v/m, and the red parts represent the high electric field intensity region with electric field intensity values ranging from 2.4065 × 10³ to 3.0081 × 10³ v/m. It is also interesting to find that we obtained a similar trend of magnetic field intensity varied with position changing on the bottom of the reaction chamber, compared with the relationship between electric field intensity and position changing of the sample, which is shown in Figure 3d. The results presented here demonstrate that when the position of the reaction sample is (200,250,0) on the bottom surface of the reaction chamber, the maximum electromagnetic field intensity value is obtained, which could result in the best microwave heating conditions for the sample. The height of the sample is another important factor that affects the distribution of the electric and magnetic electromagnetic field intensity of the sample. Figure 4. shows the distribution of electric and magnetic field intensity onto the sample surface, as the diameter of the sample is 20 mm, and the height of the sample is 10 mm, 20 mm, and 30 mm, respectively. Moreover, it can be clearly seen that the electric field intensity and magnetic field intensity on the surface of the reaction sample were divided into two parts, a low-intensity region (presented by the dark blue part) and a high-intensity region (except for the dark blue part), as shown in Figure 4. Obviously, the low-intensity region decreased when the height of the sample ranged from 10 to 20 mm, then increased when the height of the sample ranged from 20 to 30 mm, which are shown in Figure 4. Notably, as shown in Table 1, the intensity of electric and magnetic fields on the surface of the sample increase to the maximum value when the height of the sample is 20 mm, which is five times compared to the value of the electric and magnetic intensity of the sample with the sample height of 10 mm. Based on the above analysis, we concluded that the optimal microwave heating conditions are obtained for the reaction samples when the position of the sample is (200,250,0), and the radius and height of the sample are 10 mm and 20 mm, respectively.

3.3. The Reduction of MgO by Al-C Powders under Microwave Irradiation

In order to reveal the cooperative reduction mechanism of MgO, which was reduced by Al-C powders under microwave irradiation, the effect of Al and C powders on the change of reduction ratio of MgO was investigated. As shown in Figure 5A, it is found that the reduction ratio of MgO is increased from 41.05 Wt% to 79.78 Wt% when the content of Al is 20–26 Wt% and decreased slightly when the content of Al is increased up to 33 Wt%. These results may attribute to the increasing reaction areas between MgO and Al powders with the increasing content of the Al, whereas the molten aluminum would prevent magnesium vapor from diffusing out of the surface of the sample when the content of Al is 33 Wt%. The surface morphology of the reacted samples with the content of Al increasing is shown in Figure 6A. It can be seen that no obvious crack appears on the surface of the samples; moreover, some yellowish material appears on the surface of the reacted sample, and the composition of yellowish material will be analyzed and discussed in the following section.
Figure 5B shows the effect of C on the reduction ratio of MgO. It is obvious that the reduction ratio of MgO is increased slightly when the content of C is increasing from 0 to 6 Wt%. As shown in Figure 7A, this result is attributed to the reaction between C and CaO-Al2O3, which results in the formation of the CaAl1.9C4O0.4 phase and promotes the further reduction of magnesium oxide. In addition, different content of CaO could result in different reduction ratios of MgO, and the reduction ratio of MgO is decreased by more than 20 Wt% when the content of CaO is increased from 20 Wt% to 35 Wt%. This phenomenon can be attribute to lower reactivity of MgO when the content of CaO is up to 35 Wt% [23].
Therefore, the addition of C powders has an important effect on the reduction of magnesium oxide from two aspects. On the one hand, the addition of C powders could improve the microwave heating efficiency of the reaction sample due to its strong microwave absorption property, which could improve the microwave heating efficiency of the reaction sample [29,30]. On the other hand, the Al and C powders can cooperatively reduce magnesium oxide, thus improving the reduction efficiency of magnesium oxide, which is shown in Figure 5B.
Figure 6B shows the surface morphology change of the reduced sample with the content of C increasing. It is found that microwave heating has a good enhancement effect on the reduction reaction. The results indicate that different reduction ratios of MgO corresponded with different shape cracks of the sample; this is because the changes in the composition of the reactants (such as MgO, CaO, Al, and C) could result in different microwave energy absorption of samples, which lead to huge internal stresses in the reactants [29]. Thus, many microscopic cracks appear on the surface of the sample, which are helpful for the diffusion of magnesium vapor from the inside of the sample to the outside of the reaction sample. It is obvious that a large crack appears on the surface of the reduction product, and some silver-white magnesium metals are deposited onto the surface of the reduced product as well when the content of C is 6 Wt%.
In order to further clarify the effects of Al and C on the reaction between MgO-CaO and Al-C under microwave irradiation, the reduzates were analyzed by XRD and SEM-EDS. Figure 7A shows the XRD pattern of reduction reduzate; it is found that the Ca12Al14O33, Ca3Al2O6, and CaAl1 .9O4C0.4 phases are formed during the reduction process, which is consistent with the above calculation results shown in Figure 2. These results indicate that C could reduce MgO without CO2 production, and the addition of carbon into the reactant has a good promoting effect on the aluminothermic reduction of MgO as well. It is also interesting to observe that Mg metal and Mg2Al3 alloy are formed. The presence of the Mg2Al3 phase is demonstrated that Mg-Al alloy can be obtained directly by Microwave aluminothermic reduction of MgO. In order to confirm this result, the reduction products deposited on the crucible surface were analyzed by SEM-EDS, which is shown in Figure 7B,C. It is found that some yellowish substance is deposited on the surface of the crucible, as shown in Figure 7B. Figure 7C shows the microstructure of the yellowish product. It is obvious to see that lots of dense hexagonal Nanometer crystallites appear, and the average size of these crystals is about 100 nm. Table 2 shows the EDS analysis result of Figure 7C. It is noted that the chemical components of the reduction products deposited on the crucible surface are Mg and Al. Furthermore, the atomic mole percentage of Mg and Al is 27.3 to 72.7. Based on these results, we further confirmed that the Mg-Al alloy were formed during the reduction process.

3.4. The Reduction of MgO by Al-CaC2 Powders under Microwave Irradiation

CaC2 is a low-cost alternative to Al metal which has the characteristics of high efficiency for the reduction of MgO [39]. Therefore, the reaction between MgO and Al-CaC2 was also investigated in this paper in order to reduce the cost of magnesium production. As shown in Figure 8A, it is found that a small amount of CaC2 could improve the reduction ratio of MgO, whereas when the content of CaC2 increases from 4 to 8 Wt%, the reduction rate of MgO is decreased slightly, which is due to the poor reductive ability of CaC2 compared with Al metal. Figure 8B shows the phase composition of the reduction product. Apparently, it can be seen that many different phases are formed during the reduction process. These results indicate that the reaction between MgO and Al-CaC2 is a multi-phase reduction reaction process. The reaction process could be expressed as Equations (5)–(10): Firstly, MgO is reduced by Al metal, and the MgAl2O4 phase is formed due to the closed reaction reduction apparatus, which is shown in Figure 1C. Then, some MgO is reduced by CaC2, and the CaO and C phases are formed, which could contribute to the formation of CaAl1.9O4C0.4. Finally, magnesium, which has tremendous vapor pressure, interacts with Al powders, resulting in the formation of Mg2Al3 and MgAl alloy.
3 MgO + 2 Al 3 Mg ( g ) + Al 2 O 3
3 Mg ( g ) + 3 Al Mg 2 Al 3 + AlMg
MgO + Al 2 O 3 MgAl 2 O 4
MgO + CaC 2 Mg ( g ) + CaO + 2 C
CaO + Al 2 O 3 + 0.4 C CaAl 1.9 O 4 C 0.4 + 0.1 Al
3 MgO + 5.9 Al + CaC 2 3 Mg ( g ) + CaAl 1.9 O 4 C 0.4 + Mg 2 Al 3 + AlMg + 1.6 C
The Mg-Al alloys formed during the reduction process are analyzed by SEM-EDS. It is interesting to find that some very distinct particles of Mg-Al are observed, as shown in Figure 8C. The EDS analysis results are shown in Figure 8D,E and Table 3. It can be observed that the atomic percentages of Mg and Al are 44.54 Wt% and 55.46 Wt%, which is in correspondence with the results shown in Figure 8B. As shown in Figure 8F,G, it is also found that some microparticles alloy are deposited on the surface of graphite paper, and the composition of the alloy is Mg and Al, with the atomic percentages of Mg and Al being 6.57% and 93.43%, which are shown in Table 3.

3.5. Formation Mechanism of Mg-Al Alloy

In order to reveal the formation mechanism of Mg-Al alloy during the microwave aluminothermic reduction process, the surface and internal morphology of the sample after the reaction are investigated. As shown in Figure 9a, lots of silver-white material are coated on the surface of the reduced product due to the formation of Mg-Al ally during the reduction process. The XRD analysis results of alloy composition are shown in Figure 7A. It is found that the alloy phase is Mg2Al3 and Mg metal. In order to further clarify the effect of microwave heating on the formation mechanism of magnesium–aluminum alloy, the surface and internal morphology and composition of the sample after reaction are analyzed by SEM-EDS. The analysis results are shown in Table 4 and Figure 10A. As shown in Figure 10A, it can be clearly seen that the content of Al and Mg metals are very different before and after the reaction. Moreover, the magnesium content on the surface of the sample is almost identical to the magnesium content inside the sample, and these results show that microwave heating could make the reduction rate of magnesium oxide on the surface and inside the sample almost the same, which plays a strengthening effect on the reduction reaction of MgO. The formation mechanism of Mg-Al alloy is as follows. Firstly, MgO is reduced by microwave aluminothermic reduction method to form magnesium vapor, then some of the Al powders splash out of the surface of reactants and react with the magnesium vapor to form the Mg2Al3 phase, which is shown in Figure 10B. This reaction process could result in the content of Al and Mg metal decreasing after the reduction, and the formation mechanism of Mg-Al alloy is presented in Figure 10B. First of all, the reaction between MgO-CaO and Al takes place in a closed high-pressure environment, which results in a huge partial pressure of magnesium vapor. Secondly, magnesium vapors react with Al metal to form a magnesium–aluminum alloy and are deposited on the surface of the reaction sample and crucible or formed some spherical particles, which are shown in Figure 10B.

4. Conclusions

In summary, a new atmospheric microwave aluminothermic reduction reactor for magnesium oxide has been established. Based on this reaction device, the Mg and Nano-microcrystalline Mg-Al alloy are obtained directly by using the closed microwave aluminothermic method. Firstly, the results of the calculation indicate that the optimal microwave heating conditions are obtained for the reaction samples when the position of the sample is (200,250,0) and the radius and height of the sample are 10 mm and 20 mm, respectively. Secondly, it is also found that microwave heating can greatly promote the reduction of magnesia with the reduction ratio of MgO up to 79.97 Wt% when the reaction time is 30 min. Appropriate addition of C and CaC2 powders into the samples could not only improve the reduction efficiency of MgO but also reduce the production cost of extracting magnesium from MgO by using the microwave aluminothermic reduction method. Moreover, the closed and high-pressure reaction environment is favorable for the reaction between magnesium vapor and aluminum metal to form Mg2Al3 and MgAl alloy. The present paper is helpful in providing new insights into the preparation of Mg and Mg-Al alloy directly from magnesia under atmospheric pressure.

Author Contributions

T.Z.: Conceptualization, writing—original draft, investigation, methodology. M.W.: Validation, formal analysis, resources, writing—review and editing. L.N.: Validation, project administration, formal analysis, writing—review and editing. J.Z.: Data curation, formal analysis, writing—review and editing, Validation. H.Z.: Data curation, formal analysis, writing—review and editing, Validation. M.Z.: Data curation, formal analysis, writing—review and editing, Validation. All authors have read and agreed to the published version of the manuscript.

Funding

This work is supported by the Special research project of Shaanxi Education Department, China (17JK0490), the National Natural Science Foundation of China (51901178) and Key research and development project of Shaanxi Province (2023-YBGY-090).

Data Availability Statement

Data available on request from the authors.

Conflicts of Interest

There are no conflicts to declare.

References

  1. Kurzynowski, T.; Pawlak, A.; Smolina, I. The potential of SLM technology for processing magnesium alloys in aerospace industry. Archiv. Civ. Mech. Eng. 2020, 20, 23. [Google Scholar] [CrossRef]
  2. Kubásek, J.; Minárik, P.; Hosová, K.; Šašek, S.; Knapek, M.; Veselý, J.; Stráská, J.; Dvorský, D.; Čavojský, M.; Vojtěch, D. Novel magnesium alloy containing Y, Gd and Ca with enhanced ignition temperature and mechanical properties for aviation applications. J. Alloys Compd. 2021, 877, 160089. [Google Scholar] [CrossRef]
  3. Weiler, J.P. Exploring the concept of castability in magnesium die-casting alloys. J. Magnes. Alloy. 2021, 9, 102–111. [Google Scholar] [CrossRef]
  4. Korenko, M.; Larson, C.; Blood, K.; Palumbo, R.; Nudehi, S.; Diver, R.; Blood, D.; Šimko, F.; Venstrom, L.J. Technical and economic evaluation of a solar thermal MgO electrolysis process for magnesium production. Energy 2017, 135, 182–194. [Google Scholar] [CrossRef]
  5. Lee, T.H.; Okabe, T.H.; Lee, J.Y.; Kim, Y.M.; Kang, J. Development of a novel electrolytic process for producing high-purity magnesium metal from magnesium oxide using a liquid tin cathode. J. Magnes. Alloy. 2021, 9, 1644–1655. [Google Scholar] [CrossRef]
  6. Li, R.; Liu, F.; Zhong, J.; Yang, P.; Zhang, S. Experimental Study of Magnesium (Mg) Production by an Integrated Calcination and Silicothermic Reduction Short Process. Met. Mater. Trans. B 2021, 52, 558–569. [Google Scholar] [CrossRef]
  7. Fu, D.X.; Zhang, T.A.; Guan, L.K.; Dou, Z.H.; Wen, M. Magnesium production by silicothermic reduction of dolime in pre-prepared dolomite pellets. JOM 2016, 68, 3208–3213. [Google Scholar] [CrossRef]
  8. Gebensleben, T.; Becker, V.; Becker, J.A. Transient light emission from the silicothermic reduction of magnesium oxide with potential for monitoring intermediate compound formation and decay. SN Appl. Sci. 2020, 2, 401. [Google Scholar] [CrossRef]
  9. Li, R.B.; Zhang, S.J.; Guo, L.J.; Wei, J.J. Numerical study of magnesium (Mg) production by the Pidgeon process: Impact of heat transfer on Mg reduction process. Metall. Mater. Trans. B 2014, 45, 236–250. [Google Scholar] [CrossRef]
  10. Gorji, A.; Panjepour, M.; Ahmadian, M. Study of morphology and magnesium purity, formed by vapor phase through silicothermic reduction. Met. Mater Trans. B 2018, 49, 2435–2443. [Google Scholar] [CrossRef]
  11. Xie, W.D.; Chen, J.; Wang, H.; Zhang, X.; Peng, X.D.; Yang, Y. Kinetics of magnesium preparation by vacuum-assisted carbothermic reduction method. Rare Met. 2016, 35, 192–197. [Google Scholar] [CrossRef]
  12. Brooks, G.; Trang, S.; Witt, P.; Khan, M.N.H.; Nagle, M. The carbothermic route to magnesium. JOM 2006, 58, 51–55. [Google Scholar] [CrossRef]
  13. Tian, Y.; Qu, T.; Yang, B.; Dai, Y.N.; Xu, B.Q.; Geng, S. Behavior analysis of CaF 2 in magnesia carbothermic reduction process in vacuum. Met. Mater. Trans. B 2012, 43, 657–661. [Google Scholar] [CrossRef]
  14. Jiang, Y.; Liu, Y.Q.; Ma, H.W.; Zhou, W.G. Mechanism of calcium fluoride acceleration for vacuum carbothermic reduction of magnesia. Met. Mater. Trans. B 2016, 47, 837–845. [Google Scholar] [CrossRef]
  15. Tian, Y.; Xu, B.Q.; Yang, C.B.; Yang, B.; Qu, T.; Liu, H.X.; Dai, Y.N.; Liu, D.C. Analysis of magnesia carbothermic reduction process in vacuum. Mater Trans. B 2014, 45, 1936–1941. [Google Scholar] [CrossRef]
  16. Xiong, N.; Tian, Y.; Chen, X.; Li, K.; Xu, B.; Yang, B.; Dai, Y. Dynamic simulation and experimental study of magnesia formed between magnesium vapor and CO under vacuum. JOM 2019, 71, 2791–2797. [Google Scholar] [CrossRef]
  17. Yang, C.B.; Tian, Y.; Qu, T.; Yang, B.; Xu, B.Q.; Dai, Y.N. Production of metallic nanopowders (Mg, Al) by solar carbothermal reduction of their oxides at low pressure. J. Magnes. Alloy. 2014, 2, 50–58. [Google Scholar] [CrossRef]
  18. Hischier, I.; Chubukov, B.A.; Wallace, M.A.; Fisher, R.P.; Palumbo, A.W.; Rowe, S.C.; Groehn, A.J.; Weimer, A.W. A novel experimental method to study metal vapor condensation/oxidation: Mg in CO and CO2 at reduced pressures. Sol. Energy 2016, 139, 389–397. [Google Scholar] [CrossRef]
  19. Fu, D.X.; Feng, N.X.; Wang, Y.W.; Peng, J.P.; Di, Y.Z. Kinetics of extracting magnesium from mixture of calcined magnesite and calcined dolomite by vacuum aluminothermic reduction. Nonferrous Met. Soc. China 2014, 24, 839–847. [Google Scholar] [CrossRef]
  20. Fu, D.X.; Wang, Y.W.; Peng, J.P.; Di, Y.Z.; Tao, S.H.; Feng, N.X. Mechanism of extracting magenesium from mixture of calcined magnesite and calcined dolomite by vacuum aluminothermic reduction. Nonferrous Met. Soc. China 2014, 24, 2677–2686. [Google Scholar] [CrossRef]
  21. Wang, Y.; You, J.; Peng, J.; Di, Y. Production of magnesium by vacuum aluminothermic reduction with magnesium aluminate spinel as a by-product. JOM 2016, 68, 1728–1736. [Google Scholar] [CrossRef]
  22. Zhang, T.; Du, S.M.; Sun, W.C.; Zhang, J.M.; Niu, L.B.; Zheng, B.; Hua, X.H. Novel Method to Prepare Magnesium by Aluminothermic Reduction of Magnesia and Calcium Hydroxide at Normal Atmosphere, 1223 K (950 °C). Met. Mater. Trans. B 2017, 48, 488–496. [Google Scholar] [CrossRef]
  23. Zhang, T. Investigation on the reaction between MgO–CaO–CaF2 and Al–C powders to extract magnesium under atmospheric pressure. J. Magnes. Alloy. 2019, 7, 328–334. [Google Scholar] [CrossRef]
  24. Wulandari, W.; Brooks, G.A.; Rhamdhani, M.A.; Monaghan, B.J. Kinetic analysis of silicothermic process under flowing argon atmosphere. Can. Metall. Q. 2014, 53, 17–25. [Google Scholar] [CrossRef]
  25. Che, Y.; Hao, Z.; Zhu, J.; Fu, Z.; He, J.; Song, J. Kinetic mechanism of magnesium production by silicothermy in argon flowing. Thermochim. Acta 2019, 681, 178397. [Google Scholar] [CrossRef]
  26. Che, Y.; Zhang, C.; Song, J.; Shang, X.; Chen, X.; He, J. The silicothermic reduction of magnesium in flowing argon and numerical simulation of novel technology. J. Magnes. Alloy. 2020, 8, 752–760. [Google Scholar] [CrossRef]
  27. Jordon, J.B.; Miller, V.; Joshi, V.V.; Neelameggham, N.R. (Eds.) Magnesium Technology; Springer: Cham, Switzerland, 2020; pp. 303–308. [Google Scholar]
  28. Guo, J.; Fu, D.; Han, J.; Ji, Z.; Wang, Y.; Zhang, T. The effect of calcium fluoride on extracting magnesium from magnesite and calcium carbonate by silicothermal reduction in flowing argon. J. Min. Metall. B Metall. 2020, 56, 379–386. [Google Scholar] [CrossRef]
  29. Rao, K.J.; Vaidhyanathan, B.; Ganguli, M.; Ramakrishnan, P.A. Synthesis of inorganic solids using microwaves. Chem. Mater. 1999, 11, 882–895. [Google Scholar] [CrossRef]
  30. Nandihalli, N.; Gregory, D.H.; Mori, T. Energy-Saving Pathways for Thermoelectric Nanomaterial Synthesis: Hydrothermal/Solvothermal, Microwave-Assisted, Solution-Based, and Powder Processing. Adv. Sci. 2022, 9, 2106052. [Google Scholar] [CrossRef]
  31. Peng, Z.; Hwang, J.Y. Microwave-assisted metallurgy. Int. Mater. Rev. 2015, 60, 30–63. [Google Scholar] [CrossRef]
  32. Wen, T.; Zhao, Y.; Xiao, Q.; Ma, Q.; Kang, S.; Li, H.; Song, S. Effect of microwave-assisted heating on chalcopyrite leaching of kinetics, interface temperature and surface energy. Results Phys. 2017, 7, 2594–2600. [Google Scholar] [CrossRef]
  33. Forster, J.; Pickles, C.A.; Elliott, R. Microwave carbothermic reduction roasting of a low grade nickeliferous silicate laterite ore. Miner. Eng. 2016, 88, 18–27. [Google Scholar] [CrossRef]
  34. Zhang, G.; Zhang, T.A.; Lü, G.; Zhang, Y.; Liu, Y.; Zhang, W. Effects of microwave roasting on the kinetics of extracting vanadium from vanadium slag. JOM 2016, 68, 577–584. [Google Scholar] [CrossRef]
  35. Huang, Y.; Zhang, T.A.; Dou, Z.; Liu, J.; Tian, J. Influence of microwave heating on the extractions of fluorine and Rare Earth elements from mixed rare earth concentrate. Hydrometallurgy 2016, 162, 104–110. [Google Scholar] [CrossRef]
  36. Yoshikawa, T.; Morita, K. Removal of B from Si by solidification refining with Si-Al melts. Mater. Trans. 2005, 44, 722–726. [Google Scholar] [CrossRef]
  37. Wada, Y.; Fujii, S.; Suzuki, E.; Maitani, M.M.; Tsubaki, S.; Chonan, S.; Fukui, M.; Inazu, N. Smelting magnesium metal using a microwave Pidgeon method. Sci. Rep. 2017, 7, 46512–46518. [Google Scholar] [CrossRef] [PubMed]
  38. Fujii, S.; Suzuki, E.; Inazu, N.; Tsubaki, S.; Maeda, M.; Wada, Y. Study on Metal Smelting Process Under Microwave Irradiation. In Magnesium Technology; Springer: Berlin/Heidelberg, Germany, 2018; pp. 171–172. [Google Scholar]
  39. Bugdayci, M.; Turan, A.; Alkan, M.; Yucel, O. Effect of reductant type on the metallothermic magnesium production process. High Temp. Mater. Process. 2018, 37, 1–8. [Google Scholar] [CrossRef]
  40. Zhang, D.L. Processing of advanced materials using high-energy mechanical milling. Progress Mater. Sci. 2004, 49, 537–560. [Google Scholar] [CrossRef]
  41. Nepapushev, A.A.; Kirakosyan, K.G.; Moskovskikh, D.O.; Kharatyan, S.L.; Rogachev, A.S.; Mukasyan, A.S. Influence of high-energy ball milling on reaction kinetics in the Ni-Al system: An electrothermorgaphic study. Int. J. Self-Propagating High-Temp. Synth. 2015, 24, 21–28. [Google Scholar] [CrossRef]
Figure 1. (A) is the closed microwave aluminothermic method schematic diagram, (B) is the schematic of reduction process of MgO under microwave irradiation, (C) is the schematic of the experimental equipment. ① refractory fiber, ② High temperature sealant, ③ graphite flake, ④ sample, ⑤ Ceramic lid, ⑥ graphite paper, ⑦ alumina crucible, ⑧ Activated carbon powders, ⑨ ceramic cup.
Metals 13 00905 g001aMetals 13 00905 g001b
Figure 2. (A) The red curve shows the temperature of the reaction sample varies with the microwave heating time, when the Microwave heating power is 1.5 KW, (B) are the change of gibbs energy of reaction (2)–(4) with the reaction temperature before ball milled, where the horizontal red dotted line shows the value of gibbs free energy is 0 and the vertical red dotted line shows that the reaction temperature is 1500 K.
Metals 13 00905 g002
Figure 3. (a,b) are the schematic diagram of microwave reaction device, and model establishment for calculation of reactor and sample respectively, (c,d) are the calculation results of electric and magnetic field of reaction device respectively.
Metals 13 00905 g003
Figure 4. The calculation results of electric field (ac) and magnetic field (df) for the sample with radius of 10 mm, and height of 10 mm, 20 mm, 30 mm respectively.
Metals 13 00905 g004
Figure 5. (A) is the change of the reduction ratio of MgO with the content of Al increasing, as the content of CaO and C of 20 Wt%,4 Wt% respectively under microwave irradiation, (B) is the change of the reduction ratio of MgO with the content of C increasing for the reaction between MgO-CaO and Al-C under microwave irradiation.
Metals 13 00905 g005
Figure 6. (A) is the surface morphology of samples after reaction with different Al contents, (B) is the effect of C on surface morphology of the reduced products (CaO-20 Wt%).
Metals 13 00905 g006
Figure 7. (A) is the XRD pattern of reduction reduzates for the reaction between MgO-CaO and Al-C, (B) is the surface morphology of crucible surface, (C) is the SEM Analysis of crucible surface. (C-4 Wt%), where the red box is the EDS analysis of Mg-Al alloy deposited on the surface of the crucible.
Metals 13 00905 g007
Figure 8. (A) is the effect of CaC2 on the reduction ratio of MgO with the content of Al 25 Wt%, (B) is the XRD pattern of reduction reduzate with the different content of CaC2, (C) is the magnesium–aluminum alloy product with the content of CaC2 2 Wt%; (D) is the SEM analysis of Mg-Al alloy corresponds to the red box of (C), (E) the red box is the EDS analysis of Mg-Al alloy, (F) the red box is the Mg-Al deposited on graphite paper, and (G) the red box is the SEM-EDS analysis of Mg-Al alloy which is corresponding to the red box of (F).
Metals 13 00905 g008
Figure 9. The surface and internal morphology of sample after reaction (the content of C is 6 Wt%) (a) The surface morphology of Sample; (b)The cracking cross section of sample; (c) SEM analysis of sample surface; (d) SEM analysis of sample subsurface; (e) SEM analysis of sample central position.
Metals 13 00905 g009
Figure 10. (A) is the ratio of atomic number in different positions of MgO-CaO (20 Wt%)-Al-C (6 Wt%) system before and after reaction, (B) is schematic diagram of formation mechanism of magnesium–aluminum alloy obtained using atmospheric microwave aluminothermic reduction method, where the red box shows Mg-Al alloy deposited on the surface of the sample, the red oval show the block magnesium aluminum alloy and Mg-Al alloy deposited on the surface of the crucible respectively.
Metals 13 00905 g010
Table 1. The variation of electric and magnetic field intensity onto sample surface with sample height increasing.
Height of Sample (mm)The Electric Field
Intensity Value (V/m)
The Magnetic Field
Intensity Value (A/m)
MinimumMaximumMinimumMaximum
10113.28414.160.067511.2931
20635.271649.50.367696.1837
30137.94532.010.466011.3024
Table 2. The EDS analysis result of the red box of Figure 7C.
Alloying Elements Content (Wt%)Content (At%)
Mg25.327.30
Al74.772.70
Table 3. The EDS analysis of Mg-Al alloy corresponding to red box of Figure 8E,G respectively.
Alloying Elements Content (Wt%)Content (At%)
Figure 8EMg41.8944.54
Al58.0855.46
Figure 8GMg5.966.57
Al94.0493.43
Table 4. The percentage of atoms in different positions corresponding to Figure 9b.
ElementSample before ReactionSurface Atomic
Percent Ratio (At%)
Subsurface Atomic Percent Ratio (At%)Center
C K17.7044.1345.7848.56
O K26.3032.0529.4627.62
MgK25.3603.6003.8902.84
AlK28.1912.2612.9111.94
CaK8.4607.9607.9509.05
Disclaimer/Publisher’s Note: The statements, opinions and data contained in all publications are solely those of the individual author(s) and contributor(s) and not of MDPI and/or the editor(s). MDPI and/or the editor(s) disclaim responsibility for any injury to people or property resulting from any ideas, methods, instructions or products referred to in the content.

