Article

Increasing Hardness and Wear Resistance of Austenitic Stainless Steel Surface by Anodic Plasma Electrolytic Treatment

1
Department of Mathematical and Natural Sciences, Kostroma State University, 156005 Kostroma, Russia
2
Department of Physics and Technology of Nanostructures, Saint Petersburg Academic University, 194021 Saint Petersburg, Russia
*
Author to whom correspondence should be addressed.
Metals 2023, 13(5), 872; https://doi.org/10.3390/met13050872
Submission received: 21 March 2023 / Revised: 27 April 2023 / Accepted: 28 April 2023 / Published: 30 April 2023
(This article belongs to the Topic Microstructure and Properties in Metals and Alloys)

Abstract

:
The results of modifying the surface of austenitic stainless steel by anodic plasma electrolytic treatment are presented. Surface treatment was carried out in aqueous electrolytes based on ammonium chloride (10%) with the addition of ammonia (5%) as a source of nitrogen (for nitriding), boric acid (3%) as a source of boron (for boriding) or glycerin (10%) as a carbon source (for carburizing). Morphology, surface roughness, phase composition and microhardness of the diffusion layers in addition to the tribological properties were studied. The influence of physicochemical processes during the anodic treatment of the features of the formation of the modified surface and its operational properties are shown. The study revealed the smoothing of irregularities and the reduction in surface roughness during anodic plasma electrolytic treatment due to electrochemical dissolution. An increase in the hardness of the nitrided layers to 1450 HV with a thickness of up to 20–25 μm was found due to the formation of iron nitrides and iron-chromium carbides with a 3.7-fold decrease in roughness accompanied by an increase in wear resistance by 2 orders. The carburizing of the steel surface leads to a smaller increase in hardness (up to 700 HV) but a greater thickness of the hardened layer (up to 80 μm) due to the formation of chromium carbides and a solid solution of carbon. The roughness and wear resistance of the carburized surface change are approximately the same values as after nitriding. As a result of the boriding of the austenitic stainless steel, there is no hardening of the surface, but, at the same time, there is a decrease in roughness and an increase in wear resistance on the surface. It has been established that frictional bonds in the friction process are destroyed after all types of processing as a result of the plastic displacement of the counter body material. The type of wear can be characterized as fatigue wear with boundary friction and plastic contact. The correlation of the friction coefficient with the Kragelsky–Kombalov criterion, a generalized dimensionless criterion of surface roughness, is shown.

1. Introduction

Stainless steels are used as structural and functional materials in products operating under aggressive conditions in the food, chemical, and thermal power engineering industries, among others. Products made of this material are characterized by high ductility, toughness, heat resistance and corrosion resistance but low strength and hardness. To harden stainless steels, surface plastic deformation technologies aimed at creating grain boundaries and substructural hardening are effectively used, for example, in ultrasonic strain engineering technology [1] and ultrasonic shot peening [2,3]. The disadvantage of deformation surface treatments is the significant increase in roughness and the need for subsequent finishing [1,2,3]. Laser shock peening increases the thickness of the hardened layer to 2 mm and have been proven to solve this problem [4,5,6].
Alternatives to the mechanical treatment of the metal surface include physical and chemical methods of surface hardening, such as plasma electrolytic treatment, which has a complex effect on the operational properties of metal products [7,8,9]. The majority of studies cover the cathodic variant of plasma electrolytic diffusion saturation variety. Thus, during the cathodic plasma electrolytic nitriding (PEN) of 316L steel in a solution of ammonium nitrate and potassium hydroxide, the formation of FeN0.076 and Fe3O4 in the surface layer was revealed [10]. After PEN, the 10–15 μm thick oxide layer containing 39–41% oxygen is formed on the surface of the steel in a carbamide electrolyte. The maximum nitrogen content in steel of 0.68% is no longer detected at a depth of 30 μm. The cathodic nitriding of austenitic stainless steel in solutions of ammonium carbonate leads to the formation of nitrides (Fe2N, Fe4N, CrN and Cr2N) and oxides (Fe3O4 and Cr2O3) of iron and chromium, and the microstructure of the nitrided layer contains a nitride zone and an internal nitriding zone [11]. As the temperature increases, more high-nitrogen nitride, Fe2N, is formed. The nitriding of stainless steel has shown a positive result for increasing wear and corrosion resistance. After the PEN of 316L steel in solutions of carbamide or ammonium nitrate with the addition of potassium hydroxide, the dry friction coefficient with a corundum ball decreases from 0.19 in the untreated sample to 0.13 with an increase in wear resistance of 4.4–10 times [10]. The PEN of 304, 316L and 430 stainless steels in sodium nitrite solution proved to be an effective method of inhibiting pitting corrosion in 0.5M sodium chloride solution [12].
After the cathodic plasma electrolytic carburizing (PEC) of 12Cr18Ni10Ti steel, FeO iron oxides were detected in the glycerin electrolyte [13]. An increase in the applied voltage increased the degree of grain grinding to an extent to which nanoscale crystals formed alongside the increase in surface roughness [14]. After the carburizing of 12Cr18Ni10Ti steel, the compression of ferrite and austenite crystal lattices was observed, which occurs due to the displacement of the lines (110) α-Fe and (111) γ-Fe. Additional phases of Fe3O4, (Cr,Fe)7C3, Fe15Cr4Ni2, CrN and CrFe were detected in the PEC of 304 austenitic steel in a chloride-glycerin electrolyte [15] and 403 stainless martensitic steel, including Fe3O4, CrFe, FeO and CrC [16]. Cathodic carburizing during pulse treatment (250~600 V; 1500 Hz) in an electrolyte of glycerin and sodium chloride on 1Cr18Ni9Ti steel forms a hardened layer with a thickness of 0.2 mm and a microhardness up to 513 HV for 3–5 min [17]. After the cathodic carburizing of 304 steel in an electrolyte of glycerin (80%) and potassium chloride at a voltage of 350 V for 3 min, the thickness of the layer hardened to 762 HV reaches 0.085 mm [18].
In the cathodic plasma electrolytic nitrocarburizing (PENC) of 316L stainless steel in a carbamide electrolyte, the main phase appears as austenite nitrogen [19]. Additionally, oxides and oxygen-containing phases, including NiFe2O4, FeCr2O4 [20], Fe2O3, Fe3O4, Cr2O4 [21] and Fe(Fe,Cr)2O4 [22,23], nitrides, including Fe3N [21], CrN and Cr2N [23], carbides, including Cr3C2 and Cr7C3 [23], and silicon dioxide [21] are detected. The cathodic PENC of 304 steel in carbamide electrolytes increased microhardness up to 1380 HV with an increase in surface roughness from 0.025 to 0.14 μm and a 4.2-fold increase in wear resistance [19]. In one study, 316L steel after cathodic PENC in carbamide electrolytes with various additives had an increase in microhardness up to 1200 HV and 50 times the wear resistance [22] and, in another, an increase up to 1600 HV and 4.5 times the wear resistance [23].
The disadvantage of cathode plasma electrolytic treatment is the low controllability of the technological process and consequent properties. In addition, the increase in surface roughness that accompanies the cathodic treatment option requires additional finishing. The anodic version of plasma electrolytic saturation as a way to increase the operational properties of stainless steel products has not been practically considered in the literature. This option of plasma electrolytic treatment, however, in addition to hardening and increasing wear and corrosion resistance allows us to reduce surface roughness and exclude subsequent finishing treatment [24,25,26,27]. In this paper, the possibility of increasing hardness and wear resistance of the stainless steel surface with various types of anodic plasma electrolytic diffusion saturation (nitriding, boriding and carburizing) is considered.

2. Materials and Methods

2.1. Samples Processing

Cylindrical samples (∅ 11 mm × 15 mm) of austenitic stainless steel (wt.%: 18 Cr; 10 Ni; 2 Mn; 0.8 Ti; 0.8 Si; 0.5 Mo; 0.3 Cu; 0.2 V; 0.2 W; 0.12 C; 0.03 P; 0.02 S and balanced Fe) were ground with SiC abrasive paper to a grit size of P100 to Ra~0.75 μm and ultrasonically cleaned with acetone.
These samples were subjected to anodic plasma electrolytic diffusion saturation with nitrogen (nitriding), boron (boriding) or carbon (carburizing). Plasma electrolytic treatment was carried out in a cylindrical electrolyzer with an axially symmetric electrolyte flow supplied through a nozzle located at the bottom of the electrolyzer (Figure 1) [28].
In the upper part of the electrolyzer, electrolyte was overflowing into the sump and was further pumped through a heat exchanger at a rate of 2.5 L/min, which was measured with a 0.4–4 LPM flowmeter (accuracy of ±2.5%) (Pribormarket, Arzamas, Russia). This scheme provides stabilization of the processing conditions. Solution temperature was measured using a a K-type thermocouple (Termoelement, Moscow, Russia) placed at the bottom of the chamber and maintained at 30 ± 2 °C. The samples were connected as the positive output, and the electrolyzer (Figure 1) was connected as the negative output of the 15 kW DC power supply.
The treatment was carried out in aqueous solutions of electrolyte based on ammonium chloride (10 wt.%) with the addition of ammonia (5 wt.%) for PEN, boric acid (3 wt.%) for plasma electrolytic boriding (PEB) or glycerin (10 wt.%) for PEC.
After switching the voltage to 200 V, the samples were immersed in the electrolyte at a speed of 1–2 mm/s. If the rate of immersion was slow, a vapor-gaseous envelope was easily formed on an initially small surface area of the sample near the electrolyte surface and extended further across the sample as it submerged. Once the sample was immersed at a depth equal to its height, the voltage was changed to the value in Table 1, Table 2 and Table 3 in order to reach the prescribed treatment temperature. The sample temperature was measured with a K-type thermocouple (Termoelement, Moscow, Russia) and a multimeter APPA109N (accuracy up to 3% over a temperature range of 400–1000 °C) (APPA TECHNOLOGY CORPORATION, Taipei, Taiwan (China)). The thermocouple was fixed in a hole made in the samples at a distance of 2 mm from the sample’s bottom. The treatment continued for 5 min, and, after diffusion saturation, the samples were quenched in electrolyte (hardening).

2.2. Study of the Surface Morphology and Microstructure

The Micromed MET (Micromed, St. Petersburg, Russia) optical metallographic microscope with digital image visualization served to study the surface morphology and microstructure of the cross-section of the austenitic stainless steel samples.

2.3. The Microhardness Measurement

The microhardness of the cross-sections of the treatment sample was measured using a Vickers microhardness tester (Falcon 503, Innovatest Europe BV, Maastricht, The Netherlands) under a 0.1 N load. According to 5 measurements, the average value of microhardness was found.

2.4. Surface Roughness and Weight of Samples Measurement

The surface roughness was measured with a TR-200 profilometer (Beijing TIME High Technology Ltd., Beijing, China). According to 10 measurements, the average value of roughness indicators was found. The change in the weight of the samples was determined on a CitizonCY224C electronic analytical balance (ACZET (Citizen Scale), Mumbai, India) with an accuracy of ±0.0001 g after removing traces of salts by washing the samples in distilled water and subsequently drying.

2.5. Study of Phase Composition

X-ray diffraction (XRD) analysis was used to determine the phase composition of the samples. The XRD patterns were obtained by PANalytical Empyrean X-ray diffractometer (Malvern Panalytical, Malvern, UK) with CoKα radiation by a simple scanning mechanism in the theta-2theta-mode with a step of 0.026° and a scanning rate of 4.5°/min. Phase composition analysis was performed using the PANalytical High Score Plus software [29] and the ICCD PDF-2 and COD databases [30].

2.6. Study of Tribological Properties

The friction scheme “shaft-block” was used in friction tests (Figure 2) [31,32].
The counter body was made of tool alloy steel (wt.%: 0.9–1.2 Cr, 1.2–1.6 W, 0.8–1.1 Mn and 0.9–1.05 C) in the form of a plate with a semicircular notch 10 mm in diameter enclosing the surface of the sample. The sample was mounted on a shaft driven by an electric motor. The counter body was mounted on a platform sliding along cylindrical guides. The platform was moved using a pneumatic cylinder. The cylinder, guides and the platform were able to rotate with the pendulum. The pendulum shaft was located coaxially with the sample. Such a scheme makes it possible to preserve the common rotation axis for the sample and the counter body as they exhaust and to avoid the influence of misalignment on the results of measurements of the frictional moment. Friction tests were carried out in dry friction mode under a load of 10 N. The sliding speed of the sample along the counter body was 1.555 m/s. The friction path was 1000 m. The parameters of the microgeometry of the friction tracks’ surface were measured using the TR200 profilometer (Beijing TIME High Technology Ltd., Beijing, China). The temperature of the friction contact was measured on the friction track directly at the exit from the contact area using the MLX90614 digital infrared thermometer (Melexis Electronic Technology, Shanghai, China).

2.7. Wear Mechanism Calculation

Wear resistance is an important operational property of machines and mechanisms. Largely, wear resistance is caused by the contact interaction in tribo-conjugations, which is based on the properties of the surface layers. The processes implemented in tribo-conjugation depend on roughness. The rough surface model makes it possible to determine the type of tribo-tension stress state (elastic contact or plastic contact) and the wear mechanism and to evaluate the relationship of plasma electrolytic treatment conditions and the microgeometry parameters of the surface layer.
The model is based on experimental profilograms of friction tracks. The calculation is performed in relation to the contact of a rough surface with a smooth solid surface since the roughness of the sample surface significantly exceeds the roughness of the counterbody. This calculation is faster and easier to perform than the contact of two rough surfaces [32,33].
To describe the microgeometry of the surface of friction tracks, it is necessary to know the function of vertical material distribution throughout the rough layer and the function of the vertical material distribution throughout the single micro-roughness of the rough surface. The distribution of the material over the height of the rough layer is described by the curve of the support surface (Abbott curve). Curves are taken directly from the profiler by at least 15 pieces per 1 friction track on each ring.
To approximate the experimental reference curve, the Demkin function is selected [34].
η ( ε ) = l m ( z R p ) ν = b ( z R max ) ν = b ε max ν = A r A c = P c P r = n r n c ,
where z is the profile cross-section level measured from the protrusions line; Ar is the actual contact area; Ac is the contour contact area; Pr is the average actual pressure on the friction contact; Pc is the contour pressure; nr is the number of contacting protrusions; nc is the number of all protrusions on the contour area.
It is more convenient to calculate the heights of the experimental profile in relative terms:
ε = z R p ,   ε max = z R max ,
where Rp is the smoothing height (the distance from the protrusions line to the midline in terms of the base length); Rmax is the maximum height of irregularities; z is the profile cross-section level measured from the protrusions line; ε and εmax are relative dimensionless profile heights relative to the midline.
The parameters of the reference curve v and b are determined experimentally from the results of measurements of the parameters of the rough body profile:
ν = 2 l m ( R p R a ) 1 ,
b = l m ( R max R p ) ν ,
where Ra is the arithmetic mean deviation of the profile. Additionally, lm is the relative reference length of the profile on the midline:
l m = 1 n Δ l i l ,
where l is the base length; Δli is the length of the segments cut off by the middle line in the profile. The lm parameter is determined by direct measurements of the profilometer on the friction tracks.
To calculate the actual pressure Pr at the tops of the micro-steps, it is necessary to determine the type of deformations on the friction contact: elastic or plastic. The evaluation is made using the Greenwood–Williamson criterion:
K p = Θ H B R p r ,
Θ is the reduced modulus of elasticity:
Θ = ( 1 μ 1 2 E 1 + 1 μ 2 2 E 2 ) 1 ,
where µi and Ei are Poisson’s coefficients and the elastic modulus of interacting bodies, respectively.
The dimensionless parameter Kp takes into account the roughness and physical properties of the material at the same time. It describes the deformation properties of a rough surface. If the value of this parameter is lower than 3, then the deformations of the irregularities in contact with a flat surface will be completely elastic; if Kp exceeds 3, then the deformations will be predominantly plastic.
The average radius of a single micrometer, which characterizes the shape of the protrusion, is calculated directly from the profilometer data:
r = S m 2 8 R a γ 1 γ 2 2 ,
where Sm is the average step of the irregularities; γ1 is the vertical increase in the profiler; γ2 is the horizontal increase in the profiler.
With elastic contact, the deformation of individual protrusions can be calculated according to the classical Hertz contact problem. Then, the average actual pressure at the contact is determined by the following expression:
P r = ( 0.43 Θ ) 2 ν 2 ν + 1 ( 2 N η A c ) 1 2 ν + 1 ( R p r ) 2 ν 2 ν + 1 ,
where N is the normal load. With plastic contact, the average voltage at the contact is numerically equal to the microhardness Pr ≈ HB.
The actual contact area is determined by the ratio of the normal load to the actual pressure:
A r = N P r .
Substituting the reference curve (1) z = h into the equation leads to the following expression of the absolute convergence of the surfaces:
h = R max ( P c b P r ) 1 ν .
Then, the ratio of the number of contacting protrusions nr to the number of all protrusions on the contour area nc can be determined using the Demkin function (1):
n r n c = ( N P r l m ) ν 1 ν ,
where lm is the relative reference length of the profile at the midline level.
The relative embedding of the sample and the counterbody is the ratio of the absolute embedding to the average radius of the micronerosity:
h r = R max r ( N b P r ) 1 ν = 8 R a R max S m 2 ( N b P r ) 1 ν γ 2 2 γ 1 .
Relative convergence (13) characterizes the type of violation of frictional bonds in tribocontact. For steel surfaces, in the case when h/r < 0.01, destruction occurs because of friction fatigue, and friction bonds are broken due to elastic displacement of the sample material. At a value of h/r < 0.1, low-cycle friction fatigue develops, and the friction surfaces are destroyed due to plastic displacement of the sample material with residual deformation of the friction track after the passage of micro-steps along it.
To assess the bearing capacity of roughness, the dimensionless Kragelsky–Kombalov criterion is calculated [35]:
Δ = ( 100 l m ) 1 ν ( R p r ) .
The complex (14) represents the most complete roughness assessment, including not only geometric but also statistical characteristics of the height distribution of the protrusions as well as the average radius of the rounding of the micro-protrusions. On a friction-worn surface, Δ shows how much its bearing capacity has been preserved. The lower the calculated value of Δ on the friction track, the higher the bearing capacity of the rough profile and the more favorable conditions for friction with the minimum possible wear.
The mathematical expression for the approximation of the Abbott curve (1) allows us to give a theoretical estimate of the wear value of the sample. If only the volume of embedded irregularities dV with density ρ is involved in the deformation, then
d m = ρ d V = ρ A r d z ,
where the contour area is defined by expression (10), and dz is the depth of the embedding of irregularities, which can vary from zero to the full value of the relative embedding of h, as defined by expression (11). Thus, weight wear is determined by volume V and is directly proportional to the area of the actual contact:
Δ m = ρ V = ρ 0 z A r d z = ρ 0 ε b ε ν d ε = ρ A r h ν + 1 .

3. Results

3.1. Morphology and Roughness of the Surface

After processing, under all varying conditions, there is a decrease in the weight of samples and a decrease in the surface roughness (Table 1, Table 2 and Table 3). At the same time, each type of diffusion saturation has its own characteristics. Thus, when nitriding with an increase in temperature from 650 to 850 °C, despite the practically constant value of the current strength, the surface roughness decreases with an increase in the intensity of anodic dissolution (the loss of sample weight) (Table 1). The surface morphology becomes more homogeneous with an increasing temperature when the textures of the untreated surface are completely removed (Figure 3).
The boriding of the steel surface was carried out at higher temperatures and, despite higher values of current and released power compared to those during nitriding, there is a smaller decrease in the weight of samples and roughness (Table 2). With an increase in temperature from 800 to 950 °C, the roughness increases but does not exceed the initial value. Pores are visible on the borided surface under all processing conditions, which determine its heterogeneity and the higher roughness compared to during nitriding (Figure 4).
For the carburizing process, with an increase in temperature from 750 to 900 °C, there is a linear decrease in the current and weight of the samples (Table 3). At the same time, the surface roughness changes non-linearly: with an increase in the PEC temperature from 750 to 800 °C, it decreases by a factor of 4.4 compared to the initial value, and with a subsequent increase in temperature to 900 °C, a slight increase is observed (Table 3). The surface morphology after PEC is more uniform compared to after PEB, but after treatment at 900 °C, the treated material (steel) become visible (Figure 5).

3.2. Phase Composition, Structure and Microhardness of the Surface Layer

According to the metallographic analysis, because of the plasma electrolytic treatment, the diffusion saturation of the surface occurs with the formation of modified layers detected under the surface oxide layer (Figure 6, Figure 7 and Figure 8).
Depending on the type of processing, the modified layers will have a different phase composition and structure. According to X-ray analysis, after PEN, the oxide layer consists of α-Fe2O3 and γ-Fe2O3, and the modified layer includes phases FeN0.0939 and CrFe7C0.45, which form due to diffusion processes, and intermetallides of the initial components of the alloy (Figure 9).
After PEB, a porous FeO oxide is detected in the oxide layer, except for γ-Fe2O3, and no inclusion compounds were detected in the modified layer, except for intermetallides (Figure 10).
As a result of the PEC, a more complex structure comprising three subsequent layers is formed: a surface oxide layer consisting of Fe2O3 and Fe3O4 phases; an outer modified layer, including intermetallides and chromium carbide; and a diffusion layer (a solid solution of diffusion atoms in the initial matrix) (Figure 11).
Measurements of the microhardness of the surface layers showed that after PEN the surface is hardened to the depth of its modification, reaching 1400–1450 HV after nitriding at 650–700 °C (Figure 12). With an increase in the PEN temperature, the hardness of the nitrided layer decreases, which is associated with the coagulation of nitride particles and the breakdown of coherence. PEN at the maximum temperature of 850 °C nearly doubles the hardness on the surface compared to that in the core.
After PEB, surface hardening does not occur (Figure 13).
After PEC, the microhardness increases with the rise in saturation temperature, similarly to during the carburizing of carbon steels [36,37], reaching 700 HV, and the thickness of the hardened layer correlates with the thickness of the modified and diffused layers (Figure 14).

3.3. Tribological Properties of Treated Surface

The results of tribological tests and calculations of the microgeometry parameters of the friction track surface are presented in Table 4, Table 5 and Table 6. According to the data presented in Table 4, the PEN of the steel surface under all varying treatment modes leads to a reduction in weight wear by two orders. At the same time, there is an increase of 10–18 degrees in the temperature in the friction contact area, and the friction coefficient reached 1.5–1.9 of the previous value with a tendency to decrease the latter with an increase in the PEN temperature. The dynamics of the change in the friction coefficient as the contact surfaces slide show their rapid stabilization (Figure 15).
It is shown that as a result of PEN, the value of Kragelsky-Kambalov criterion becomes 2.5 times lower regardless of processing temperature. Calculations of microgeometry of worn surface parameters before and after PEN allowed us to determine the deformation properties of the rough surface (according to the Greenwood-Williamson criterion), which are predominantly plastic. According to the calculated h/r indicator, it can be stated that the destruction of friction bonds occurs due to the development of low-cycle friction fatigue and friction surfaces are destroyed due to plastic displacement of the sample material with residual deformation of the friction track.
Test results of PEB samples presented in Table 5 showed, that only after processing under 850 and 900 °C weight wear value was 7 and 12.9 times, respectively, as low as before. Under these conditions, friction coefficient decreased insignificantly compared to the untreated surface (Figure 16). The greatest increase in temperature in the friction contact area occurs with the greatest reduction in weight wear. The values of Kragelsky–Kombalov criterion of PEB samples after friction do not notably exceed similar parameters of the nitrided surfaces. The calculation showed the presence of plastic deformation properties of a rough surface according to Greenwood-Williamson criterion, and the destruction of friction bonds occurs in the same way as for nitrided surfaces.
Evidently, as a result of PEC, there is a significant decrease in weight wear corresponding to the values obtained after nitriding, while the friction coefficient can both increase (after PEC at 800 and 900 °C) and decrease (after PEC at 750 and 850 °C) compared to the untreated surface with a rapid stabilization of its values (Table 6, Figure 17). A decrease in temperature in the friction contact area at low nitriding temperatures and an increase after treatment at 850 and 900 °C were revealed. The values of the Kragelsky–Kombalov criterion of the PEC samples after friction correlate with those for the nitrided surfaces in addition to those for the deformation properties of the surface and the mechanical destruction of friction bonds, according to the calculated parameters of worn surface microgeometry.

4. Discussion

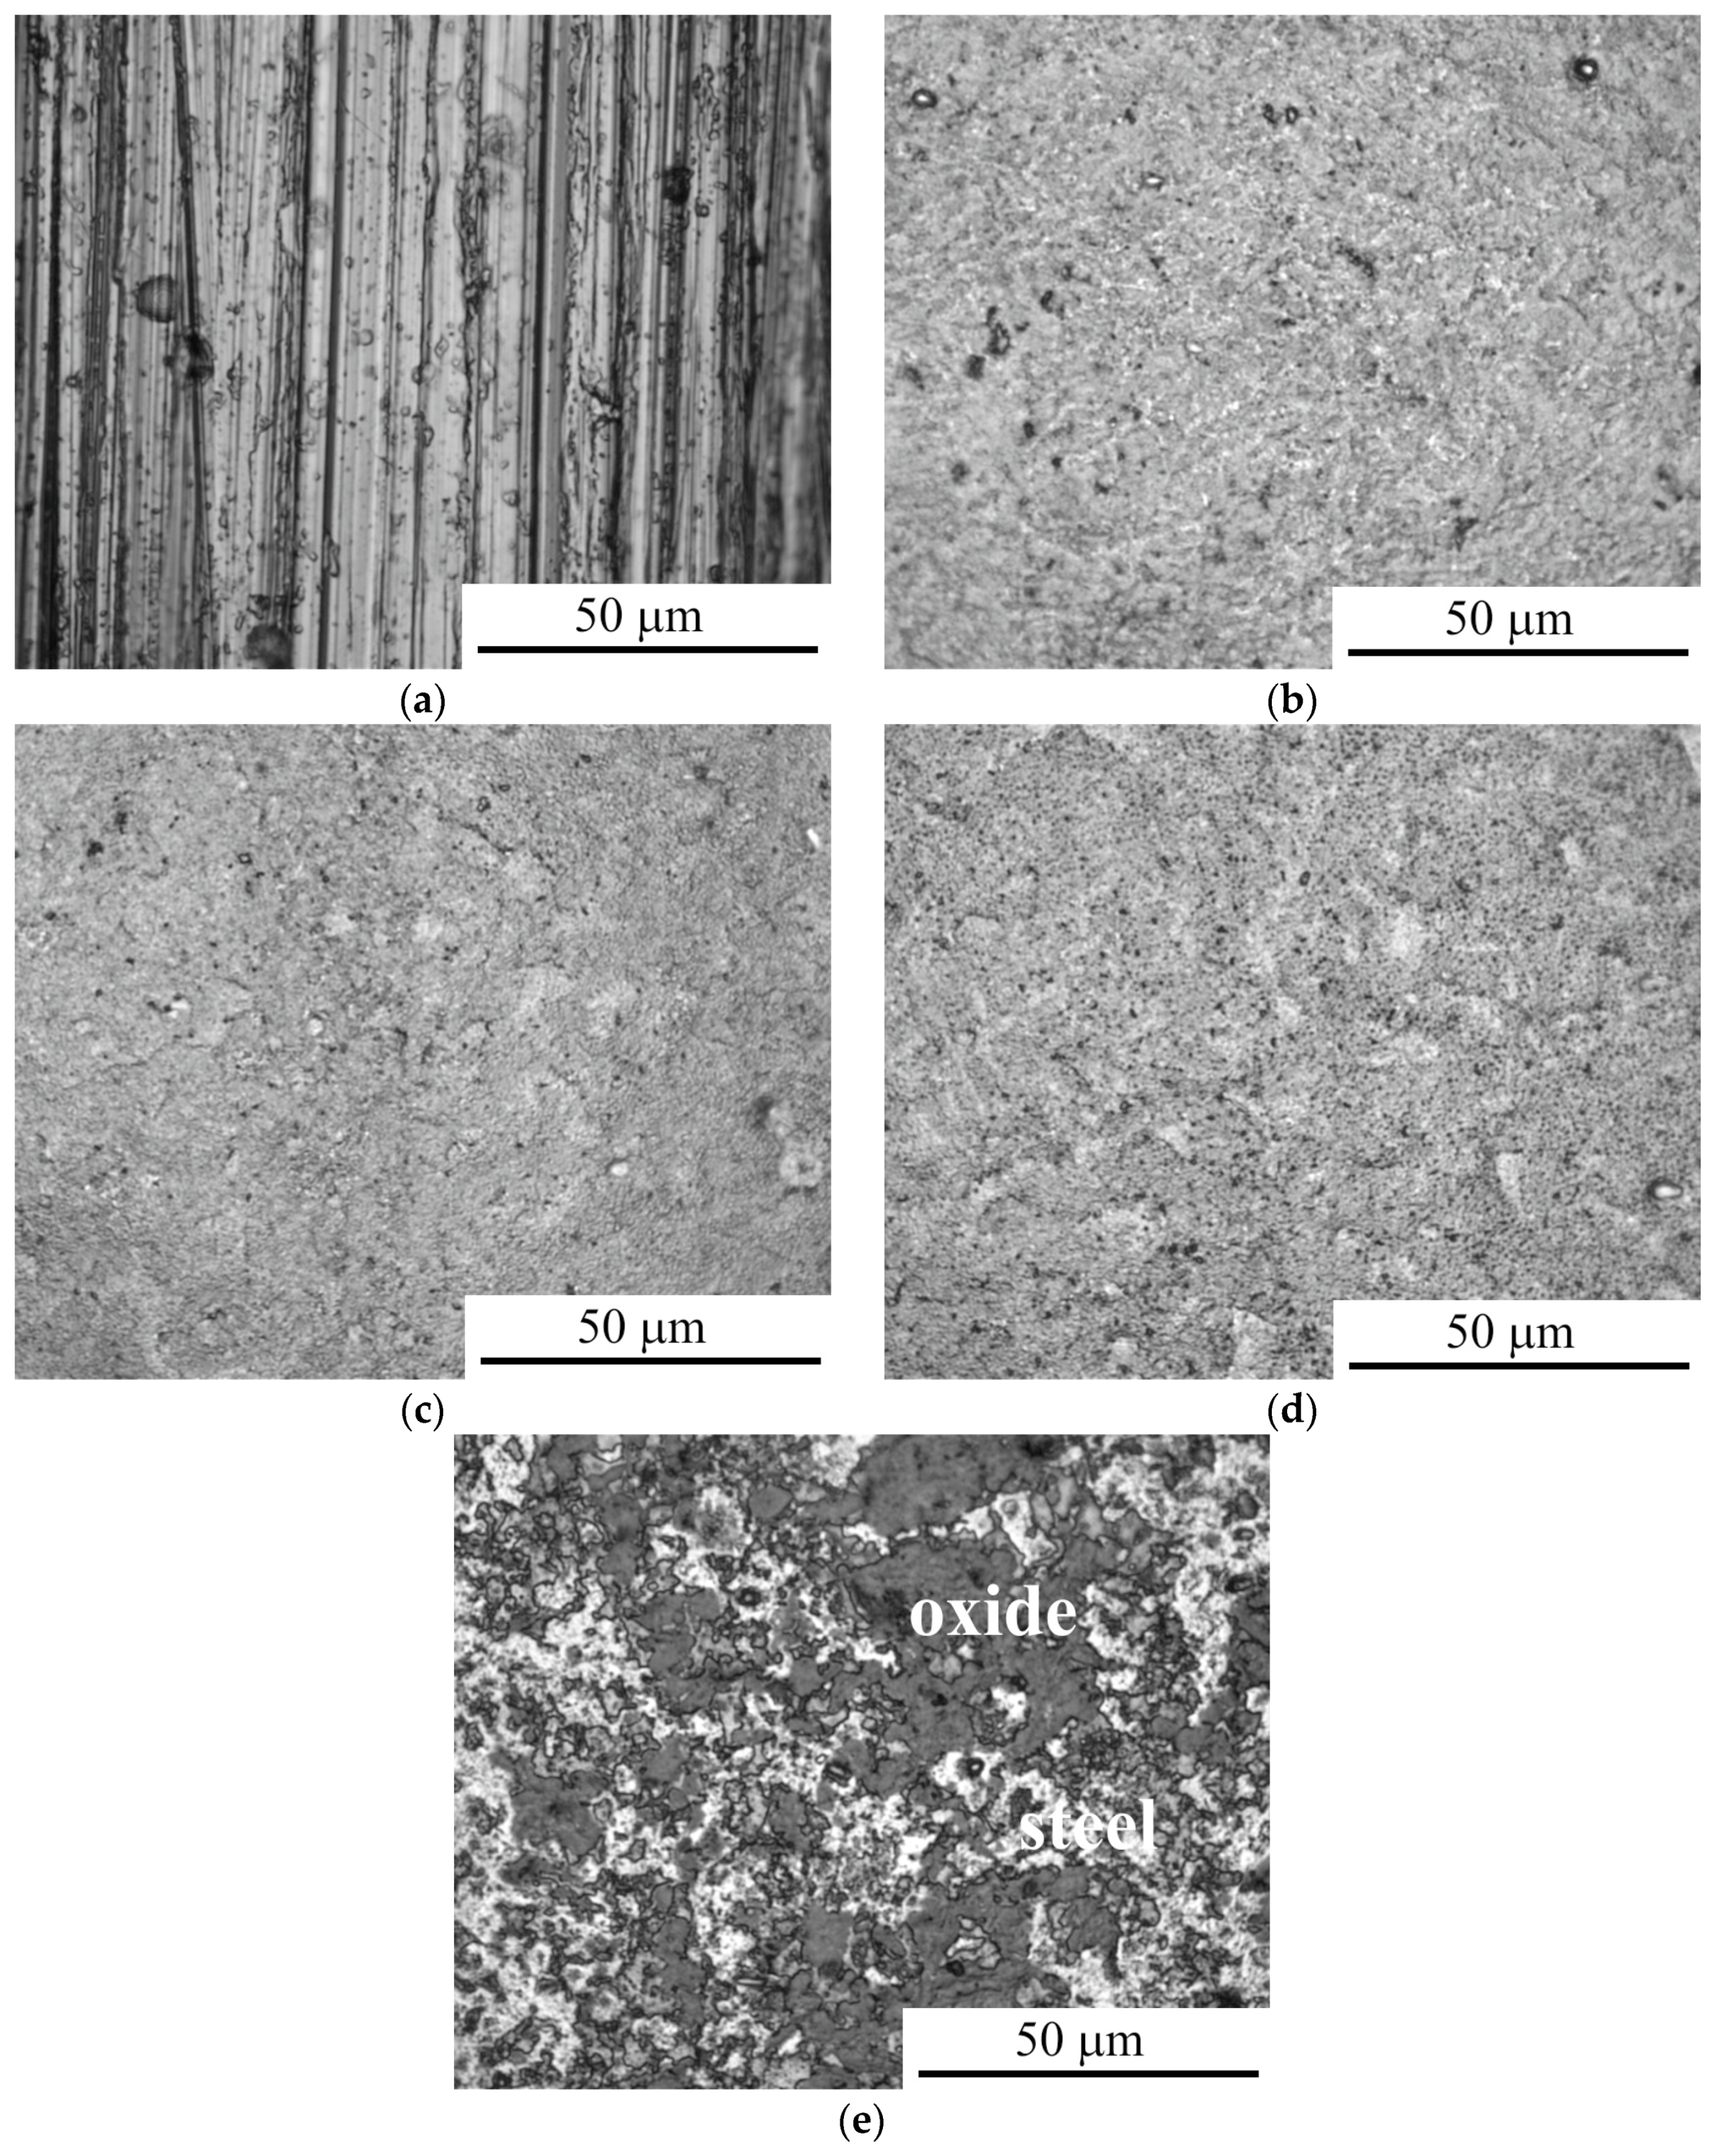
Surface morphology during anodic plasma electrolytic treatment in aqueous electrolytes is determined by the competition of the processes of high-temperature oxidation, which leads to the formation of an oxide layer with a growth of roughness on the surface, and the anodic dissolution of the treated material, which leads to the alignment of the surface profile and a decrease in roughness [38,39,40]. In the considered cases of the anodic diffusion saturation of austenitic stainless steel samples, in general, the prevalence of anodic dissolution is observed, alongside a decrease in surface roughness. This determines the fundamental difference between the result of the anodic and cathodic treatment shown in the Introduction. At the same time, at high saturation temperatures, the intensive oxidation of the surface is observed, partially compensating for the decrease in the weight of the samples and the roughness during anodic dissolution. Under these conditions, the surface morphology will be determined by the structural features of the oxide layers—pores (after PEB) and areas with traces of the detachment of the fragile oxidized material (after PEC at high temperatures) are visually observed. Similar morphological features were observed after the PEN [27,41], PEB [42,43] and PEC [36,37] of carbon steels, which determine the general mechanism of the processes of the high-temperature oxidation and the anodic dissolution of the surfaces of carbon and high-alloy steels.
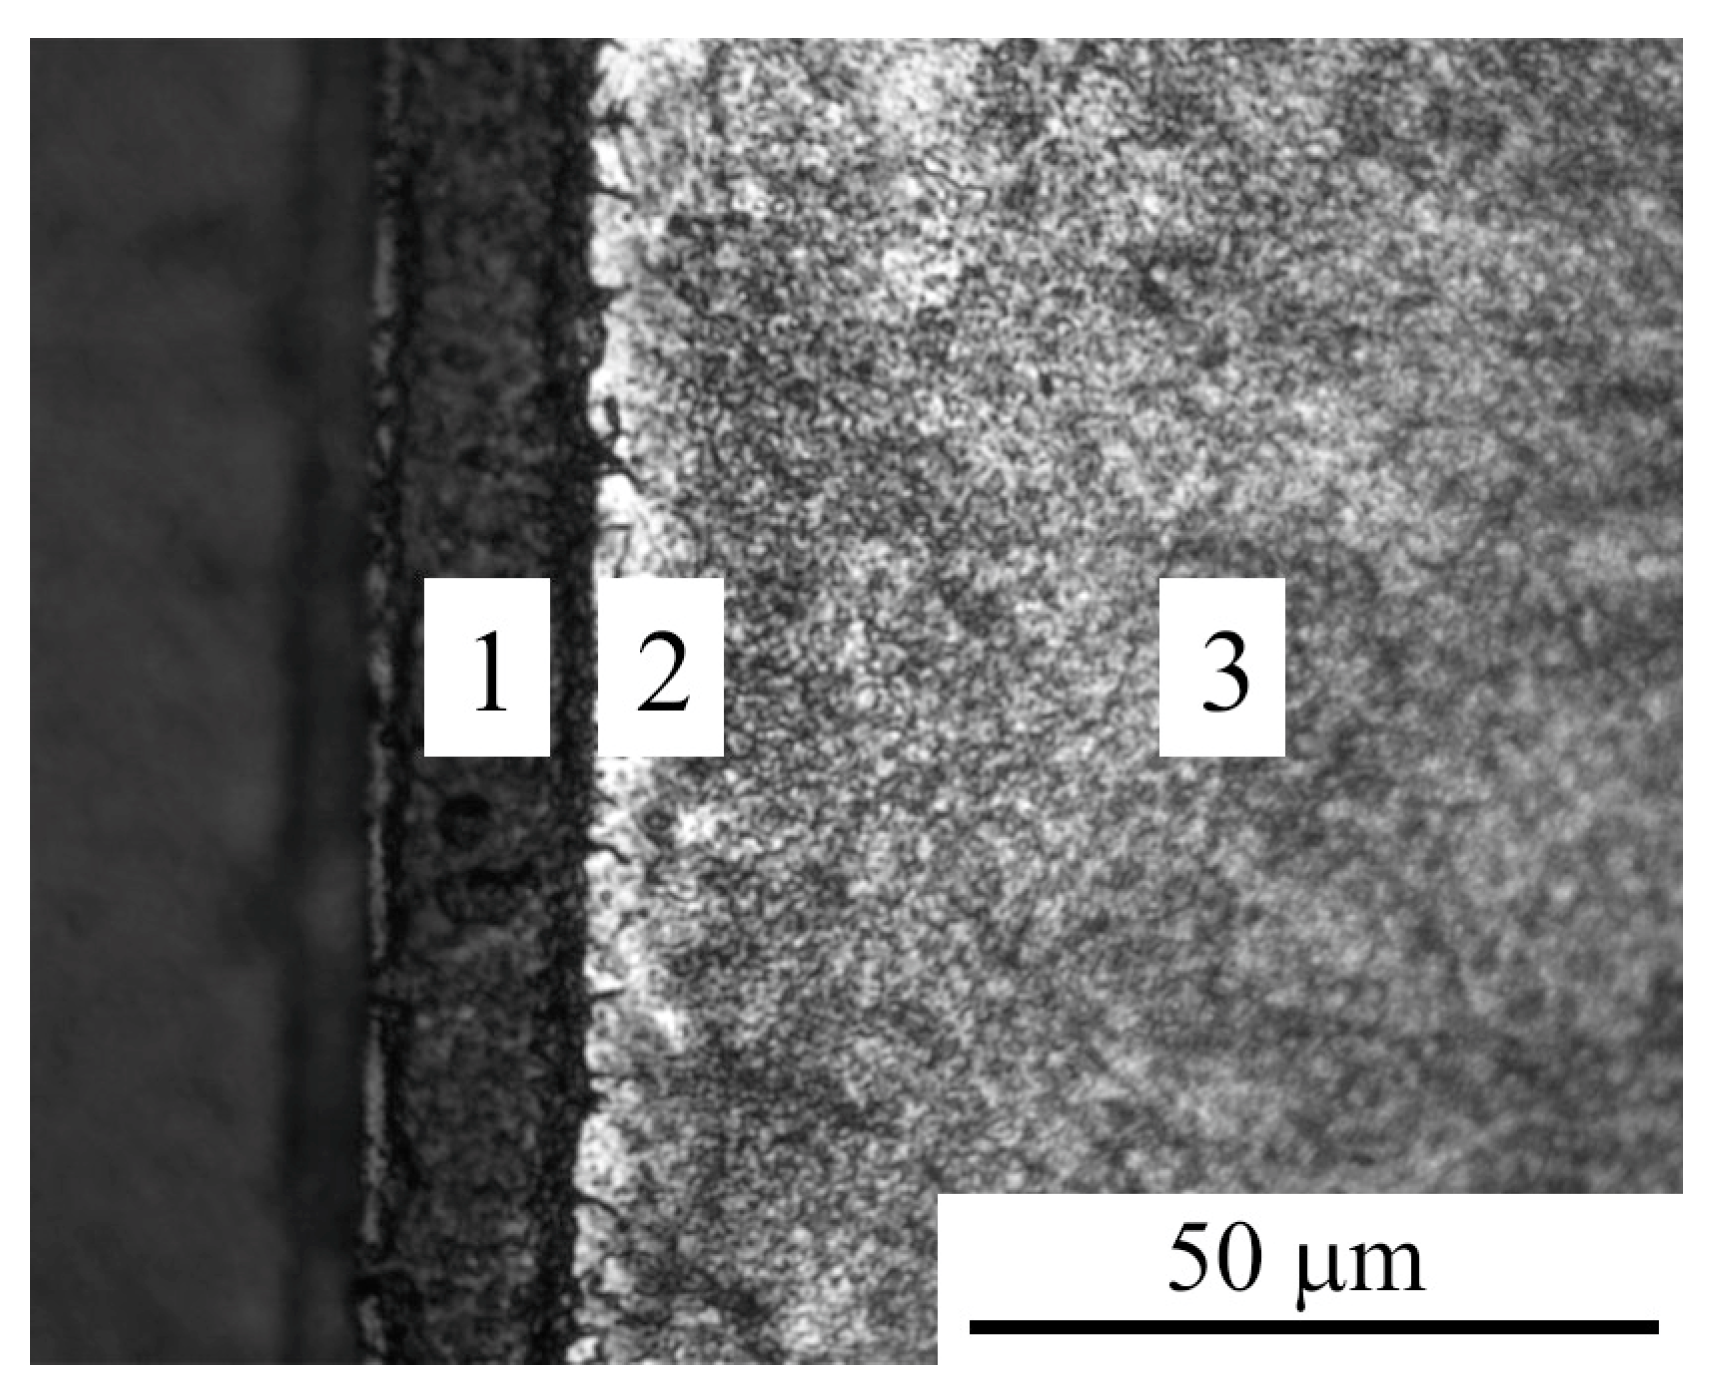
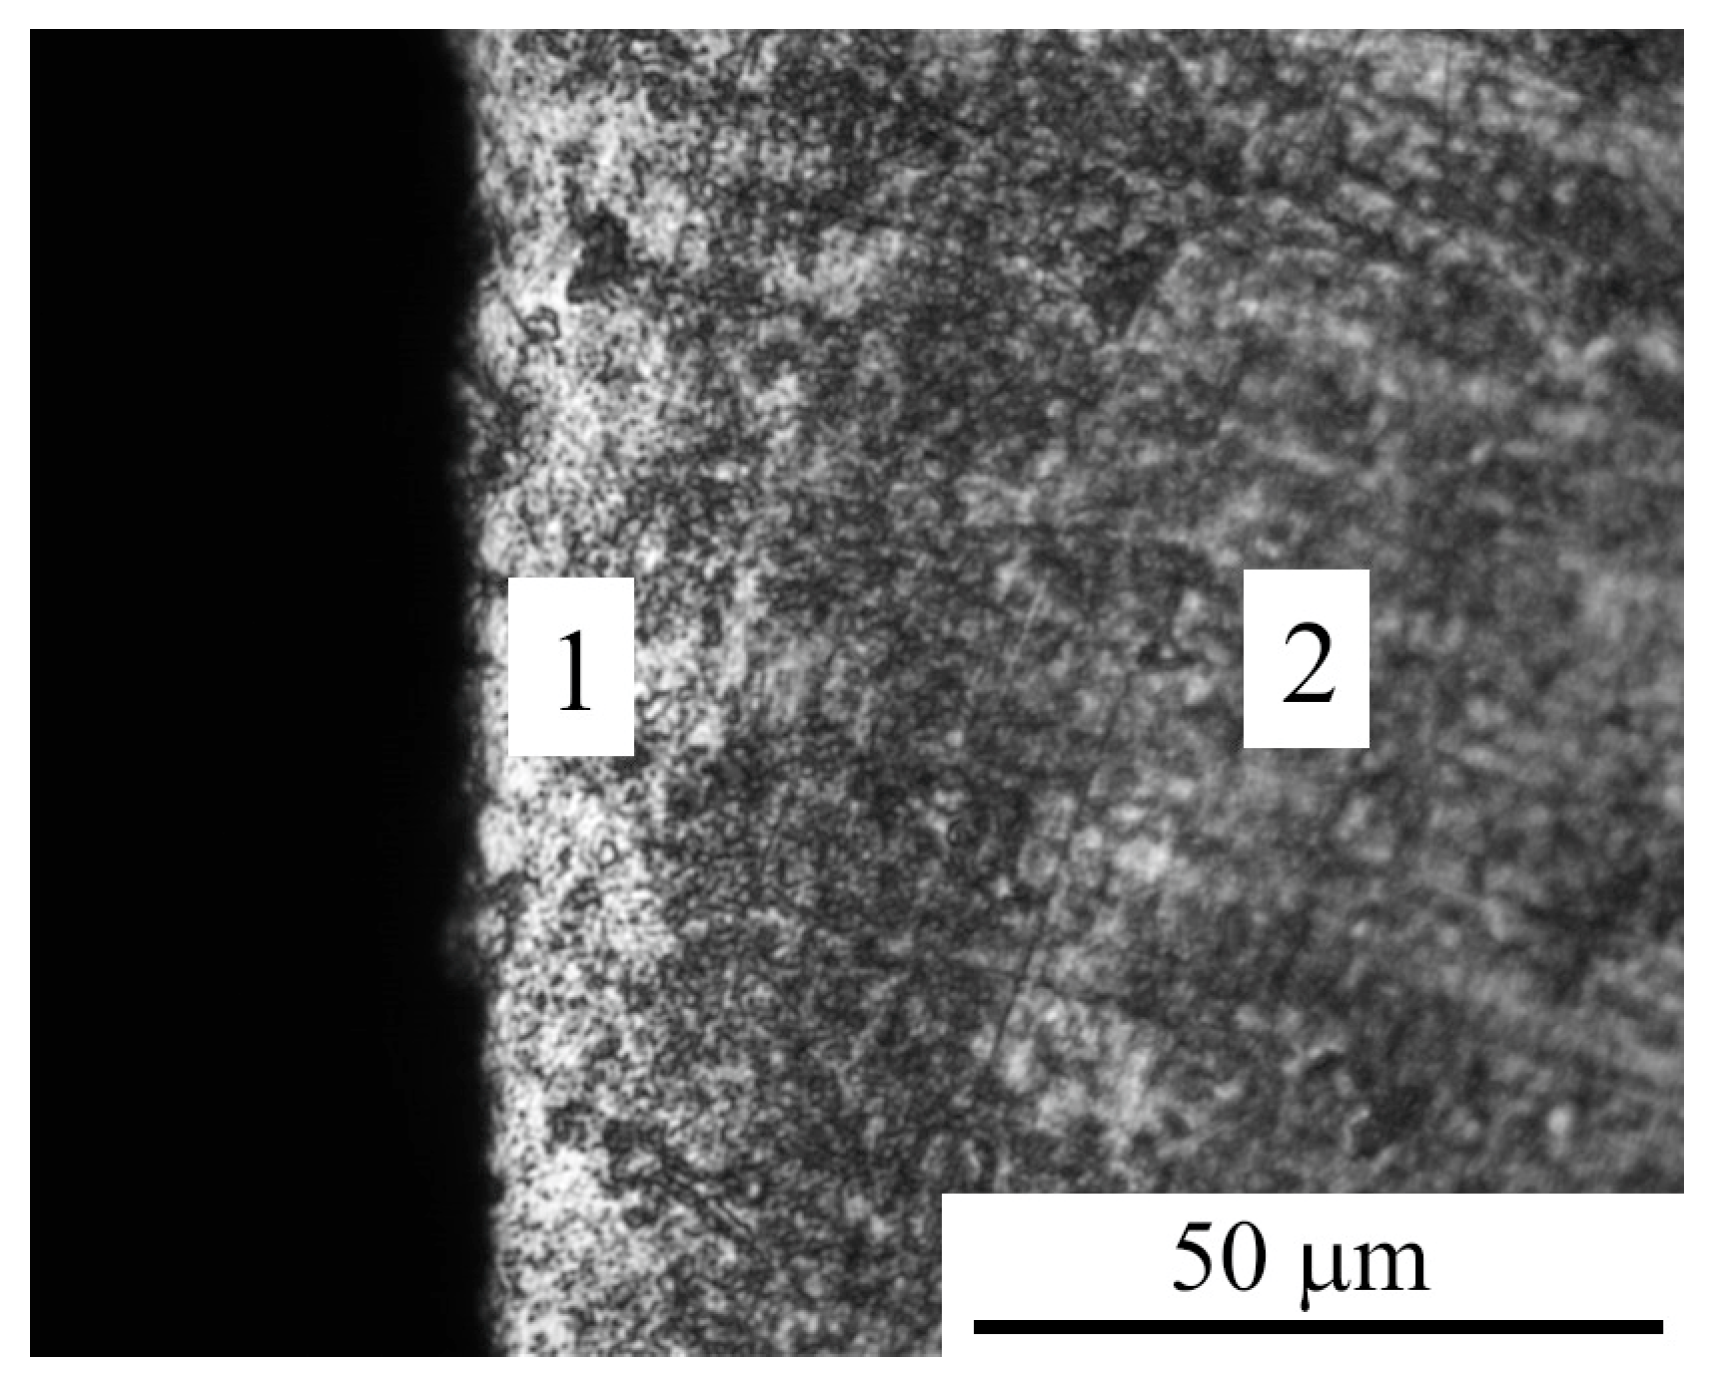
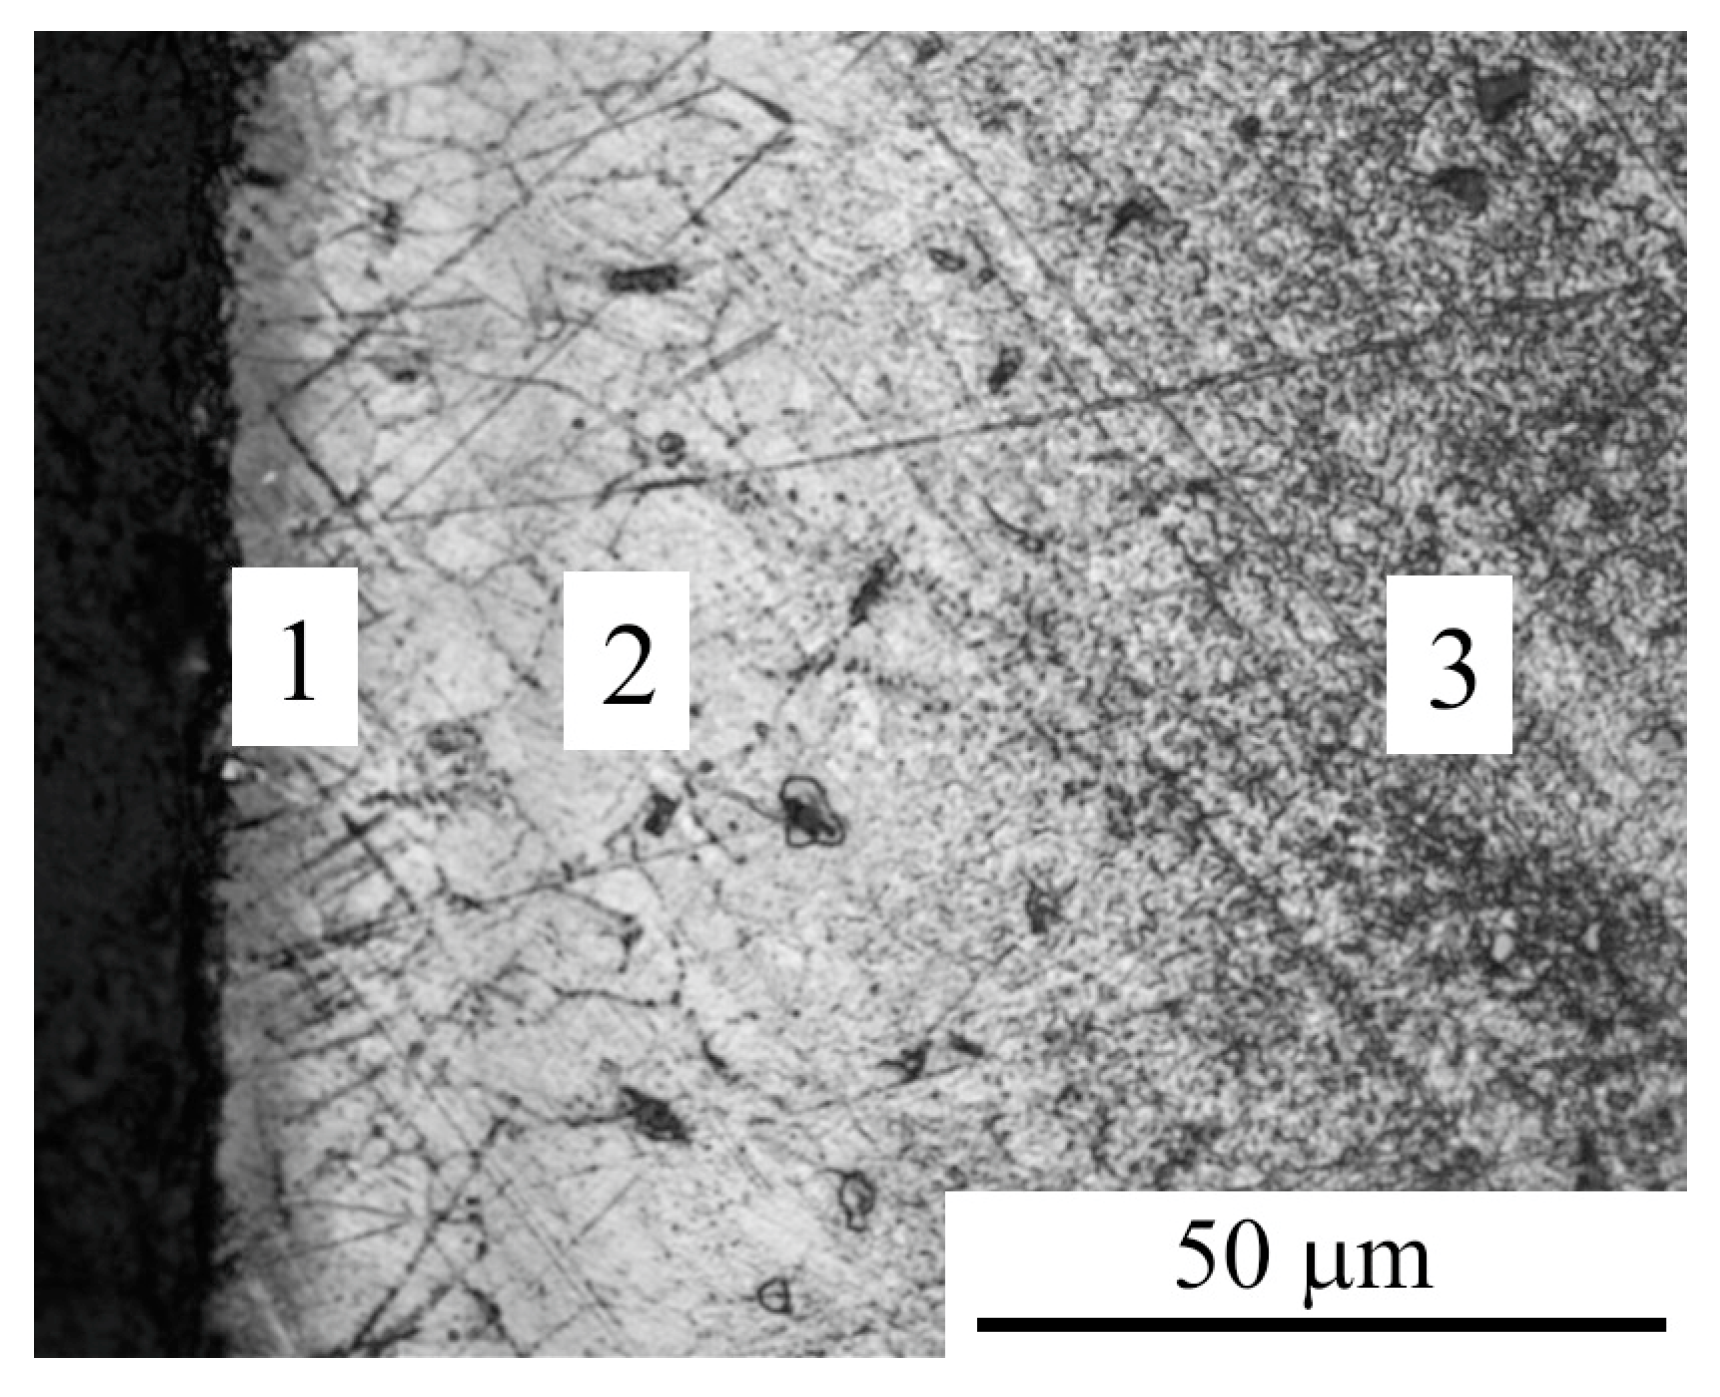
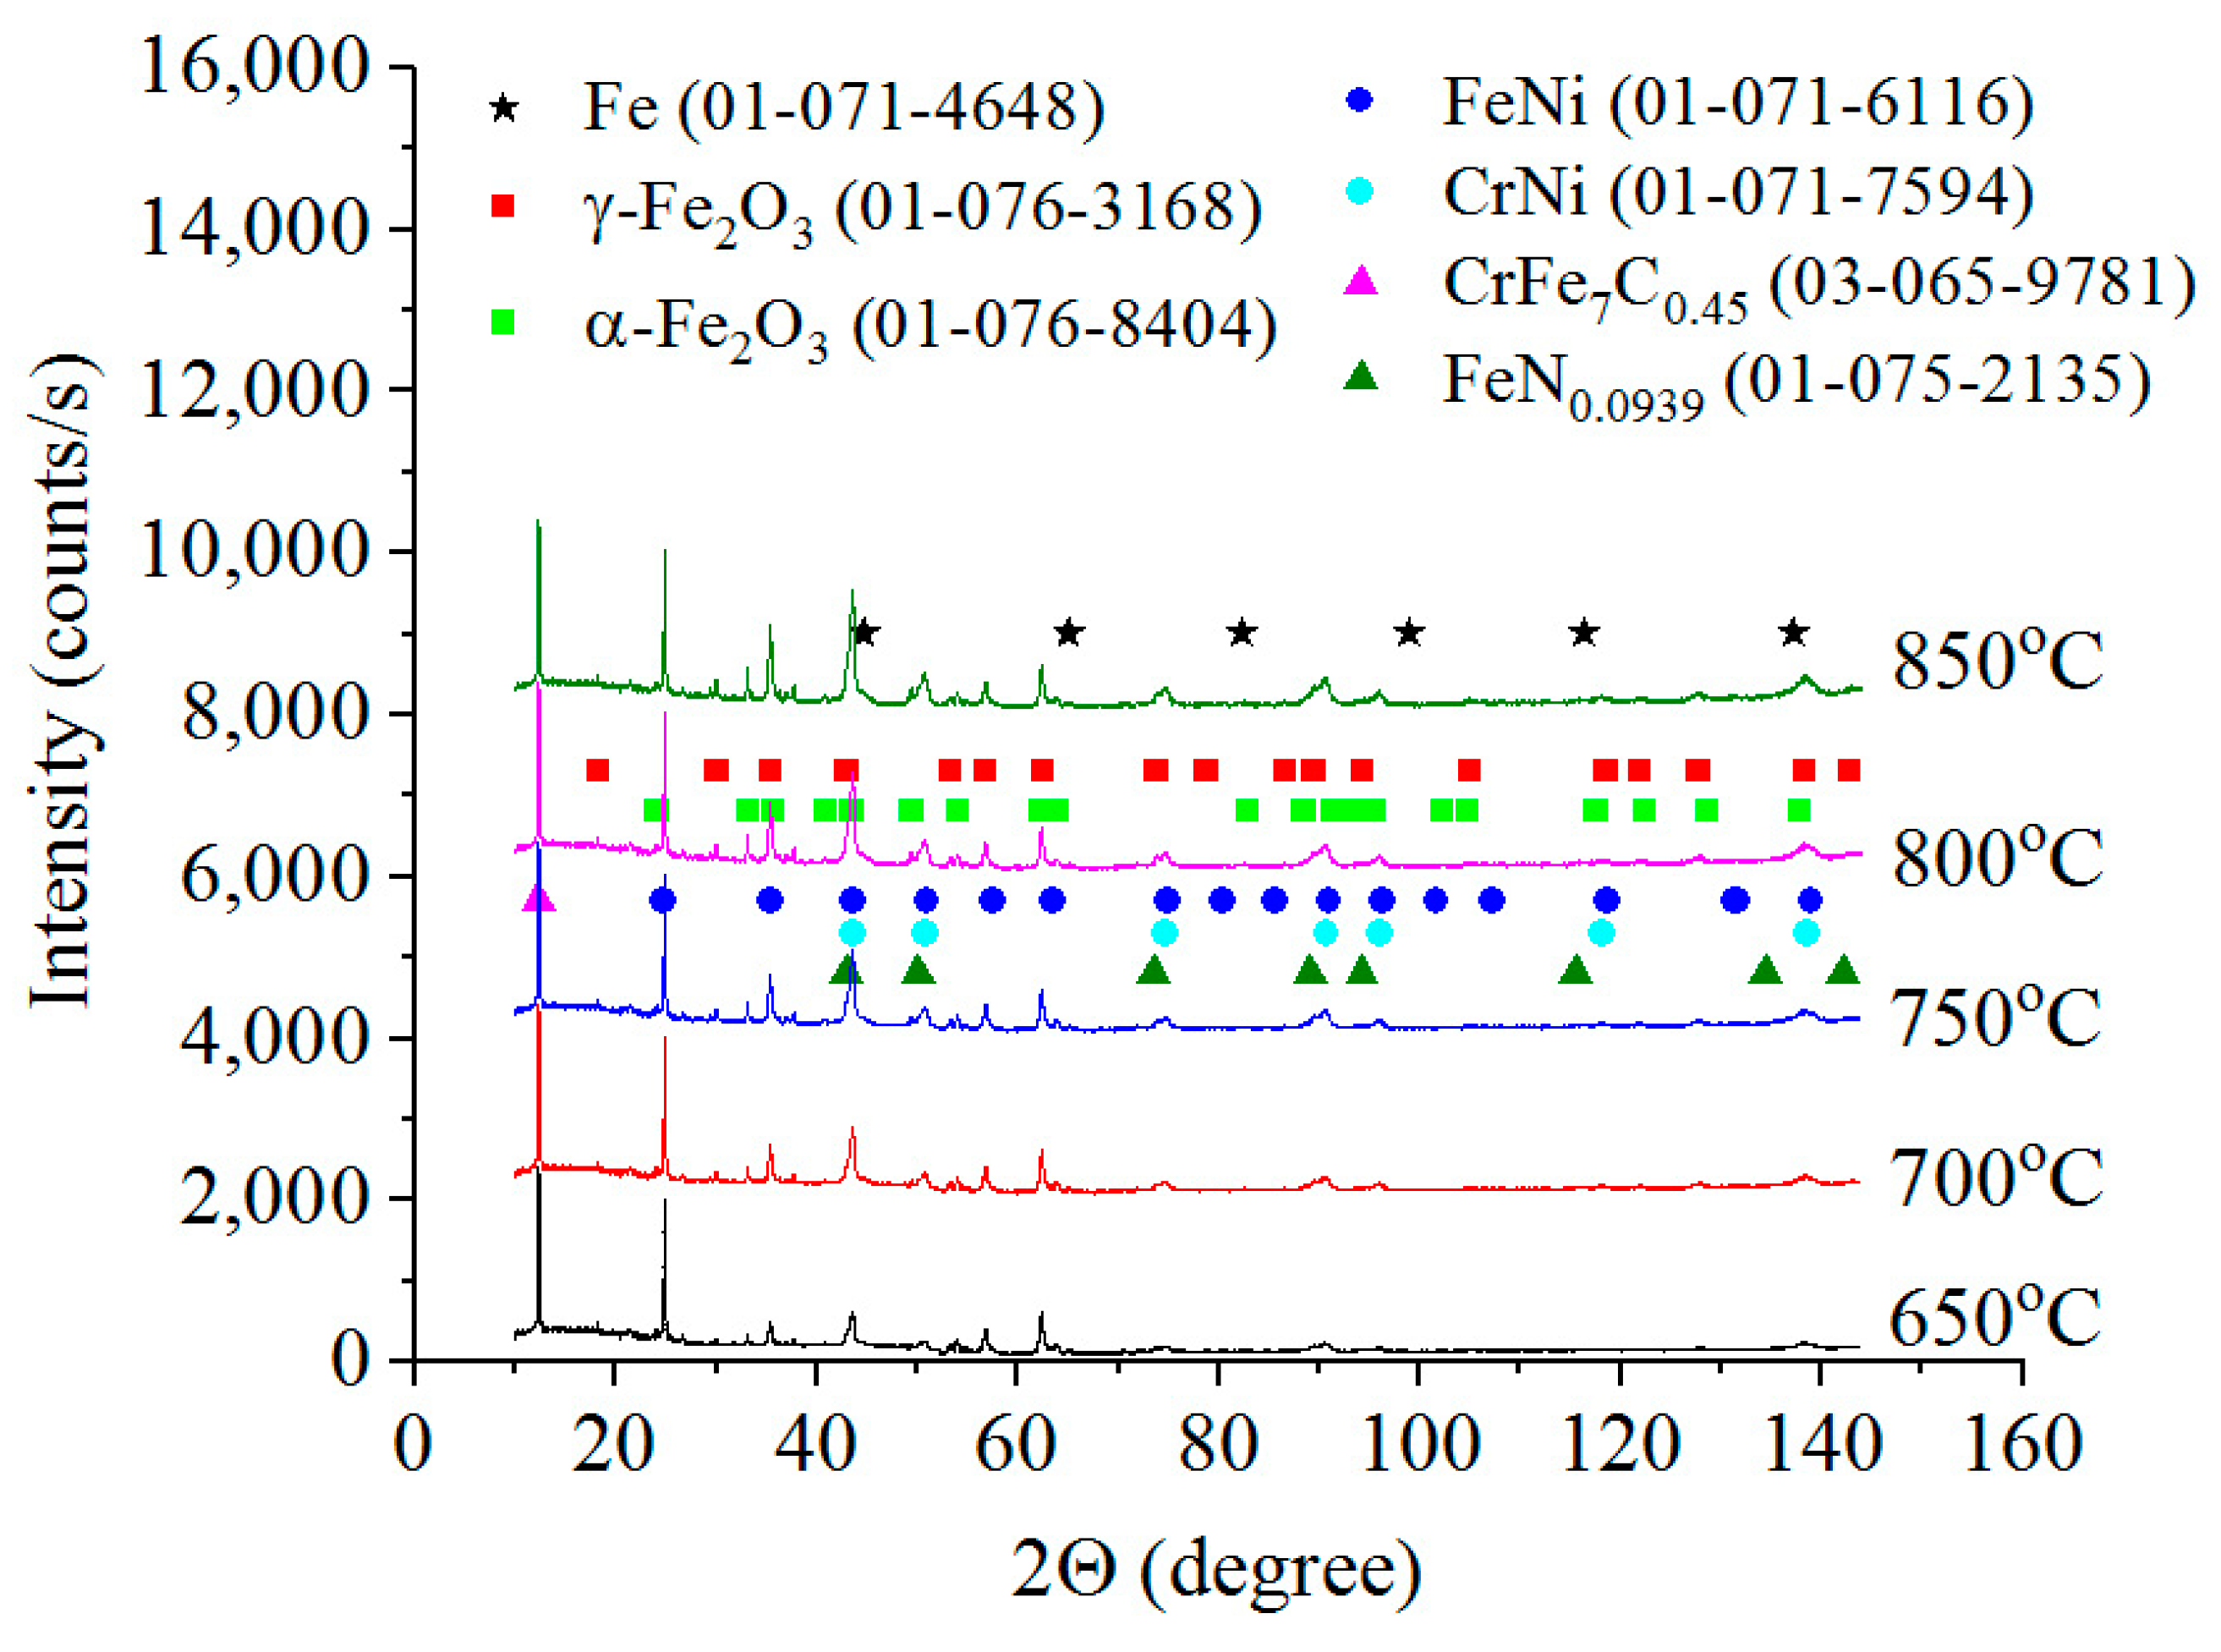
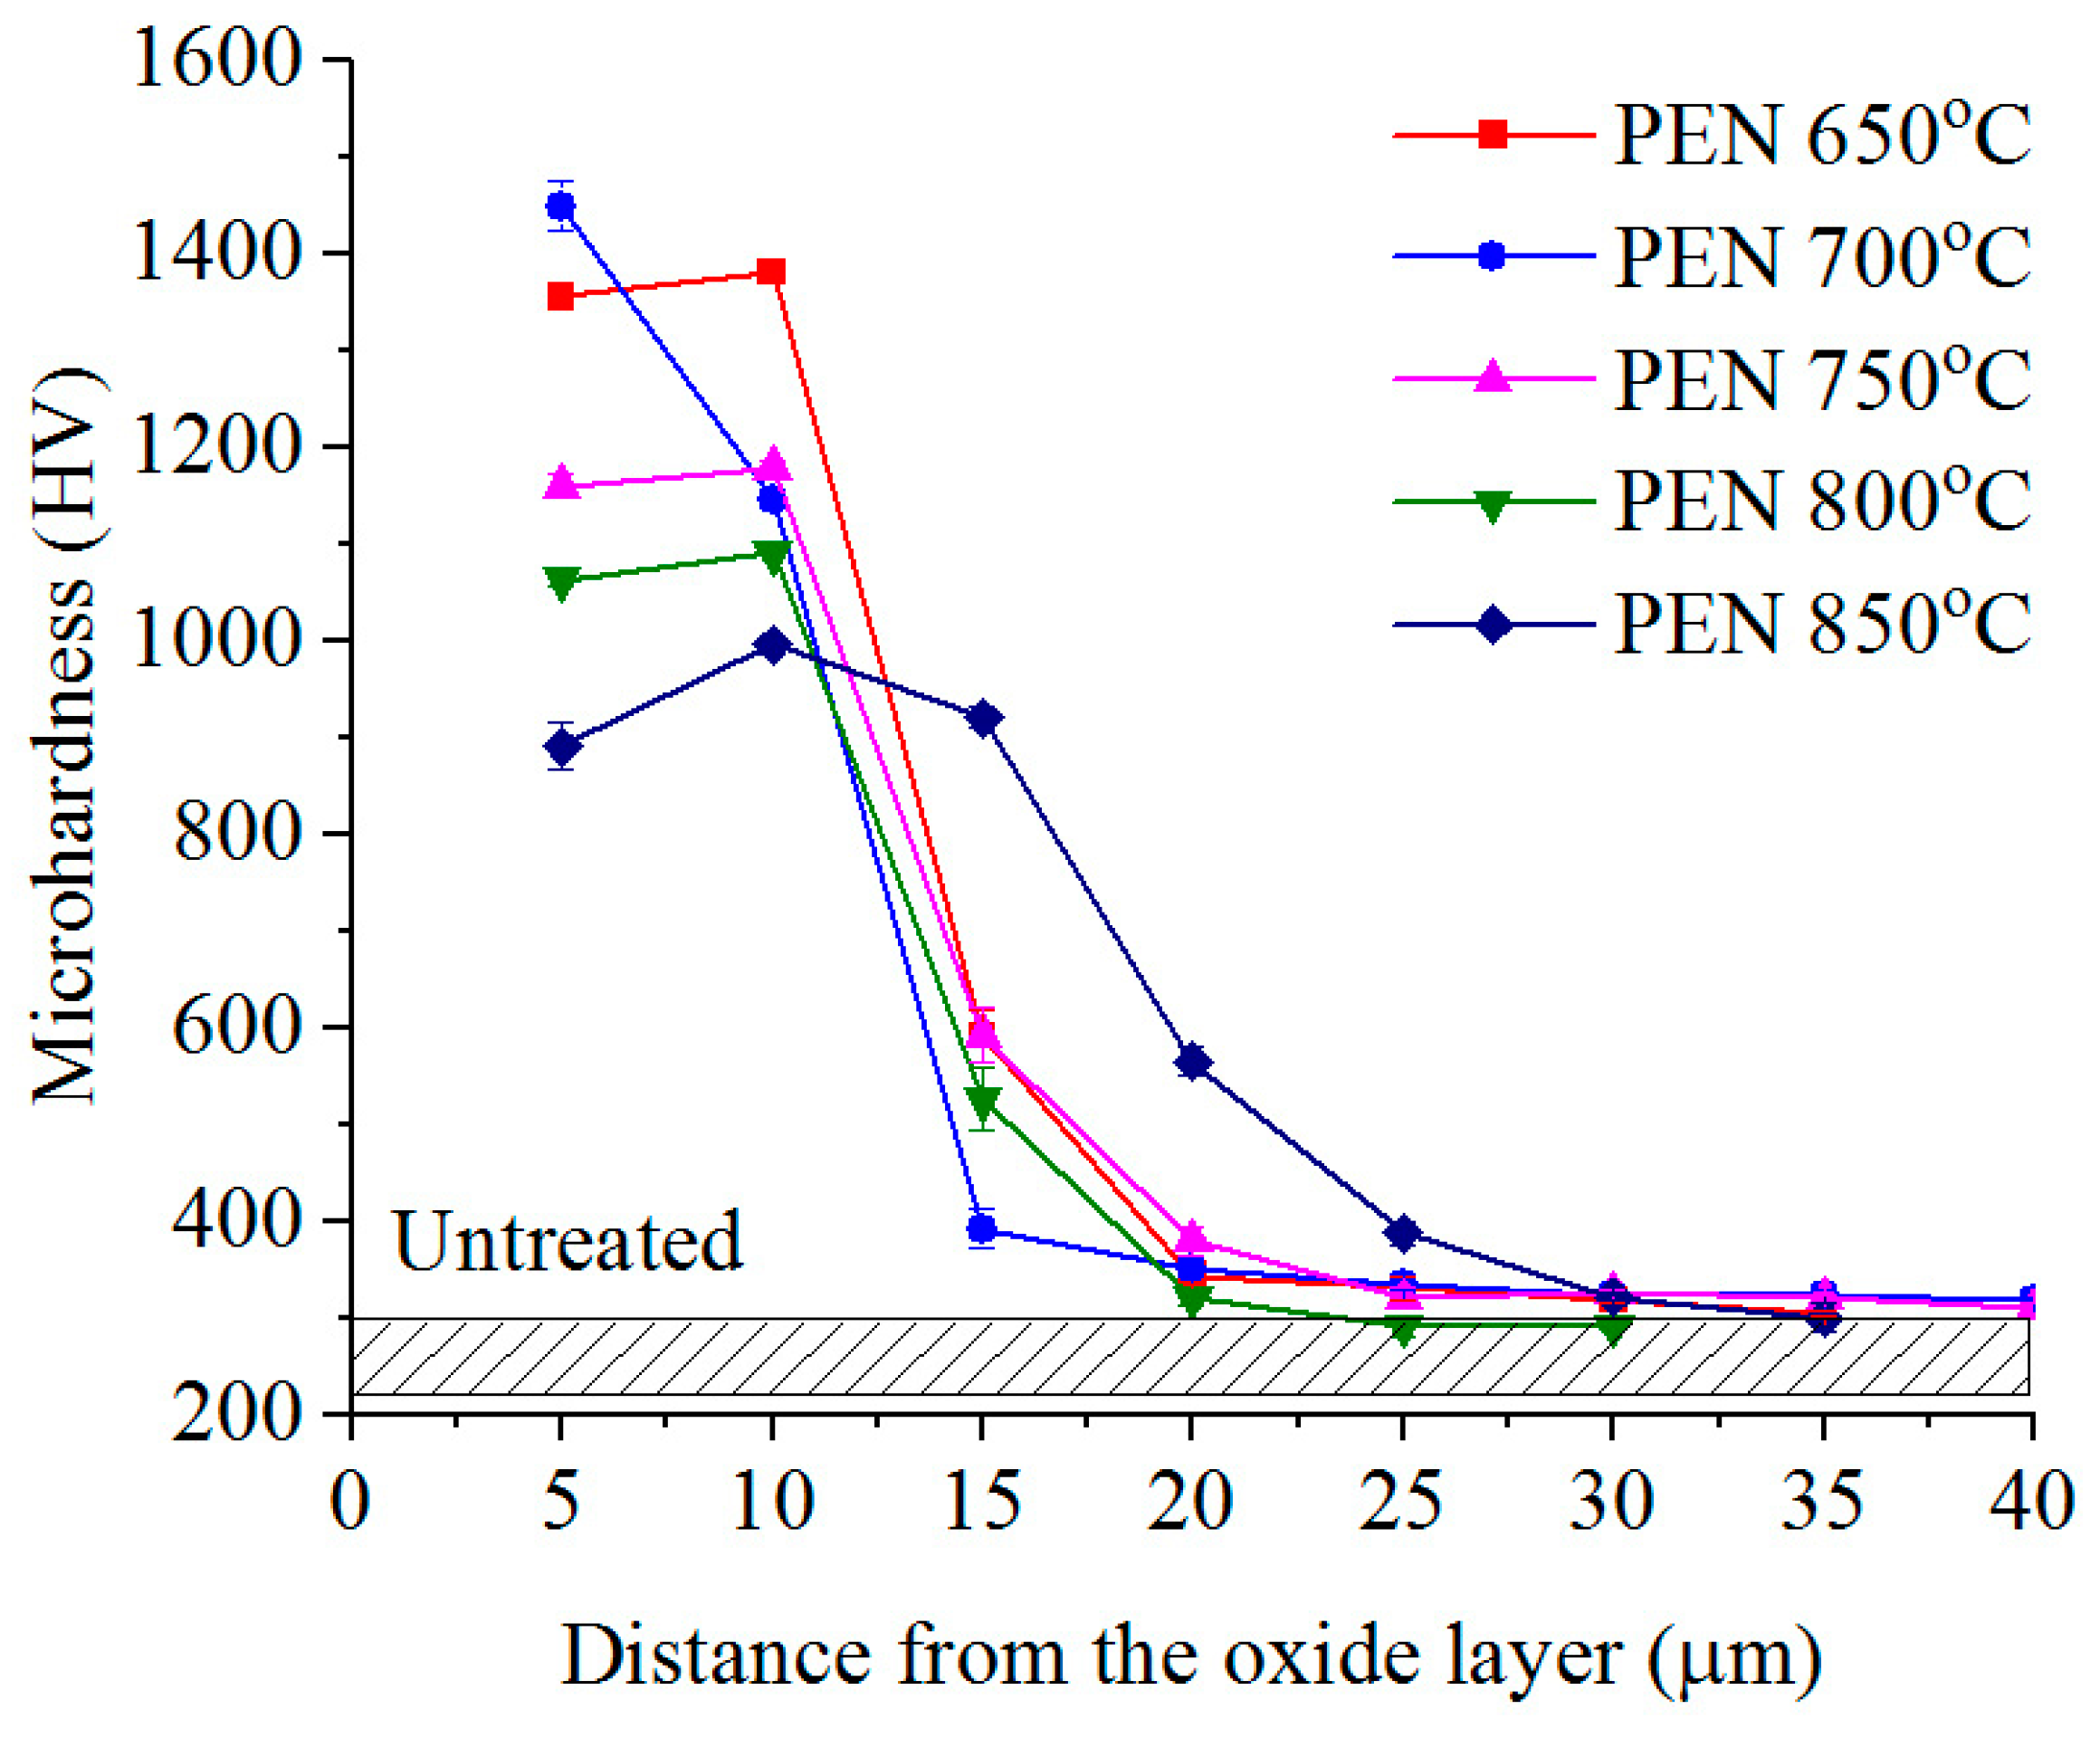
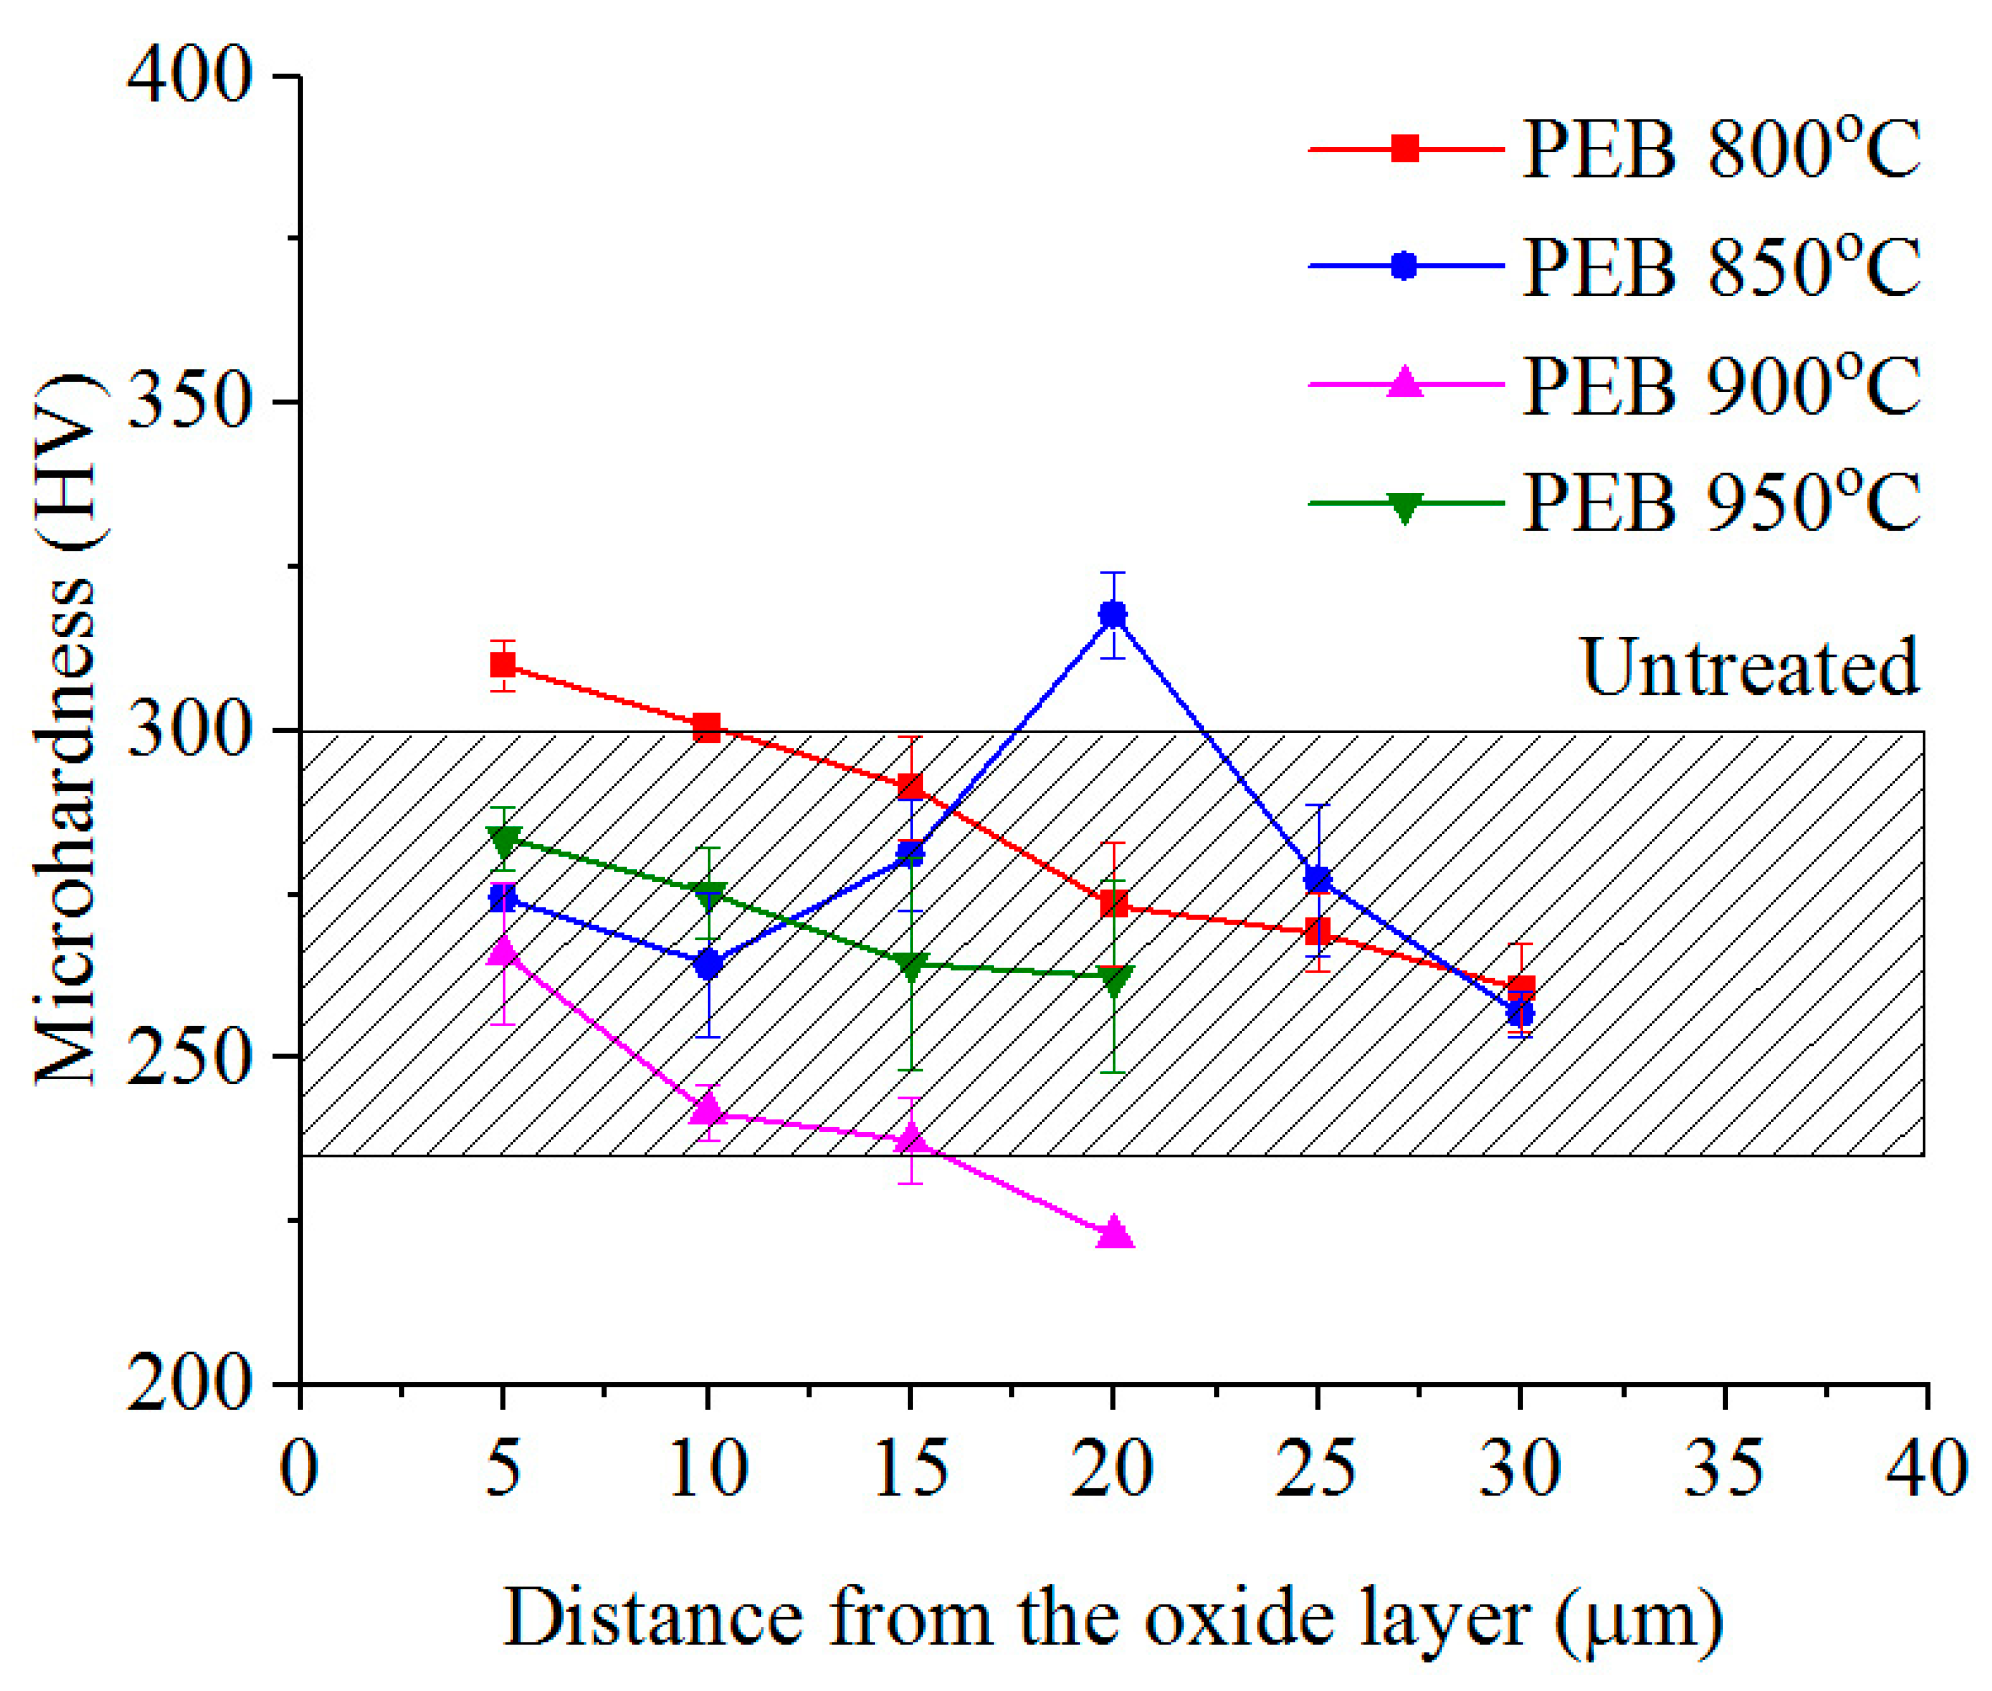
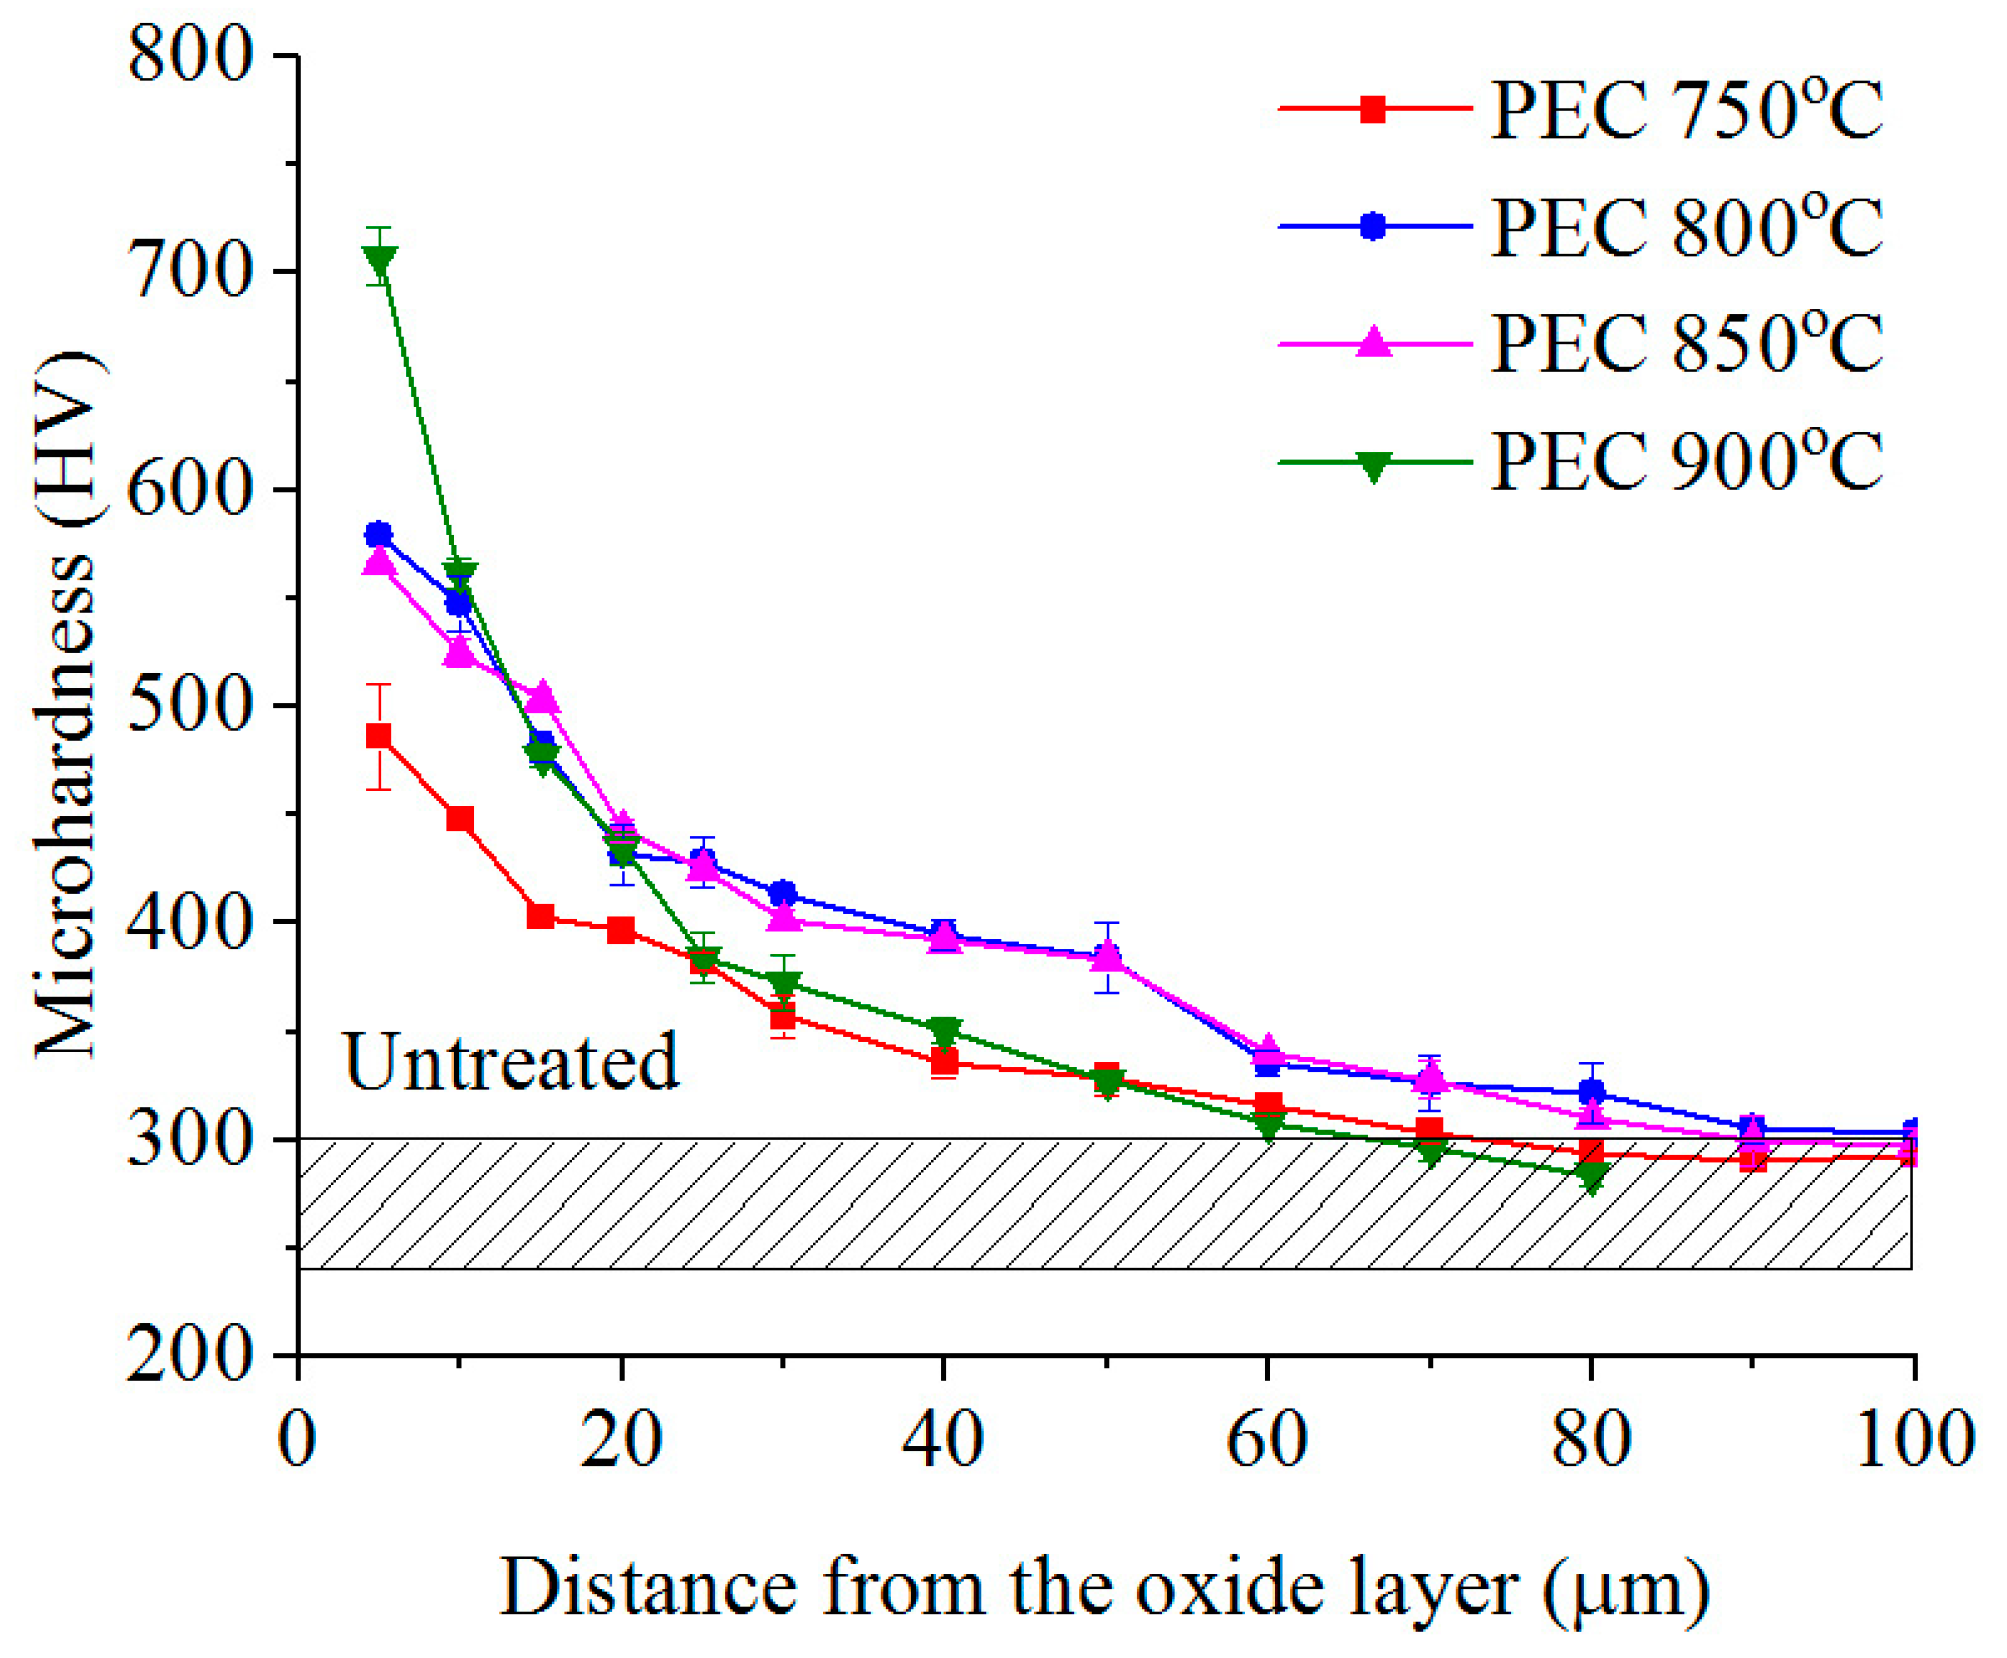
In contrast to the plasma electrolytic treatment of carbon steels that do not contain alloying additives, the surface hardening of austenitic stainless steel with a low carbon content develops due to the formation of inclusion compounds in the form of carbides and nitrides. In this case, an increase in microhardness reaches the depth of phase transformations up to 20–25 microns, which is observed during PEN (Figure 12). During PEC, when quenching with the formation of martensite or the consolidation of the crystal lattice is possible, due to the presence of carbon diffusion at a greater depth than nitrogen, the surface layer hardens up to 80 μm (Figure 14).According to this mechanism, the hardening of low-carbon unalloyed steels is possible during anodic PEC [36,37] and PENC [39,40,44]. The results of PEB clearly showed that the absence of inclusion compounds in the surface layer does not lead to an increase in microhardness (Figure 13), while the PEB of medium carbon steel (0.45 wt.% C) makes it possible to harden the surface to 1800 HV [42,43].
Despite the decrease in the hardness of samples after PEN with an increase in the processing temperature, their wear resistance does not decrease and the relationship between hardness and wear resistance in the function of nitriding temperature is not one-digit. Wear resistance is affected by the formation of nitride particles and the formation of a low level of micro-deformations in the lattice. Nitrides formed in the diffusion layer can be incoherent, coherent or semi-coherent. Coherent and semi-coherent nitrides lead to the greater deformation of the matrix than incoherent ones. Plastic deformation plays a leading role in the wear process. At a higher nitriding temperature, the matrix of the diffusion layer apparently has greater plasticity, which significantly reduces the level of micro-deformations of the crystal lattice of the iron matrix. Therefore, wear resistance does not decrease following a decrease in hardness. The level of weight wear within the margin of error does not change.
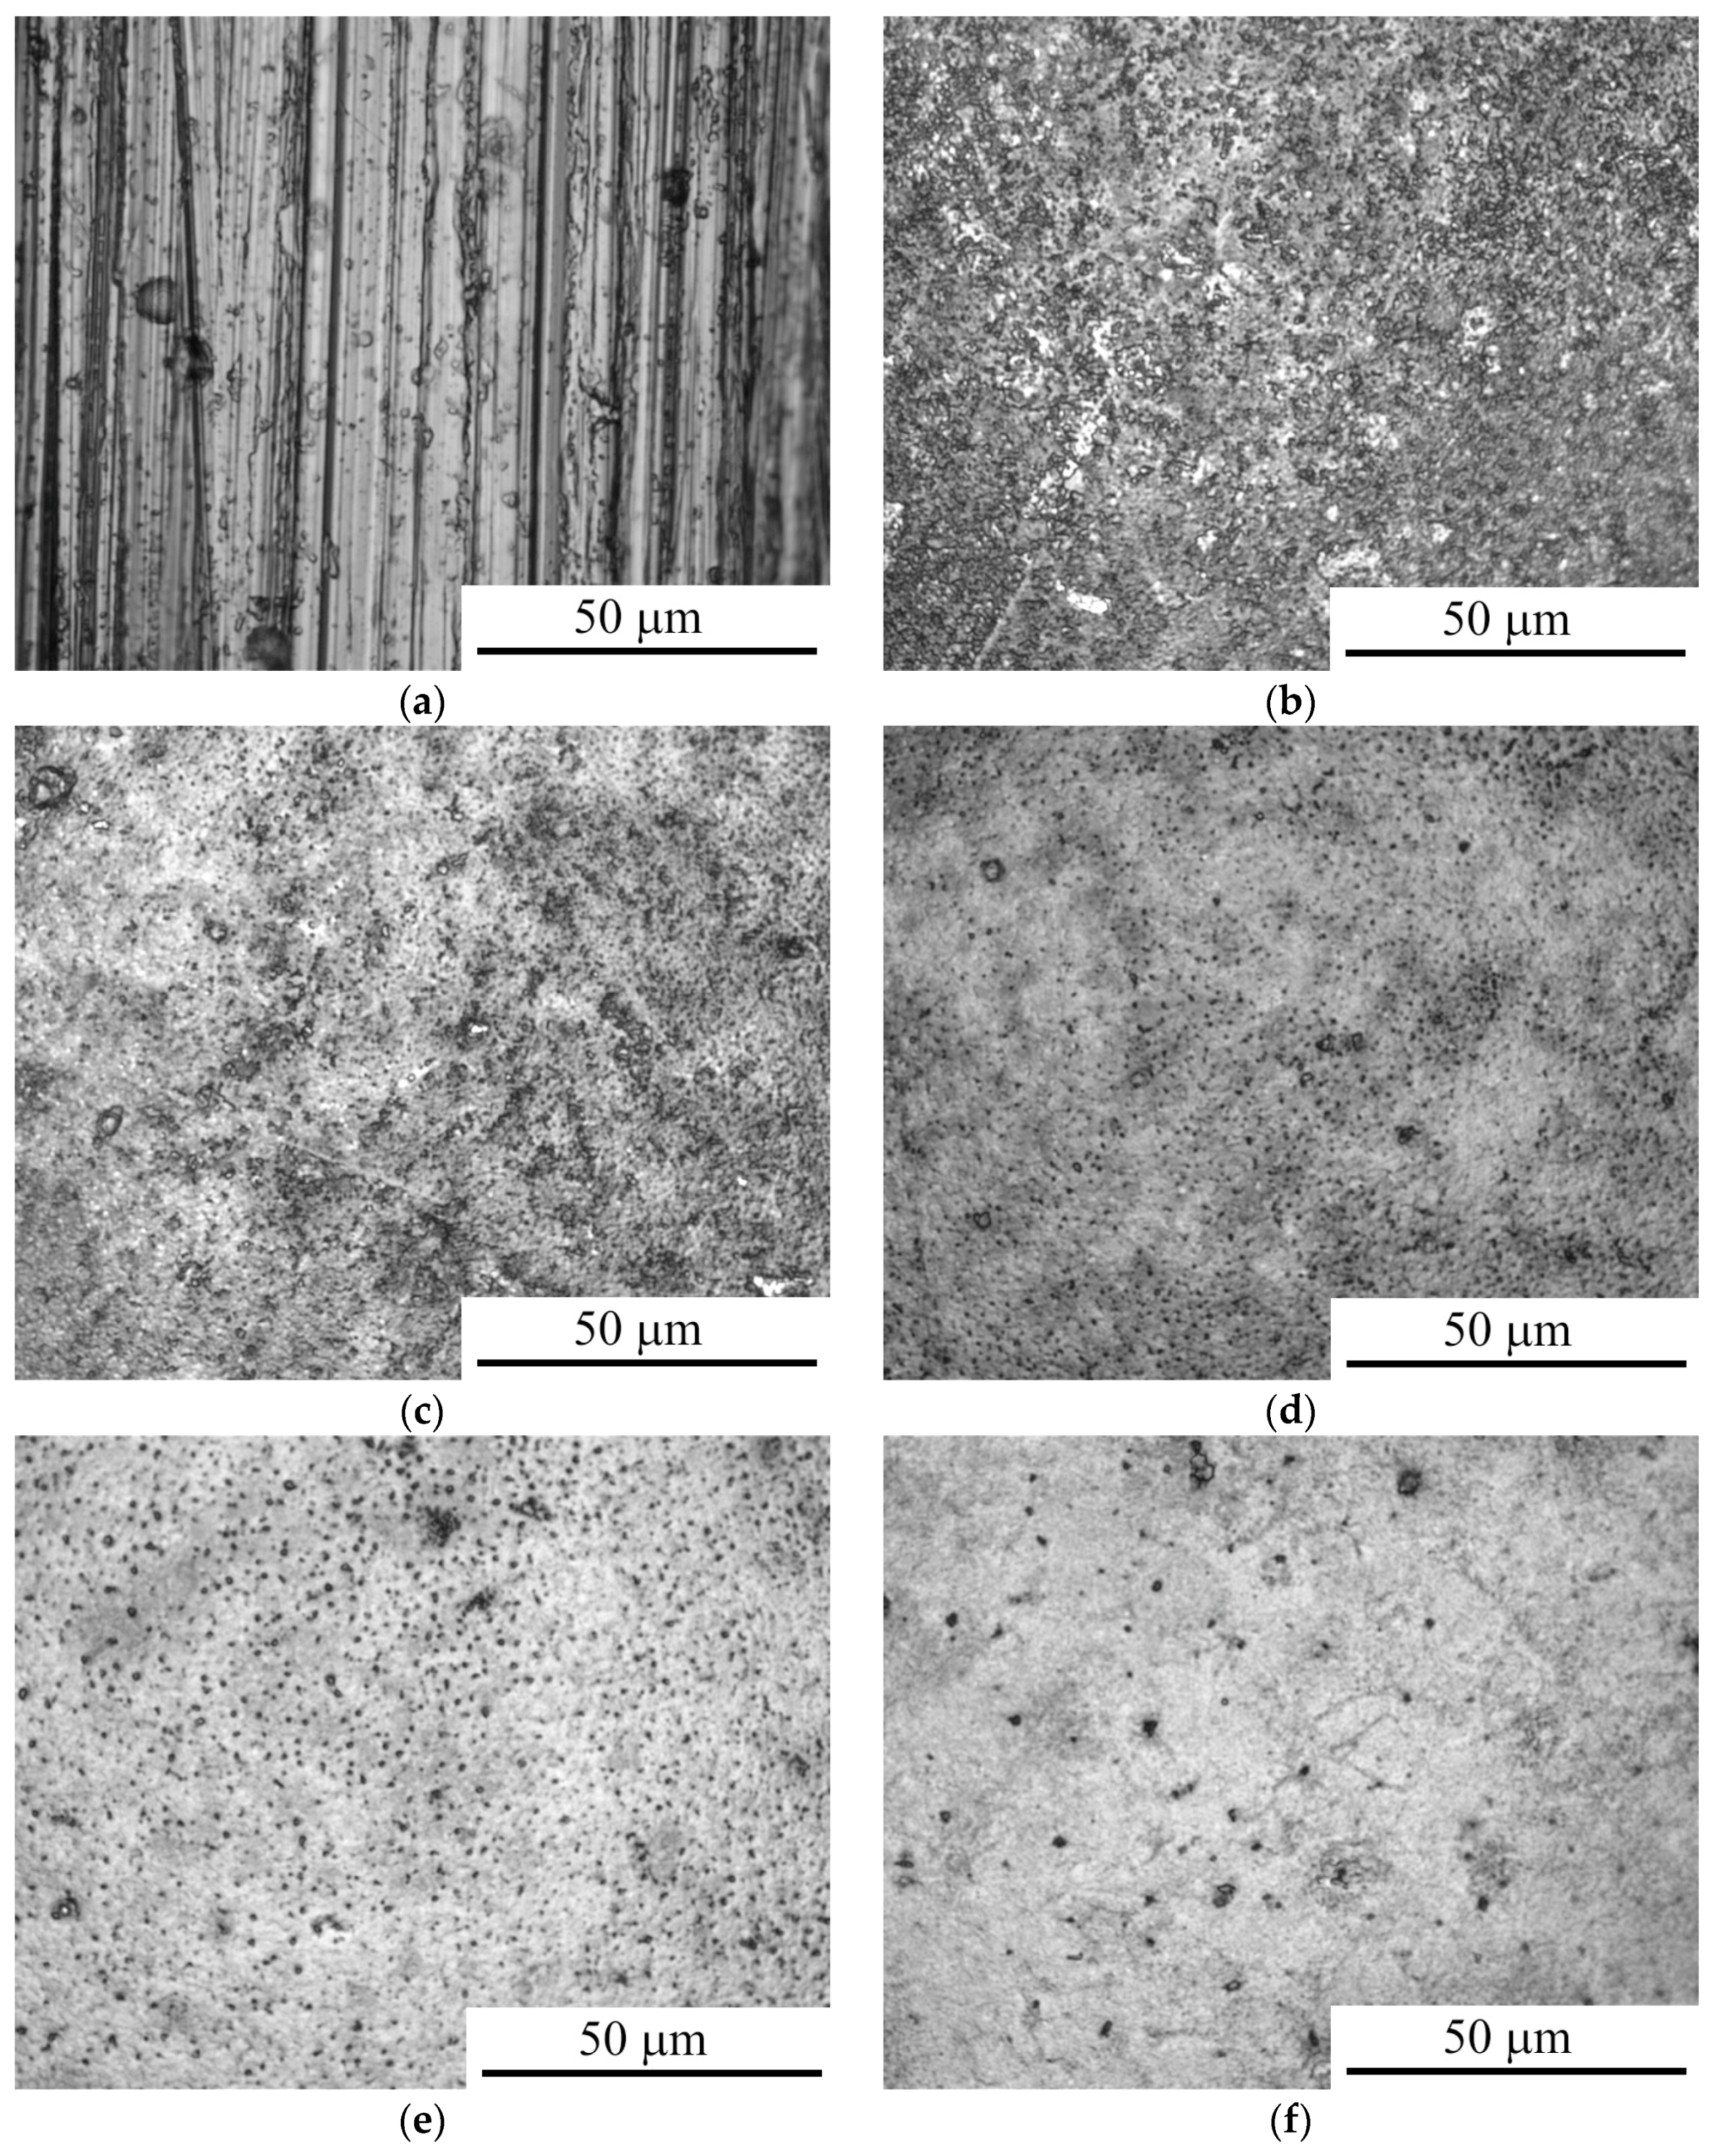
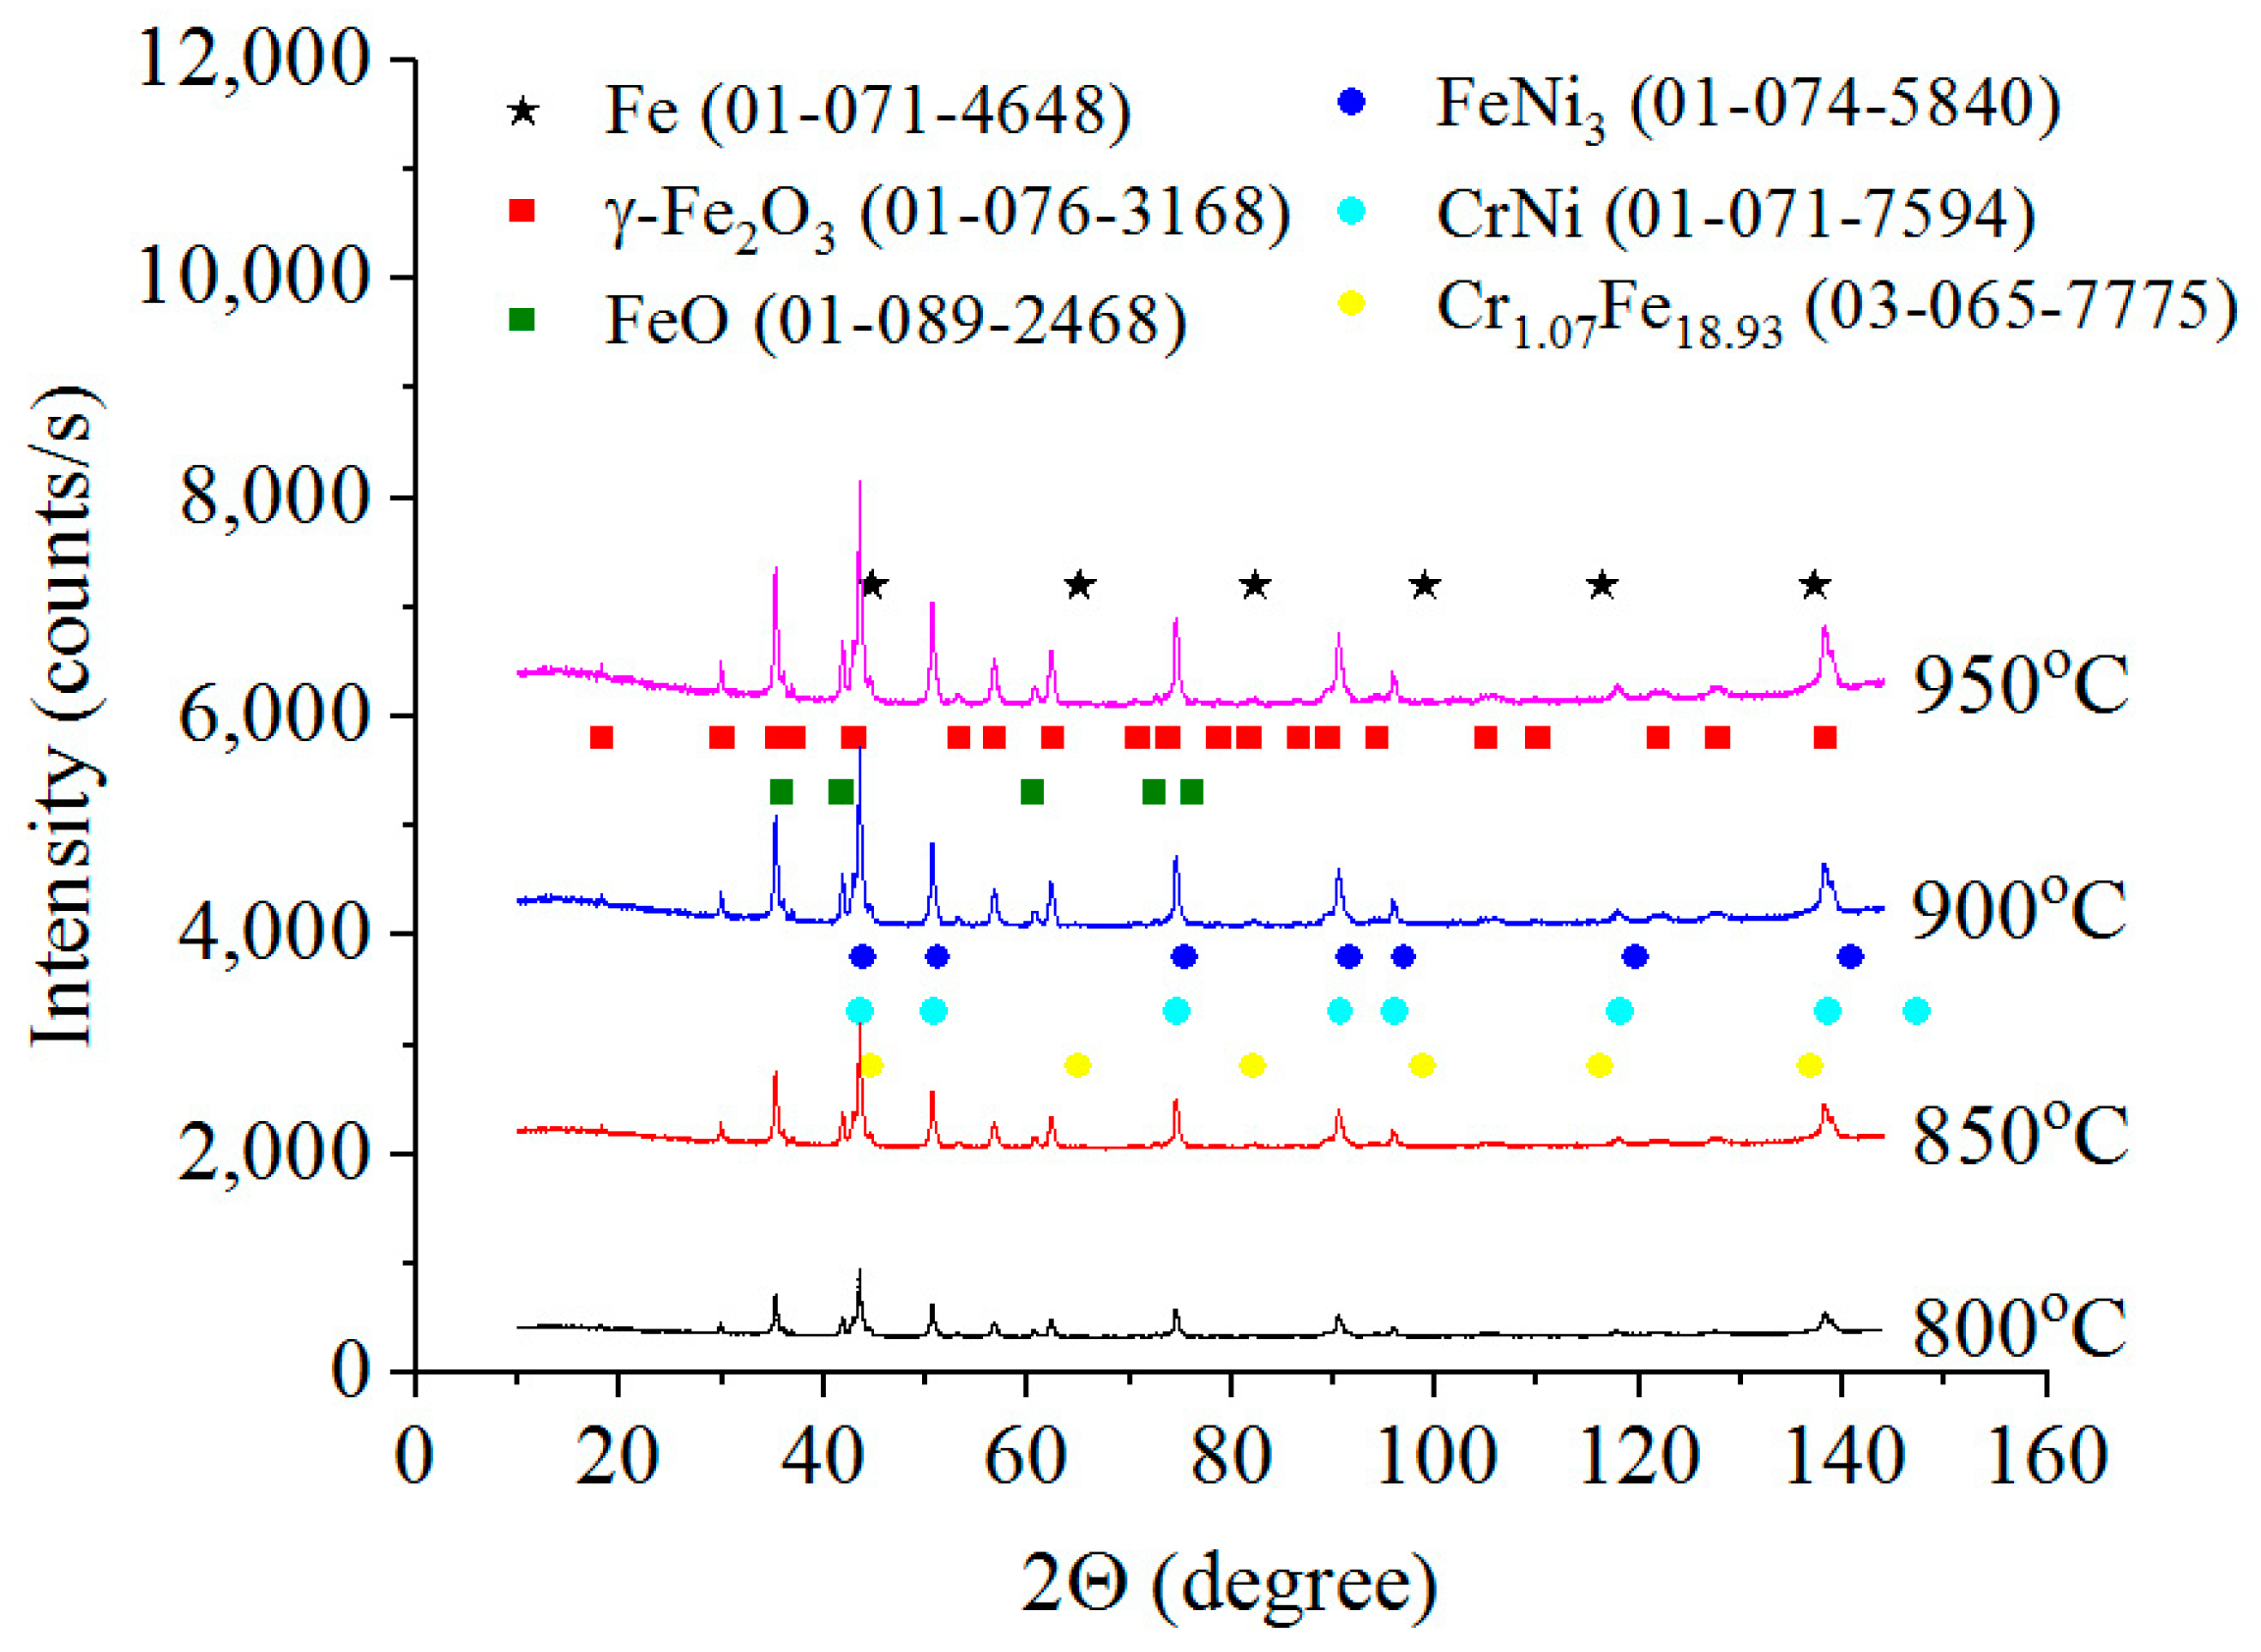
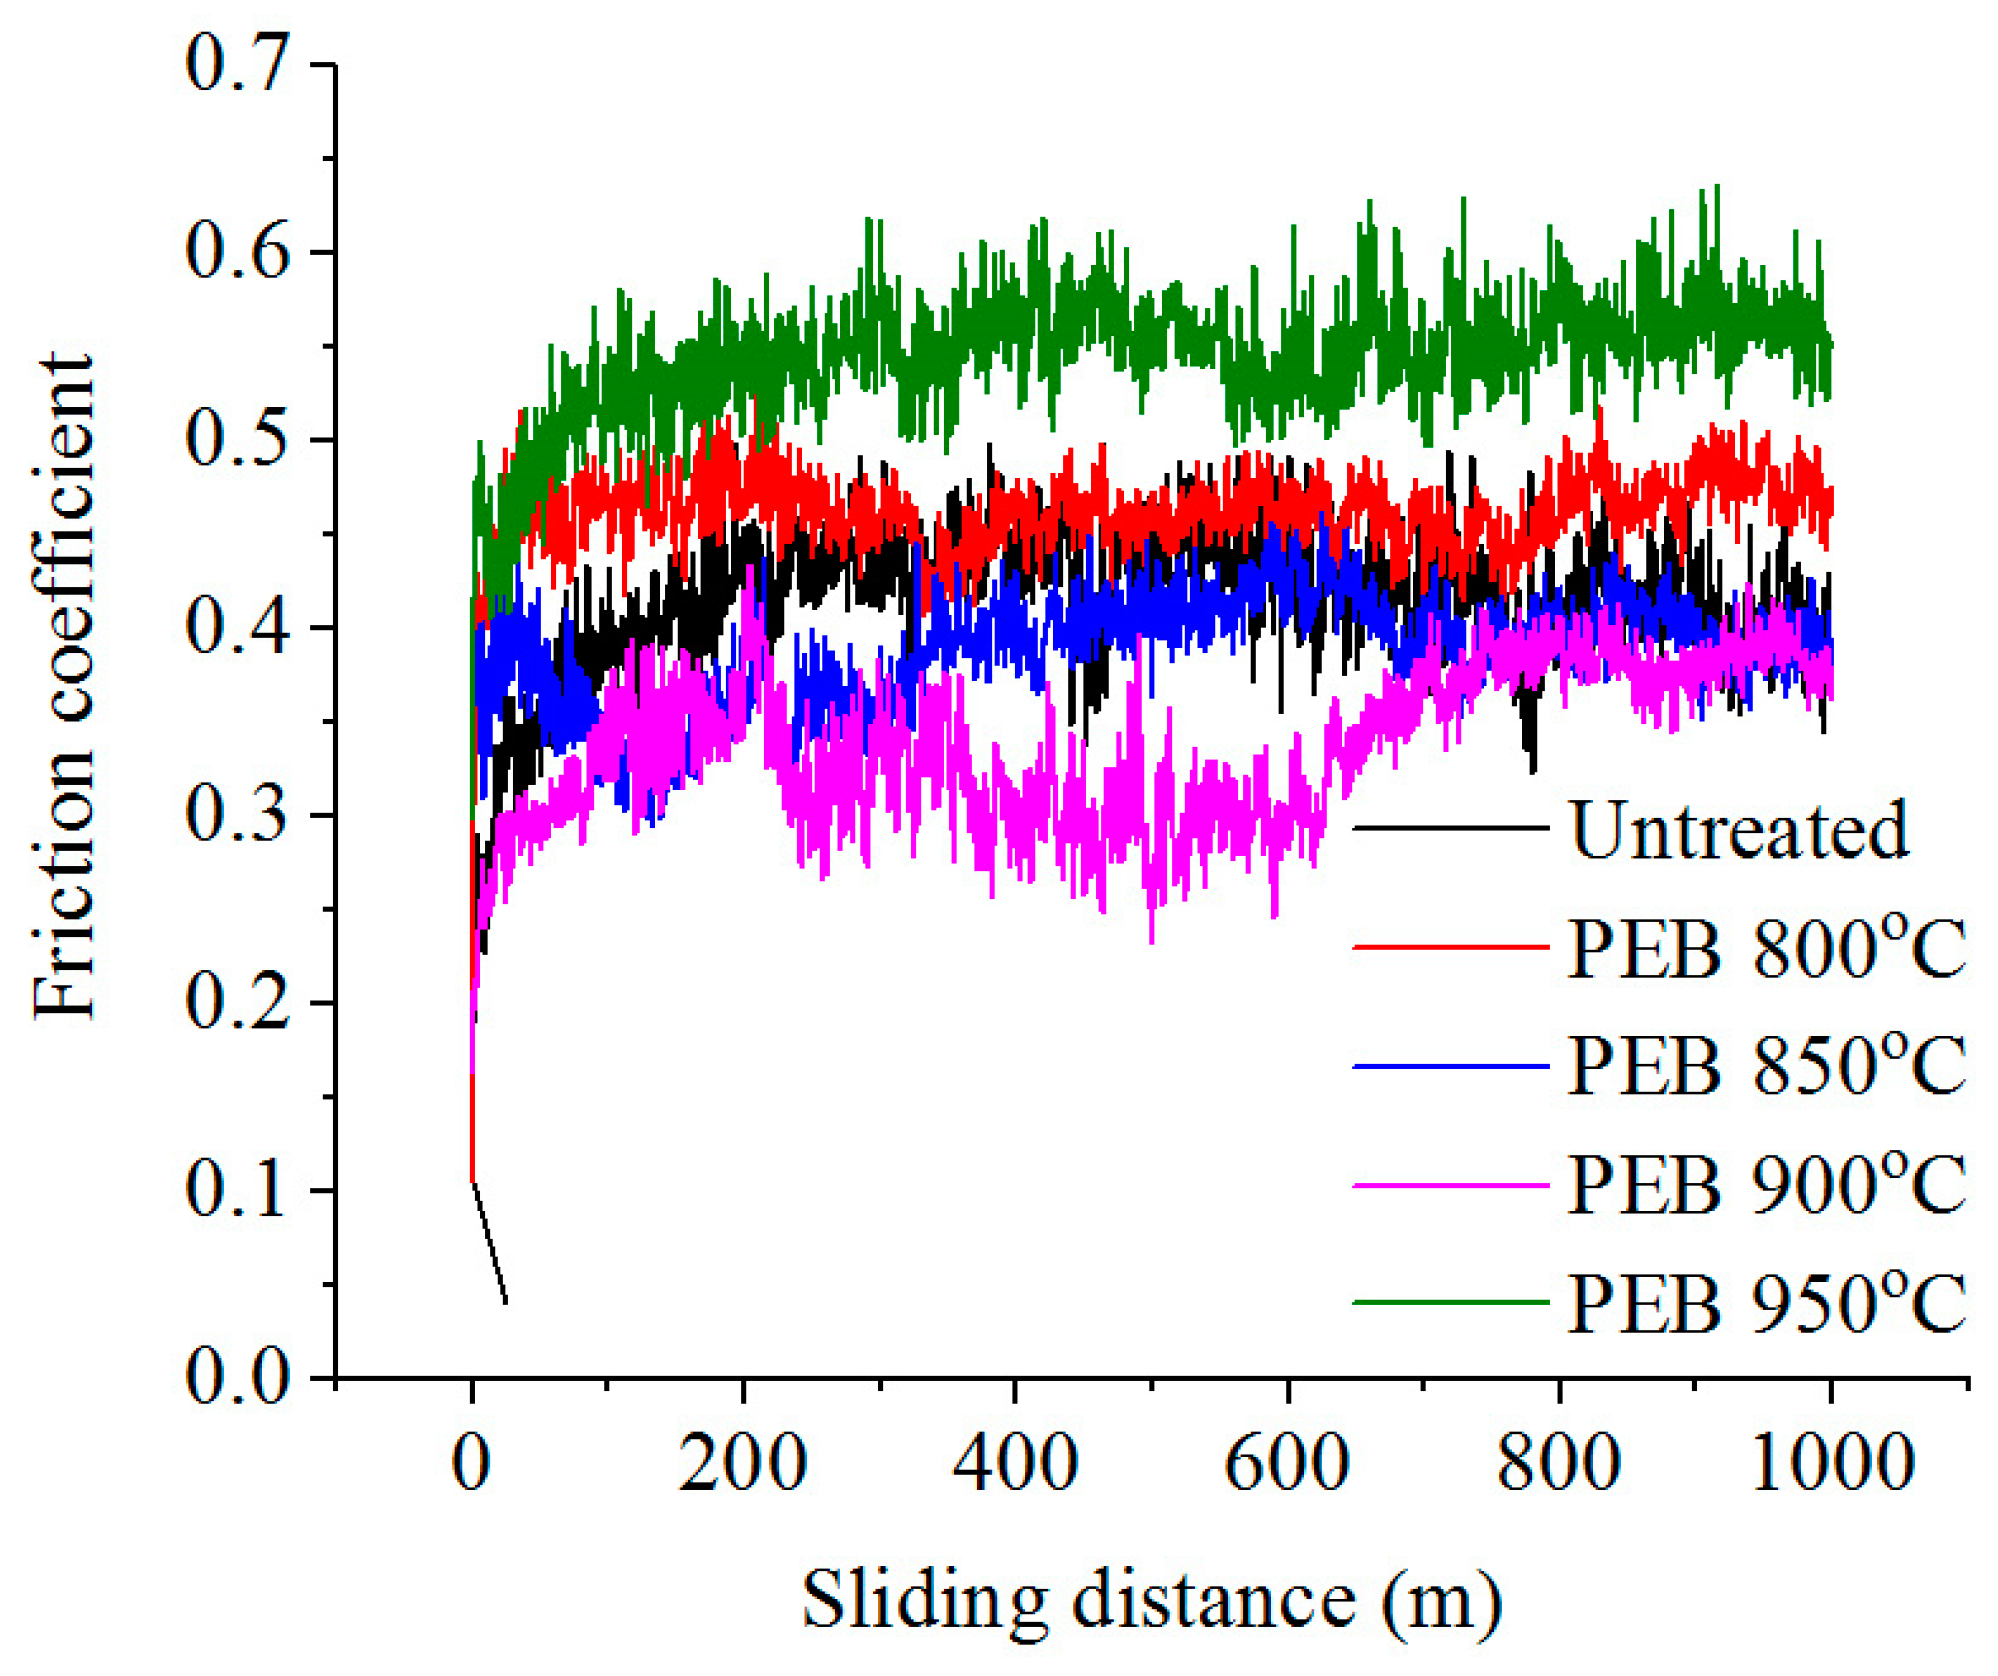
Samples after PEB show the maximum level of weight wear and the highest friction coefficient after treatment at temperatures of 800 and 950 °C, which corresponds to the cases of the most developed pores on the surface (Figure 4). The X-ray analysis of the sample after saturation (Figure 10) shows the presence of FeO on the surface, which can lead to both an increase in the friction coefficient and friction weight losses.
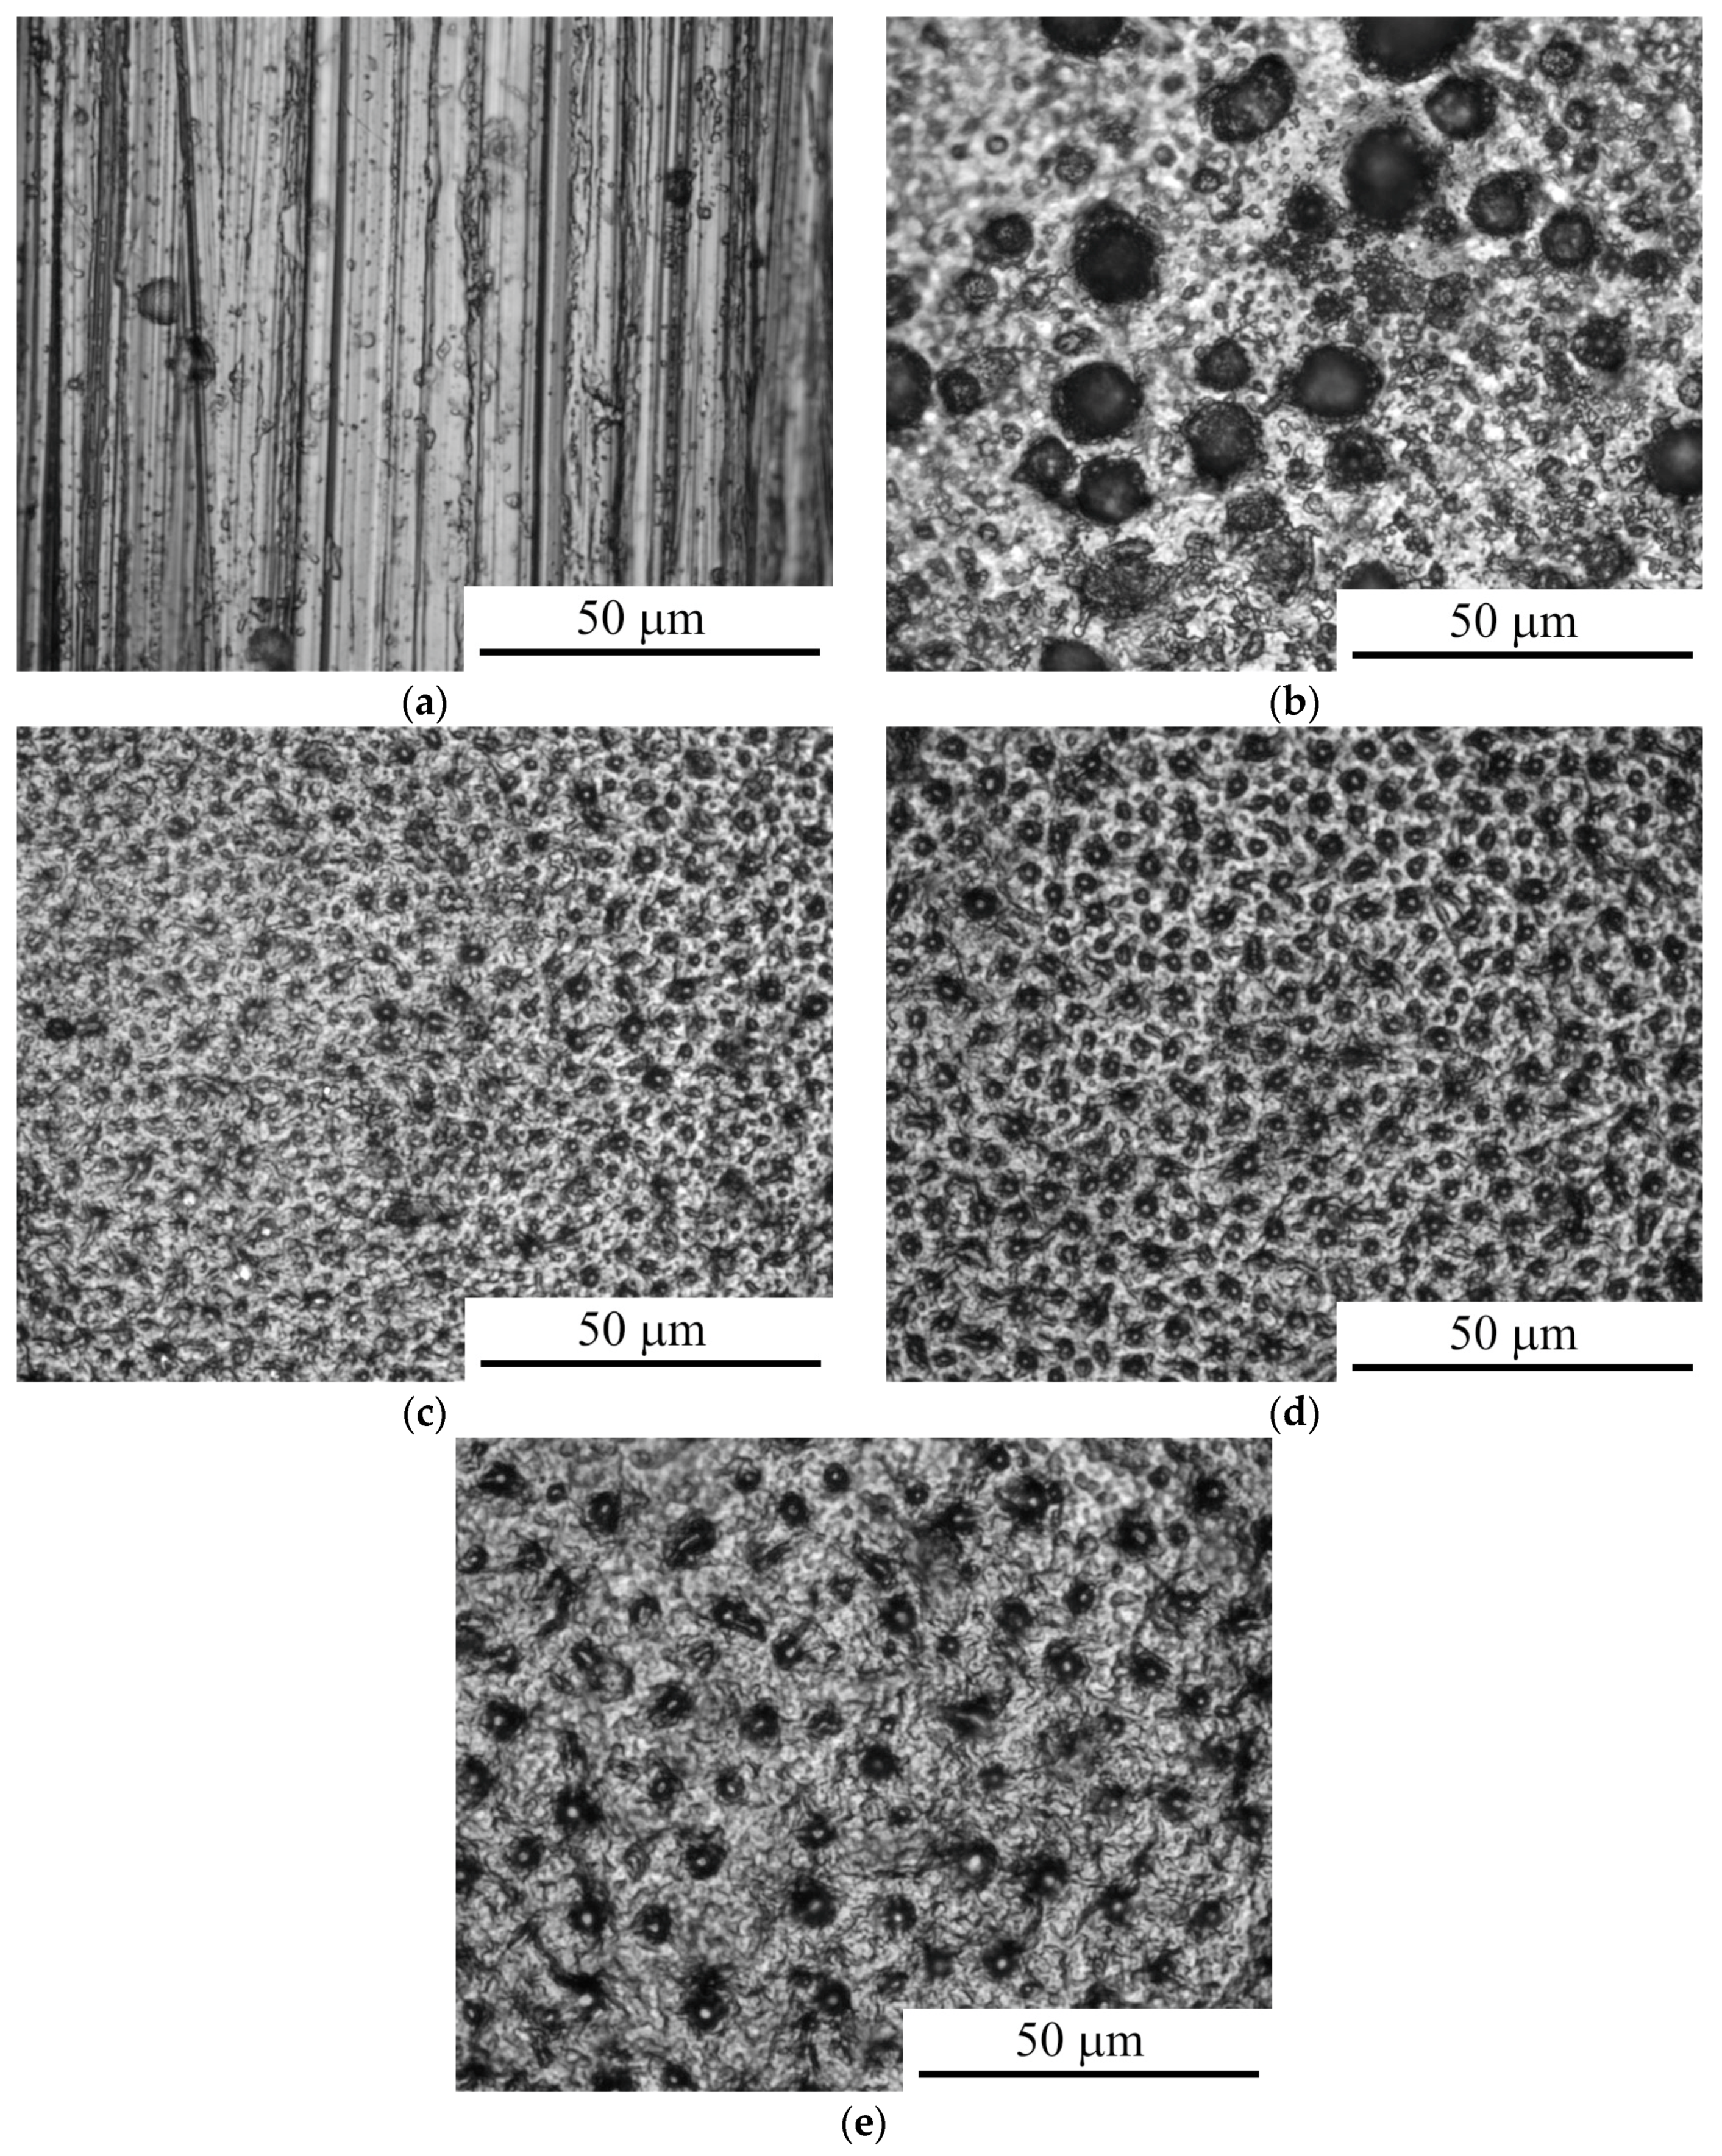
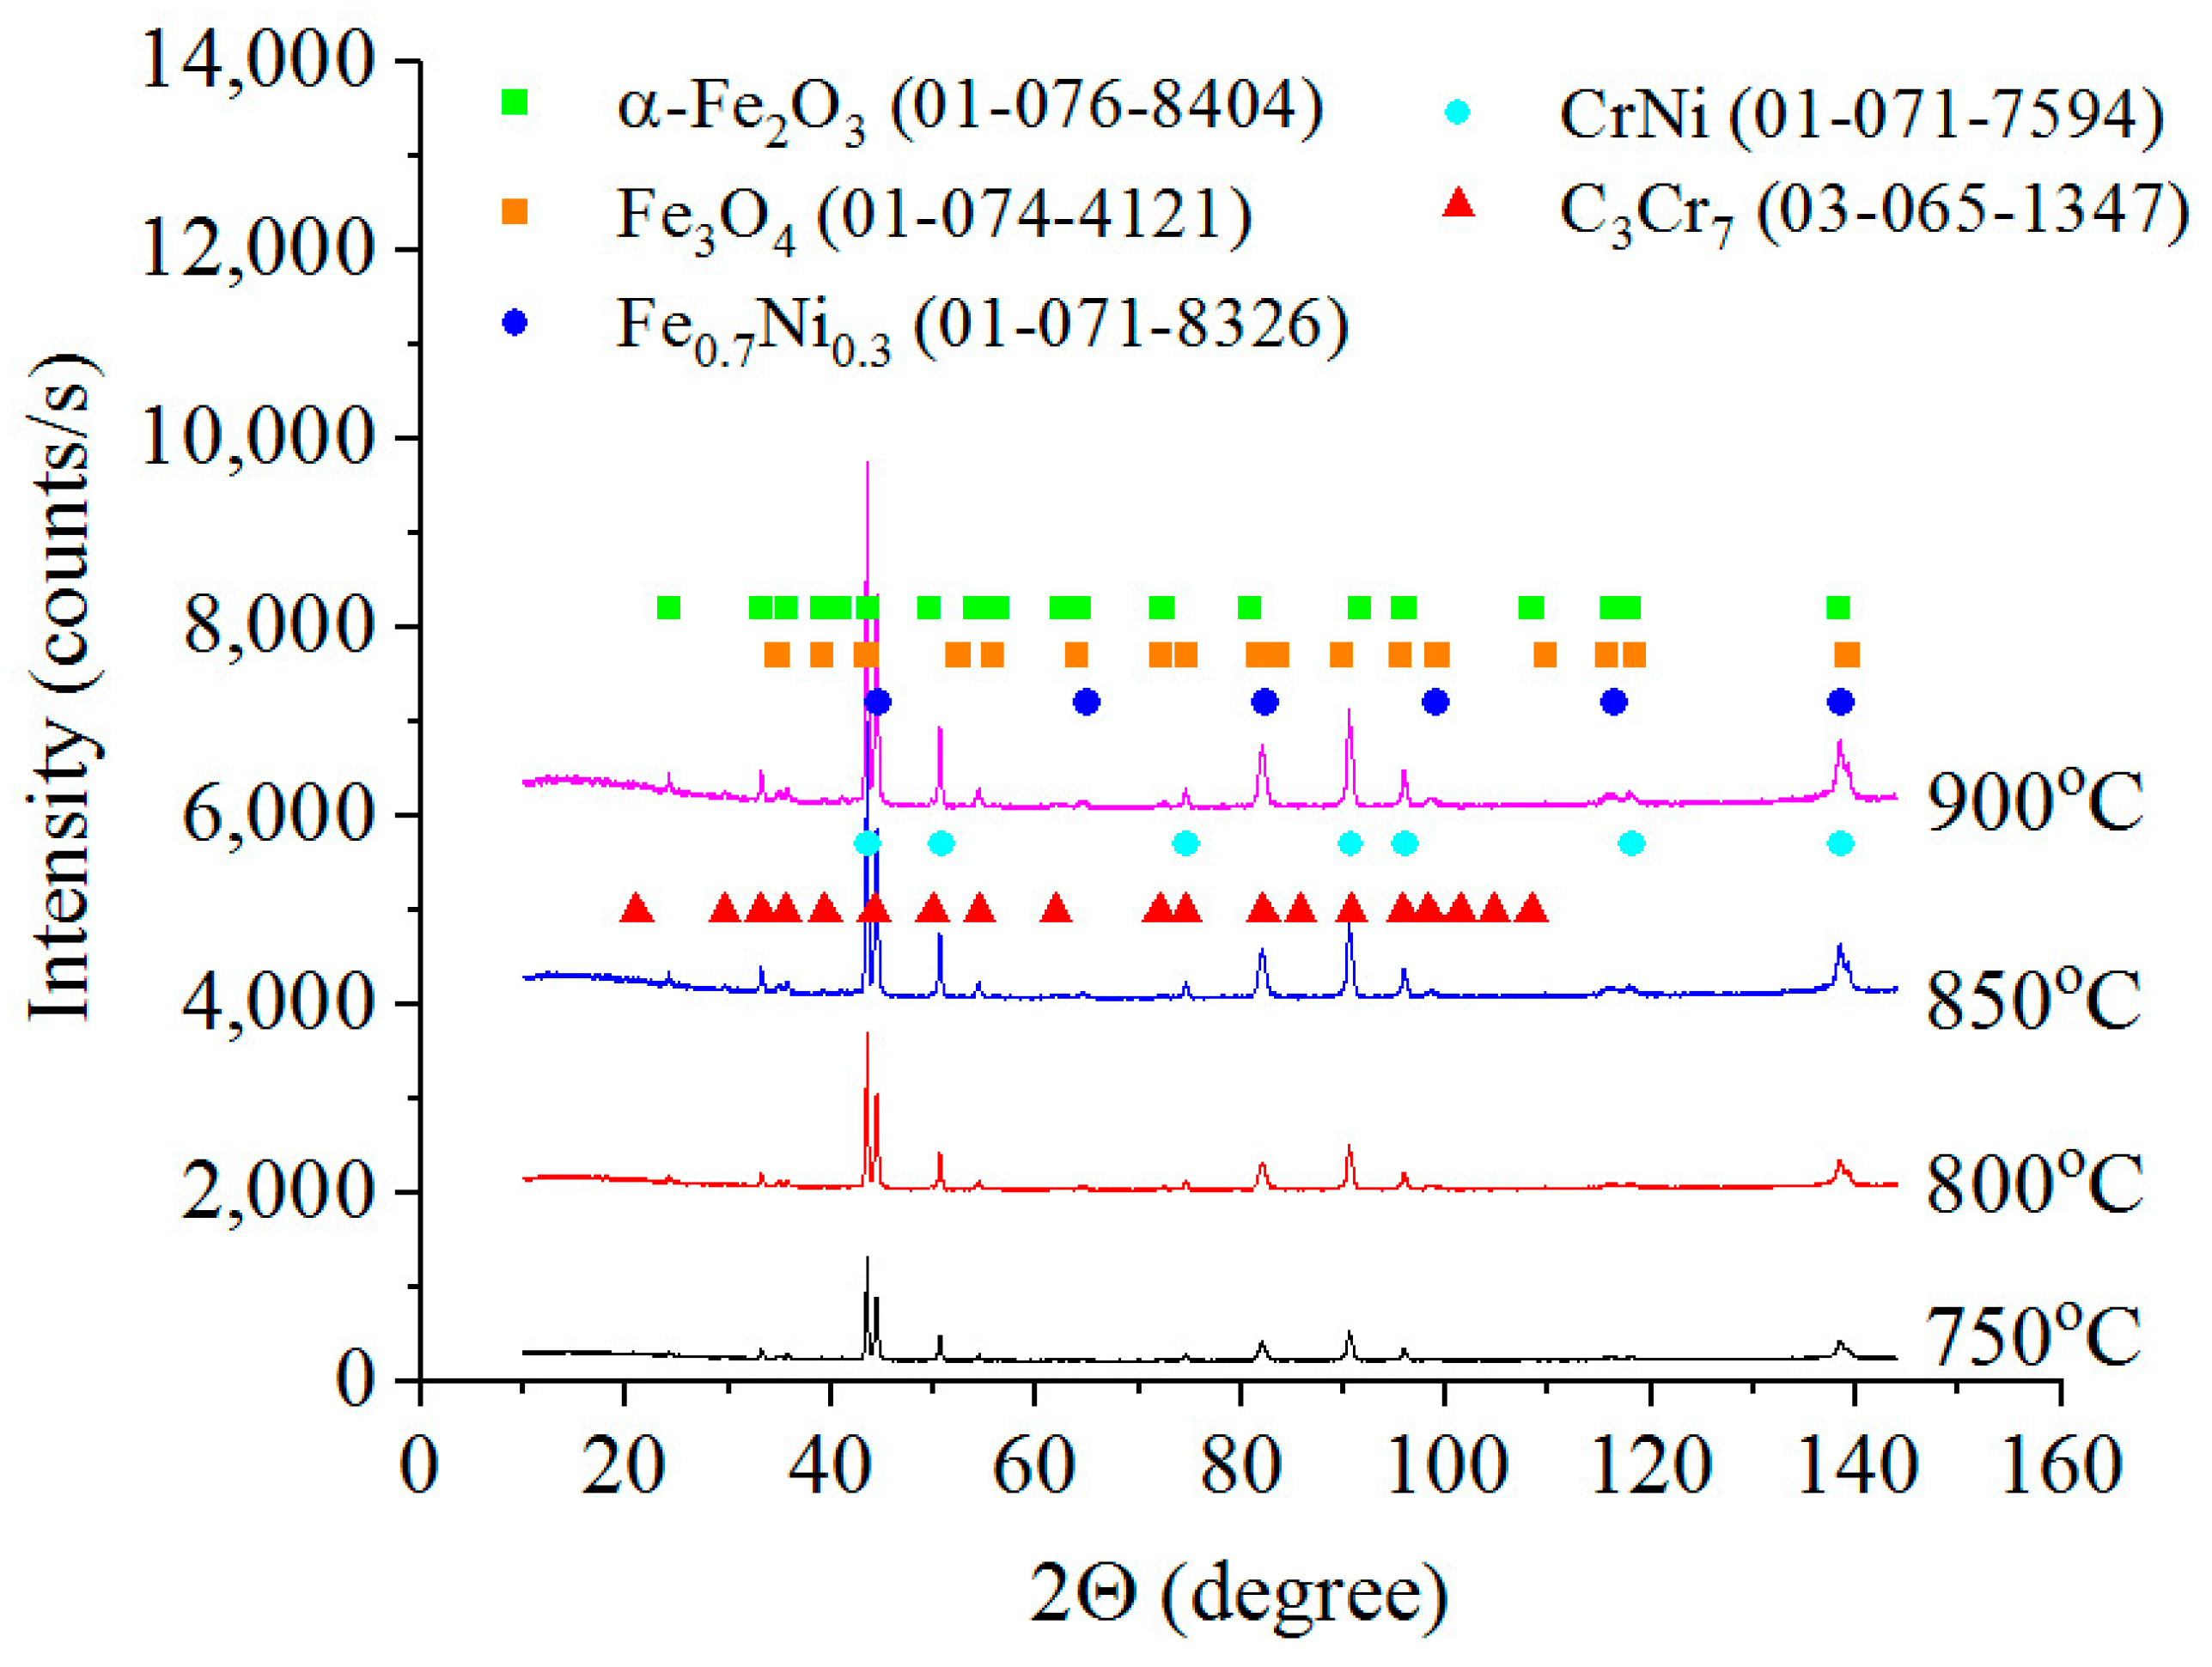
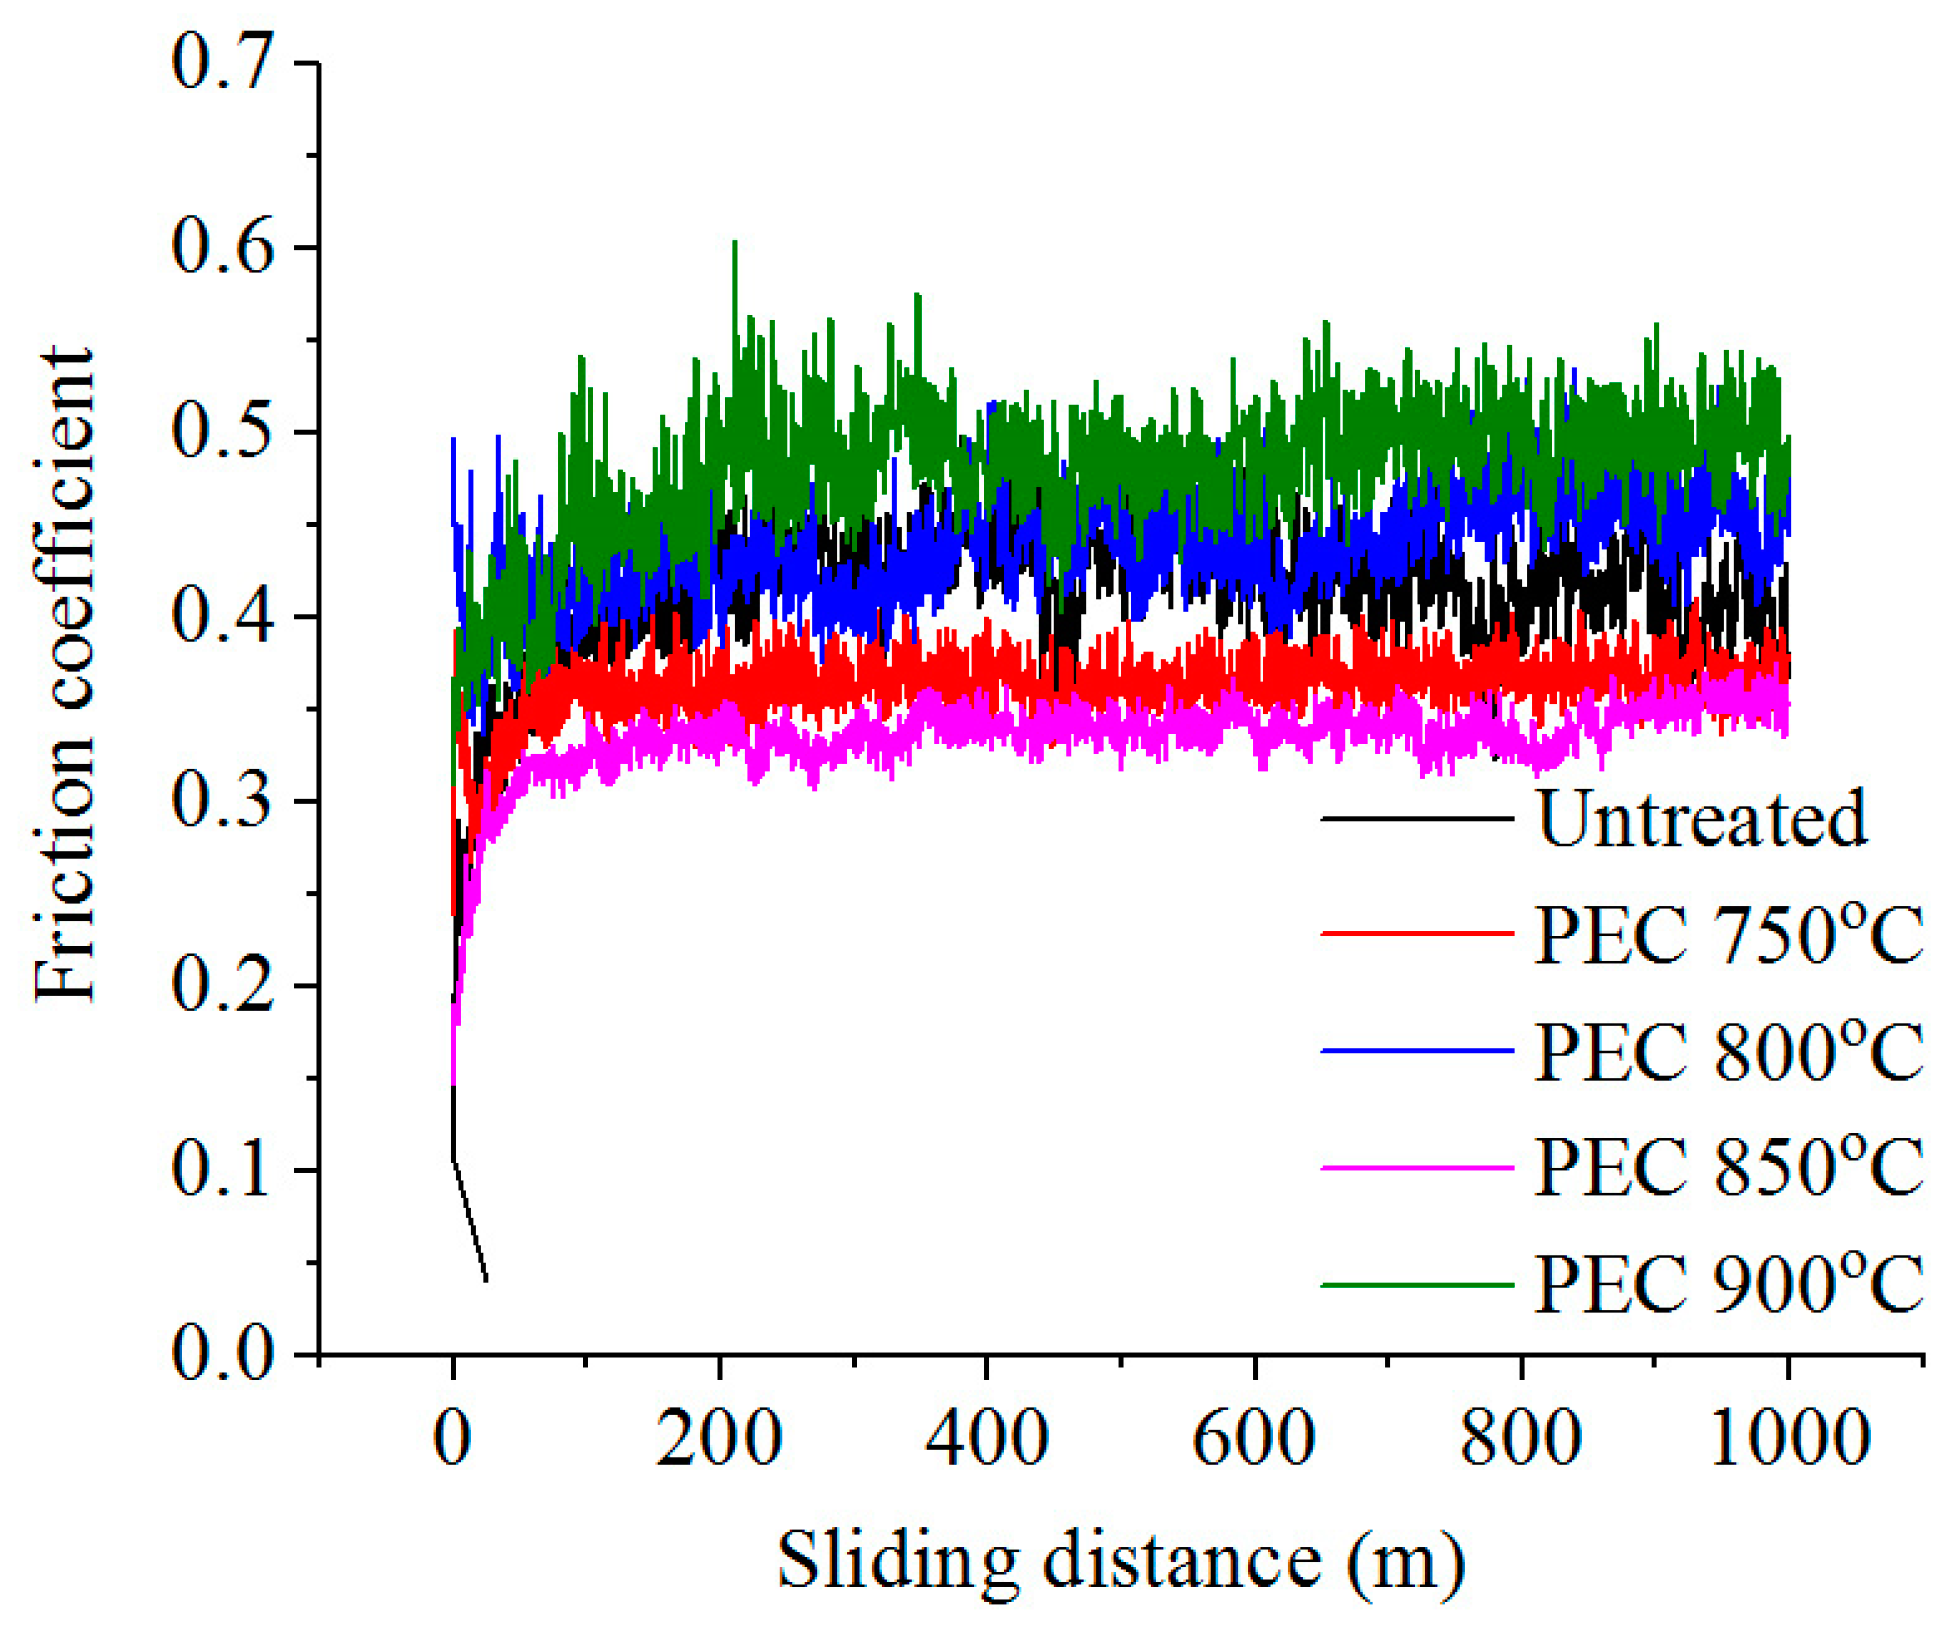
The minimum weight wear after PEC is achieved by processing at 900 °C. It is influenced by two factors, including the maximum hardness (Figure 14) and a large number of oxides (Figure 5c), among which Fe3O4—a highly effective lubricant—appears, according to X-ray analysis (Figure 11) [45].
All samples after PEN, PEB and PEC show a correlation of the friction coefficient with the Kragelsky–Kombalov criterion, which is a generalized dimensionless criterion for surface roughness. With a predominance of plastic deformations in the tribo-conjugation, the molecular component of the external friction coefficient does not depend on the microgeometry of the surface. In addition, the deformation component of the friction coefficient increases with an increase in complex Δ. The friction cumulative coefficient also increases with an increase in Kragelsky–Kombalov criterion. In all plasma electrolytic treatment sessions, the maximum Kragelsky-Kombalov criterion on the friction track correlates with the highest friction coefficient of this sample.
The Kragelsky–Kombalov criterion determines the bearing capacity of the roughness profile. The smaller Δ is, the higher the bearing capacity of the roughness profile. Table 4, Table 5 and Table 6 show that the loss in weight during friction is smaller in samples with lower values of the Kragelsky–Kombalov criterion. The maximum value Δ on the friction track of an untreated sample (0.989) corresponds to weight loss during friction of 23.2 ± 0.3 g.
PEN at all temperatures reduces Δ 2.4 to 2.6 times, and the weight loss due to friction at 1 km falls 46–58 times. PEB at 850 and 900 °C shows a 2.3–2.4 times lower value of Δ, and weight decreases 12.9 and 7.0 times, respectively. At 800 and 950 °C, values of Δ increase; in addition, a pronounced porosity of the oxide surface, leading to a strong increase in weight losses, becomes of great importance. After PEC, the friction on the track is less than double compared to an untreated sample, and such a roughness profile provides weight losses per 1 km of friction 232 times as small as in an untreated sample.
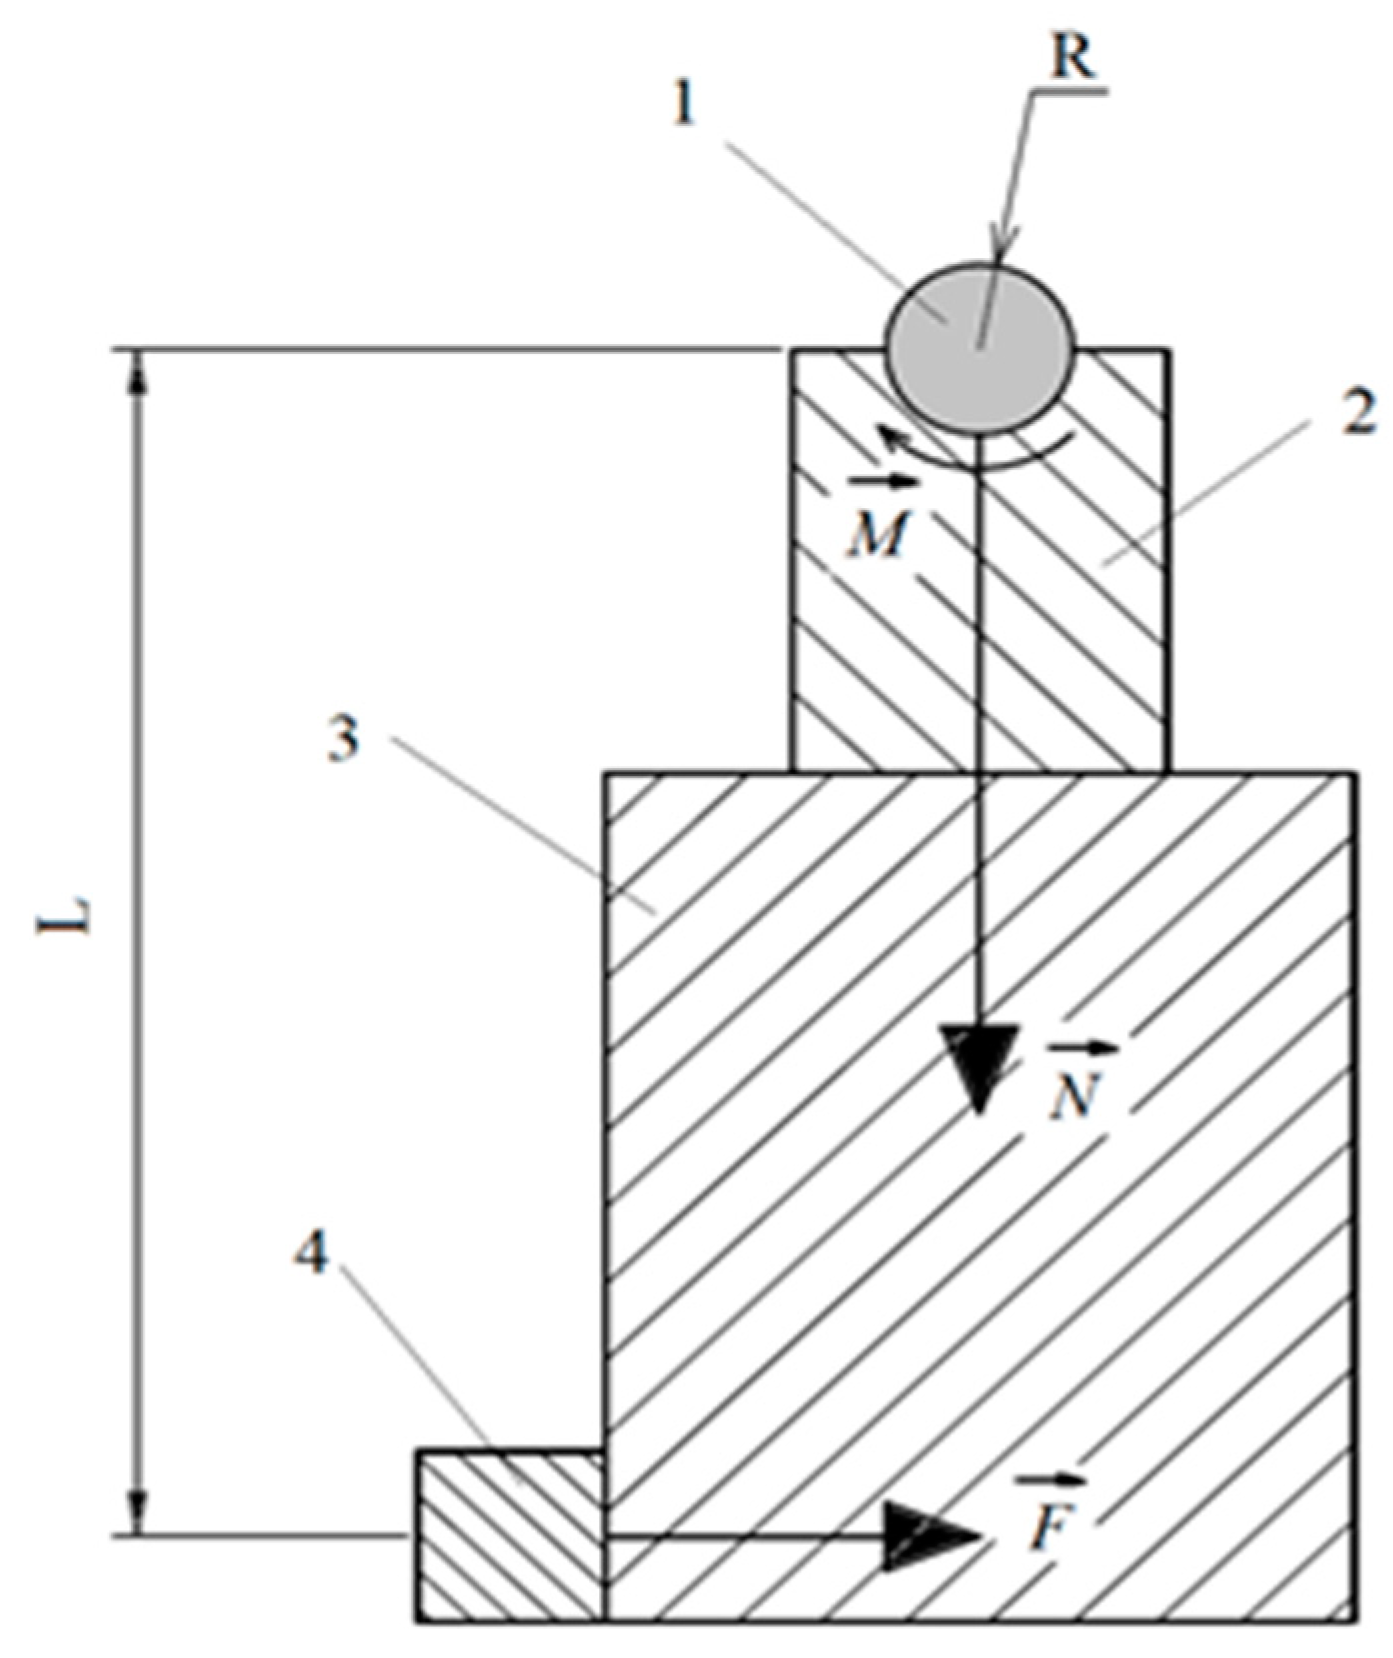
The relief of a rough surface also influences the friction coefficient via the distribution of material along the height of a single protrusion, that is, the shape and size of the protrusion. With a decrease in the radii of the curvature of the vertices of the microfoils, their deeper penetration into the volume of the material occurs in absolute magnitude, and the friction coefficient (the deformation part) increases, which is confirmed by Table 4, Table 5 and Table 6.
Friction bonds in the process of friction after treatment are broken as a result of the plastic displacement of the counter body material, as indicated by the value of the relative insertion h/r < 0.1 in all cases. The type of wear can be characterized as fatigue wear with boundary friction and plastic contact for samples after all the described types of processing.
The assumption about the type of wear and the nature of the destruction of friction bonds is confirmed by the values of the Greenwood–Williamson complex parameter, which are greater than 3 for all the described types of processing (Table 4, Table 5 and Table 6).
The actual contact area differs significantly from the nominal (geometric contact area of counterbody with the sample). The actual contact area has a minimum value of 1% (PEN at 800 °C, Table 1) of the nominal value and a maximum of 20% (PEB at 800 °C, Table 5) for treated samples versus 24% for untreated.
In all cases of processing, an unsaturated plastic contact is realized during the friction process. With this type of contact, the deformation of micro-dimensions does not influence the load increase and the number of protrusions increases with the load increase. As can be seen from Table 4, Table 5 and Table 6, the number of protrusions that come into contact in the tribo-connection is always smaller than the number of protrusions on the contour area.
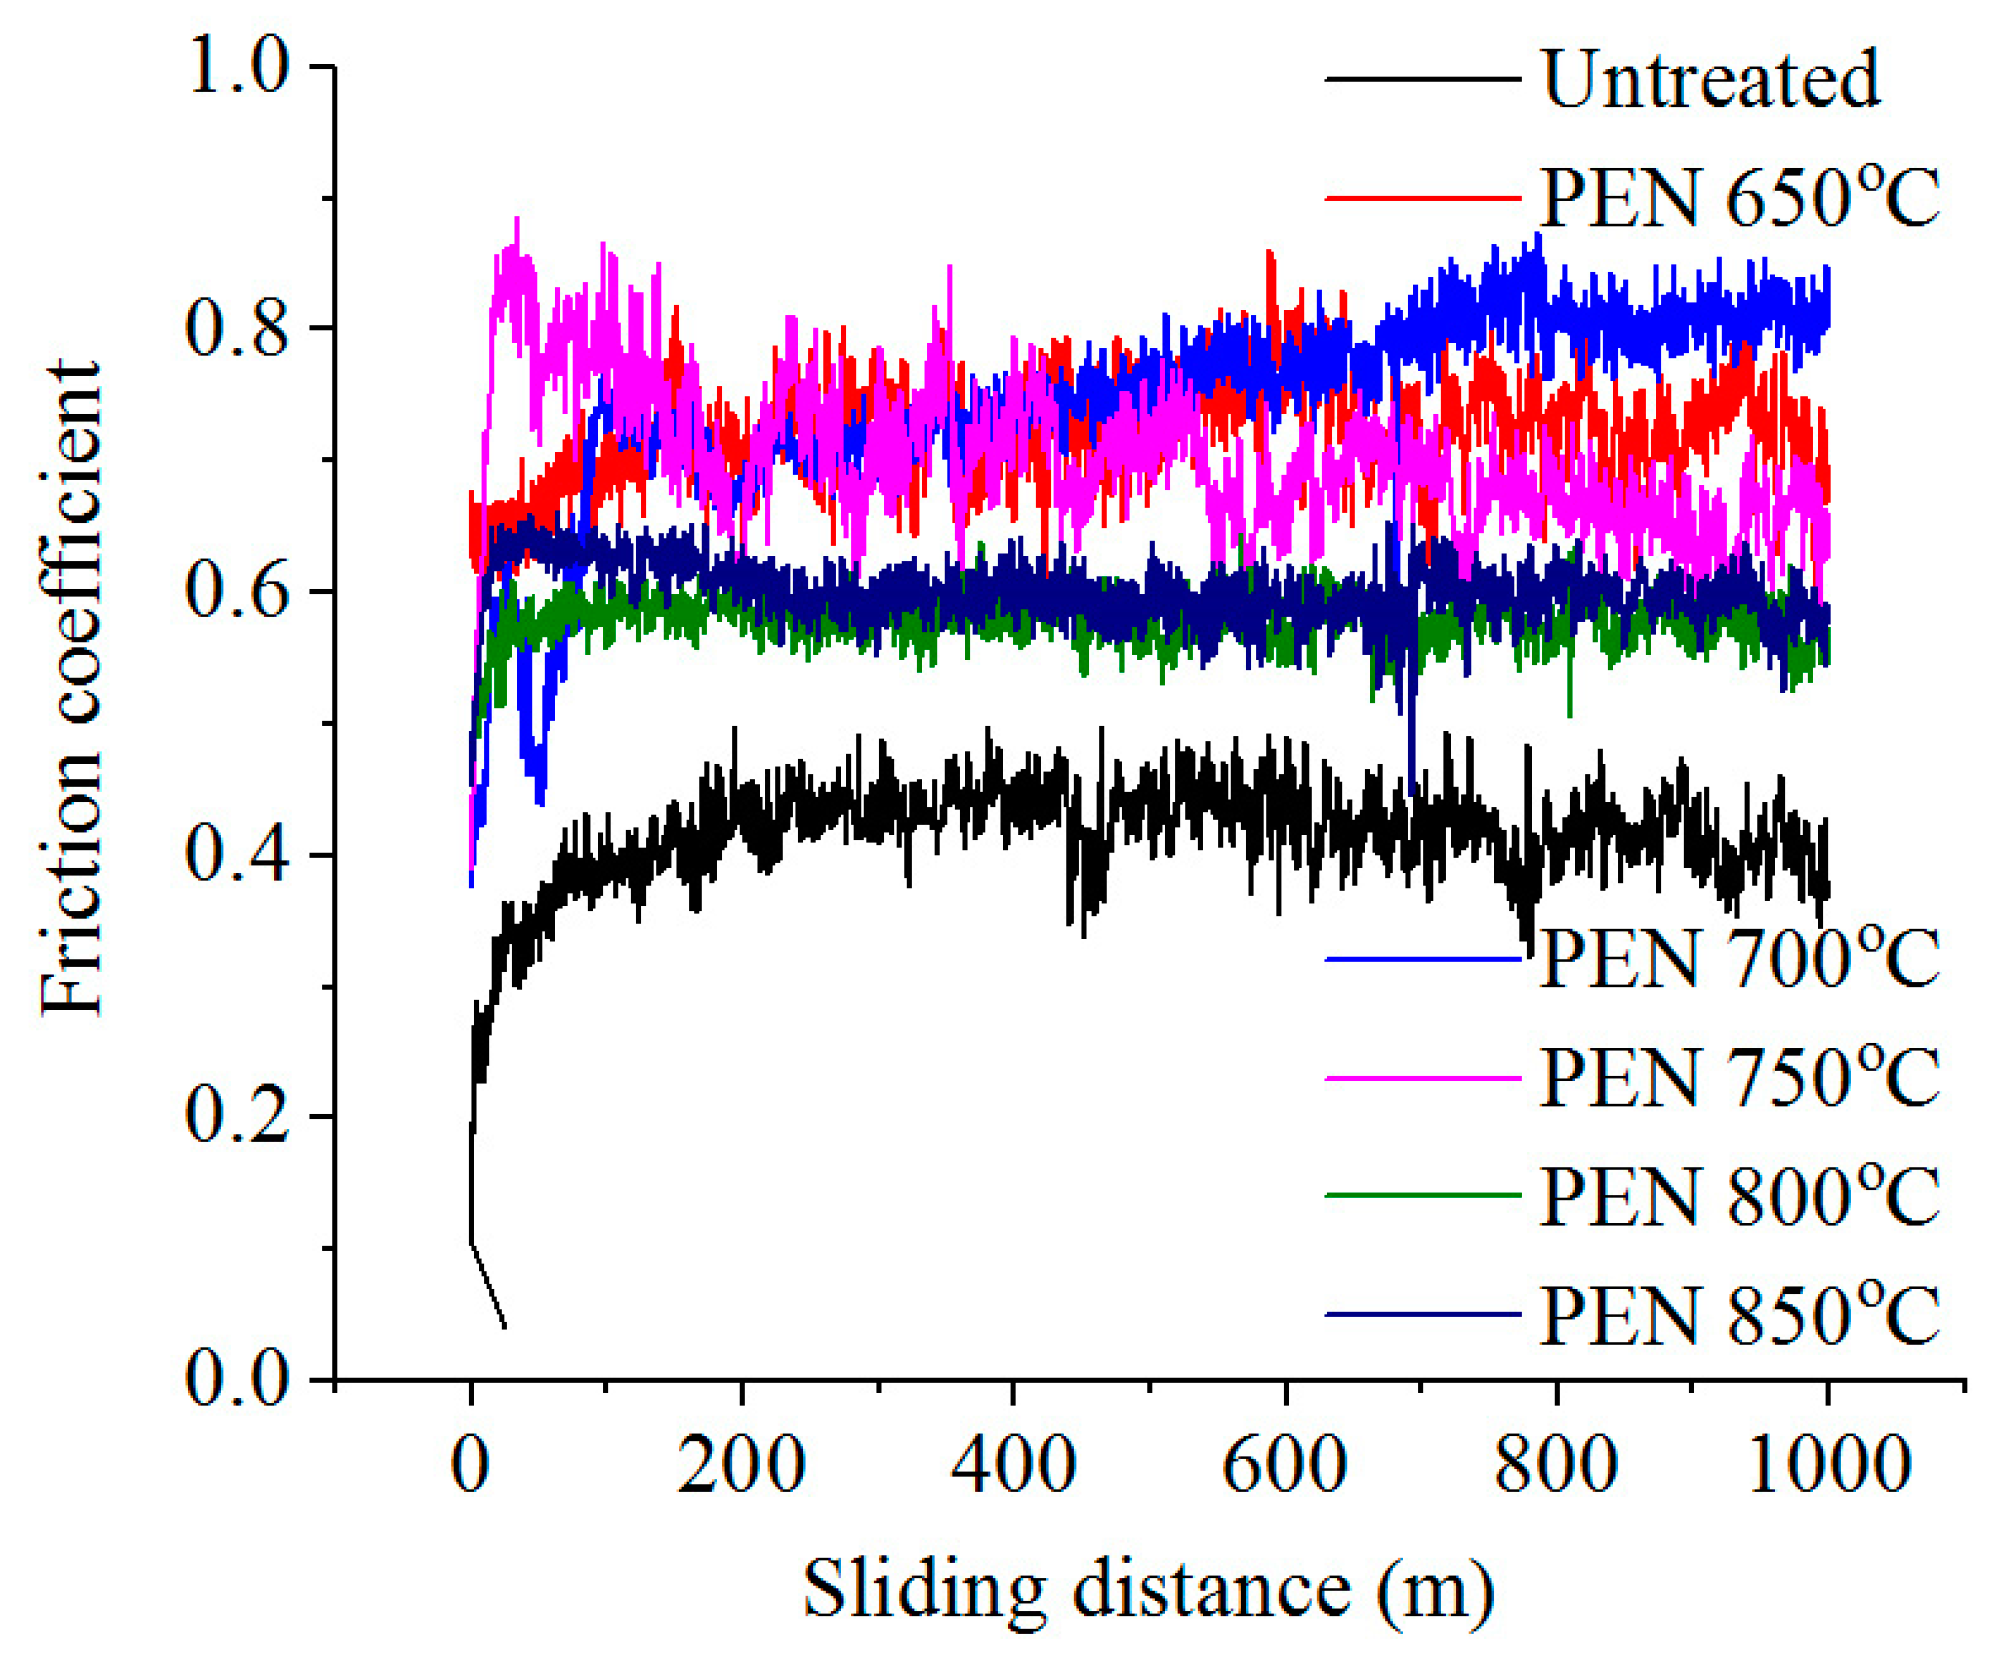
The highest values of the friction coefficients after plasma electrolytic treatment are demonstrated by samples with PEN. Moreover, the values of their friction coefficients after all nitriding temperatures are greater than those of the untreated sample, but the weight wear is two orders smaller than that of the untreated one. Equation (16) serves to explain this fact. The actual contact area Ar of samples with PEN is the smallest of all experimental series of samples and varies from 1 to 8% of the nominal depending on the PEN temperature (Table 4). For comparison, the actual contact area of samples after PEB is 19–20% of the nominal (Table 5) samples with that of PEC being 9–13% of the nominal (Table 6) samples at different temperatures. A strong decrease in the actual contact area of PEN samples at values of absolute penetration h, which is comparable to that of other series, leads to low values of friction losses of weight per 1 km at fairly high values of the coefficient of friction.
Thus, the study showed a number of fundamental differences between the results of anodic plasma electrolytic saturation with light elements of austenitic stainless steel from the cathodic treatment option. In particular, with smaller prolonged saturation, as with the anodic treatment, there is no accumulation of high concentrations of diffusant atoms in the surface layer or a formation of inclusion compounds with a high content of nitrogen and carbon, such as Fe2-3N during the cathodic nitriding of steel; 12Cr18Ni10Ti [6], Fe2N, Fe4N, CrN and Cr2N during the cathodic nitriding of 316L steel [9]; and (Cr,Fe)7C3 and CrN during the cathodic cementation of 304 steel [15]. Nevertheless, after anodic PEC, the microhardness value of the diffusion layers (700 HV) exceeds that obtained by cathodic carburizing (513 HV [17]), and the results of the tribological tests showed an improvement in the wear resistance index by two orders of magnitude, significantly exceeding the results on the friction of nitrided 316L steel by the cathodic method [8]. The analysis of friction track microtopology showed the correlation of the Kragelsky–Kombalov criterion and the friction coefficient. All this testifies to the complex influence of the hardness of the reinforced layer and the composition and morphology of the surface. Thus, the effectiveness of the use of anodic plasma electrolytic treatment to increase the hardness and wear resistance of austenitic stainless steel is shown.

5. Conclusions

(a) The paper shows the possibility of increasing the hardness and wear resistance of an austenitic stainless steel surface using anodic plasma electrolytic treatment. The positive effect of anodic dissolution on the reduction in surface roughness, as well as the complex effect of high-temperature oxidation and anodic dissolution on the morphology of the surface, has been confirmed. The structural features and phase composition of the modified surfaces are revealed, which determine the hardness of the surface layers and, together with the morphology of the surface, the tribological properties of the processed products.
(b) The hardness of the nitrided layers increases to 1450 HV with a thickness of up to 20–25 μm due to the formation of iron nitrides and iron-chromium carbides with a decrease in roughness of 3.7 times after PEN. This leads to an increase in wear resistance by two orders of magnitude.
(c) The PEC of the steel surface leads to an increase in hardness up to 800 HV and a thickness of the hardened layer up to 80 μm due to the formation of chromium carbides and a solid solution of carbon. The roughness and wear resistance of the treated surface change by approximately the same values as after PEN.
(d) It was revealed that when PEB is conducted on austenitic stainless steel, there is no hardening of the surface, but, at the same time, there is a decrease in roughness and an increase in the wear resistance of the surface.
(e) The frictional bonds in the friction process of each type of treatment are broken because of the plastic displacement of the counterbody material. The type of wear can be characterized as fatigue wear with boundary friction and plastic contact. The correlation of the friction coefficient and the Kragelsky–Kombalov criterion, a generalized dimensionless criterion of surface roughness, is shown.

Author Contributions

Conceptualization, S.K. and A.N.; methodology, T.M. and I.T.; validation, S.K., I.T. and T.M.; formal analysis, A.N.; investigation, T.M., I.T., R.B., E.S. and I.K.; resources, S.K.; writing—original draft preparation, S.K.; writing—review and editing, A.N. and I.K.; visualization, T.M. and I.T.; supervision, S.K.; project administration, S.K.; funding acquisition, S.K. All authors have read and agreed to the published version of the manuscript.

Funding

This research was funded by the Russian Science Foundation, grant number 18-79-10094.

Institutional Review Board Statement

Not applicable.

Informed Consent Statement

Not applicable.

Data Availability Statement

Not applicable.

Conflicts of Interest

The authors declare no conflict of interest.

References

  1. Yin, F.; Hu, S.; Xu, R.; Han, X.; Qian, D.; Wei, W.; Hua, L.; Zhao, K. Strain rate sensitivity of the ultrastrong gradient nanocrystalline 316L stainless steel and its rate-dependent modeling at nanoscale. Int. J. Plast. 2020, 129, 102696. [Google Scholar] [CrossRef]
  2. Li, P.; Hu, S.; Liu, Y.; Hua, L.; Yin, F. Surface Nanocrystallization and Numerical Modeling of 316L Stainless Steel during Ultrasonic Shot Peening Process. Metals 2022, 12, 1673. [Google Scholar] [CrossRef]
  3. Chen, Y.; Deng, S.; Zhu, C.; Hu, K.; Yin, F. The effect of ultrasonic shot peening on the fatigue life of alloy materials: A review. Int. J. Comput. Mater. Sci. Surf. Eng. 2021, 10, 209–234. [Google Scholar] [CrossRef]
  4. Liu, S.; Kim, Y.; Jung, J.; Bae, S.; Jeong, S.; Shin, K. Effect of Ultrasonic Shot Peening and Laser Shock Peening on the Microstructure and Microhardness of IN738LC Alloys. Materials 2023, 16, 1802. [Google Scholar] [CrossRef] [PubMed]
  5. Shi, X.; Feng, X.; Teng, J.; Zhang, K.; Zhou, L. Effect of laser shock peening on microstructure and fatigue properties of thin-wall welded Ti-6A1-4V alloy. Vacuum 2021, 184, 109986. [Google Scholar] [CrossRef]
  6. Wang, P.; Cao, Q.; Liu, S.; Peng, Q. Surface strengthening of stainless steels by nondestructive laser peening. Mater. Des. 2021, 205, 109754. [Google Scholar] [CrossRef]
  7. Mora-Sanchez, H.; Pixner, F.; Buzolin, R.; Mohedano, M.; Arrabal, R.; Warchomicka, F.; Matykina, E. Combination of Electron Beam Surface Structuring and Plasma Electrolytic Oxidation for Advanced Surface Modification of Ti6Al4V Alloy. Coatings 2022, 12, 1573. [Google Scholar] [CrossRef]
  8. Perez, H.; Vargas, G.; Magdaleno, C.; Silva, R. Article: Oxy-Nitriding AISI 304 Stainless Steel by Plasma Electrolytic Surface Saturation to Increase Wear Resistance. Metals 2023, 13, 309. [Google Scholar] [CrossRef]
  9. Marcuz, N.; Ribeiro, R.P.; Rangel, E.C.; Cristino da Cruz, N.; Correa, D.R.N. The Effect of PEO Treatment in a Ta-Rich Electrolyte on the Surface and Corrosion Properties of Low-Carbon Steel for Potential Use as a Biomedical Material. Metals 2023, 13, 520. [Google Scholar] [CrossRef]
  10. Kumruoglu, L.C.; Ozel, A. Plasma electrolytic saturation of 316L stainless steel in an aqueous electrolyte containing urea and ammonium nitrate. Mater. Technol. 2013, 47, 307–310. [Google Scholar]
  11. Roy, A.; Tewari, R.K.; Sharma, R.C.; Sherhar, R. Feasibility study of aqueous electrolyte plasma nitriding. Surf. Eng. 2007, 23, 243–246. [Google Scholar] [CrossRef]
  12. Aliev, M.K.; Sabour, A.; Taheri, P. Study of corrosion protection of different stainless steels by nanocrystalline plasma electrolysis. Prot. Met. Phys. Chem. Surf. 2008, 44, 402–407. [Google Scholar] [CrossRef]
  13. Skakov, M.; Kurbanbekov, S.; Scheffler, M. Influence of Regimes Electrolytic Plasma Cementation on the Mechanical Properties of Steel 12Cr18Ni10Ti. Key Eng. Mater. 2013, 531–532, 173–177. [Google Scholar] [CrossRef]
  14. Aliofkhazraei, M.; Sabour Rouhaghdam, A. Relationship Study among Nanocrystallite Distribution and Roughness of a Nanostructured Hard Layer. Defect Diffus. Forum 2009, 293, 83–90. [Google Scholar] [CrossRef]
  15. Andrei, A.; Lungu, C.; Oncioiu, G.; Diaconu, C. Plasma processing for improvements of structural materials properties. In Proceedings of the 35th EPS Conference on Plasma Physics, Hersonissos, Greece, 9–13 June 2008. [Google Scholar]
  16. Andrei, V.; Vlaicu, G.; Fulger, M.; Ducu, C.; Diaconu, C.; Oncioiu, G.; Andrei, E.; Bahrim, M.; Gheboianu, A. Chemical and structural modifications induced in structural materials by electrolchemical process. Roman. Report. Phys. 2009, 61, 95–104. [Google Scholar]
  17. Hao, J.; Liu, B.; Chen, H. Research on liquid plasma surface strengthening of stainless steel. Hot Work. Technol. 2007, 12, 58–59. Available online: http://en.cnki.com.cn/KCMS/detail/detail.aspx?dbcode=CJFD&dbname=CJFD2007&filename=SJGY200712019&uniplatform=OVERSEA&v=UmKJpFeqc4eDOKZqgJD0JOIw42o5SJBWWBr09sbbr-MvLaU0wx3gItmBOAIoBDNU (accessed on 15 January 2023).
  18. Xue, W.; Jin, Q.; Zhu, Q.; Wu, X. Characterization of Plasma Electrolytic Carburized Stainless Steel in Glycerin Aqueous Solution. J. Aeronaut. Mater. 2010, 30, 38–42. [Google Scholar] [CrossRef]
  19. Yerokhin, A.L.; Leyland, A.; Tsotsos, C.; Wilson, A.D.; Nie, X.; Matthews, A. Duplex surface treatments combining plasma electrolytic nitrocarburising and plasma-immersion ion-assisted deposition. Surf. Coat. Technol. 2001, 142–144, 1129–1136. [Google Scholar] [CrossRef]
  20. Taheri, P.; Dehghanian, C. A phenomenological model of nanocrystalline coating production using plasma electrolytic saturation (PES) technique. Sci. Iran. 2009, 16, 87–91. [Google Scholar]
  21. Kazerooniy, N.A.; Bahrololoom, M.E.; Shariat, M.H.; Mahzoon, F.; Jozaghi, T. Effect of Ringer’s solution on wear and friction of stainless steel 316L after plasma electrolytic nitrocarburising at low voltages. J. Mater. Sci. Technol. 2011, 27, 906–912. [Google Scholar] [CrossRef]
  22. Nie, X.; Tsotsos, C.; Wilson, A.; Yerokhin, A.L.; Leyland, A.; Matthews, A. Characteristics of a plasma electrolytic nitrocarburising treatment for stainless steels. Surf. Coat. Technol. 2001, 139, 135–142. [Google Scholar] [CrossRef]
  23. Taheri, P.; Dehghanian, C. Wear and corrosion properties of nanocrystalline coatings on stainless steel produced by plasma electrolytic nitrocarburising. Int. J. Mat. Res. 2008, 99, 92–100. [Google Scholar] [CrossRef]
  24. Belkin, P.N.; Kusmanov, S.A.; Zhirov, A.V.; Belkin, V.S.; Parfenyuk, V.I. Anode Plasma Electrolytic Saturation of Titanium Alloys with Nitrogen and Oxygen. J. Mat. Sci. Tech. 2016, 32, 1027–1032. [Google Scholar] [CrossRef]
  25. Kusmanov, S.A.; Dyakov, I.G.; Belkin, P.N.; Gracheva, I.A.; Belkin, V.S. Plasma electrolytic modification of the VT1-0 titanium alloy surface. J. Surf. Investig. X-ray Synchrotron Neutron Tech. 2015, 9, 98–104. [Google Scholar] [CrossRef]
  26. Belkin, P.N.; Borisov, A.M.; Kusmanov, S.A. Plasma Electrolytic Saturation of Titanium and Its Alloys with Light Elements. J. Surf. Investig. X-ray Synchrotron Neutron Tech. 2016, 10, 516–535. [Google Scholar] [CrossRef]
  27. Belkin, P.N.; Kusmanov, S.A. Plasma electrolytic nitriding of steels. J. Surf. Investig. X-ray Synchrotron Neutron Tech. 2017, 11, 767–789. [Google Scholar] [CrossRef]
  28. Kusmanov, S.; Tambovskiy, I.; Silkin, S.; Nikiforov, R.; Belov, R. Increasing the Hardness and Corrosion Resistance of the Surface of CP-Ti by Plasma Electrolytic Nitrocarburising and Polishing. Materials 2023, 16, 1102. [Google Scholar] [CrossRef]
  29. Shelekhov, E.V.; Sviridova, T.A. Programs for X-ray analysis of polycrystals. Metal Sci. Heat Treat. 2000, 42, 309–313 . [Google Scholar] [CrossRef]
  30. Grazulis, S.; Chateigner, D.; Downs, R.T.; Yokochi, A.T.; Le Bail, A. Crystallography open database—An open-access collection of crystal structures. J. Appl. Cryst. 2009, 42, 726–729. [Google Scholar] [CrossRef]
  31. Tambovskiy, I.; Mukhacheva, T.; Gorokhov, I.; Suminov, I.; Silkin, S.; Dyakov, I.; Kusmanov, S.; Grigoriev, S. Features of Cathodic Plasma Electrolytic Nitrocarburizing of Low-Carbon Steel in an Aqueous Electrolyte of Ammonium Nitrate and Glycerin. Metals 2022, 12, 1773. [Google Scholar] [CrossRef]
  32. Mukhacheva, T.; Kusmanov, S.; Suminov, I.; Podrabinnik, P.; Khmyrov, R.; Grigoriev, S. Increasing Wear Resistance of Low-Carbon Steel by Anodic Plasma Electrolytic Sulfiding. Metals 2022, 12, 1641. [Google Scholar] [CrossRef]
  33. Mukhacheva, T.L.; Belkin, P.N.; Dyakov, I.G.; Kusmanov, S.A. Wear mechanism of medium carbon steel after its plasma electrolytic nitrocarburising. Wear 2020, 462–463, 203516. [Google Scholar] [CrossRef]
  34. Demkin, N.B.; Izmailov, V.V. Surface topography and properties frictional contacts. Trib. Int. 1991, 24, 21–24. [Google Scholar] [CrossRef]
  35. Kragelsky, I.V.; Dobychin, M.N.; Kombalov, V.S. Friction and Wear Calculation Methods; Pergamon Press Ltd.: Oxford, UK, 1982; Available online: https://books.google.ru/books?id=QLcgBQAAQBAJ&hl=ru (accessed on 24 February 2023).
  36. Belkin, P.N.; Kusmanov, S.A. Plasma Electrolytic Carburising of Metals and Alloys. Surf. Eng. Appl. Electrochem. 2021, 57, 19–50. [Google Scholar] [CrossRef]
  37. Shadrin, S.Y.; Belkin, P.N.; Tambovskiy, I.V.; Kusmanov, S.A. Physical Features of Anodic Plasma Electrolytic Carburising of Low-Carbon Steels. Plasma Chem. Plasma Process. 2020, 40, 549–570. [Google Scholar] [CrossRef]
  38. Kusmanov, S.A.; Silkin, S.A.; Smirnov, A.A.; Belkin, P.N. Possibilities of increasing wear resistance of steel surface by plasma electrolytic treatment. Wear 2017, 386–387, 239–246. [Google Scholar] [CrossRef]
  39. Kusmanov, S.A.; Dyakov, I.G.; Kusmanova, Y.V.; Belkin, P.N. Surface Modification of Low-Carbon Steels by Plasma Electrolytic Nitrocarburising. Plasma Chem. Plasma Process. 2016, 36, 1271–1286. [Google Scholar] [CrossRef]
  40. Kusmanov, S.A.; Kusmanova, Y.V.; Naumov, A.R.; Belkin, P.N. Formation of diffusion layers by anode plasma electrolytic nitrocarburising of low carbon steel. J. Mater. Eng. Perform. 2015, 24, 3187–3193. [Google Scholar] [CrossRef]
  41. Kusmanov, S.A.; Smirnov, A.A.; Silkin, S.A.; Belkin, P.N. Increasing wear and corrosion resistance of low-alloy steel by anode plasma electrolytic nitriding. Surf. Coat. Technol. 2016, 307, 1350–1356. [Google Scholar] [CrossRef]
  42. Kusmanov, S.A.; Tambovskiy, I.V.; Sevostyanova, V.S.; Savushkina, S.V.; Belkin, P.N. Anode plasma electrolytic boriding of medium carbon steel. Surf. Coat. Technol. 2016, 291, 334–341. [Google Scholar] [CrossRef]
  43. Belkin, P.N.; Kusmanov, S.A. Plasma Electrolytic Boriding of Steels and Titanium Alloys. Surf. Eng. Appl. Electrochem. 2019, 55, 1–30. [Google Scholar] [CrossRef]
  44. Kusmanov, S.A.; Kusmanova, Y.V.; Smirnov, A.A.; Belkin, P.N. Modification of steel surface by plasma electrolytic saturation with nitrogen and carbon. Mater. Chem. Phys. 2016, 175, 164–171. [Google Scholar] [CrossRef]
  45. Song, X.; Qiu, Z.; Yang, X.; Gong, H.; Zheng, S.; Cao, B.; Wang, H.; Möhwald, H.; Shchukin, D. Submicron-Lubricant Based on Crystallized Fe3O4 Spheres for Enhanced Tribology Performance. Chem. Mater. 2014, 26, 5113–5119. [Google Scholar] [CrossRef]
Figure 1. Setup for anodic plasma electrolytic treatment and schematic diagram: 1—electrolyte; 2—cold water; 3—heat exchanger; 4—power supply; 5—treated sample; 6—electrolytic cell; 7—flowmeter; 8—pump.
Metals 13 00872 g001
Figure 2. Friction scheme. 1—sample; 2—counter body; 3—pendulum; 4—strain gauge. M—frictional moment; N—force acting on the counter body and the pendulum from the side of the sample; F—force acting on the pendulum from the strain gauge; L—distance from the axis of rotation to the axis of symmetry of the strain gauge, R – radius of the sample.
Metals 13 00872 g002
Figure 3. Morphology of the steel surface before (a) and after PEN at different treatment temperatures: (b) 650 °C; (c) 700 °C; (d) 750 °C; (e) 800 °C; (f) 850 °C.
Metals 13 00872 g003
Figure 4. Morphology of the steel surface before (a) and after PEB at different treatment temperatures: (b) 800 °C; (c) 850 °C; (d) 900 °C; (e) 950 °C.
Metals 13 00872 g004
Figure 5. Morphology of the steel surface before (a) and after PEC at different treatment temperatures: (b) 750 °C; (c) 800 °C; (d) 850 °C; (e) 900 °C.
Metals 13 00872 g005
Figure 6. Microstructure of cross-section of the steel surface after PEN at 850 °C. 1—oxide layer; 2—modified layer; 3—initial structure.
Metals 13 00872 g006
Figure 7. Microstructure of cross-section of the steel surface after PEB at 850 °C. 1—modified layer; 2—initial structure.
Metals 13 00872 g007
Figure 8. Microstructure of cross-section of the steel surface after PEC at 850 °C. 1—modified layer; 2—diffusion layer (N and C solid solution); 3—initial structure.
Metals 13 00872 g008
Figure 9. X-ray diffraction patterns of the steel surface layer after PEN at different treatment temperatures with the indication of ICDD card number.
Metals 13 00872 g009
Figure 10. X-ray diffraction patterns of the steel surface layer after PEB at different treatment temperatures with the indication of ICDD card number.
Metals 13 00872 g010
Figure 11. X-ray diffraction patterns of the steel surface layer after PEC at different treatment temperatures with the indication of ICDD card number.
Metals 13 00872 g011
Figure 12. Microhardness distribution in the surface layer after PEN at different treatment temperatures.
Metals 13 00872 g012
Figure 13. Microhardness distribution in the surface layer after PEB at different treatment temperatures.
Metals 13 00872 g013
Figure 14. Microhardness distribution in the surface layer after PEC at different treatment temperatures.
Metals 13 00872 g014
Figure 15. Dependence of friction coefficient on sliding distance of the untreated and PEN samples.
Metals 13 00872 g015
Figure 16. Dependence of friction coefficient on sliding distance of the untreated and PEB samples.
Metals 13 00872 g016
Figure 17. Dependence of friction coefficient on sliding distance of the untreated and PEC samples.
Metals 13 00872 g017
Table 1. Conditions of PEN and results of sample testing.
Temperature (°C)Voltage (V)Current (A)Weight Loss of Samples during PEN (mg)Surface Roughness Ra 1 (μm)
6501607.251.0 ± 0.30.24 ± 0.03
7001667.553.5 ± 0.40.28 ± 0.03
7501827.153.1 ± 0.10.22 ± 0.03
8001887.361.1 ± 0.30.20 ± 0.02
8501917.776.1 ± 0.20.21 ± 0.01
1 Untreated sample Ra is 0.75 ± 0.05 μm.
Table 2. Conditions of PEB and results of sample testing.
Temperature (°C)Voltage (V)Current (A)Weight Loss of Samples during PEB (mg)Surface Roughness Ra 1 (μm)
80014911.750.1 ± 0.30.33 ± 0.04
85015511.338.0 ± 0.20.38 ± 0.04
90017011.545.5 ± 0.20.49 ± 0.03
95019410.550.8 ± 0.30.62 ± 0.06
1 Untreated sample Ra is 0.75 ± 0.05 μm.
Table 3. Conditions of PEC and results of sample testing.
Temperature (°C)Voltage (V)Current (A)Weight Loss of Samples during PEC (mg)Surface Roughness Ra 1 (μm)
75013810.290.9 ± 0.50.33 ± 0.04
8001578.864.1 ± 0.40.17 ± 0.04
8501758.252.5 ± 0.30.23 ± 0.03
9001956.941.6 ± 0.20.24 ± 0.01
1 Untreated sample Ra is 0.75 ± 0.05 μm.
Table 4. Friction parameters and microgeometry of the worn surface after PEN. Kragelsky–Kombalov criterion Δ; magnitude of the absolute penetration in the tribocontact h; average radius of rounding r; relative penetration of the deformed surfaces of the tribocontact h/r; Greenwood-Williamson criterion Kp; actual contact area Ar; the ratio of the actual and normal contact area Ar/Aa (relative error under 3.5%); the ratio of the number of vertices on the contour area to the number of micronerities that entered tribocontact nc/nr; friction track temperature over the last 100 m of the path at friction Tfr per 1 km; average friction coefficient over the last 100 m of the path with friction μ per 1 km; weight loss during friction at 1 km of the path Δmfr.
T (°C)Δh (MCM)r (MCM)h/rKpAr (MCM2)Ar/Aanc/nrTfr (°C)μΔmfr (Mг)
untreated0.989 ± 0.0171.44 ± 0.0214.38 ± 0.240.100 ± 0.00222.5 ± 0.48.22 ± 0.140.24202 ± 5680.401 ± 0.00423.2 ± 0.3
6500.379 ± 0.0060.48 ± 0.016.09 ± 0.110.079 ± 0.00117.2 ± 0.42.07 ± 0.040.0671 ± 1790.698 ± 0.0080.4 ± 0.1
7000.408 ± 0.0070.46 ± 0.015.54 ± 0.090.083 ± 0.00121.3 ± 0.51.95 ± 0.030.0678 ± 2810.773 ± 0.0090.5 ± 0.1
7500.402 ± 0.0070.48 ± 0.015.98 ± 0.100.080 ± 0.00119.2 ± 0.42.62 ± 0.040.0870 ± 1860.615 ± 0.0070.4 ± 0.1
8000.398 ± 0.0070.47 ± 0.015.95 ± 0.110.079 ± 0.00118.8 ± 0.40.31 ± 0.010.0169 ± 1780.586 ± 0.0070.4 ± 0.1
8500.387 ± 0.0070.45 ± 0.016.03 ± 0.100.074 ± 0.00120.0 ± 0.52.87 ± 0.050.0873 ± 1810.606 ± 0.0070.4 ± 0.1
Table 5. Friction parameters and microgeometry of the worn surface after PEB. Kragelsky–Kombalov criterion, Δ; magnitude of the absolute penetration in the tribocontact, h; average radius of rounding, r; relative penetration of the deformed surfaces of the tribocontact, h/r; Greenwood–Williamson criterion, Kp; actual contact area, Ar; the ratio of the actual and normal contact area, Ar/Aa (relative error under 3.5%); the ratio of the number of vertices on the contour area to the number of micronerities that entered tribocontact, nc/nr; friction track temperature over the last 100 m of the path at friction, Tfr, per 1 km; average friction coefficient over the last 100 m of the path with friction, μ, per 1 km; weight loss during friction at 1 km of the path, Δmfr.
T (°C)Δh (MCM)r (MCM)h/rKpAr (MCM2)Ar/Aanc/nrTfr (°C)μΔmfr (Mг)
untreated0.989 ± 0.0171.44 ± 0.0214.38 ± 0.240.100 ± 0.00222.5 ± 0.48.22 ± 0.140.24202 ± 5680.401 ± 0.00423.2 ± 0.3
8000.451 ± 0.0080.45 ± 0.015.33 ± 0.090.084 ± 0.00122.6 ± 0.46.82 ± 0.120.20115 ± 3620.478 ± 0.00524.7 ± 0.2
8500.415 ± 0.0070.54 ± 0.016.73 ± 0.110.080 ± 0.00116.3 ± 0.36.51 ± 0.110.19112 ± 3740.388 ± 0.0043.3 ± 0.1
9000.430 ± 0.0070.52 ± 0.016.54 ± 0.110.079 ± 0.00117.2 ± 0.36.43 ± 0.110.19118 ± 3830.386 ± 0.0041.8 ± 0.1
9500.462 ± 0.0080.53 ± 0.015.98 ± 0.100.089 ± 0.00224.4 ± 0.46.72 ± 0.110.19120 ± 3760.564 ± 0.00626.2 ± 0.1
Table 6. Friction parameters and microgeometry of the worn surface after PEC. Kragelsky–Kombalov criterion, Δ; magnitude of the absolute penetration in the tribocontact, h; average radius of rounding, r; relative penetration of the deformed surfaces of the tribocontact, h/r; Greenwood–Williamson criterion, Kp; actual contact area, Ar; the ratio of the actual and normal contact area, Ar/Aa (relative error under 3.5%); the ratio of the number of vertices on the contour area to the number of micronerities that entered tribocontact, nc/nr; friction track temperature over the last 100 m of the path at friction, Tfr,per 1 km; average friction coefficient over the last 100 m of the path with friction, μ, per 1 km; weight loss during friction at 1 km of the path, Δmfr.
T (°C)Δh (MCM)r (MCM)h/rKpAr (MCM2)Ar/Aanc/nrTfr (°C)μΔmfr (Mг)
untreated0.989 ± 0.0171.44 ± 0.0214.38 ± 0.240.100 ± 0.00222.5 ± 0.48.22 ± 0.140.24202 ± 5680.401 ± 0.00423.2 ± 0.3
7500.362 ± 0.0060.43 ± 0.017.22 ± 0.120.059 ± 0.00116.8 ± 0.34.43 ± 0.080.1387 ± 2450.313 ± 0.0030.3 ± 0.1
8000.412 ± 0.0070.46 ± 0.016.54 ± 0.110.071 ± 0.00123.5 ± 0.43.76 ± 0.060.11120 ± 3510.452 ± 0.0050.5 ± 0.1
8500.387 ± 0.0070.42 ± 0.017.06 ± 0.120.061 ± 0.00117.3 ± 0.33.81 ± 0.060.1194 ± 2790.354 ± 0.0040.3 ± 0.1
9000.423 ± 0.0070.49 ± 0.016.32 ± 0.110.078 ± 0.00124.1 ± 0.43.27 ± 0.060.09125 ± 3760.497 ± 0.0050.1 ± 0.1
Disclaimer/Publisher’s Note: The statements, opinions and data contained in all publications are solely those of the individual author(s) and contributor(s) and not of MDPI and/or the editor(s). MDPI and/or the editor(s) disclaim responsibility for any injury to people or property resulting from any ideas, methods, instructions or products referred to in the content.

