

Effect of Coiling Temperature on Microstructure and Properties of Titanium Strengthened Weathering Building Steel
by
 ,
,
Zhengrong Li
1,*,
Zhenhu Lv
2,3,
Chuangwei Wang
1,4,
Lei Liu
2,3,
Kaiyu Cui
1 and
Zhengzhi Zhao
2,3,* 1
State Key Laboratory of Vanadium and Titanium Resources Comprehensive Utilization, Pangang Group Research Institute Co., Ltd., Panzhihua 617000, China
2
Collaborative Innovation Center of Steel Technology, University of Science and Technology Beijing, Beijing 100083, China
3
Beijing Engineering Technology Research Center of Special Steel for Traffic and Energy, University of Science and Technology Beijing, Beijing 100083, China
4
School of Materials Science and Engineering, Southwest Jiaotong University, Chengdu 610031, China
*
Authors to whom correspondence should be addressed.
Metals 2023, 13(4), 804; https://doi.org/10.3390/met13040804
Submission received: 23 February 2023
/
Revised: 2 April 2023
/
Accepted: 17 April 2023
/
Published: 19 April 2023
(This article belongs to the Special Issue Microstructure and Mechanical Property Relationships in Metallic Materials)
Abstract
:For weathering steel used in building, it is necessary not only to ensure weather resistance, but also to improve the strength and yield ratio. This study investigates the strengthening effect of Ti microalloying on the tested steel by conducting continuous cooling transformation tests of undercooled austenite and comparative tests of microstructure and performance at different coiling temperatures, with 0.07 wt.% Ti added to the weathering building test steel. The results show that, with an increase in cooling rate (0.1~50 °C/s), the room temperature microstructure of different cooling rates gradually transitions as follows: F + P, F + P + B, F + B and B + M; in addition, the hardness increases. Polygonal ferrite and pearlite were obtained by coiling at 650 °C; quasi-polygonal ferrite, acicular ferrite, pearlite and a small amount of bainite were obtained by coiling at 600 °C; and bainite was obtained by coiling at 550 °C. With a decrease in coiling temperature, the strength of the test steel increased, the yield ratio increased, the elongation after fracture decreased and the elongation at the yield point decreased. Compared with those observed at 650 °C, the nano precipitation phases observed in the sample at 600 °C were smaller in size, higher in number and higher in dislocation density. The combined action of second-phase precipitation strengthening and dislocation strengthening increased the strength and yield ratio of the test steel. This study will be helpful in guiding the improvement of strength grades for weathering steel used in building and industrial production.
1. Introduction
High-strength, low-alloy steels are widely used in modern architectural and engineering structures because of their good toughness and weldability [1]. The addition of certain amounts of Cu, Cr and Ni to their basic chemical composition can promote the formation of a dense FeOOH oxide film rust layer on the steel surface to obtain a certain degree of weather resistance [2,3]. In addition, the addition of trace amounts of strong, carbon-nitride forming elements Nb, V and Ti to steel supplemented with controlled rolling and cooling techniques can greatly improve the strength level of steel [4,5]. Similar effects exist in titanium and aluminum alloys, where control of the microstructure, phase selection and mechanical response is achieved by modulating microalloy elements and process parameters [6,7,8]. Compared with Nb and V, Ti is chemically active and prone to forming inclusions that are detrimental to performance, so Ti microalloying technology has not been widely developed and applied [9]. According to relevant references [10,11] and some experimental studies, the strengthening effect is not obvious when the Ti content is too low (less than 0.03 wt.%), and the plasticity is low when the Ti content is too high (more than 0.10 wt.%); therefore, in this study, 0.07 wt.% of Ti was added to the test steel designed, and the effect of the coiling temperature on the microstructure and properties of high-strength, weather-resistant building steel was investigated in combination with the controlled rolling and controlled cooling process. In combination with the study of the continuous cooling transformation law of the test steel under the condition of undercooled austenite, tests on the mechanical properties, microstructure characterization, transmission electron microscopy observation of dislocations and precipitation were carried out for the test steel. The relationship between the mechanical properties and microstructure of the test steel and its strength mechanism were investigated, which has a certain guiding significance for the industrial production of Ti-strengthened, high-strength, weather-resistant building steel.
2. Materials and Methods
The specific chemical composition of the test steel is shown in Table 1.
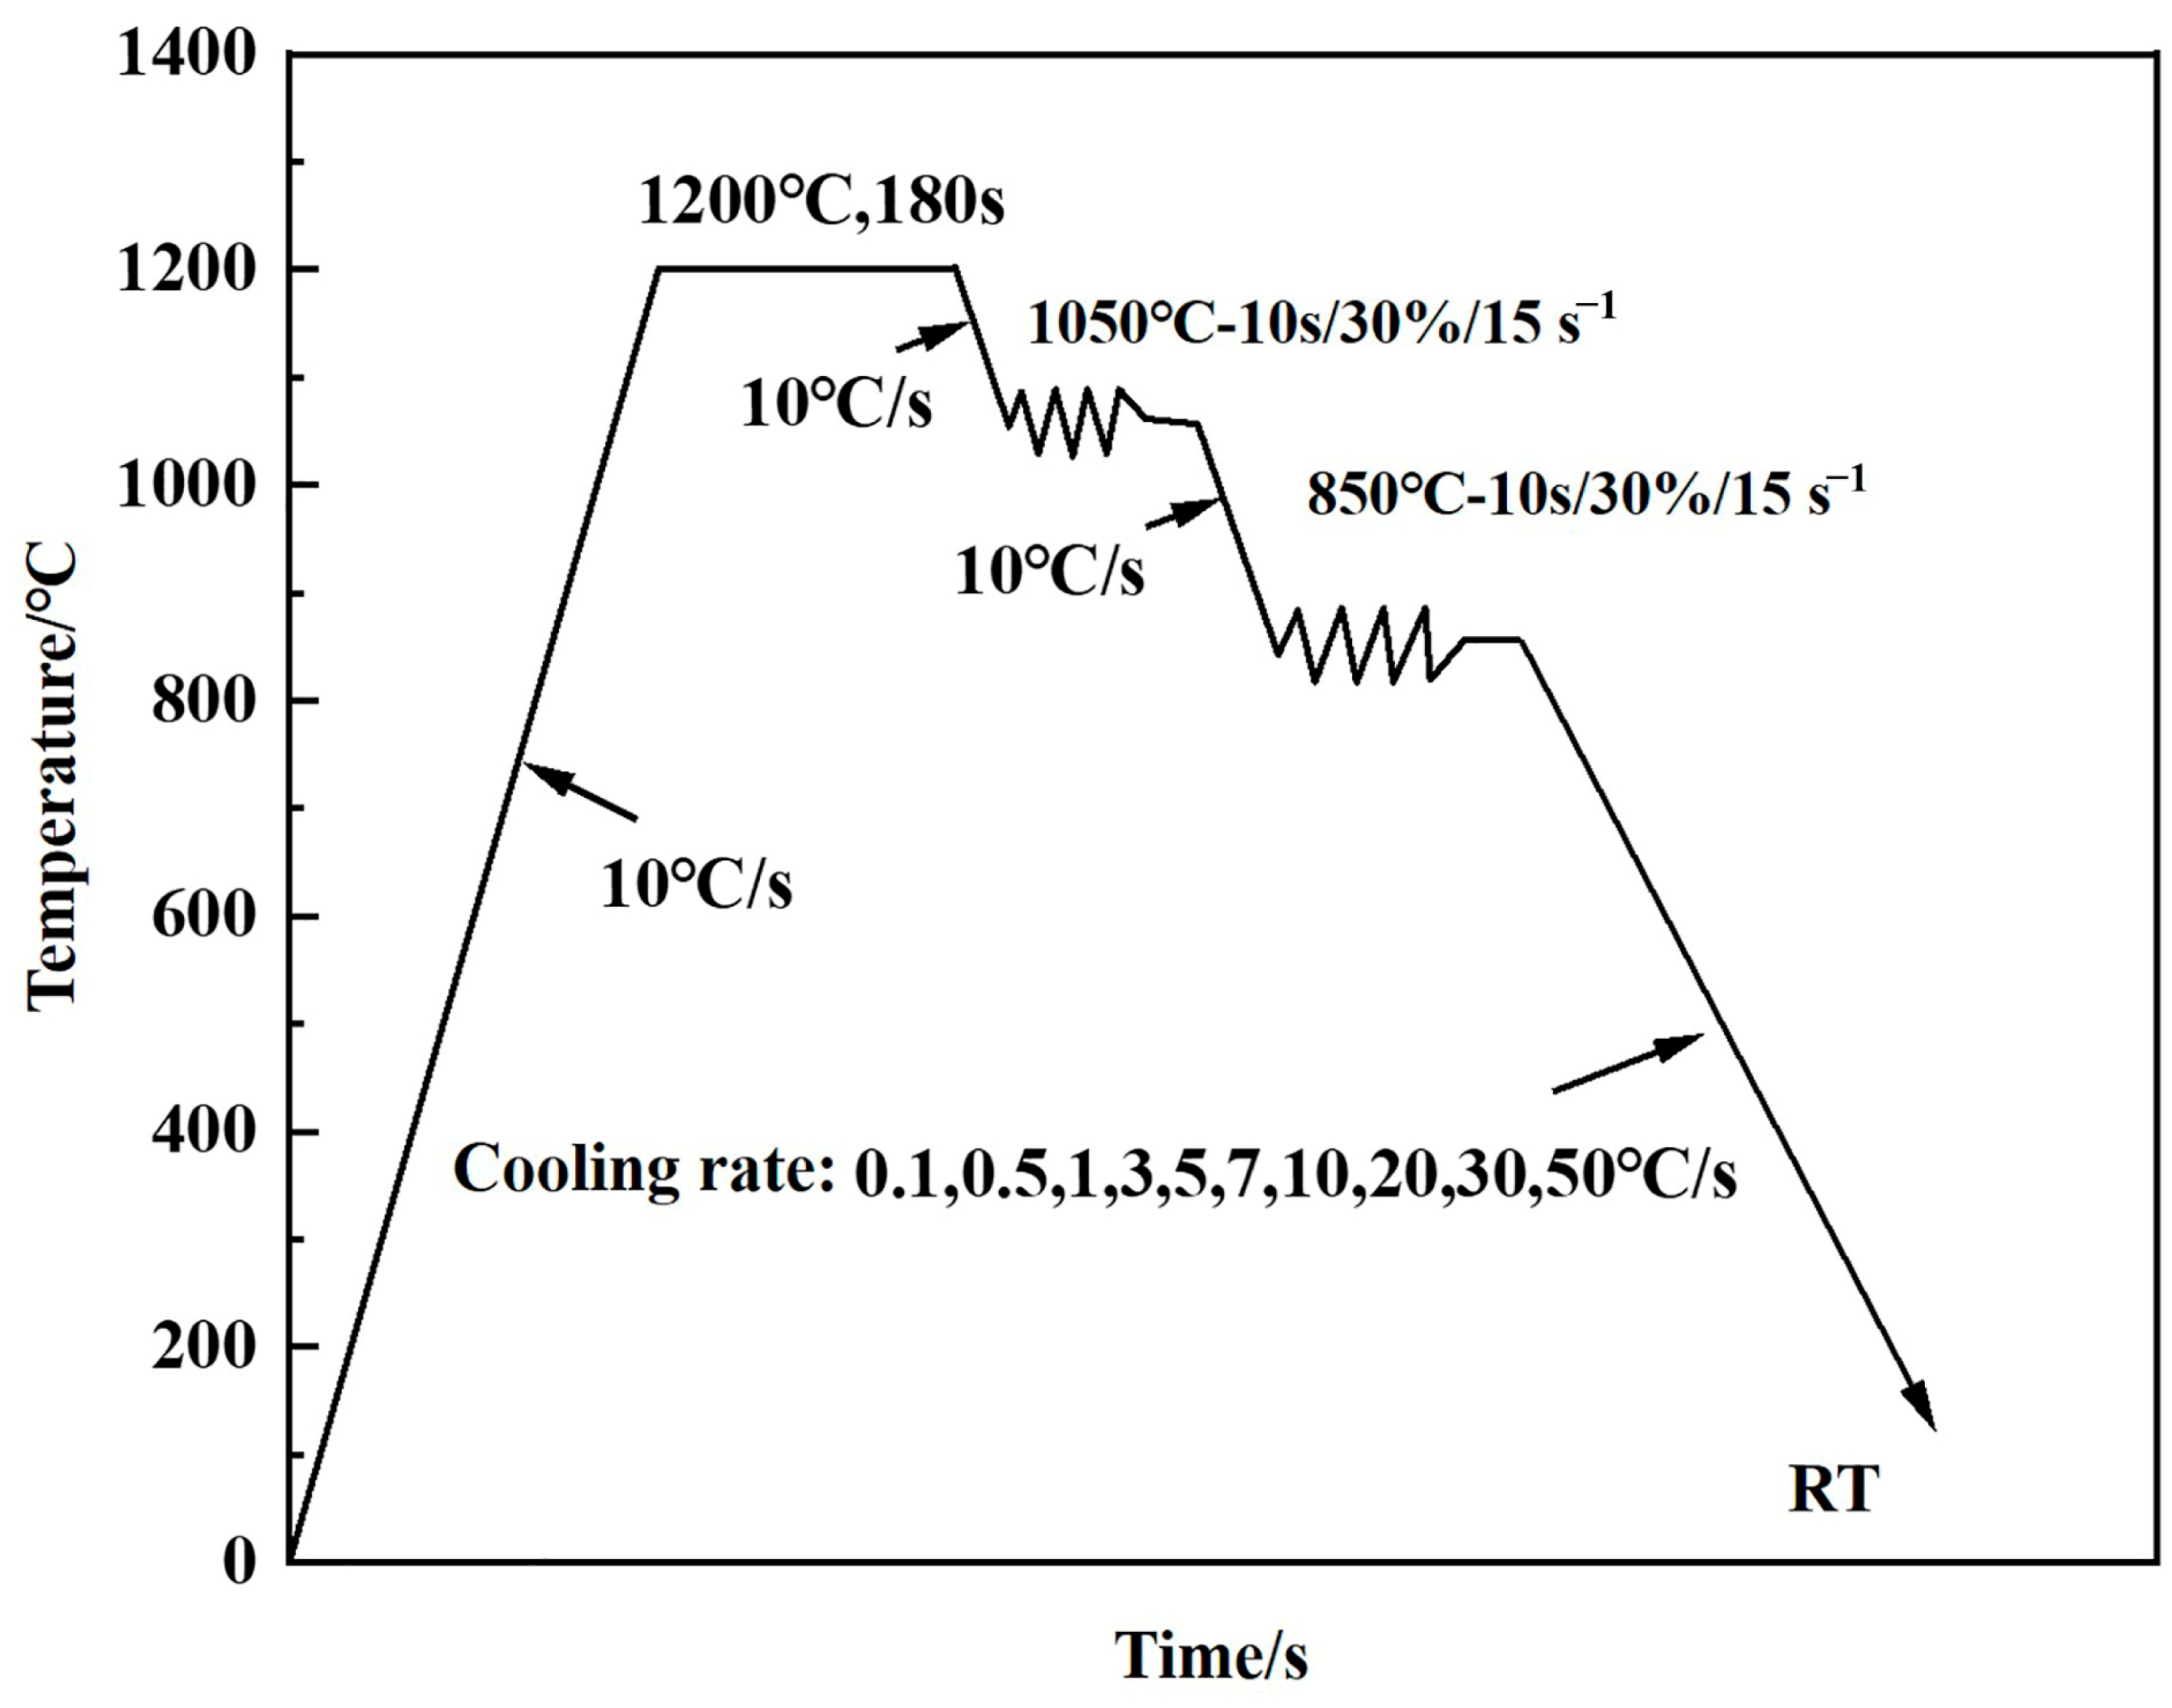
The effect of different cooling rates on the continuous cooling transformation of the undercooled austenite of the test steel can be obtained using a dynamic CCT test. The following thermal simulation test parameters were selected through a combination of extensive prior experimental exploration and the determination of the phase transformation point of the test steel using the thermal expansion test (AC1 736 °C and AC3 906 °C). In the Gleeble 3500 (Dynamic Systems Inc., El Segundo, CA, USA) thermal simulation tester, the program was set to heat up to 1200 °C at a rate of 10 °C/s, hold for 180 s to completely austenite the specimen, fully re-dissolution the microalloy elements, then cool down to 1050 °C at a rate of 10 °C/s, hold for 10 s to eliminate the temperature gradient in the specimen, then apply 30% deformation to the specimen at a deformation rate of 15 s−1, then cool down to 850 °C at 10 °C/s, hold for 10 s and then apply 30% deformation to the specimen at a deformation rate of 15 s−1. Then, it is cooled to room temperature at a cooling rate of 0.1, 0.5, 1, 3, 5, 7, 10, 20, 30 and 50 °C/s; the test measurement curve is shown in Figure 1. The sizes of thermal simulation test samples were Φ6 mm × 15 mm and Φ4 mm × 10 mm, respectively, the former being used for cooling rate experiments below 30 °C/s, and the latter being used for cooling rate experiments from 40 to 60 °C/s.
The test steel ingots were held at approximately 1200 °C for 2 h. The ingots with a thickness of 85 mm were rolled to a thickness of 6.5 mm by multiple passes of roughing and finishing rolling. The thicknesses of the first three passes of roughing rolling were 63, 47 and 35 mm, and the thicknesses of the last six passes of finishing rolling were 26, 19.5, 15, 10, 7.5 and 6.5 mm, respectively. After the finishing rolling at 850 °C, the hot-rolled steel sheets were cooled to different coiling temperatures of 650, 600 and 550 °C by laminar flow, held in a holding furnace for 30 min and then cooled to room temperature in a furnace to simulate the coiling process.
For the microstructural analysis of the dynamic CCT specimens and hot-rolled specimens, the specimens were mechanically ground, polished and etched in a 4% nital solution and characterized using an Olympus Ols40-SU (Olympus, Tokyo, Japan) laser confocal microscope and an SU8100 (Hitachi High-Tech Co., Ltd., Tokyo, Japan) cold field scanning electron microscope. In addition, after mechanical grinding, the specimens were electropolished in an electrolyte composed of 10% perchloric acid and 90% ethanol to remove the residual stress from the surface. The voltage was controlled at 15 V, the current was 1.5 A and the polishing was continued for 12 s. The hardness values of the specimens were measured using a THV-1MD (Beijing Era United Technology Co., Ltd., Beijing, China) micro-Vickers hardness tester, and the average values were obtained after five hardness measurements. Standard tensile specimens were cut to a gauge length of 25 mm in the rolling direction and tested on the MTSE45 electronic universal testing machine at a speed of 2 mm/min to obtain the mechanical properties. Additionally, three repeated tensile tests were conducted for each coiling temperature. The morphology and distribution of the dislocations and second phases of the specimens were observed using a JEM 2100 (JEOL Ltd., Tokyo, Japan) transmission electron microscope. In this case, the specimens were made by twin-jet thinning (5 vol% perchloric alcohol at −30 °C with a potential of 50 V) and carbon extraction replica. The carbon extraction replica specimen was used as a hot mount, grind and polish of the detection surface, taking advantage of 4% nitric acid alcohol to corrode and remove the specimen from the hot mount substrate and then spray carbon sequentially, later using 8% nitric acid alcohol to make the carbon film attach to the specimen substrate, resulting in the separation and attachment of the carbon film to the copper mesh in order to duplicate the specimen.
3. Results and Discussion
3.1. Study of Continuous Cooling Transformation of Undercooled Austenite
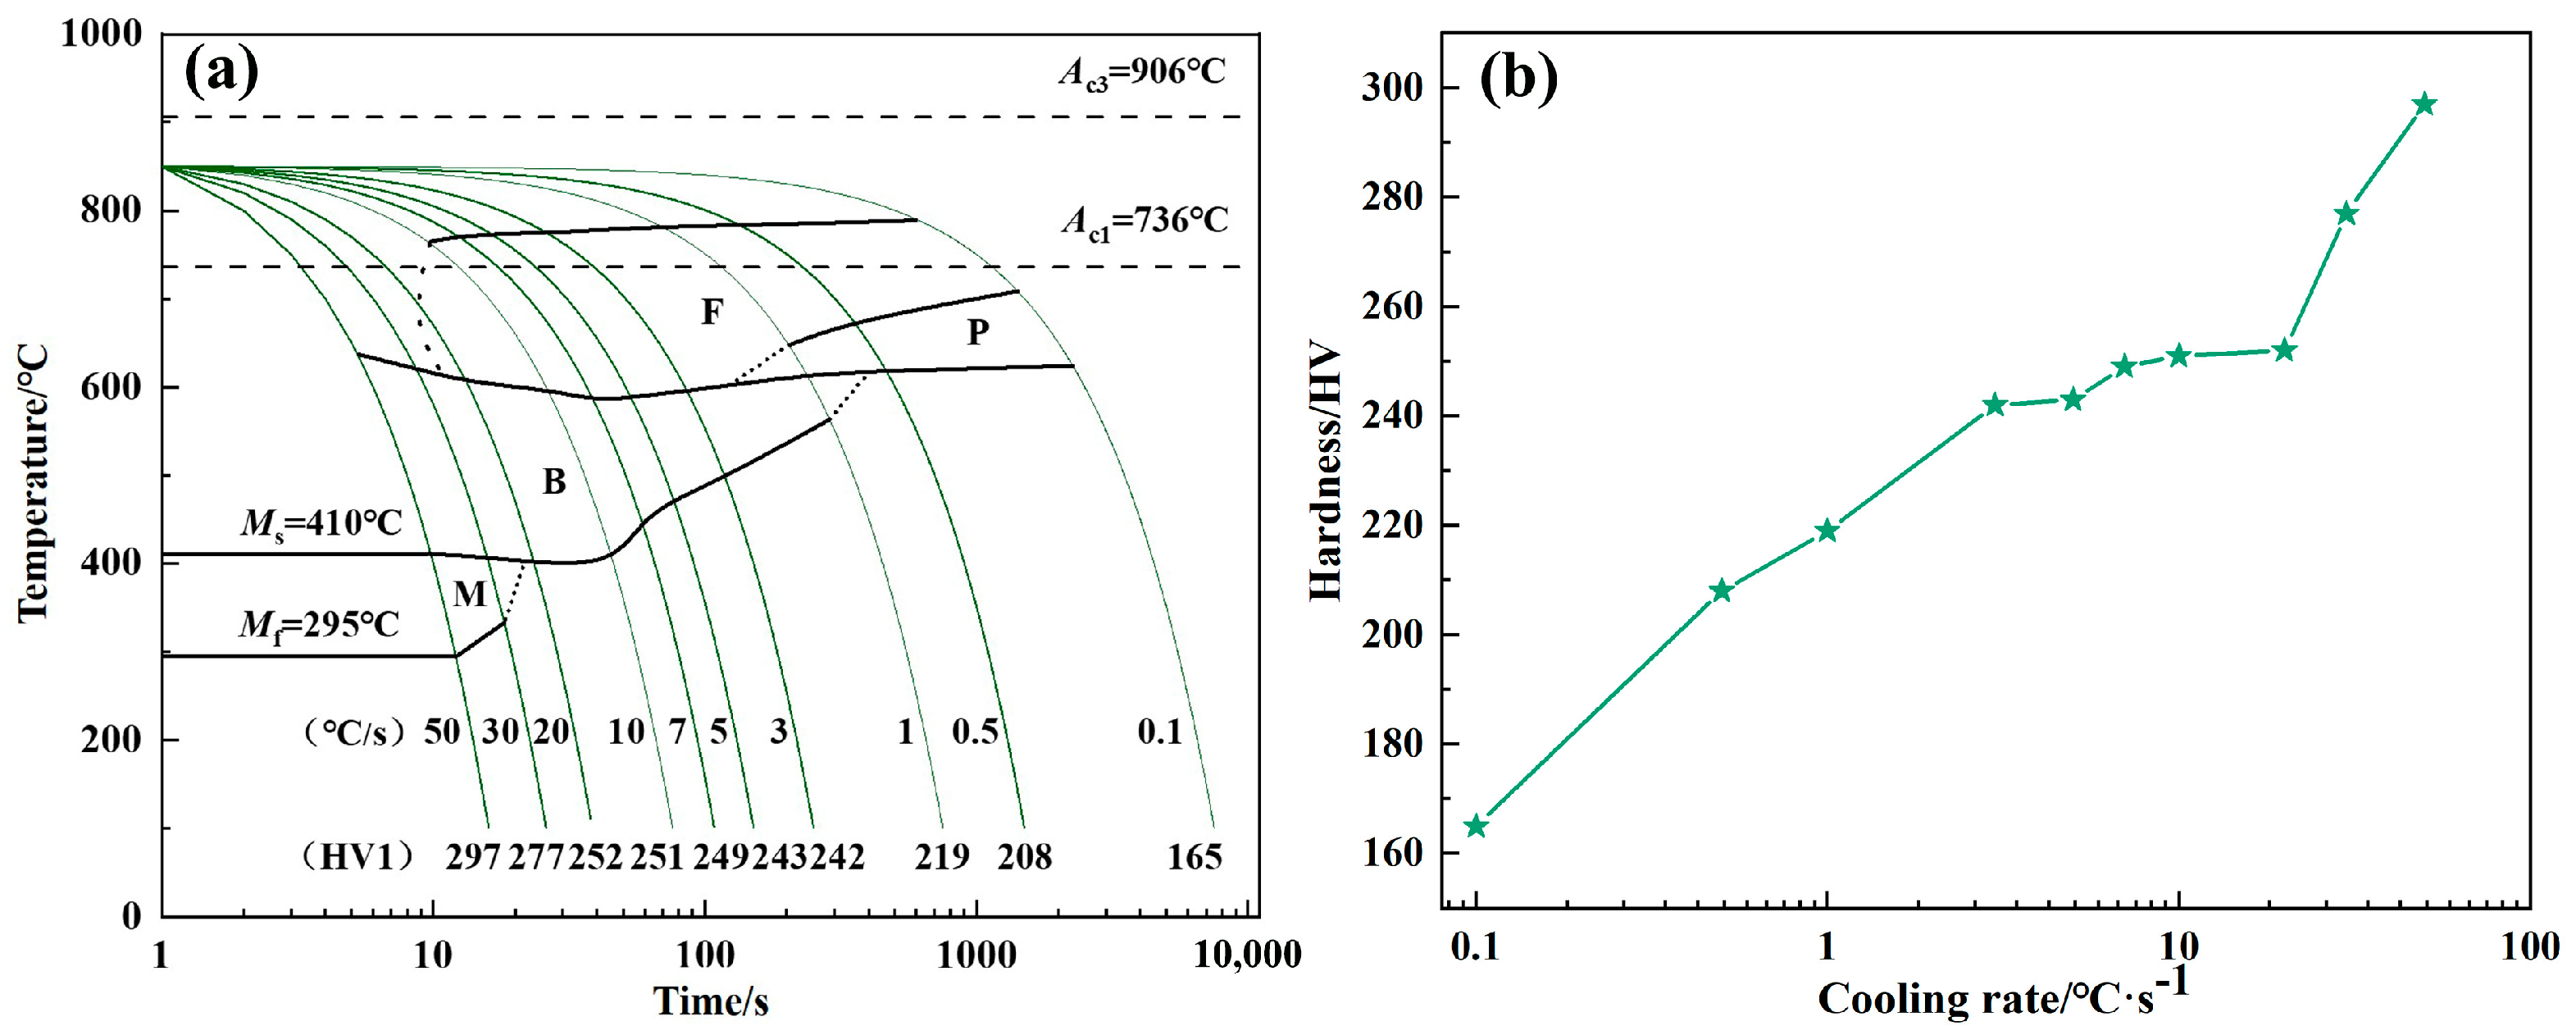
Figure 2 shows the room-temperature microstructure and ferrite average grain size of the test steel simulating two deformations with different cooling rates. At a 0.1°C/s cooling rate, the room temperature microstructure basically consists of ferrite and pearlite, but at a 0.5 °C/s cooling rate, a very small amount of pearlite starts to degrade and forms degradation pearlite, and the degradation of pearlite is serious with the increase in cooling rate, but at a 3 °C/s cooling rate, almost no pearlite transformation occurs. When the cooling rate was 1°C/s, a small amount of bainite appeared and the bainite content gradually increased with the increase in cooling rate. At the same time, the average grain size of the ferrite continued to decrease (Figure 2k). The bainite consists of a mixture of granular bainite and lath bainite. When the cooling rate was 10 °C/s, only a small amount of ferrite remained, and the ferrite disappeared as the cooling rate continued to increase. The martensite started to appear at a 30 °C/s cooling rate and the content increased gradually with the increase in cooling rate. By analyzing the microstructure shown in Figure 2 and the hardness change trend in Figure 3b at each cooling rate, the phase transformation type and temperature of the test steel were determined to draw the dynamic CCT curve, as shown in Figure 3a. The dynamic CCT curve contains four phase transformation regions: A (austenite) → F (ferrite), A → P (pearlite), A → B (bainite) and A → M (martensite). The cooling rates—high or low—control the C atom diffusion process; thus, different phase transformations occur at different cooling rates [12,13]. At lower cooling rates (0.1~1 °C/s), the C atom diffusion was sufficient; high temperature transformation occurred, i.e., ferrite pearlite transformation is complete; and the room temperature microstructure was mainly F + P or F + P + a small amount of B. At medium cooling rates (3~20 °C/s), the bainite transformation was dominated by shear and short-range diffusion, the room temperature microstructure was mainly F + B, and the hardness value did not change significantly. Meanwhile, at high cooling rates (30, 50 °C/s), part of the martensite appeared, the ferrite completely disappeared, the room temperature microstructure was mainly B + M, and the hardness substantially increased (Figure 3b).
3.2. Effect of Coiling Temperature on the Mechanical Properties of the Test Steel
Table 2 and Figure 4 show the mechanical properties and engineering stress–strain curves of the test steels at different coiling temperatures. At a coiling temperature of 650 °C, the yield strength of the test steel reached 464 MPa, the tensile strength reached 581 MPa, the yield ratio was 0.80, the elongation after fracture was 29.5% and the elongation at yield point was 1.81%. When the coiling temperature was lowered to 600 °C, the yield strength and tensile strength of the test steel increased to 538 MPa and 645 MPa, respectively, and the yield ratio increased to 0.83, whereas the elongation after fracture decreased to 26.1% and the yield point elongation decreased by a larger extent to 0.59%. In general, the steel used in building structures needs to have a lower yield ratio and a longer yield platform while having a higher strength, so that it can absorb more energy under the repeated action of seismic loads to meet the requirements of the seismic performance of high-performance building steel [14,15]. When the coiling temperature was further reduced to 550 °C, the strength of the test steel was substantially improved, the yield ratio increased to 0.89, the elongation after fracture decreased to 15.6%, the yield platform disappeared and the engineering stress–strain curve exhibited continuous yielding, as shown in Figure 4.
Figure 5 shows the microstructure of the test steel at different coiling temperatures. The test steel was held at different temperatures by laminar cooling, and the undercooled austenite underwent different phase transformations, which are generally divided into high-temperature transformation (ferrite pearlite transformation), medium-temperature transformation (bainite transformation), and low-temperature transformation (martensite transformation). Different types of microstructure transformation obtained at different temperature intervals are the direct cause of the obvious changes in the mechanical properties of the test steel. From the dynamic CCT curve in Figure 3a, combined with the microstructure shown in Figure 5, it was found that 650 °C is completely within the high-temperature transformation interval, and the resulting microstructure is typical polygonal ferrite and pearlite, which have the best comprehensive mechanical properties with excellent plasticity, a low yield ratio and a long yield platform, as shown in Table 2 and Figure 4. The ferrite morphology at 600 °C is obviously different from that of polygonal ferrite at 650 °C, and its microstructure is mainly composed of quasi-polygonal ferrite, acicular ferrite and pearlite, and there is even a small amount of granular bainite, so the test steel exhibits higher strength. The microstructure at the 550 °C coiling temperature was mainly bainite, and the bainitic made the yield strength (695 MPa) and tensile strength (784 MPa) of the test steel reach the highest values, but the plasticity became poor and the elongation after fracture was only 15.6%, while the elongation at the yield point was also reduced to 0. The dislocation density of the quasi-polygonal ferrite, acicular ferrite and bainite was relatively high, and the strong interaction and entanglement between dislocations was easily caused when the specimen was stretched and stressed to block the dislocation slip and make the work-hardening behavior prominent, which led to the shortening of the yield platform or even its disappearance [16]. Thus, with the lowering of the coiling temperature, the appearance of a higher dislocation density microstructure caused the yield point elongation of the test steel to gradually decrease. Natarajan et al. [17] investigated the mechanism of the effect of different coiling temperatures on the microstructure and mechanical properties of Ti microalloyed steels, where the tensile strength, yield strength and elongation after fracture were 862 MPa, 807 MPa and 13–15%, respectively, when the coiling temperature was 600°C, mainly due to the precipitation of more nano-TiC. Peng et al. [18] showed that the addition of 0.1 wt.% Ti resulted in the strength increments are mainly attributed to the γ/α interphase precipitation whose nano-TiC precipitates obey the Baker–Nutting orientation relationship with respect to the ferrite matrix: (100)TiC ∥ (100)α-Fe and [011]TiC ∥ [001]α-Fe. Based on these beneficial studies and relevant data, we investigated the precipitation behavior of Ti-containing second phases through calculations using the kinetics theory and transmission electron microscopy (TEM) studies.
During the rolling process of Ti microalloyed steel, partial carbon and nitrogen titanium precipitation occurs. In order to be consistent with the actual production conditions, it is assumed that 50% of the strain-induced precipitation of carbon and nitrogen titanium in the experimental steel occurs between the starting rolling temperature and the final rolling temperature of 850 °C. Based on the equilibrium solid solubility at 850 °C, the relevant element concentrations in the experimental steel after finish rolling and before laminar cooling were [Ti] = 0.0397, [C] = 0.06255 and [N] = 2.25 × 10⁻⁷. Since the nitrogen content at this point was close to zero, the effect of nitrogen was not considered and the second phase precipitated in the ferrite was mainly TiC. The chemical free energy of TiC precipitation in the ferrite at different precipitation temperatures can be theoretically calculated using the solubility product formula. This can be divided into two parts: TiC precipitation before the pearlite transformation and TiC precipitation in the ferrite after the pearlite transformation, where the matrix carbon content decreases to 0.0218%. Figure 6 shows the NrT and PTT curves of TiC precipitation in the ferrite, where the NrT curve exhibits the characteristic of a reverse C curve and the PTT curve exhibits a C curve. The occurrence of the pearlite transformation reduces the carbon element supersaturation in the steel, especially reducing the value of the chemical free energy of the TiC precipitation, resulting in a slightly larger critical nucleus size, a moderate increase in critical nucleation work, a moderate decrease in nucleation rate and a significant delay in the start time of the precipitation transformation. At the time of the nucleation on a dislocation, the maximum nucleation rate temperature and the fastest precipitation temperature of TiC in the matrix without the pearlite transformation were 725 °C and 775 °C, respectively. However, when the matrix underwent pearlite transformation before TiC precipitation, the maximum nucleation rate temperature and the fastest precipitation temperature of TiC were 625 °C and 675 °C, respectively, which means that the occurrence of the pearlite transformation reduced these two temperatures by 100 °C each. This temperature reduction can lead to a lower actual precipitation transformation temperature and allow finer precipitation particles to be obtained.
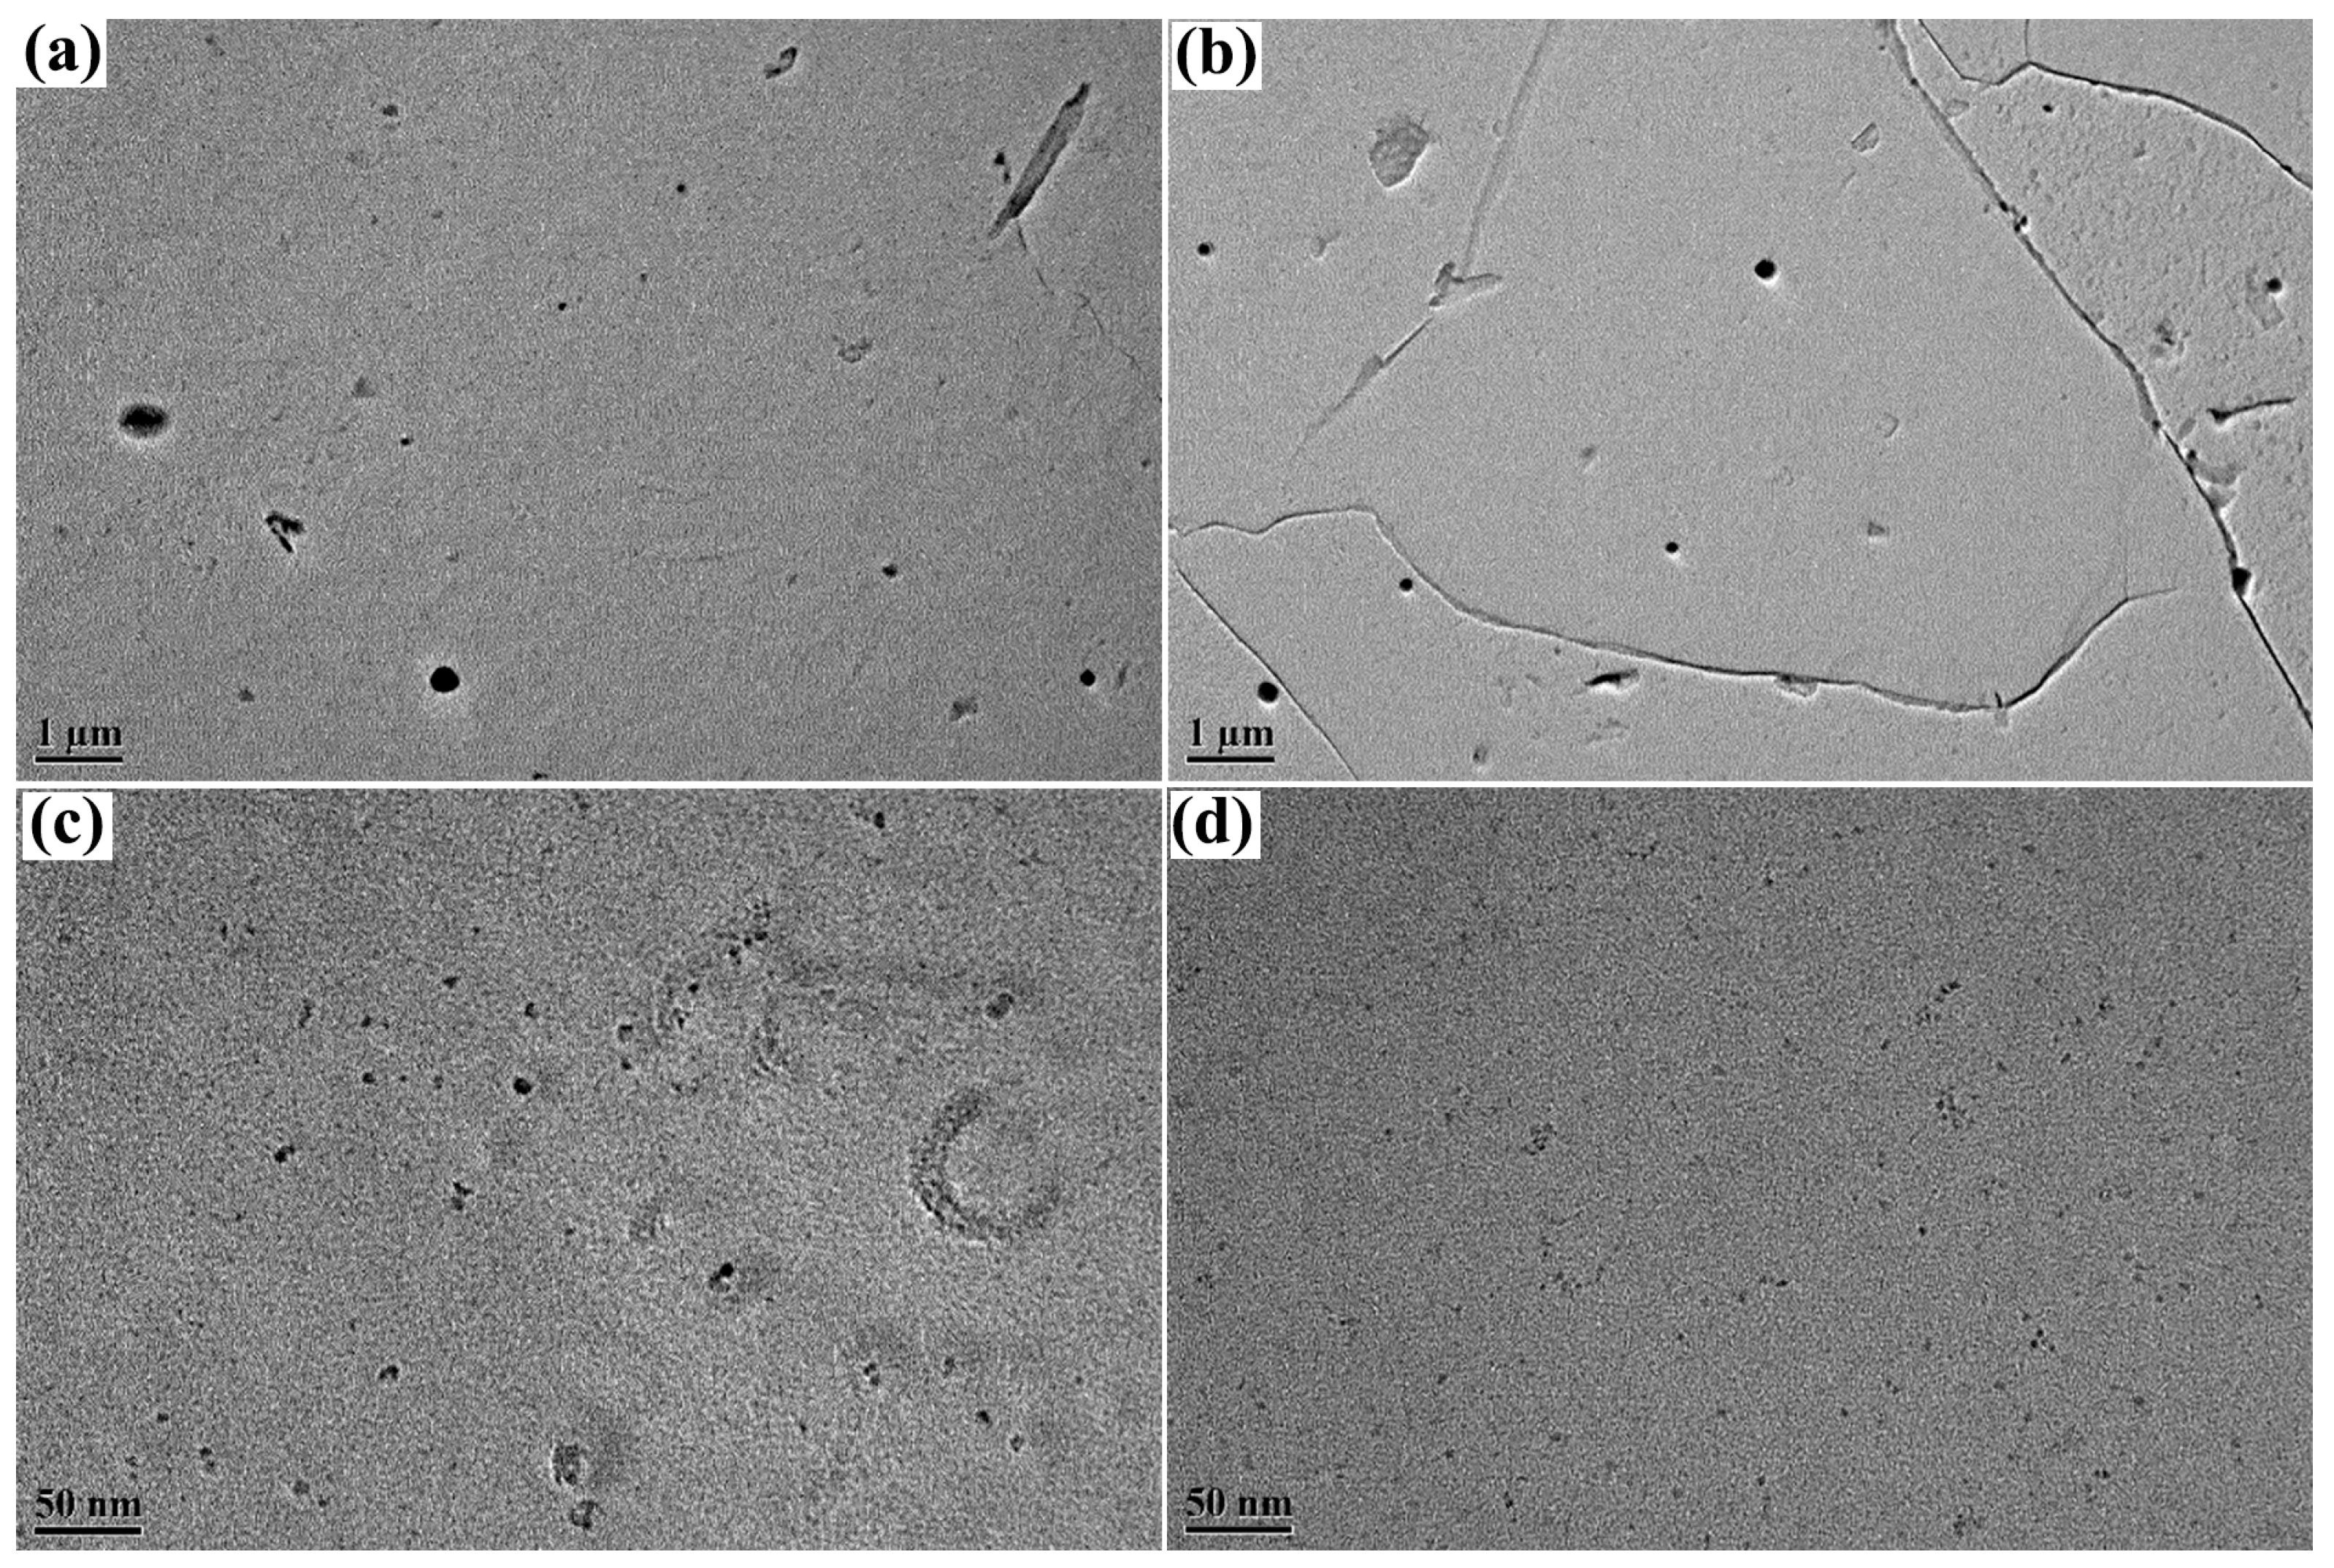
TEM observations were performed on the test steels at coiling temperatures of 650 °C and 600 °C for replica and thinning, respectively. Figure 7 and Figure 8 show the TEM observations of the precipitation phases for the replica specimens. During the cooling of the casting blank, Ti was easily combined with impurity elements such as C, N, S and O in steel to form large-sized precipitation phases, owing to its extremely strong chemical properties [19]. As shown in Figure 7a,c, the composite precipitation phase containing Ti with a diameter of approximately 200 nm can be determined from its energy spectrum as Ti4C2S4, which plays a role in controlling the growth of austenite grains during homogeneous heating [20]. Figure 8a,b shows the strain-induced precipitation of the second phase during the hot rolling process, and its size is generally above several tens of nanometers, which can inhibit high-temperature austenite recrystallization and prevent grain growth, playing a certain role in grain refinement; however, the precipitation strengthening effect is not significant [21].
In addition, nano-precipitated phases with sizes below ten nanometers were observed in the test steels, as shown in Figure 8c,d, which are generally precipitated interphase or on ferrite dislocation lines during cooling and coiling holding [22,23] and are smaller and more numerous, providing strong precipitation strengthening effects. In order to quantitatively analyze the second-phase particles, the number and size distribution of Ti-containing precipitates in twenty TEM images were counted, and the statistical results are shown in Figure 9. The second-phase particle size of the test steel was mainly distributed in two intervals, with the smaller precipitates between 0 and 6 nm and the larger ones between 10 and 50 nm. Generally, the reason for such a bimodal distribution is that the precipitates form at different stages during the entire production process, with smaller precipitates mainly forming in ferrite during the coiling and insulation and larger precipitates mainly forming in austenite during the rolling. Using the McCall–Boyd method, the volume fraction of nanometer-sized second-phase precipitates with smaller sizes in the experimental steel at coiling temperatures of 600 °C and 650 °C were found to be 0.065% and 0.059%, respectively, while the volume fractions of larger nanometer-sized second-phase precipitates were found to be 0.00193% and 0.00154%, respectively. From the difference in volume fraction, it was found that the volume fraction of the larger second-phase particles is relatively small, and its strengthening effect is far less than that of precipitation strengthening caused by several nanometer-sized precipitates. In addition, as shown in Figure 9, it was found that when the coiling temperature was 600 °C, the peak of the smaller precipitate size distribution was in the range of 2–3 nm, with a mean value of about 2.9 nm, while the peak of the larger precipitate size distribution was in the range of 15–25 nm, with a mean value of about 22.1 nm. When the coiling temperature was 650 °C, the peak of the smaller precipitate size distribution was in the range of 3–4 nm, with a mean value of about 3.4 nm, while the peak of the larger precipitate size distribution was in the range of 15–30 nm, with a mean value of about 24.8 nm. In summary, compared with using 650 °C, not only does the second-phase particle size at 600 °C decrease, but also the number and volume fraction of the second-phase particles increase, thereby providing a stronger precipitation strengthening effect. Generally, for Ti microalloyed steels, 600 °C often corresponds to the optimum second-phase precipitation temperature, and Yi et al. [24] showed that, in Ti-Mo microalloyed steels, 600 °C is the peak temperature of the second phase of the ferrite precipitation kinetic curve. Second-phase precipitation strengthening caused a slightly greater increase in the yield strength than in the tensile strength, resulting in a slightly higher yield ratio. In addition, Figure 10 shows the TEM observations of the dislocation configuration for the thinned specimens. Figure 10a,b shows that the dislocation density at 600 °C is higher than that at 650 °C, and the degree of contribution of the dislocation strengthening to the yield strength is significantly greater than the effect of enhancing the tensile strength; thus, the yield ratio is increased [25].
4. Conclusions
(1) In the cooling rate range of 0.1~50 °C/s, as the cooling rate increases, the room temperature microstructure of the test steel gradually transitions as follows: F + P, F + P + B, F + B, B + M; in addition, the microstructure is refined and the hardness increases. A low cooling rate (0.1~1 °C/s) mainly led to F + P or F + P + a small amount of B; a medium cooling rate (3~20 °C/s) mainly led to F + B, with the hardness value not significantly changing; a high cooling rate (30, 50 °C/s) mainly led to B + a small amount of M, with the hardness substantially increasing.
(2) The test steel was coiled at 650 °C to obtain polygonal ferrite and pearlite with a yield strength of 464 MPa, tensile strength of 581 MPa, yield ratio of 0.80, elongation after fracture of 29.5%, yield point elongation of 1.81% and excellent comprehensive mechanical properties.
(3) When the coiling temperature was 600 °C, the test steel microstructure mainly consisted of quasi-polygonal ferrite, acicular ferrite, pearlite and a small amount of bainite. Compared with the use of a coiling temperature of 650 °C, the nano second phase in the test steel at 600 °C was smaller in size and more numerous and had a higher dislocation density, which can produce stronger second-phase precipitation strengthening and dislocation strengthening effects; the combined effect of the two strengthening methods increased the yield strength of the test steel from 464 MPa to 538 MPa, the tensile strength from 581 MPa to 645 MPa and the yield ratio from 0.80 to 0.83. At a coiling temperature of 550 °C, the microstructure was mainly composed of bainite, which led to a significant increase in the strength and yield ratio, a significant decrease of 15.6% in the elongation after fracture.
Author Contributions
Conceptualization, methodology, writing—original draft preparation Z.L. (Zhengrong Li) and Z.L. (Zhenhu Lv); software, C.W.; resources, L.L.; investigation, K.C.; writing—review and editing, Z.Z. All authors have read and agreed to the published version of the manuscript.
Funding
This study was supported by the fifth batch of major science and technology projects of the Panxi Experimental Zone: Development and Application of Titanium Micro-Alloyed Weather-Resistant Steel Plates.
Institutional Review Board Statement
Not applicable.
Informed Consent Statement
Not applicable.
Data Availability Statement
Not applicable.
Conflicts of Interest
The authors declare no conflict of interest.
References
- Jia, C.; Shao, Y.; Guo, L.; Liu, H. Cyclic behavior and constitutive model of high strength low alloy steel plate. Eng. Struct. 2020, 217, 110798. [Google Scholar] [CrossRef]
- Dillmann, P.; Balasubramaniam, R.; Beranger, G. Characterization of protective rust on ancient Indian iron using microprobe analyses. Corros. Sci. 2002, 44, 2231–2242. [Google Scholar] [CrossRef]
- Yamashita, M.; Konishi, H.; Kozakura, T.; Mizuki, J.; Uchida, H. In situ observation of initial rust formation process on carbon steel under Na2SO4 and NaCl solution films with wet/dry cycles using synchrotron radiation X-rays. Corros. Sci. 2005, 47, 2492–2498. [Google Scholar] [CrossRef]
- Gan, X.; Yuan, Q.; Zhao, G.; Hu, H.; Tian, J.; Xu, G. Investigating the Properties of Coil Tail in Ti-Nb-Mo Microalloyed Hot-Rolled Strip. Steel Res. Int. 2019, 90, 1900040. [Google Scholar] [CrossRef]
- Gan, X.; Yang, G.; Zhao, G.; Mao, X.; Huang, H.; Xu, G. Effect of Vanadium on the Phase Transformation Behavior of Ti–Mo Microalloyed Ultra-High Strength Steel. Steel Res. Int. 2018, 89, 1800112. [Google Scholar] [CrossRef]
- Abbas, M.A.; Hong, S.H.; Yusupov, D.; Kang, G.C.; Choi, J.W.; Jumaev, E.; Park, H.J.; Kim, K.B. Evolution of microstructure and mechanical properties of a Ti80 (CoFeNi) 20 ultrafine eutectic composite during thermal processing. Intermetallics 2023, 154, 107786. [Google Scholar] [CrossRef]
- Jumaev, E.; Abbas, M.A.; Mun, S.C.; Song, G.; Hong, S.J.; Kim, K.B. Nano-scale structural evolution of quaternary AlCrFeNi based high entropy alloys by the addition of specific minor elements and its effect on mechanical characteristics. J. Alloy. Compd. 2021, 868, 159217. [Google Scholar] [CrossRef]
- Hong, S.H.; Hwang, Y.J.; Park, S.W.; Park, C.H.; Yeom, J.T.; Park, J.M.; Kim, K.B. Low-cost beta titanium cast alloys with good tensile properties developed with addition of commercial material. J. Alloy Compd. 2019, 793, 271–276. [Google Scholar] [CrossRef]
- Xu, Y.; Zhang, W.; Sun, M.; Yi, H.; Liu, Z. The blocking effects of interphase precipitation on dislocations’ movement in Ti-bearing micro-alloyed steels. Mater. Lett. 2015, 139, 177–181. [Google Scholar] [CrossRef]
- Peng, Z.; Li, L.; Gao, J.; Huo, X. Precipitation strengthening of titanium microalloyed high-strength steel plates with isothermal treatment. Mater. Sci. Eng. A 2016, 657, 413–421. [Google Scholar] [CrossRef]
- Li, S.; Yu, H.; Lu, Y.; Lu, J.; Wang, W.; Yang, S. Effects of titanium content on the impact wear properties of high-strength low-alloy steels. Wear 2021, 474–475, 203647. [Google Scholar] [CrossRef]
- Li, Q.; Yu, H.; Zhang, X.; Wang, K.; Song, C. Developing 1000 MPa grade LCLA steels through continuous cooling: Effects of Cr and cooling rate on bainitic and martensitic transformations. Mater. Charact. 2022, 187, 111859. [Google Scholar] [CrossRef]
- Chen, S.; Li, L.; Peng, Z.; Huo, X.; Sun, H. On the correlation among continuous cooling transformations, interphase precipitation and strengthening mechanism in Ti-microalloyed steel. J. Mater. Res. Technol. 2021, 10, 580–593. [Google Scholar] [CrossRef]
- Fang, C.; Wang, W.; Qiu, C.; Hu, S.; MacRae, G.; Eatherton, M. Seismic resilient steel structures: A review of research, practice, challenges and opportunities. J. Constr. Steel Res. 2022, 191, 107172. [Google Scholar] [CrossRef]
- Chen, Y.; Ke, K. Seismic performance of high-strength-steel frame equipped with sacrificial beams of non-compact sections in energy dissipation bays. Thin-Walled Struct. 2019, 139, 169–185. [Google Scholar] [CrossRef]
- Tanaka, Y.; Masumura, T.; Tsuchiyama, T.; Takaki, S. Effect of dislocation distribution on the yield stress in ferritic steel under identical dislocation density conditions. Scripta Mater. 2020, 177, 176–180. [Google Scholar] [CrossRef]
- Natarajan, V.V.; Challa, V.S.A.; Misra, R.D.K.; Sidorenko, D.M.; Mulholland, M.D.; Manohar, M.; Hartmann, J.E. The determining impact of coiling temperature on the microstructure and mechanical properties of a titanium-niobium ultrahigh strength microalloyed steel: Competing effects of precipitation and bainite. Mater. Sci. Eng. A 2016, 665, 1–9. [Google Scholar] [CrossRef]
- Peng, Z.; Li, L.; Chen, S.; Huo, X.; Gao, J. Isothermal precipitation kinetics of carbides in undercooled austenite and ferrite of a titanium microalloyed steel. Mater. Des. 2016, 108, 289–297. [Google Scholar] [CrossRef]
- Zhou, C.; Zhang, C.; Li, Y.; Fei, B.; Gao, X. Microstructure and properties of Ti microalloyed 700 MPa weathering steel for container. Trans. Mater. Heat Treat. 2020, 41, 126–133. [Google Scholar]
- Cai, Z.; Han, B.; Tan, W.; Wang, S. Development status of titanium micro-alloying technology. China Metall. 2015, 25, 1–5. [Google Scholar]
- Wang, Z.; Song, X.; Wang, Z.; Liu, C.; Sun, X. Kinetics of strain induced precipitation of TiC by hot compression method. Iron Steel 2015, 50, 90–95. [Google Scholar]
- Wang, X.; Zhao, A.; Zhao, Z.; Huang, Y.; He, J.; Zhao, F. Interphase precipitation characterization of nanometer-sized carbides in low-carbon ferritic steel. Trans. Mater. Heat Treat. 2014, 35, 69–73. [Google Scholar]
- Chen, J.; Lv, M.; Tang, S.; Liu, Z.; Wang, G. Microstructure, Mechanical Properties and Interphase Precipitation Behaviors in V-Ti Microalloyed Steel. Acta Metall. Sin. 2014, 50, 524–530. [Google Scholar]
- Yi, H.; Long, L.; Liu, Z.; Wang, G. Precipitation in ferrite of Mo-Ti microalloyed steel. Trans. Mater. Heat Treat. 2015, 36, 56–61. [Google Scholar]
- Li, X.; Liu, Y.; Gan, K.; Dong, J.; Liu, C. Acquiring a low yield ratio well synchronized with enhanced strength of HSLA pipeline steels through adjusting multiple-phase microstructures. Mater. Sci. Eng. A 2020, 785, 139350. [Google Scholar] [CrossRef]
Figure 1.
Dynamic CCT test measurement curve.

Figure 2.
Microstructure of test steel at different cooling rates: (a) 0.1 °C/s; (b) 0.5 °C/s; (c) 1 °C/s; (d) 3 °C/s; (e) 5 °C/s; (f) 7 °C/s; (g) 10 °C/s; (h) 20 °C/s; (i) 30 °C/s; (j) 50 °C/s; (k) average grain size of ferrite at different cooling rates.
Figure 2.
Microstructure of test steel at different cooling rates: (a) 0.1 °C/s; (b) 0.5 °C/s; (c) 1 °C/s; (d) 3 °C/s; (e) 5 °C/s; (f) 7 °C/s; (g) 10 °C/s; (h) 20 °C/s; (i) 30 °C/s; (j) 50 °C/s; (k) average grain size of ferrite at different cooling rates.

Figure 3.
(a) Dynamic CCT curve of test steel; (b) hardness of different cooling rates of test steel.
Figure 3.
(a) Dynamic CCT curve of test steel; (b) hardness of different cooling rates of test steel.

Figure 4.
Engineering stress–strain curves of test steel at different coiling temperatures.

Figure 5.
Microstructure of test steel at different coiling temperatures: (a,b) 650 °C; (c,d) 600 °C; (e,f) 550 °C.
Figure 5.
Microstructure of test steel at different coiling temperatures: (a,b) 650 °C; (c,d) 600 °C; (e,f) 550 °C.

Figure 6.
TiC precipitation in ferrite with NrT (a) and PTT (b) curves.

Figure 7.
Large size precipitates of test steel at different coiling temperatures: (a) 650 °C; (c) 600 °C; (b,d) energy spectrum corresponding to precipitates.
Figure 7.
Large size precipitates of test steel at different coiling temperatures: (a) 650 °C; (c) 600 °C; (b,d) energy spectrum corresponding to precipitates.

Figure 8.
Nano precipitates of test steel at different coiling temperatures: (a,c) 650 °C; (b,d) 600 °C.
Figure 8.
Nano precipitates of test steel at different coiling temperatures: (a,c) 650 °C; (b,d) 600 °C.

Figure 9.
Size distribution of the second-phase precipitation in test steel at different coiling temperatures.
Figure 9.
Size distribution of the second-phase precipitation in test steel at different coiling temperatures.

Figure 10.
Dislocation configuration of test steel at different coiling temperatures: (a) 650 °C; (b) 600 °C.
Figure 10.
Dislocation configuration of test steel at different coiling temperatures: (a) 650 °C; (b) 600 °C.


Table 1.
Chemical composition of the test steel.
| C | Si | Mn | P | S | Cu + Ni + Cr | Ti | Als | N | Fe |
|---|---|---|---|---|---|---|---|---|---|
| 0.07 | 0.40 | 1.35 | 0.005 | 0.002 | 1.14 | 0.07 | 0.04 | 0.002 | Bal. |
Table 2.
The mechanical properties of test steel at different coiling temperatures.
| Coiling Temperature/°C | Rel/MPa | Rm/MPa | Rel/Rm | A50/% | Ae/% |
|---|---|---|---|---|---|
| 650 | 464 ± 13 | 581 ± 8 | 0.80 ± 0.011 | 29.5 ± 0.3 | 1.81 ± 0.09 |
| 600 | 538 ± 17 | 645 ± 12 | 0.83 ± 0.010 | 26.1 ± 0.7 | 0.59 ± 0.12 |
| 550 | 695 ± 10 | 784 ± 7 | 0.89 ± 0.005 | 15.6 ± 0.6 | 0 |
Disclaimer/Publisher’s Note: The statements, opinions and data contained in all publications are solely those of the individual author(s) and contributor(s) and not of MDPI and/or the editor(s). MDPI and/or the editor(s) disclaim responsibility for any injury to people or property resulting from any ideas, methods, instructions or products referred to in the content. |
© 2023 by the authors. Licensee MDPI, Basel, Switzerland. This article is an open access article distributed under the terms and conditions of the Creative Commons Attribution (CC BY) license (https://creativecommons.org/licenses/by/4.0/).
Share and Cite
MDPI and ACS Style
Li, Z.; Lv, Z.; Wang, C.; Liu, L.; Cui, K.; Zhao, Z. Effect of Coiling Temperature on Microstructure and Properties of Titanium Strengthened Weathering Building Steel. Metals 2023, 13, 804. https://doi.org/10.3390/met13040804
AMA Style
Li Z, Lv Z, Wang C, Liu L, Cui K, Zhao Z. Effect of Coiling Temperature on Microstructure and Properties of Titanium Strengthened Weathering Building Steel. Metals. 2023; 13(4):804. https://doi.org/10.3390/met13040804
Chicago/Turabian StyleLi, Zhengrong, Zhenhu Lv, Chuangwei Wang, Lei Liu, Kaiyu Cui, and Zhengzhi Zhao. 2023. "Effect of Coiling Temperature on Microstructure and Properties of Titanium Strengthened Weathering Building Steel" Metals 13, no. 4: 804. https://doi.org/10.3390/met13040804
Note that from the first issue of 2016, this journal uses article numbers instead of page numbers. See further details here.