Article

Influence of Cryogenic Temperatures on the Mechanical Properties and Microstructure of 2195-T8 Alloy

1
State Key Laboratory of Nonferrous Metals and Processes, China GRINM Group Co., Ltd., Beijing 100088, China
2
General Research Institute for Nonferrous Metals, Beijing 100088, China
3
GRIMAT Engineering Institute Co., Ltd., Beijing 101407, China
4
China Academy of Launch Vehicle Technology, Beijing 100076, China
*
Authors to whom correspondence should be addressed.
Metals 2023, 13(4), 740; https://doi.org/10.3390/met13040740
Submission received: 27 February 2023 / Revised: 26 March 2023 / Accepted: 4 April 2023 / Published: 11 April 2023

Abstract

:
The 2195 aluminum alloy is widely used in cryogenic storage tanks for space vehicles, where it can reach a temperature of 20 K. In order to explore the reasons for the increased strength of 2195 aluminum alloys at cryogenic temperatures, uniaxial tensile tests were conducted in the range of 20 K–298 K. Tensile fracture was observed. In addition, the microstructures under different temperatures were observed using EBSD (electron back-scattered diffraction) and TEM (transmission electron microscopy) techniques, and the dislocation density of the material was quantitatively characterized using the modified Williamsone–Hall method based on XRD (X-ray diffraction) analysis. The results indicated that the ultimate strength increased at an increasing rate with the temperature decrease, while the elongation increase was insignificant. The fracture’s surface exhibited that dimple characteristics seemed to be unapparent while the quantity of tearing ridges was enhanced by the temperature decrease. Meanwhile, the fracture mode changed from ductile to brittle fracture. The microdeformation degree revealed by KAM images showed an aggravating trend, and the deformation tended to be more uniform. The increasingly enhanced dislocation density quantitatively revealed by the modified Williamsone–Hall method also proved this and that the increase in dislocations had a similar trend to that of tensile strength, which was furtherly revealed by TEM images. This indicated that the more regions are involved in deformation, the more dislocations are generated in the material during deformation, resulting in an increase in strength at cryogenic temperatures.

1. Introduction

Aluminum–Lithium (Al–Li) alloys have been promising materials in aviation and military fields in recent decades. Compared to other aluminum alloys, third generation (Gen3) Al–Li alloys have high specific strength, a specific modulus, and good weldability. Therefore, they have been increasingly used in the main structures of aerospace vehicles, such as airplanes, missiles, rockets, and so on [1,2,3]. Additionally, some Al–Li alloys have preferential cryogenic properties, which allows them to be used under severe environments. Therefore, the 2195 Al–Li alloy is a representative one, which has been successfully applied to the Space Shuttle external tank [4]. Liquid oxygen (with the boiling point at a pressure of 1 atm being 90 K) and liquid hydrogen (with the boiling point at a pressure of 1 atm being 20 K) are the commonly used fuels for rockets. This requires the storage tank to have excellent performance even at cryogenic temperatures.
Numerous studies on aluminum alloys in cryogenic environments found that the strength of aluminum alloys increases with decreasing temperatures [5,6,7,8,9,10,11]. Wang et al. [5] compressed 7A85 aluminum alloy forgings at room temperature and low temperatures, followed by solution treatment and aging. They asserted that cryogenic plastic deformation before the solution treatment facilitated the fragmentation of large-sized second-phase grains, leading to the massive dislocation proliferation. Zhang et al. [6] found that the strength and elongation of 2195 O-state (annealed state) and W-state (solution treatment) alloys increased with decreasing deformation temperatures, and that the increasing trend of elongation of W-state alloys was more evident than that of O-state alloys. The study by Wang et al. [9] showed that the ultimate strength, yield strength, and elongation of an annealed 2024 aluminum alloy at 77 K increased by 83.1%, 27.1%, and 47.6%, respectively, compared with those of the alloy annealed at 298 K. Tensile strength and elongation increased exponentially with decreasing temperature. Moreover, Jiang et al. [10] investigated the mechanical properties of Al–Mg–Sc alloys after different pretreatments through tensile testing at 77 K–298 K. They also found that the tensile strength increased exponentially with decreasing temperatures. They attributed the increase in strength at cryogenic temperatures to the possibility that the cryogenic temperatures suppressed dynamic recovery during deformation, thus increasing the dislocation density. This conclusion was made based on the fact that they observed more dislocations in the samples after cryogenic temperature treatment by transmission electronic microscopy. However, TEM can only observe the microstructure in a tiny area, and this experiment only involved several temperature points, which make it difficult to reflect the process of intensity change with temperature, especially given the lack of research on the microstructure and properties of materials at ultra-low temperatures. Niraj Nayan [11] studied the effects of combining and cold working and stretching prior to aging on the mechanical properties at RT, 77 K and 20 K of an AA2195 alloy. Their results showed that the ultimate strength values increased linearly with the temperature, which was significantly different to the finding of Wang’s study [9], and the reasons for the increase in strength were not furtherly investigated.
The commonly used methods for the quantitative analysis of dislocation density are X-ray diffraction (XRD) and electron back-scattered diffraction (EBSD) [12]. Using the modified Williamson–Hall method, the peak widths of the different diffraction peaks can be correlated with the dislocation density of the material, and thus an approximate range of the dislocation density can be deduced. This method has been widely used because of its early and intuitive nature, and it has been widely used for the semiquantitative calculation of dislocation density [13,14,15].
In summary, although there have been many studies on aluminum alloys in cryogenic environments, these studies mainly focus on cryogenic plastic deformation processes [5,6,7,8,9,10,11]. The alloy states studied are mostly annealed, solution-treated, and homogenized, with less research being conducted on aging-state aluminum alloys. However, the aging state is the actual use state of most aluminum alloys. There are many nanoprecipitation phases in aging-state aluminum alloys. These nanoprecipitated phases give aged aluminum alloys higher strength and are more likely to exhibit properties at low temperatures that are inconsistent with those of the other states [16,17]. Moreover, for most current studies, the lowest temperature is 77 K, which is the temperature of liquid nitrogen [18,19]. There are fewer studies on the evolution of properties and microstructure characteristics at ultralow temperatures. With the development of the space industry, the liquid hydrogen storage tank is increasingly widely used. Therefore, it is necessary to study the microstructure and properties of Al–Li alloys from room temperature to cryogenic environments.
In this study, tensile experiments were performed at 20 K–298 K with a temperature interval of 20 K, and the mechanical properties at different temperatures were identified. Fracture observation of the samples was carried out at typical temperatures. The degree of microzone deformation of the samples after fracture was further analyzed by electron back-scattered diffraction (EBSD), and the dislocation density in the aluminum alloy was quantitatively characterized by the modified Williamson–Hall method to explain the low-temperature enhancement from the dislocation perspective.

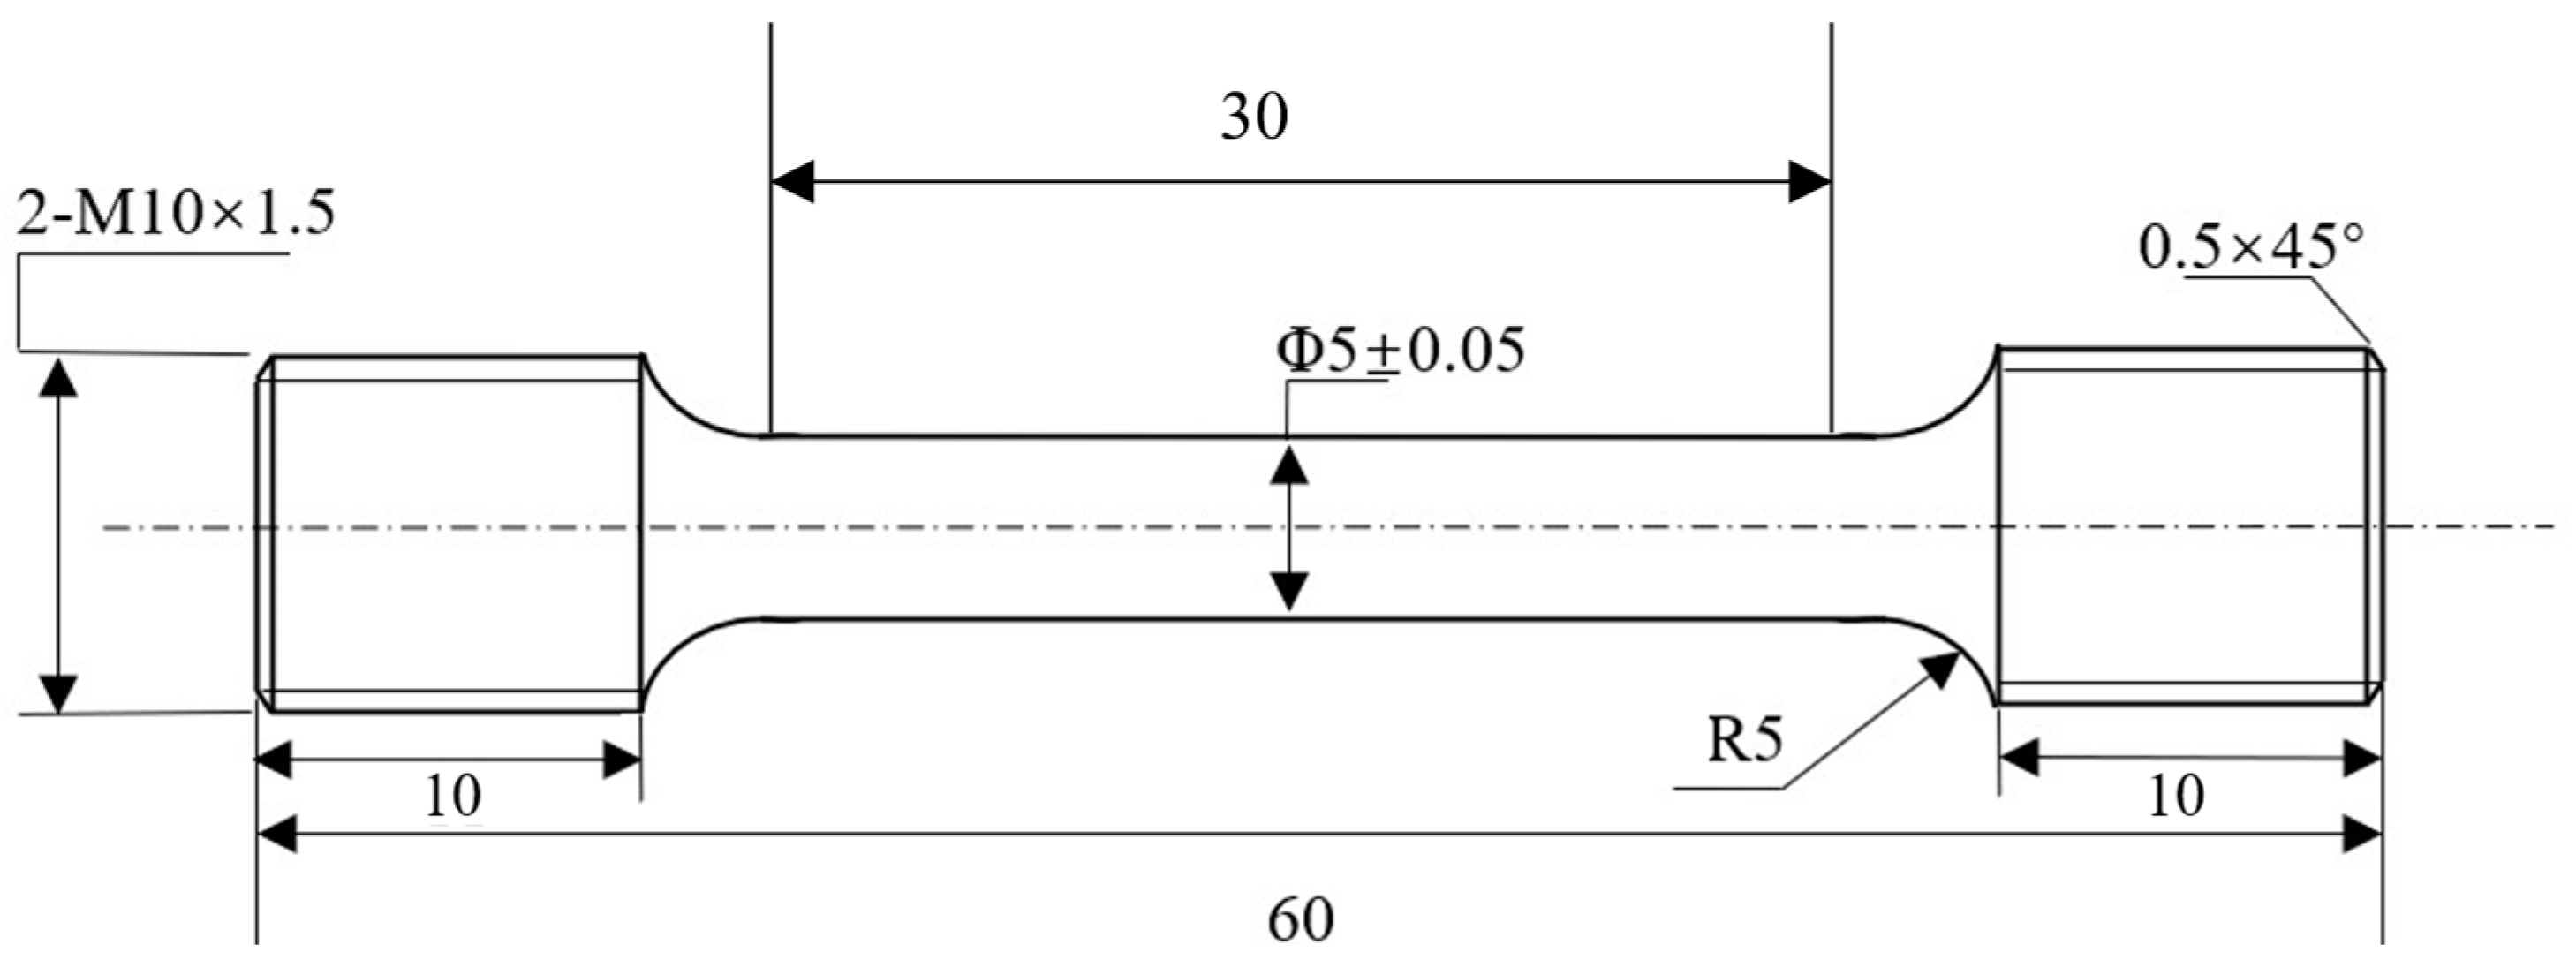
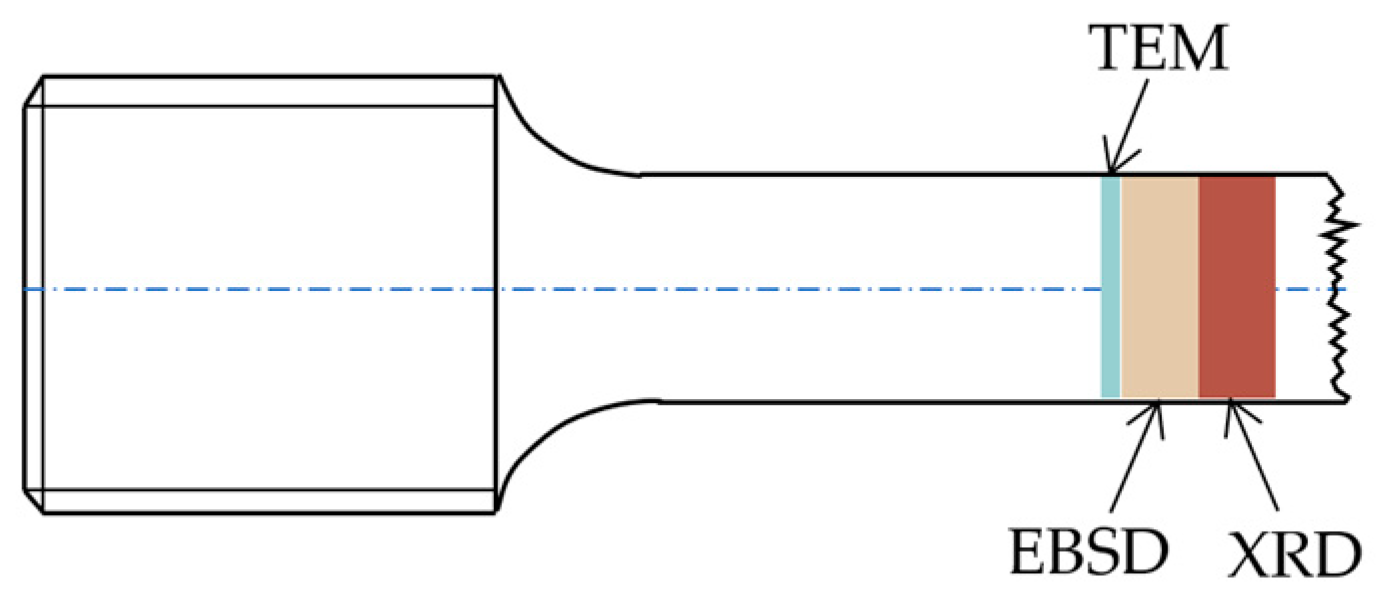
2. Materials and Methods

A typical Gen3 Al–Li alloy 2195 was chosen for this experiment, whose composition was Al-3.86Cu-0.89Li-0.38Mg-0.28Ag-0.12Zr-0.04Fe (wt. %). The alloy was supplied as a 15 mm thick plate in the T8 state. The specimens used for the tensile experiments were taken along the rolling direction; more details about the specimens are shown in Figure 1.
The loading speed was set to 2 mm/min, due to the fact that conventional extensometers cannot be used in cryogenic environments. The crossbeam displacement controlled the deformation rate before the experiments were start, the sample had to be held at the target temperature for 15 min. The tensile machine used for experiments in the range of 77 K to 298 K Was MTS WD-3100; the experiments in the range of 93 K to 298 K were conducted in a cryogenic environmental chamber, where liquid nitrogen was used as the coolant, using programmable temperature control, and the degree of precision for the equipment was 1 K; 77 K experiments were directly immersed in liquid nitrogen, at each temperature for three repeated experiments. The tensile machine used for experiments in the range of 20 K to 55 K was the ETM-105D model universal stretching machine, using mechanical refrigeration and programmable temperature control. The degree of precision for the equipment was 0.5 K, with two repeat experiments at each temperature.
The scanning electron microscope (SEM) model used for the experiments was JEOL JSM 7001F, and the accelerating voltage was 20~25 KV. The equipment was equipped with an electronic backscatter diffraction (EBSD) test system for qualitative analysis of the local strain distribution of the sample. The canning step was 1.00 microns. As shown in Figure 2, along the stretched samples from the fracture position, samples of 5 mm, 5 mm and 0.5 mm in length were taken in turn for the XRD, EBSD and TEM observations, respectively. The surface of observation was perpendicular to the rolling direction.
The dislocation density was calculated according to the modified Williamson–Hall method using the full width at half maximum (FWHM) of the X-ray diffraction peak. The equipment model was Bruker D8 Advance X with a Cu Kα radiation (λ = 0.15418 nm). The working voltage was 40 kV and the current was 40 mA. The range of the incident angle was 10° to 90° at the scanning rate of 1°/min, while the canning step was 0.02°. The obtained data were fitted using the Lorentz function to obtain the value of the FWHM. The details of the calculation method are described in later chapters.
The samples for EBSD were roughly ground by sandpaper, and mechanically polished, and then they were electrolytically polished using a solution of 10% HClO4 and 90% C2H5OH at 30 V for 7 s. The model of the transmission electron microscope was Tecnai G2F20S-TWIN. The thin foils for TEM observation were initially prepared by mechanical grinding to a thickness of 50 µm, and then polished in a solution at 241 K with a twin-jet electropolisher operating at 15 V. The solution consisted of 25% CH3OH and 75% HNO3.

3. Results and Discussion

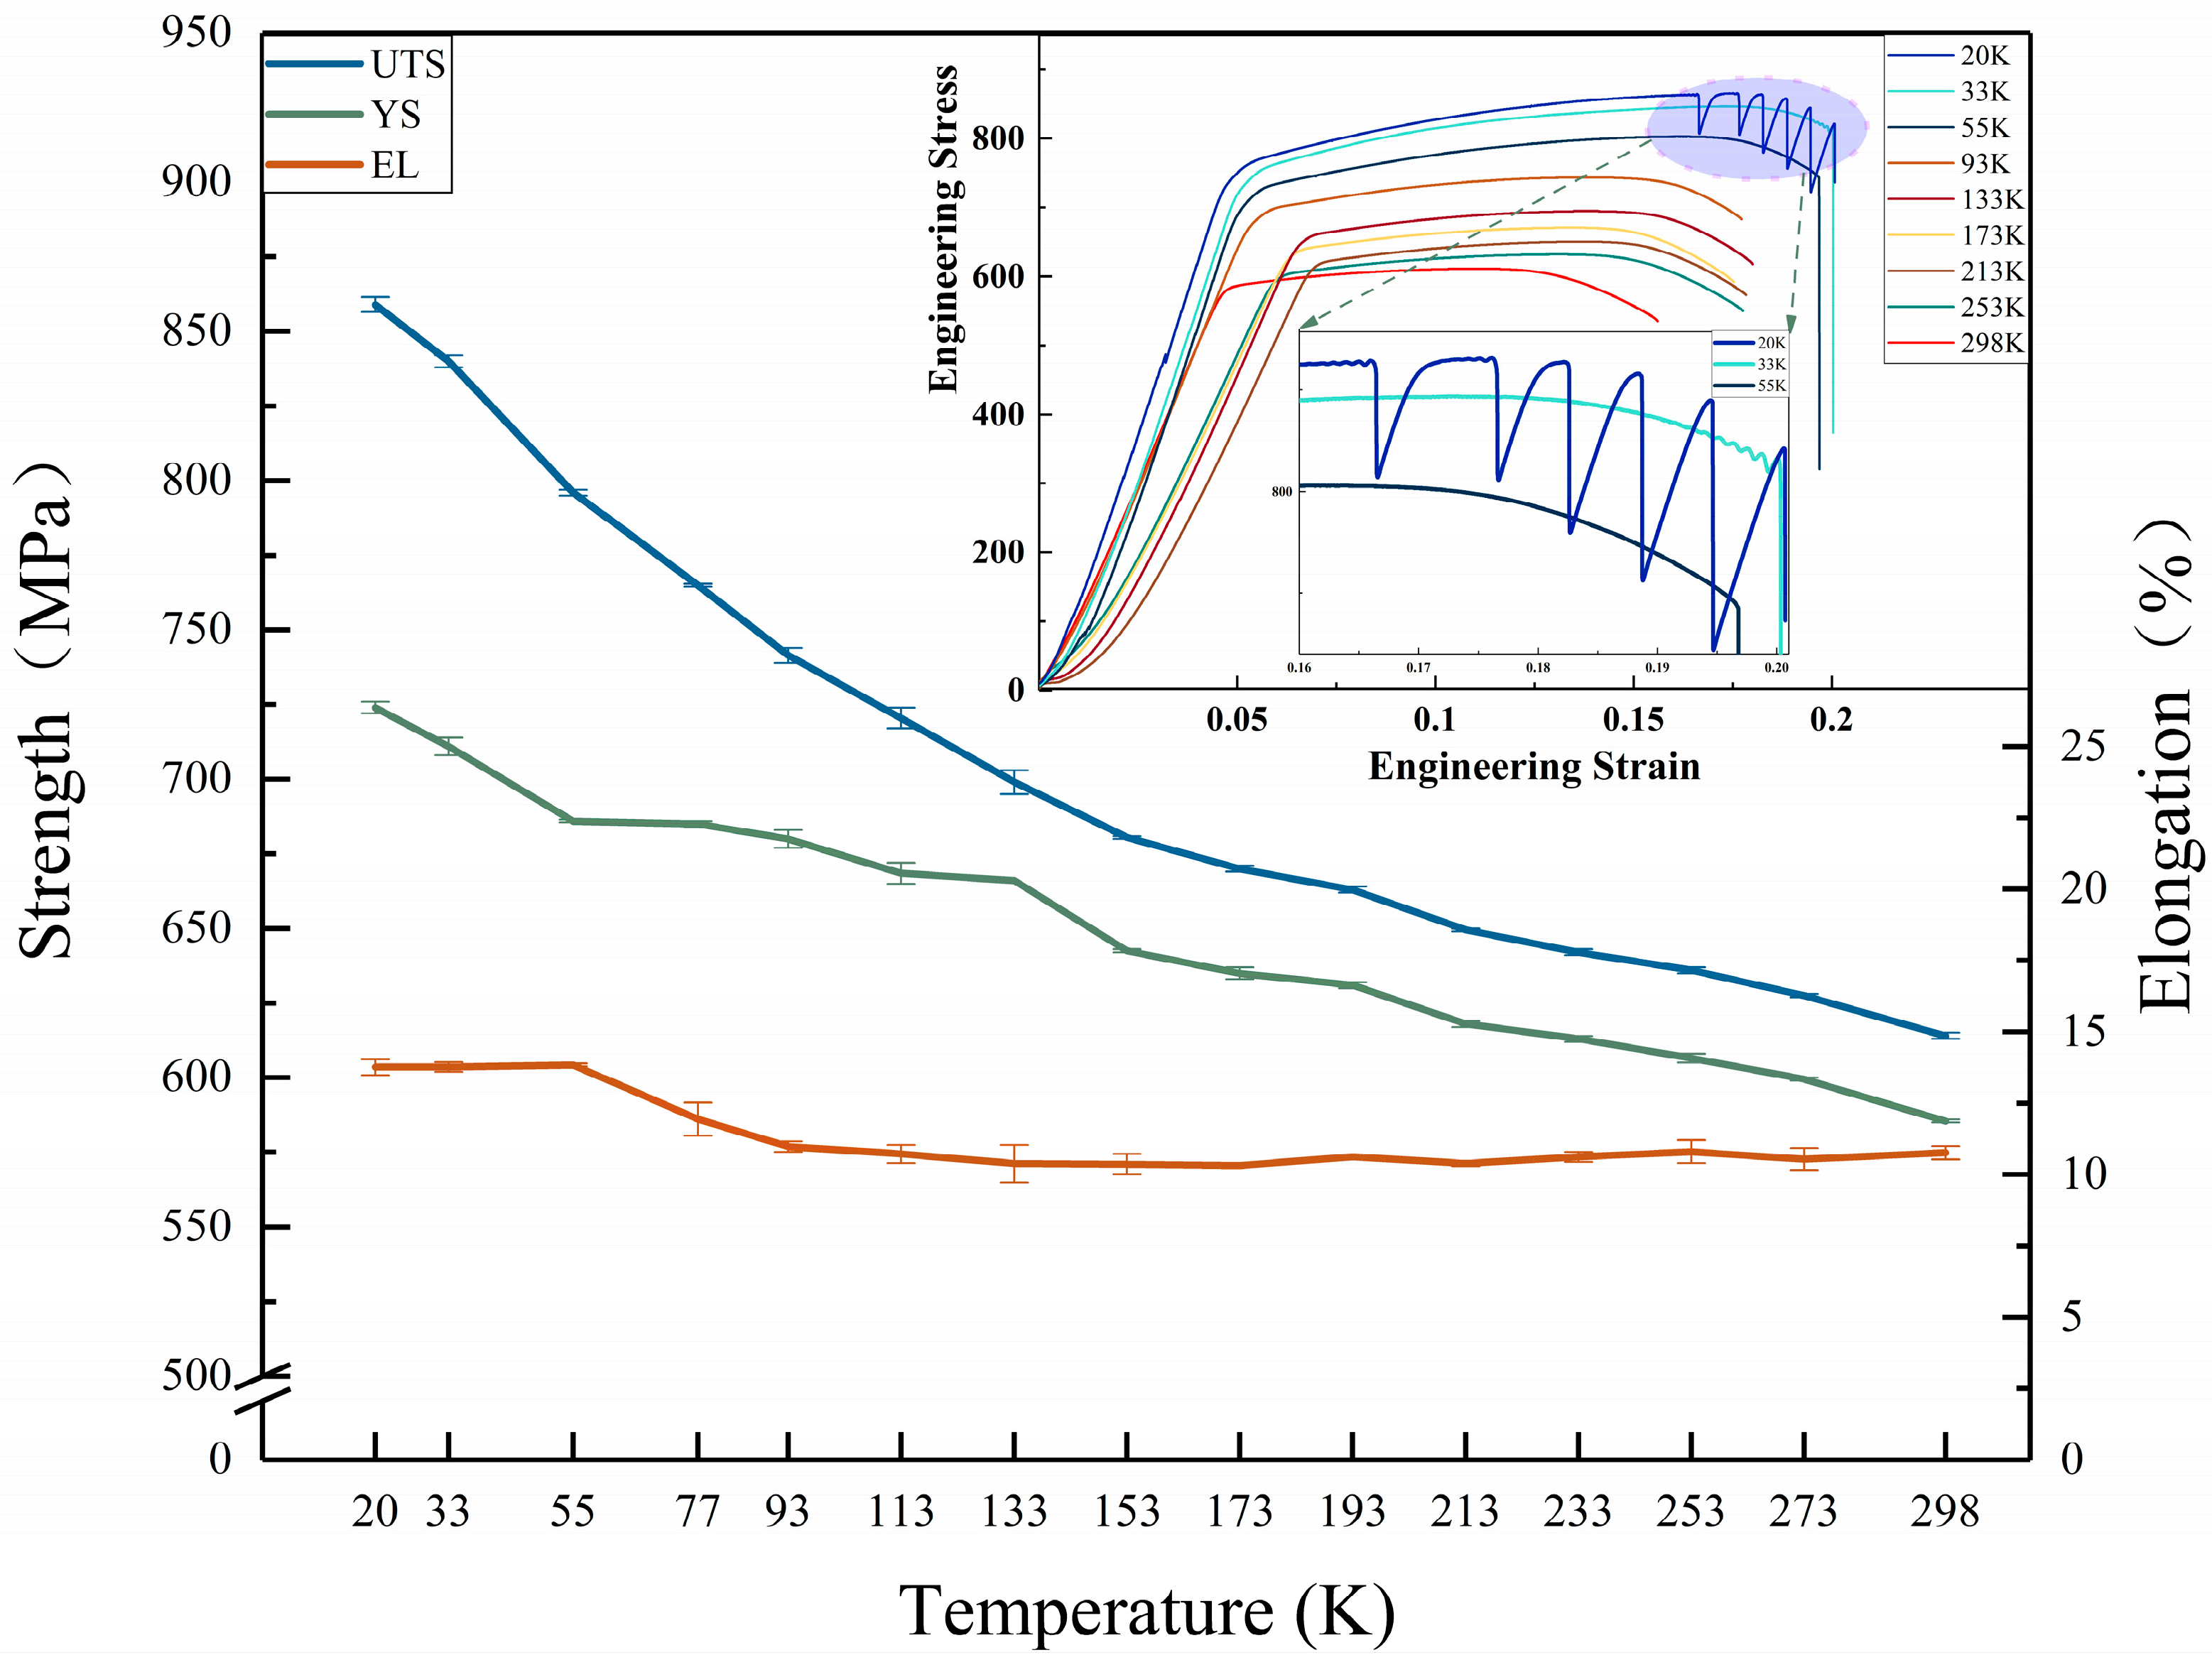
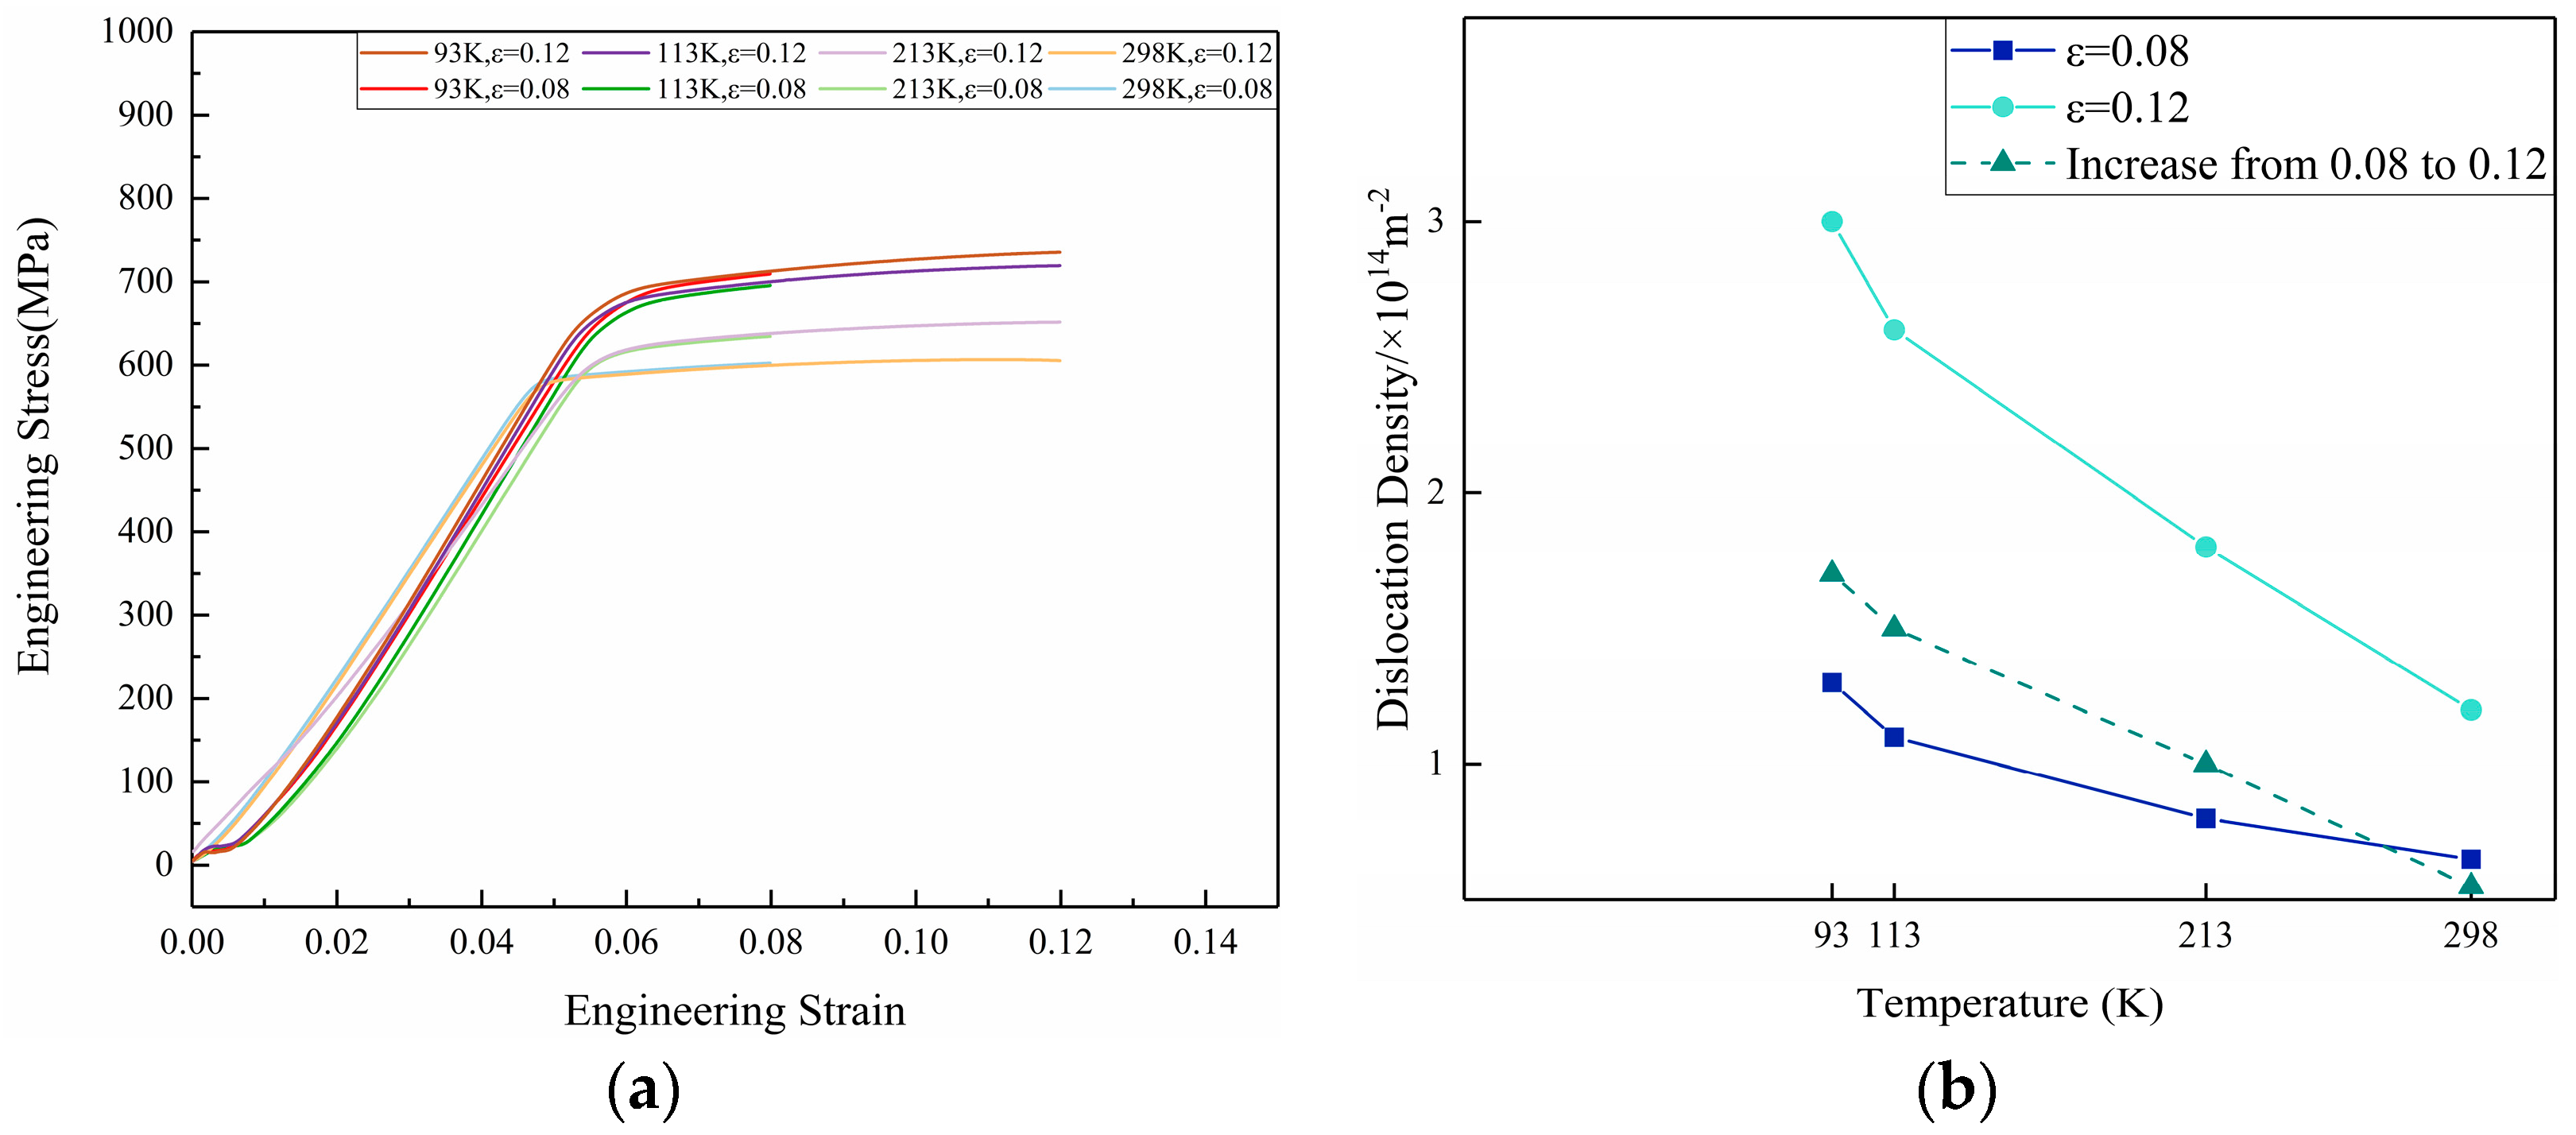
3.1. Mechanical Properties

Figure 3 shows the stress–engineering strain curves and mechanical properties of the 2195-T8 at different temperatures, including the yield strength (YS), the ultimate strength (UTS), and the elongation to fracture (EL). When the temperature is above 133 K, the ultimate strength increases slowly, and the strength increases sharply after the temperature continues to decrease. The ultimate strength of the value at 298 K is 614 MPa. When the temperature drops to 20 K, the value increases to 859 MPa, and the incremental percentage is 39.9%. While the yield strength increases slowly with the decrease in temperature, the overall curve is linear. The yield strength of the value at 298 K is 586 MPa. When the temperature drops to 20 K, the value increases to 724 MPa, and the incremental percentage is 23.5%. In the range of 133 K to 298 K, the gap between ultimate strength and yield strength is maintained at about 30 MPa; when the temperature drops below 133 K, the gap becomes larger and larger, going up to 135 MPa at 20 K. The elongation is about 11% in the range of 93 K–298 K, and increases to 14% after the temperature drops to 55 K. From the stress–engineering strain curves at 33 K and 20 K, we can see the jumps in the deforming stress, which has been termed “serrated deformation” (SD). Unlike the Portevin–Le Chatelier effect (PLC) [18,20,21], SD has also been found in ultralow temperature tensile experiments on pure metals, and it has been found that plastic deformation at low temperatures is often intermittent, which is considered to be one of the most important characteristics of low temperature plasticity [22]. Furthermore, the lower the temperature, the more severe the sawtooth phenomenon. As shown in the figure, only slight fluctuations appear on the stress–strain curve at 33 K, while large sawtooth oscillations appear at 20 K conditions. Pustovalov [22] correlates the jumps with an avalanche-like nucleation of mobile dislocations or with dislocation pileups breaking through barriers.
The relationship between yield stress and temperature in aluminum alloys can be explained by the dislocation theory, in which the yield stress is equal to the sum of the short-range and long-range resistance to the available dislocations. As the lattice thermal vibration energy becomes smaller at low temperatures, the external force required for dislocation movement across the potential barrier increases, i.e., the short-range resistance (Peierls–Nabarro force) increases with the decrease in temperature; for the long-range force, the long-range resistance does not change much with the decrease in temperature because the external force required for dislocation climbing is not very large, so the yield strength increases at low temperatures. After entering the plastic deformation stage, the dislocation proliferation, slip and other behaviors are limited because of the low temperature, and the dislocation movement is suppressed, which reduces the frequency of cross-slipping. After entering the plastic deformation stage, the dislocation proliferation and slip are restricted because of the low temperature, and the dislocation motion is inhibited, which reduces the frequency of cross-slipping, so the tensile strength also increases with the decrease in temperature. In summary, the tensile properties of the alloy increase significantly at cryogenic temperatures.

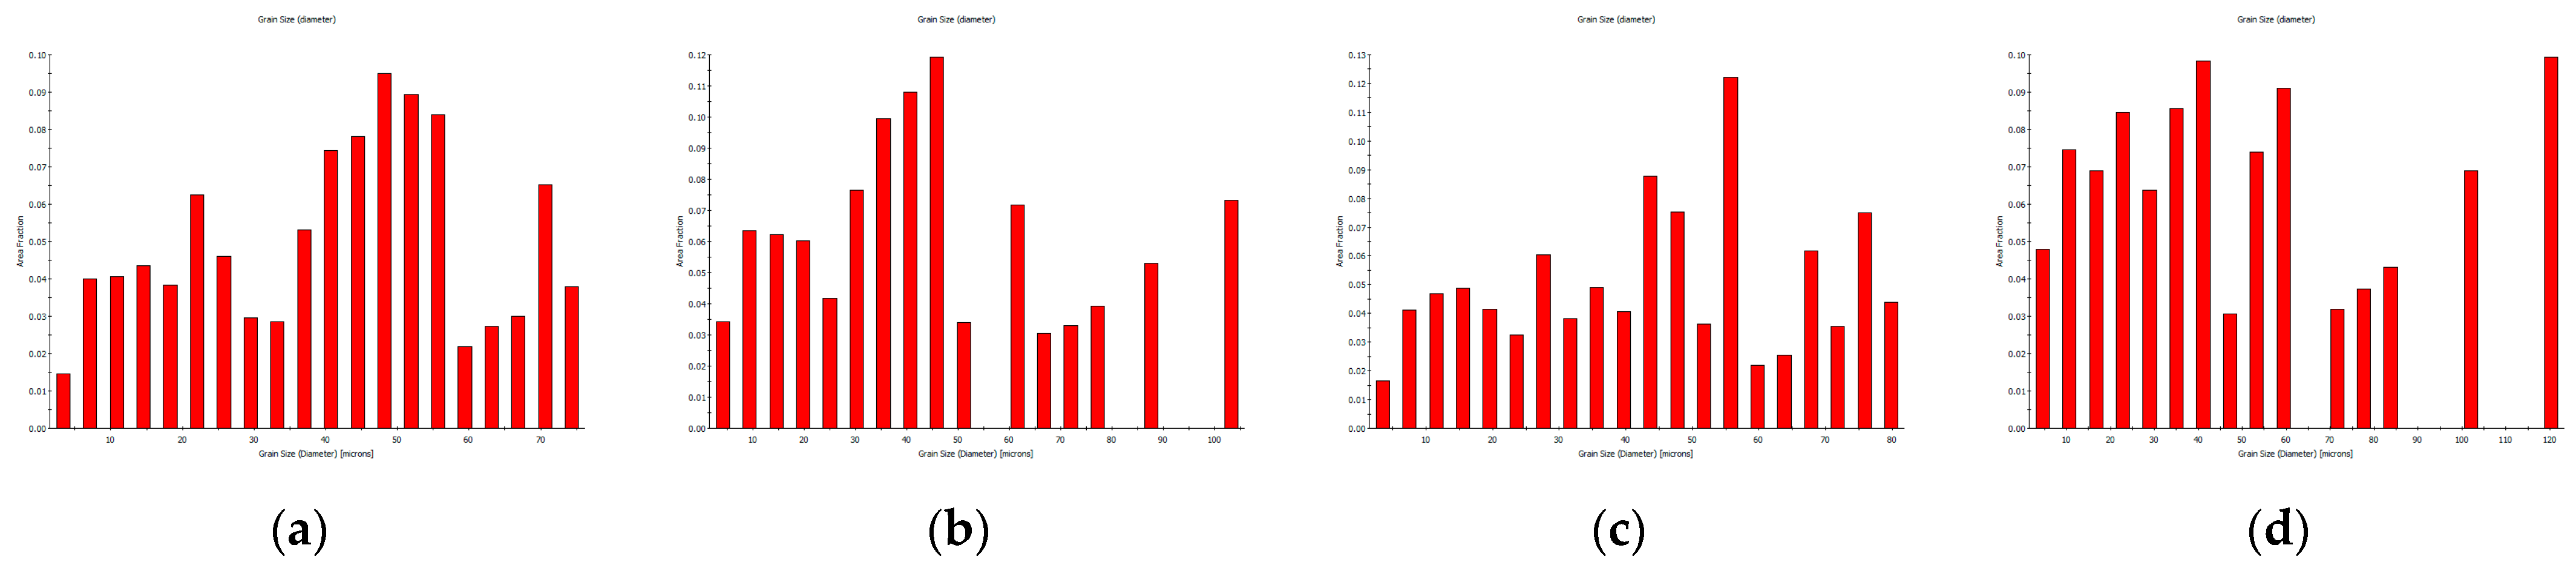
3.2. Microstructures after the Tensile Test

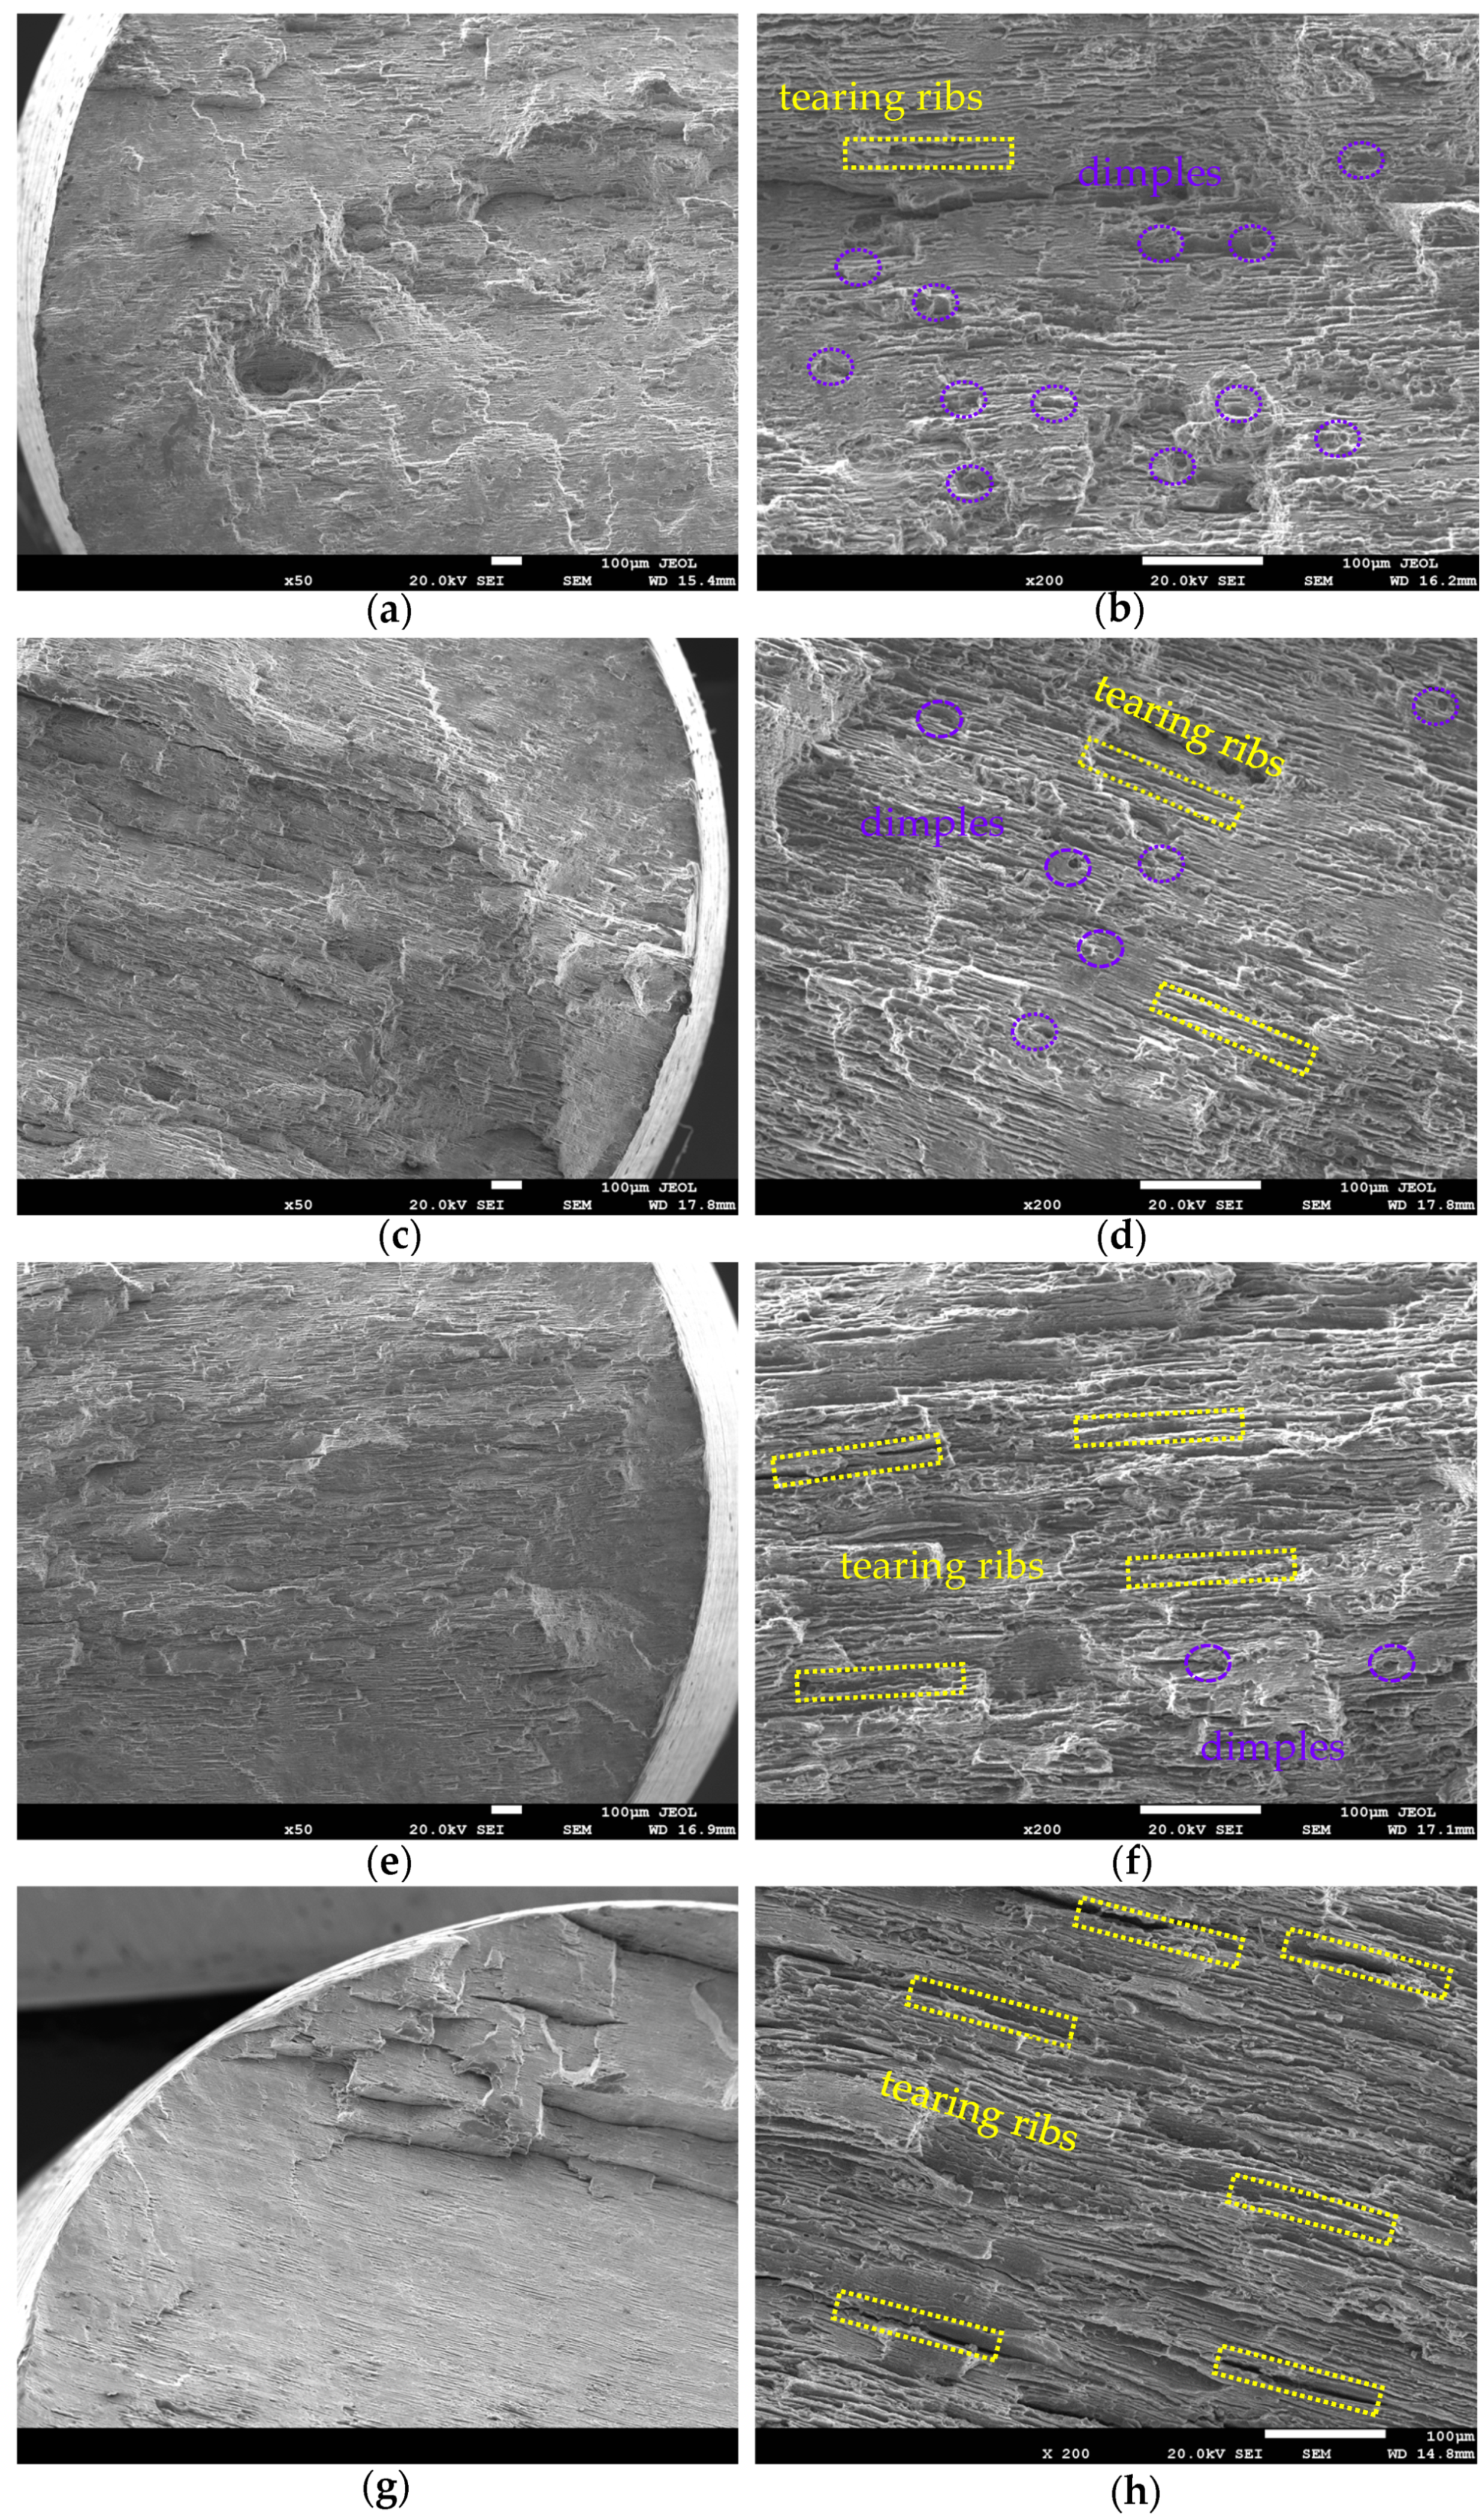
3.2.1. Fracture Surfaces Analyses

As can be seen from Figure 3, the ultimate strength increases at an accelerated rate when the temperature drops below 113 K. In order to investigate the effect of temperature on tensile properties, we chose four temperatures, 298 K, 213 K, 113 K and 20 K, for the observation of sample fracture. The results are shown in Figure 4. It can be seen that the fracture morphology mainly consists of dimples and tearing ribs with different lengths. At room temperature, the fracture surface undulates, the tearing ribs are short, and there are many dimples dispersedly distributed on the fracture surface. The fracture mode for the sample at room temperature is ductile fracture. As the temperature decreases, the number of dimples gradually decreases, and the tearing ribs become longer and more profound. When the temperature is 20 K, as shown in Figure 4g,h, the fracture morphology appears to be an obvious platform while its surface is relatively smooth. Steps exist between platforms, dimples almost disappear, and tearing ribs become deeper. At this moment, the fracture mode is typical brittle fracture. As for the samples at 213 K and 113 K, both ductile and brittle characteristics can be perceived and a transformation from ductile fracture to brittle fracture is exhibited. The variability of fracture morphology for the same loading rate and specimen size can be attributed to the decrease in deformation temperature, which implicitly suggests that low temperatures lead to a shift in the material fracture mode from ductile fracture to brittle fracture.

3.2.2. EBSD Analyses

In order to furtherly investigate the microstructure under various cryogenic temperatures, EBSD analysis was employed to reveal the details. Figure 5 shows the samples’ kernel average misorientation (KAM) at different stretching temperatures. KAM is the most commonly used method in regional mismatch angle analysis [23,24]. It is particularly suitable for illustrating the local strain distribution within a crystalline material after deformation. In the Figure 6, the orientation difference of the first nearest neighbor is calculated. The average KAM of the graphs a, b, c, and d are 0.97, 1.09, 1.24, and 1.36, respectively; warm colors indicate more significant local strains, while cool colors indicate more minor ones. As the temperature decreases, the color gradually becomes warm-toned, and the proportion of the area occupied by warm tones increases. This indicates the greater degree of plastic deformation in the samples and that more areas are involved in the deformation.
For tensile testing aluminum alloys, plastic deformation is mainly accomplished by dislocation slip. During the initial stage of deformation, different grains have different Schmidt coefficients. Grains with high Schmidt coefficients are more likely to activate the slip system, while the lower the Schmidt coefficient, the less likely the grains are to slip, so plastic deformation tends to be uneven [25]. The Schmidt factor was calculated as shown in Figure 7 and statistics of the data were shown in Figure 8, from which we can see that the lower the temperature, the higher the Schmidt factor of the samples after stretching, indicating greater deformation in this direction. This may be because the movement of dislocations is suppressed when deforming at lower temperatures. The lower the temperature, the lower the cross-slipping frequency of dislocations. Therefore, during deformation at low temperatures, the slip of grains with higher Schmidt factors is hindered, thus diminishing the role of Schmidt factors in plastic deformation and facilitating the deformation of grains with different Schmidt factors, which leads to an increase in the Schmidt factor of deformation in a specific orientation. [26].

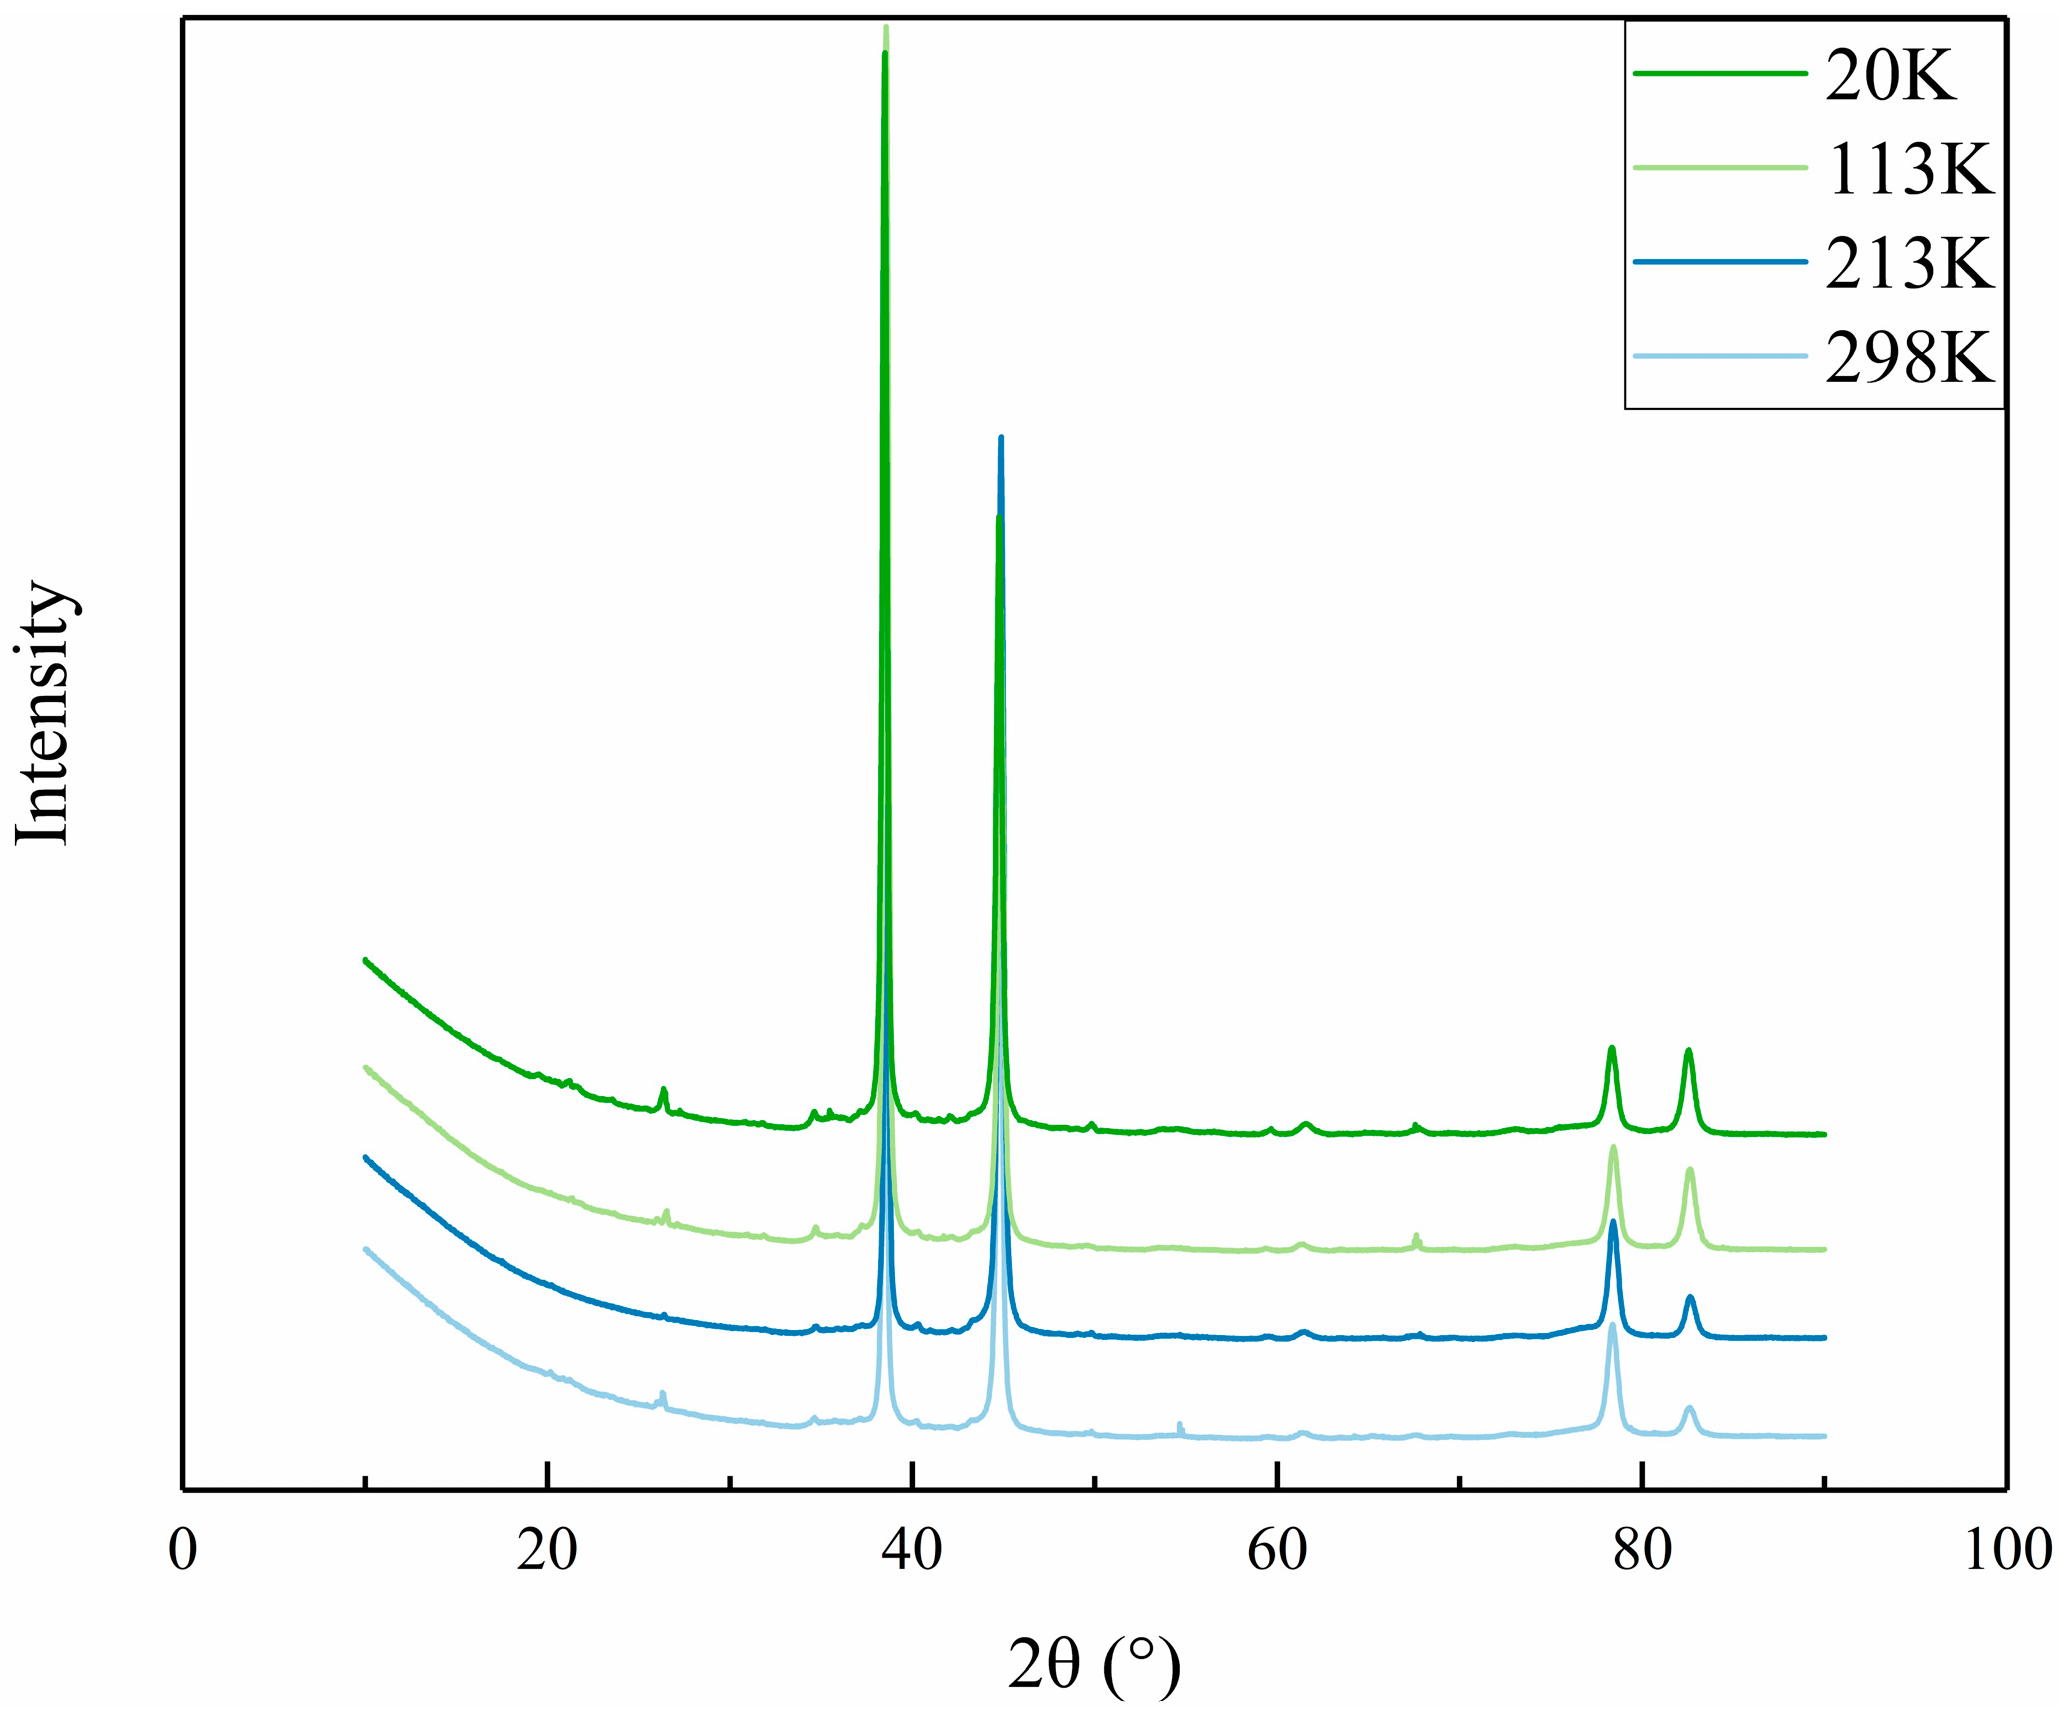
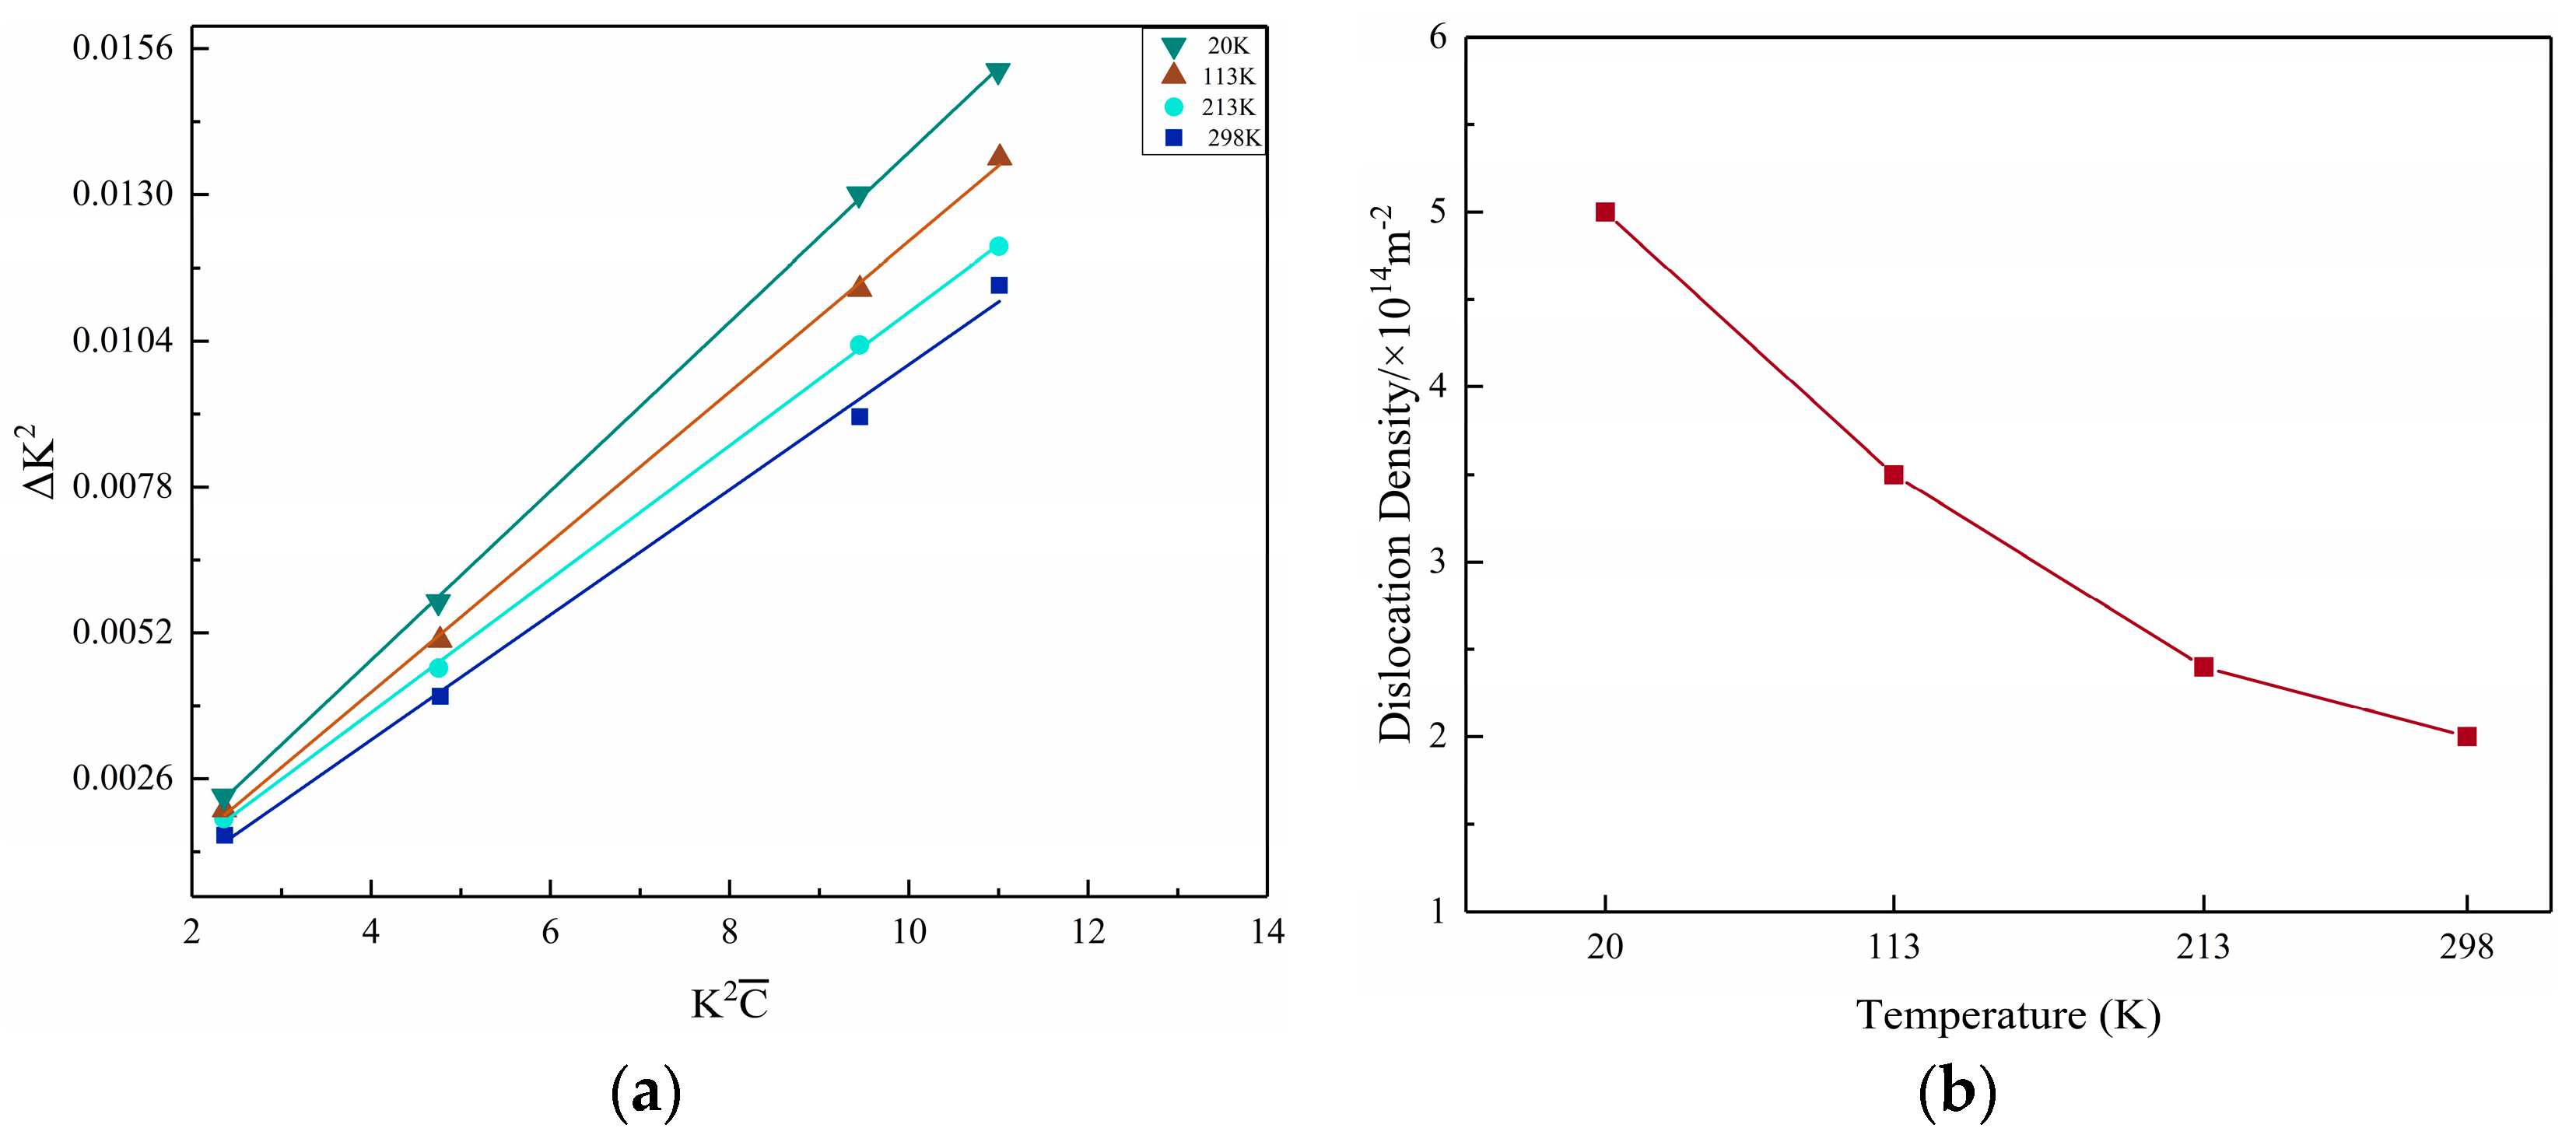
3.2.3. Dislocation Density Measurements

Through EBSD analysis, we found that the material deforms more uniformly and to a greater extent at cryogenic temperatures. At a lower deformation temperature, the related characteristics are more obvious. However, this only gives a phenomenological interpretation, which does not fundamentally explain the reason for the increased ultimate strength of the material.
The strength of a metallic material is highly dependent on how the dislocations move in the presence of external forces on the material. The more the dislocations are obstructed in the process of movement, the stronger the material is. In actual processes, the movement of dislocations is more complicated when plastic deformation of the material occurs; dislocations react with each other, dislocations are constantly blocked, and the second phase in the material hinders the movement of dislocations, thus increasing the strength of the material [27,28]. It is more difficult for atomic motion to at cryogenic temperatures; dislocation becomes more complex, and new dislocations are more likely to be created under increased stress, leading to an increased dislocation density. To verify this idea, we performed a dislocation density analysis on the postfracture sample.
Ideally, when Bragg diffraction occurs in crystals, the diffraction peak should be a function of δ and the peak width should be zero. In reality, the diffraction peak shows a certain peak shape and is accompanied by a broadening of the diffraction peak because both the instrument and the sample are not ideal. The peak width caused by the instrument can be corrected by measuring the standard sample, while the peak width caused by the sample itself depends on the grain size, microstrain caused by defects such as dislocations, stacking fault and twins, elemental concentration gradients, etc. [29]. The study of the peak shape of Bragg diffraction peaks has become an important tool used to characterize defects within a material [13,14,15], and the corresponding theoretical model is needed to relate the defects of a material to the variation in the peak shape [30,31]. The modified Williamson–Hall method can relate the peak widths of different diffraction peaks to the dislocation density of a material, and then derive the approximate range of the dislocation density. This method has been widely used for the semiquantitative calculation of dislocation density because it was proposed earlier and is intuitive and easy to understand. The formula is shown as follows [30].
Δ K = 0.9 L + 0.5 π A 2 b 2 1 2 ρ 1 2 K C 1 2
In the formula, ∆K = cos θ [∆(2θ)]/λ; K = 2sinθ/λ, where θ is the diffraction angle, ∆(2θ) is the half-height width of the diffraction peak, λ is the wavelength of X-rays, L is the coherent scattering volume size; and A is a dimensionless constant and depends on the effective outer cutoff radius of the dislocation, whose specific meaning and expression are detailed in the literature [32]. b is the Burgers vector, and C is the average contrast factor of dislocations on a particular crystal plane, its value being influenced by the elastic constant of the crystal, the dislocation type, and the crystal plane index. The formula is shown as follows.
C = C h 00 ( 1 q h 2 k 2 + k 2 l 2 + h 2 l 2 h 2 + k 2 + l 2 )
In the formula, h, k, and l are the Miller factors of the diffracted crystal plane, and C and q depend on the elastic constants C11 C12 and C44 of the material lattice; the detailed expressions are given in the literature [33,34,35].
Figure 9 shows the XRD data of the samples after stretching at different temperature conditions. The grain statistics of the samples after fracture at different temperatures are shown in Figure 10, which are extracted from above EBSD observations. It is clear that the stretching temperature has no significant effect on the grain size. Because the grain size of the material used in this experiment is around 40 µm, we can confidently attribute the broadening of the peak entirely to the increase in dislocation density. The density of dislocations in the material is positively correlated with the ratio of ∆K2 and K2C. The modified Williamsone-Hall Plots for the materials under various cryogenic temperatures are obtained according to the above equation, as shown in Figure 11a. The curves shows a good fit with the ideal linear, hence, the dislocation density can be calculated by this method versus the ambient temperature, as shown in Figure 11b.
As the temperature decreases, the dislocation densities are 2 × 10¹⁴ m−2, 2.4 × 10¹⁴ m−2, 3.5 × 10¹⁴ m−2 and 5 × 10¹⁴ m−2, respectively. The dislocation density value at a temperature of 20 K possesses a magnitude of more than two times value than that of 298 K. It can be seen that dislocation density varies exponentially with temperature. The trend of dislocation density with temperature is consistent with the variation of intensity with temperature.
In order to investigate the evolution of dislocation density during low-temperature stretching, we conducted experiments on the same material with different stretching amounts. As shown in Figure 12a, after the material reached the yield, the material was controlled to produce different deformations at different temperatures within the fracture limit. Then, the samples were cut at the parallel section of the sample for XRD analysis, the dislocation densities in the samples at different temperatures and different deformation conditions were obtained by calculation, and the details were consistent with those described previously. Figure 12b shows the dislocation density after different deformations at different temperatures. It can be seen that when increasing the same amount of deformation, the lower the temperature is, the more the dislocation increases, which indicates that the lower the temperature is, the more difficult it is for deformation to occur and the more excellent the resistance to deformation is. This is an essential reason for the increased strength of the material at cryogenic temperatures.

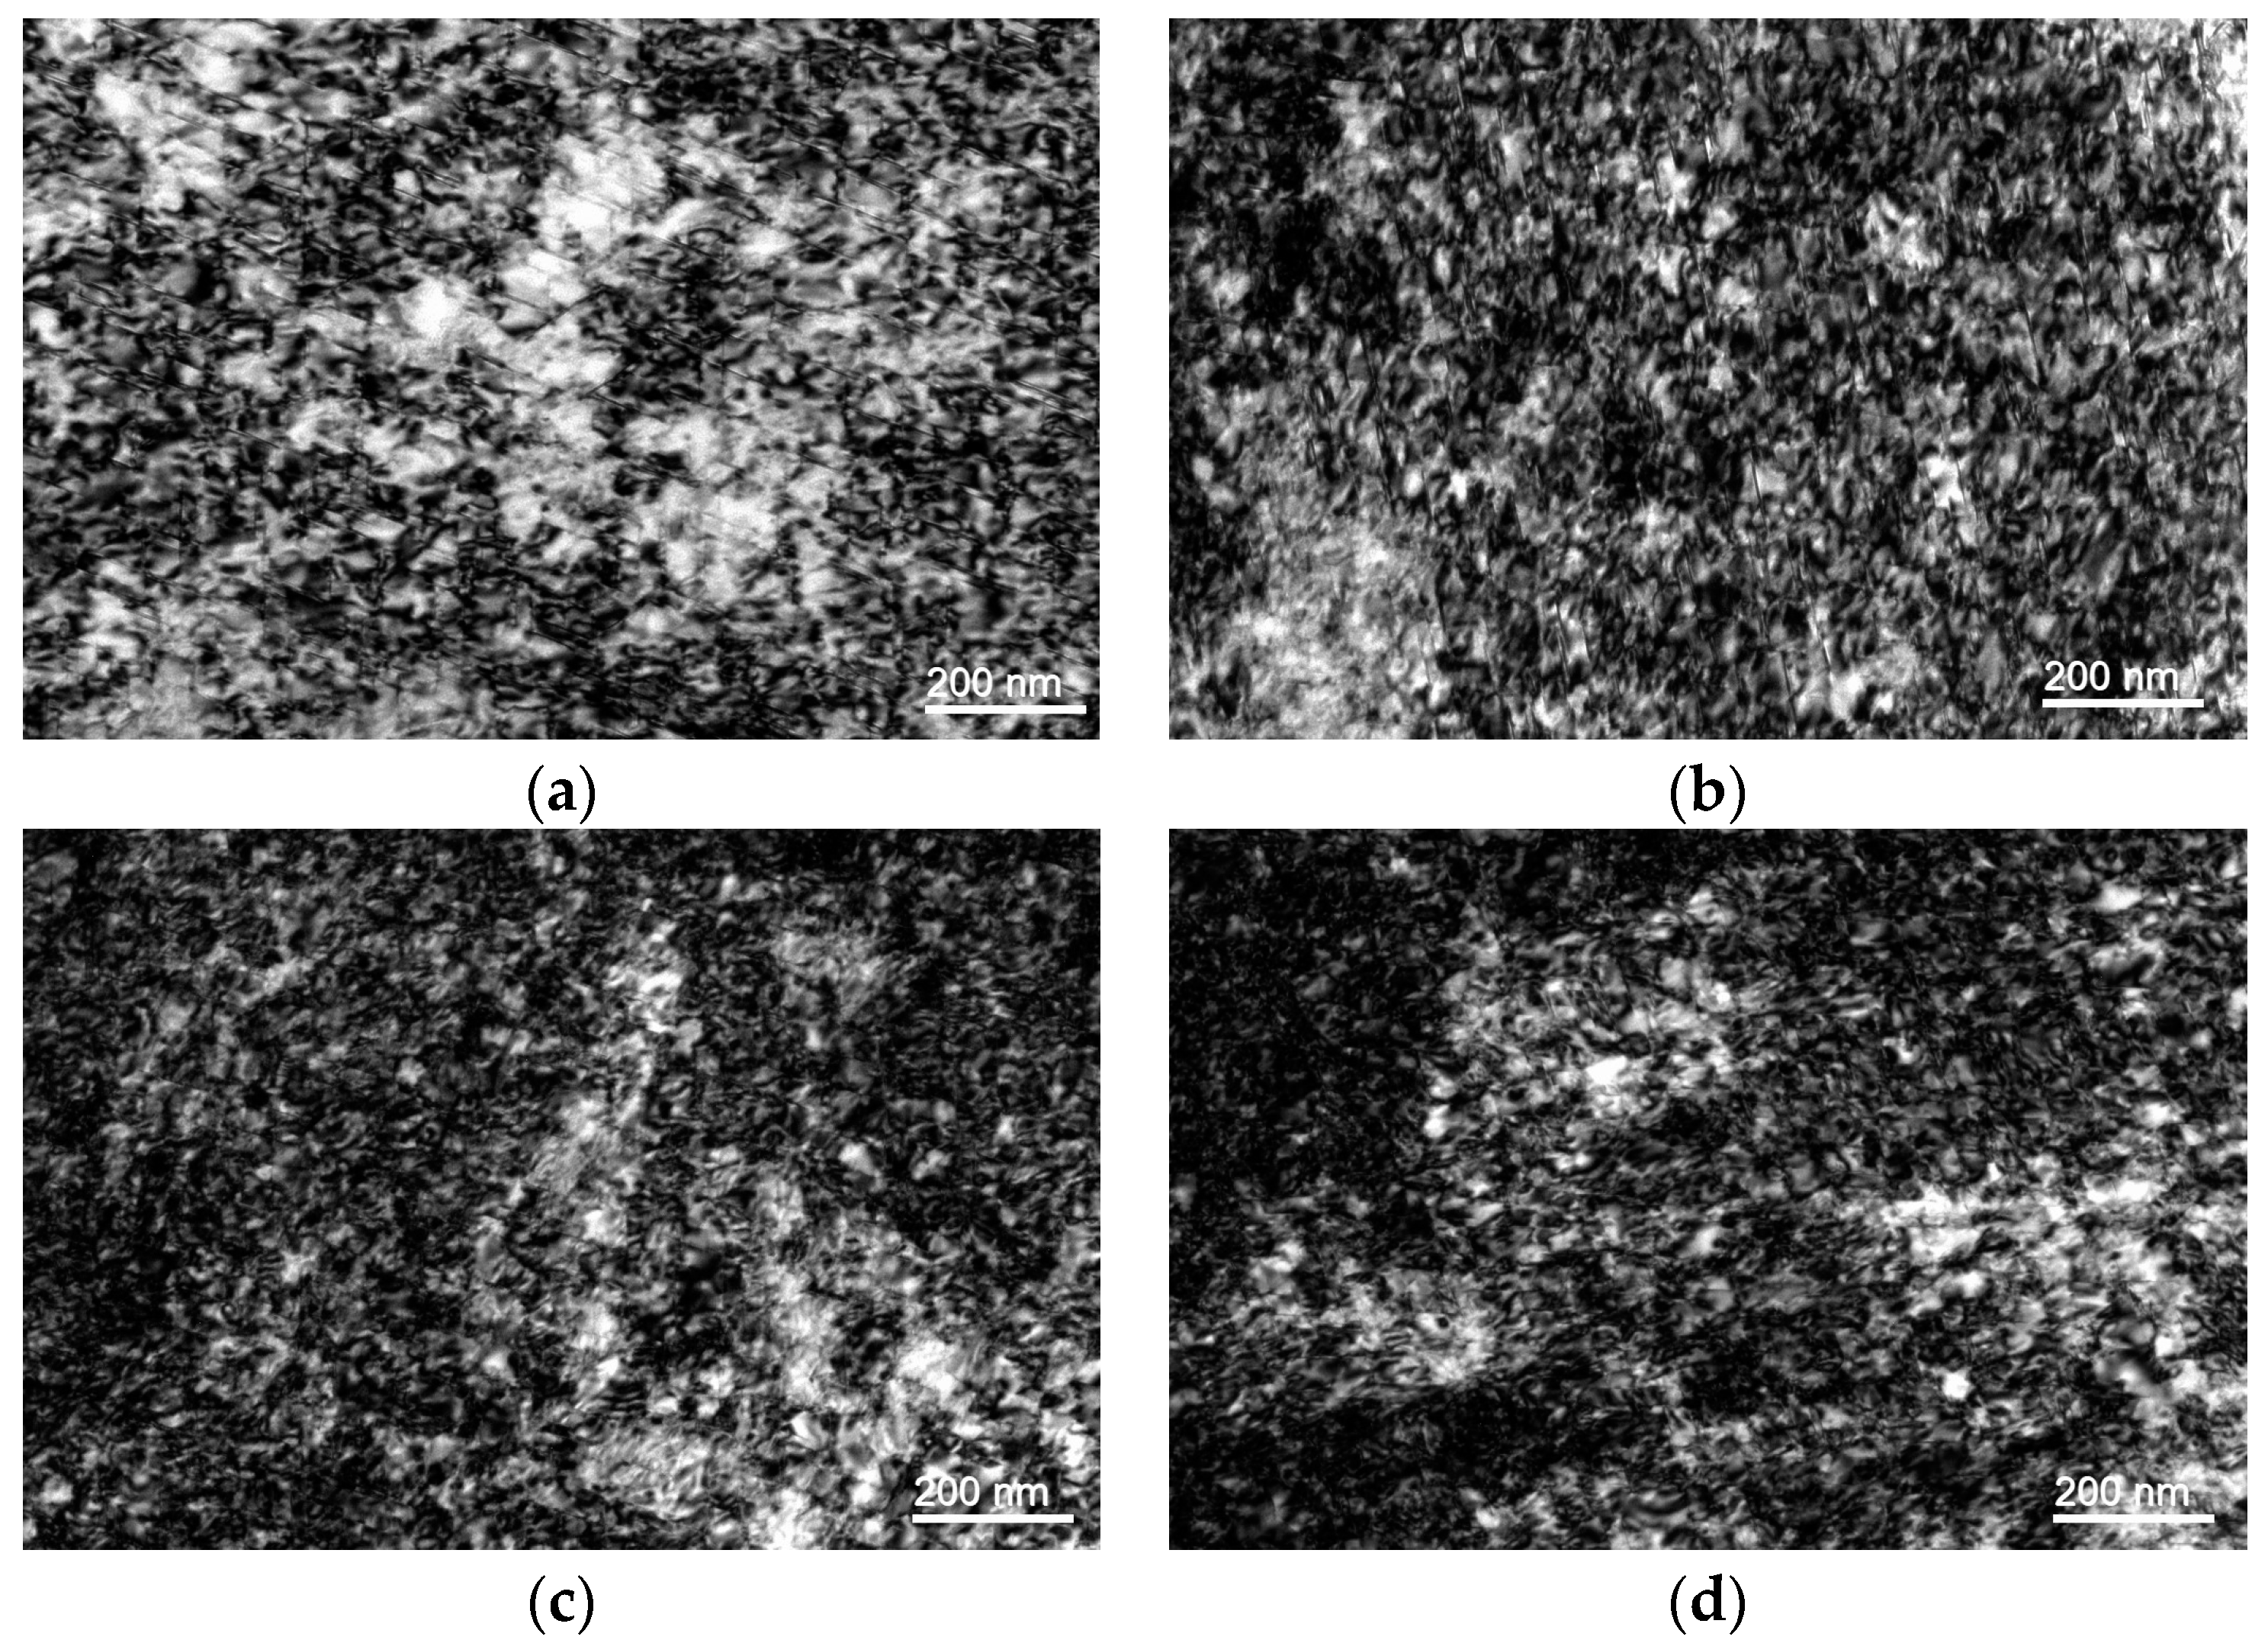
3.2.4. Dislocation Structures

In order to furtherly analyze the dislocations in the sample after fracture, TEM observations were performed on the samples at the same temperatures, as shown in Figure 13. Here we can see that high dislocation densities can be observed in the samples after fracture. The lower the temperature, the more obvious the dislocation characteristics. Especially for the samples at 113 K and 20 K, the dislocation distribution is quite dense. Additionally, we can see that the dislocations are evenly distributed in the matrix. while no obvious dislocated cells are observed. From previous studies, it is known that the T1 phase is an important strengthening phase for the 2195 Al–Li alloy, and that it is disc-shaped, and diffusely distributed in the aluminum matrix [16]. For the present alloy under cryogenic temperatures, the numerous and evenly distributed dislocations make it hard for the interaction between dislocations and the T1 phase to occur. Meanwhile, the temperature decrease also sets barriers for dislocation movement and the frequency of cross-slipping is reduced. Furthermore, the increase in dislocation density with the decrease in deformation temperature furtherly exacerbates this. Finally, the strength of the alloy is apparently enhanced under cryogenic temperatures.

4. Conclusions

We can obtain the following conclusions by exploring the tensile properties and microstructure observation of the aged 2195 aluminum alloy at different temperatures.
(1)
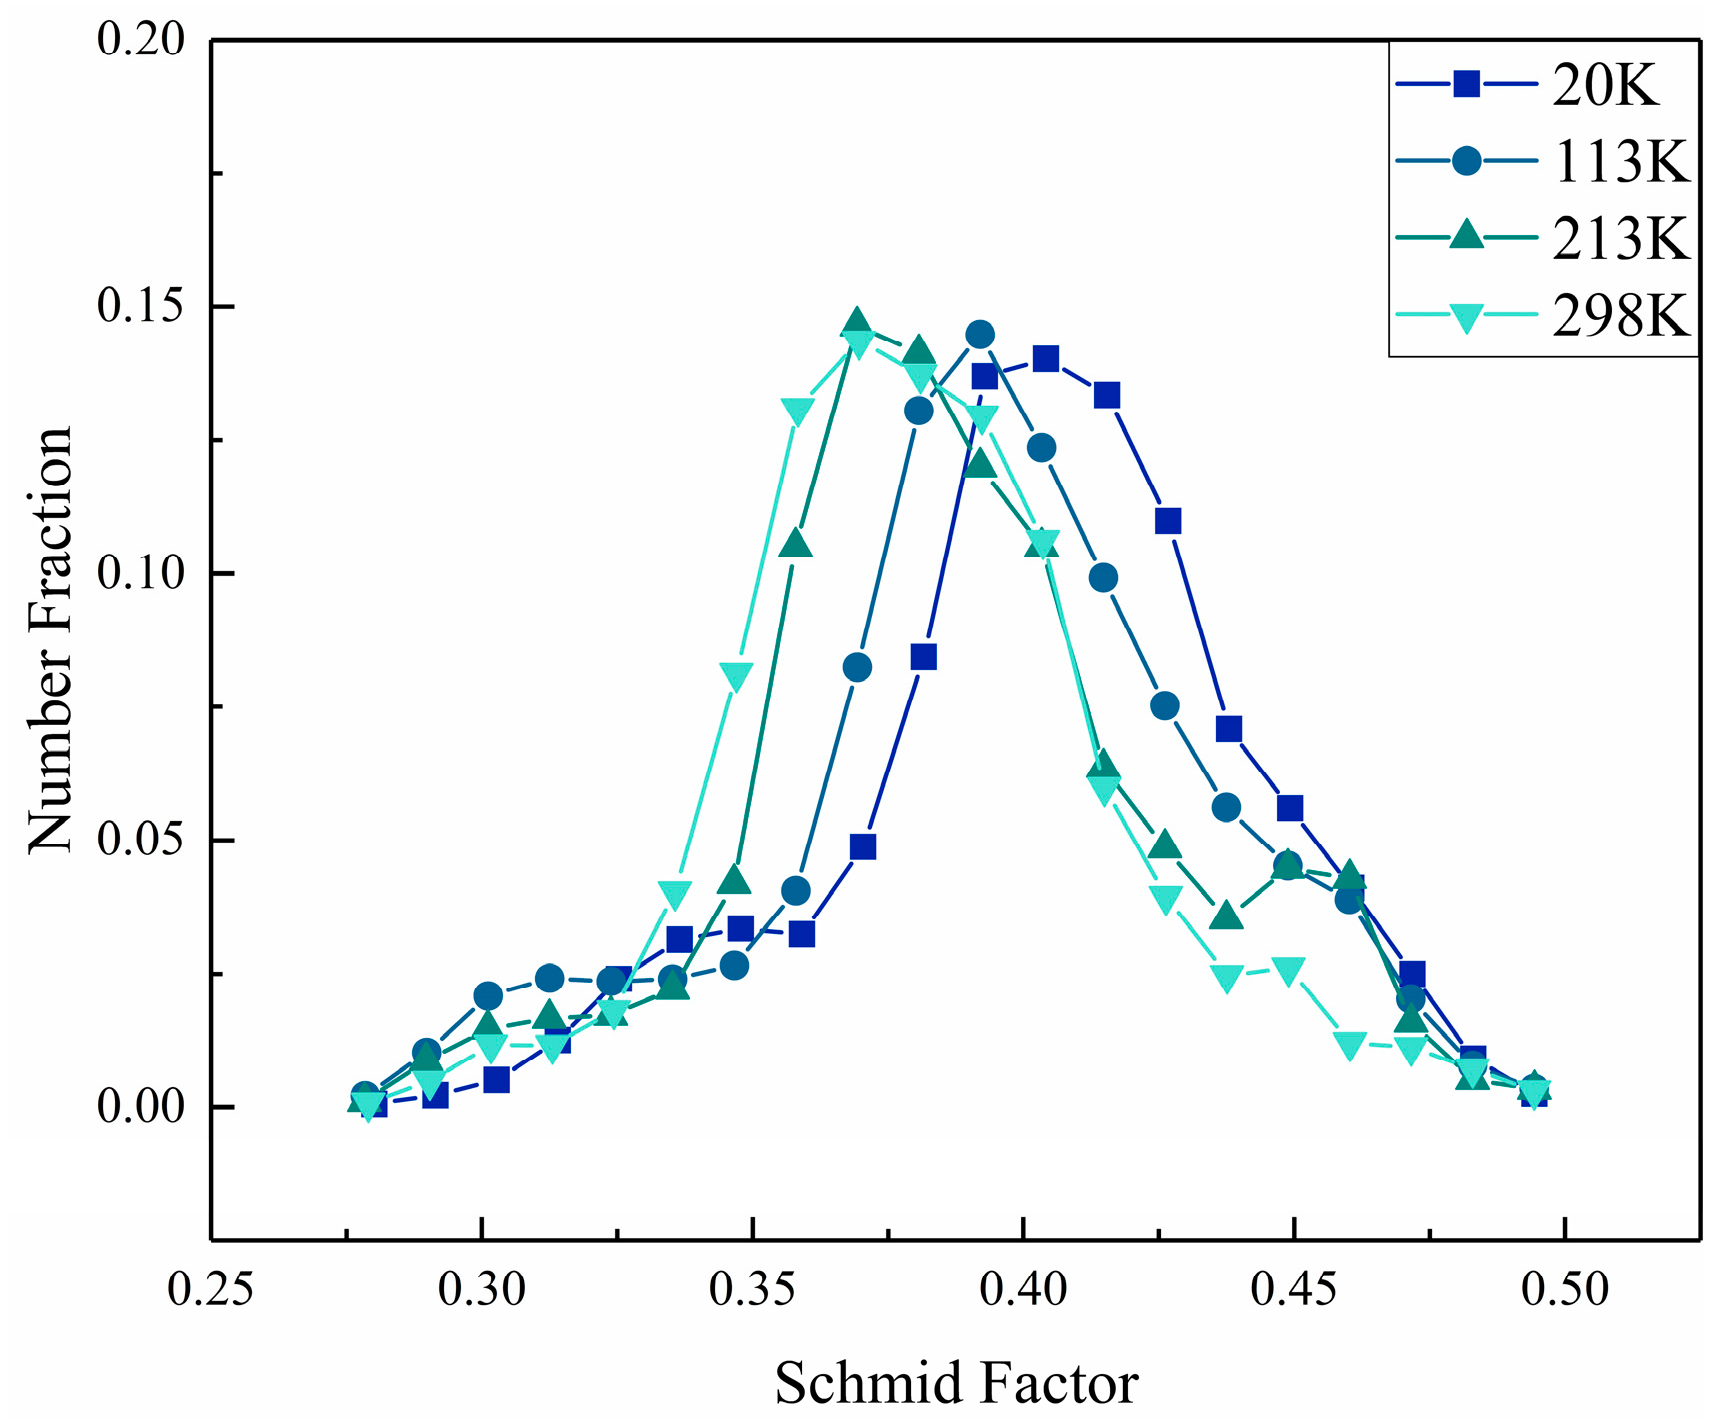
As the temperature decreases, the strength of the 2195-T8 alloy gradually increases; the lower the temperature, the more significant the increase in strength. However, elongation hardly changes.
(2)
Dislocation cross-slipping becomes more difficult as the temperature decreases. The increase in strength at cryogenic temperatures happens because more areas are involved in the deformation and because the deformation is more uniform. As the temperature decreases, the fracture mode gradually changes, and ductile fracture characteristics gradually disappear.
(3)
As the temperature decreases, the dislocation density follows the same trend as the material strength, and the increase in dislocation density is an important reason for the increase in material strength.

Author Contributions

Writing—original draft preparation and investigation, T.W.; writing—review and editing, methodology, K.W.; investigation and formal analysis, B.L.; validation and visualization, X.L. and Y.L.; resource and project administration, B.X.; conceptualization and supervision, Z.L. and Y.Z. All authors have read and agreed to the published version of the manuscript.

Funding

This study was supported by funding from the National Key R&D Program of China (no. 2020YFF0218200), the Innovation Fund Project of GRINM (no. 12370).

Data Availability Statement

Not applicable.

Conflicts of Interest

The authors declare no conflict of interest.

References

  1. Lin, Y.; Zheng, Z.; Li, S.; Kong, X.; Han, Y. Microstructures and properties of 2099 Al–Li alloy. Mater. Charact. 2013, 84, 88–99. [Google Scholar] [CrossRef]
  2. Giummarra, C.; Thomas, B.; Rioja, R.J. New aluminum lithium alloys for aerospace applications. In Proceedings of the Light Metals Technology Conference, Saint-Sauveur, QC, Canada, 24–26 September 2007. [Google Scholar]
  3. Kablov, E.N.; Antipov, V.V.; Oglodkova, J.S.; Oglodkov, M.S. Development and application prospects of aluminum–lithium alloys in aircraft and space technology. Metallurgist 2021, 65, 72–81. [Google Scholar] [CrossRef]
  4. Sova, B.J.; Sankaran, K.K.; Babel, H.; Farahmand, B.; Cho, A. Aging Optimization of Aluminum-Lithium Alloy L277 for Application to Cryotank Structures. In Proceedings of the AeroMat, Dayton, OH, USA, 1 January 2003; Available online: https://ntrs.nasa.gov/citations/20030068241 (accessed on 4 April 2023).
  5. Wang, D.; Huang, S.; Yi, Y.; He, H.; Li, C. Effects of cryogenic deformation on the microstructure and mechanical properties of high-strength aluminum alloys. Mater. Charact. 2022, 187, 111831. [Google Scholar] [CrossRef]
  6. Zhang, J.; Tan, W.; Wang, C.; Zhu, C.; Yi, Y. Cryogenic deformation behavior and microstructural characteristics of 2195 alloy. Metals 2021, 11, 1406. [Google Scholar] [CrossRef]
  7. Wang, C.; Zhang, J.; Yi, Y.; Zhu, C. Effect of pretreatment and cryogenic temperatures on mechanical properties and microstructure of Al-Cu-Li alloy. Materials 2021, 14, 4873. [Google Scholar] [CrossRef] [PubMed]
  8. Glazer, J. Mechanical behavior of aluminum-lithium alloys at cryogenic temperatures. Metall. Mater. Trans. A 1986, 18, 1695–1701. [Google Scholar] [CrossRef] [Green Version]
  9. Wang, C.; Yi, Y.; Huang, S.; Dong, F.; He, H.; Huang, K.; Jia, Y. Experimental and Theoretical Investigation on the Forming Limit of 2024-O Aluminum Alloy Sheet at Cryogenic Temperatures. Met. Mater. Int. 2021, 27, 5199–5211. [Google Scholar] [CrossRef]
  10. Jiang, J.; Wang, H.; Tong, M.; Jiang, F.; Zhang, M. Effect of cryogenic environment on tensile property and microstructure evolution of an Al-Mg-Sc alloy. Mater. Charact. 2023, 195, 112550. [Google Scholar] [CrossRef]
  11. Nayan, N.; Murty, S.; Jha, A.K.; Pant, B.; Sharma, S.C.; George, K.M.; Sastry, G.V.S. Mechanical properties of aluminium–copper–lithium alloy AA2195 at cryogenic temperatures. Mater. Des. 2014, 58, 445–450. [Google Scholar] [CrossRef]
  12. Humphreys, F.J.; Huang, Y.; Brough, I.; Harris, C. Electron backscatter diffraction of grain and subgrain structures—Resolution considerations. J. Microsc. 1999, 195, 212–216. [Google Scholar] [CrossRef]
  13. Masumura, T.; Inami, K.; Matsuda, K.; Tsuchiyama, T.; Nanba, S.; Kitahara, A. Quantitative evaluation of dislocation density in as-quenched martensite with tetragonality by X-ray line profile analysis in a medium-carbon steel. Acta Mater. 2022, 234, 118052. [Google Scholar] [CrossRef]
  14. Lan, J.; Shen, X.; Liu, J.; Hua, L. Strengthening mechanisms of 2A14 aluminum alloy with cold deformation prior to artificial aging. Mater. Sci. Eng. A 2019, 745, 517–535. [Google Scholar] [CrossRef]
  15. Zhong, Z.Y.; Brokmeier, H.G.; Gan, W.M.; Maawad, E.; Schwebke, B.; Schell, N. Dislocation density evolution of AA 7020-T6 investigated by in-situ synchrotron diffraction under tensile load. Mater. Charact. 2015, 108, 124–131. [Google Scholar] [CrossRef]
  16. Xie, B.; Huang, L.; Xu, J.; Su, H.; Zhang, H.; Xu, Y.; Li, J.; Wang, Y. Effect of the aging process and pre-deformation on the precipitated phase and mechanical properties of 2195 Al–Li alloy. Mater. Sci. Eng. A 2022, 832, 142394. [Google Scholar] [CrossRef]
  17. Feng, B.; Xiong, B.Q. Effect of Annealing Temperature on the Microstructure of 2195 Al–Li Alloy Sheet. MSF 2021, 1026, 49–58. [Google Scholar] [CrossRef]
  18. Härtel, M.; Illgen, C.; Frint, P.; Wagner, M.F.X. On the PLC effect in a particle reinforced AA2017 alloy. Metals 2018, 8, 88. [Google Scholar] [CrossRef] [Green Version]
  19. Kulkarni, S.S.; Starke, E.A., Jr.; Kuhlmann-Wilsdorf, D. Some observations on deformation banding and correlated microstructures of two aluminum alloys compressed at different temperatures and strain rates. Acta Mater. 1998, 46, 5283–5301. [Google Scholar] [CrossRef]
  20. Jiang, H.; Zhang, Q.; Chen, X.; Chen, Z.; Jiang, Z.; Wu, X.; Fan, J. Three types of Portevin–Le Chatelier effects: Experiment and modelling. Acta Mater. 2007, 55, 2219–2228. [Google Scholar] [CrossRef]
  21. Jiang, H.; Zhang, Q.; Wu, X.; Fan, J. Spatiotemporal aspects of the Portevin–Le Chatelier effect in annealed and solution-treated aluminum alloys. Scr. Mater. 2006, 54, 2041–2045. [Google Scholar] [CrossRef]
  22. Pustovalov, V.V. Serrated deformation of metals and alloys at low temperatures (Review). Low Temp. Phys. 2008, 34, 683–723. [Google Scholar] [CrossRef]
  23. Serrano-Munoz, I.; Fernández, R.; Saliwan-Neumann, R.; González-Doncel, G.; Bruno, G. Dislocation structures after creep in an Al-3.85% Mg alloy studied using EBSD-KAM technique. Mater. Lett. 2023, 337, 133978. [Google Scholar] [CrossRef]
  24. Shen, R.R.; Efsing, P. Overcoming the drawbacks of plastic strain estimation based on KAM. Ultramicroscopy 2018, 184, 156–163. [Google Scholar] [CrossRef] [PubMed]
  25. Xu, Z.; Roven, H.J.; Jia, Z. Mechanical properties and surface characteristics of an AA6060 alloy strained in tension at cryogenic and room temperature. Mater. Sci. Eng. A 2015, 648, 350–358. [Google Scholar] [CrossRef]
  26. Wang, C.; Zhang, J.; Zhu, C.; Yi, Y. Multi slip activation enabled excellent low-temperature strength-ductility synergy in Al–Cu–Li alloy. Vacuum 2022, 204, 111328. [Google Scholar] [CrossRef]
  27. Decreus, B.; Deschamps, A.; Donnadieu, P.; Ehrström, J.C. On the role of microstructure in governing fracture behavior of an aluminum–copper–lithium alloy. Mater. Sci. Eng. A 2013, 586, 418–427. [Google Scholar] [CrossRef]
  28. Liang, Z.Y.; Li, Y.Z.; Huang, M.X. The respective hardening contributions of dislocations and twins to the flow stress of a twinning-induced plasticity steel. Scr. Mater. 2016, 112, 28–31. [Google Scholar] [CrossRef]
  29. Serquis, A.; Zhu, Y.T.; Peterson, E.J.; Coulter, J.Y.; Peterson, D.E.; Mueller, F.M. Effect of lattice strain and defects on the superconductivity of MgB2. Appl. Phys. Lett. 2001, 79, 4399–4401. [Google Scholar] [CrossRef]
  30. Williamson, G.K.; Hall, W.H. X-ray line broadening from filed aluminium and wolfram. Acta Metall. 1953, 1, 22–31. [Google Scholar] [CrossRef]
  31. Bakshi, S.D.; Sinha, D.; Chowdhury, S.G. Anisotropic broadening of XRD peaks of α′-Fe: Williamson-Hall and Warren-Averbach analysis using full width at half maximum (FWHM) and integral breadth (IB). Mater. Charact. 2018, 142, 144–153. [Google Scholar] [CrossRef]
  32. Ungár, T.; Borbély, A. The effect of dislocation contrast on x-ray line broadening: A new approach to line profile analysis. Appl. Phys. Lett. 1996, 69, 3173–3175. [Google Scholar] [CrossRef]
  33. Ungár, T.; Ott, S.; Sanders, P.G.; Borbély, A.; Weertman, J.R. Dislocations, grain size and planar faults in nanostructured copper determined by high resolution X-ray diffraction and a new procedure of peak profile analysis. Acta Mater. 1998, 46, 3693–3699. [Google Scholar] [CrossRef]
  34. Masumura, T.; Takaki, S.; Tsuchiyama, T. Proposal of the parameters CH00 and Q required in the modified Williamson-Hall method Modified Williamson-Hall Ch00 q. Zair./J. Soc. Mater. Sci. Jpn. 2020, 69, 290–292. [Google Scholar] [CrossRef] [Green Version]
  35. Ungár, T.; Dragomir, I.; Révész, Á.; Borbély, A. The contrast factors of dislocations in cubic crystals: The dislocation model of strain anisotropy in practice. J. Appl. Crystallogr. 1999, 32, 992–1002. [Google Scholar] [CrossRef] [Green Version]
Figure 1. Illustration of specimen-processing dimensions.
Metals 13 00740 g001
Figure 2. Illustration of sampling location for microstructure observation.
Metals 13 00740 g002
Figure 3. Uniaxial tensile behavior and stress–strain curves of the 2195-T8 alloy at different temperatures.
Metals 13 00740 g003
Figure 4. Fracture surface morphologies of 2195-T8 at different temperatures: (a,b) 298 K; (c,d) 213 K; (e,f) 113 K; and (g,h) 20 K.
Metals 13 00740 g004
Figure 5. KAM diagrams of fractured samples at different temperatures: (a) 298 K; (b) 213 K; (c) 113 K; and (d) 20 K.
Metals 13 00740 g005
Figure 6. KAM chart of fractured samples at different temperatures: (a) 298 K; (b) 213 K; (c) 113 K; and (d) 20 K.
Metals 13 00740 g006
Figure 7. Schmid factor diagrams of fractured samples using {111} <1–10> at different temperatures: (a) 298 K; (b) 213 K; (c) 113 K; and (d) 20 K.
Metals 13 00740 g007
Figure 8. Schmid Factor of fractured samples at different temperatures.
Metals 13 00740 g008
Figure 9. XRD patterns of the sample after fracture at different aging temperatures.
Metals 13 00740 g009
Figure 10. Grain size of fractured samples at different temperatures: (a) 298 K; (b) 213 K; (c) 113 K; (d) 20 K.
Metals 13 00740 g010
Figure 11. Modified Williamsone−Hall plots and dislocation density of the sample after fracture at different temperatures; (a) modified Williamsone−Hall plots; (b) dislocation density.
Metals 13 00740 g011
Figure 12. Stress−strain diagram and dislocation density of the sample at different temperatures with different deformation amounts; (a) stress−strain diagram; (b) dislocation density.
Metals 13 00740 g012
Figure 13. Bright field TEM images showing the dislocation density seen in the sample after fracture; (a) 298 K; (b) 213 K; (c) 113 K; and (d) 20 K.
Metals 13 00740 g013
Disclaimer/Publisher’s Note: The statements, opinions and data contained in all publications are solely those of the individual author(s) and contributor(s) and not of MDPI and/or the editor(s). MDPI and/or the editor(s) disclaim responsibility for any injury to people or property resulting from any ideas, methods, instructions or products referred to in the content.

