Article

Preparation of Tannic Acid/Hyaluronic Acid Coating to Improve the Corrosion Resistance of Implant Material Based on AZ31B Magnesium Alloy

by
Aurelia Salsabila
1,†,
Aditya Pratama
1,†,
Andrieanto Nurrochman
2,
Hendra Hermawan
3,
Anggraini Barlian
4 and
Ekavianty Prajatelistia
1,*
1
Department of Materials Science and Engineering, Bandung Institute of Technology, Bandung 40132, West Java, Indonesia
2
Department of Mining Engineering, Universitas Islam Bandung, Bandung 40116, West Java, Indonesia
3
Department of Mining, Metallurgical and Materials Engineering, Laval University, Quebec City, QC G1V 0A6, Canada
4
Department of Life Sciences and Technology, Bandung Institute of Technology, Bandung 40132, West Java, Indonesia
*
Author to whom correspondence should be addressed.
These authors contributed equally to this work.
Metals 2023, 13(3), 494; https://doi.org/10.3390/met13030494
Submission received: 1 February 2023 / Revised: 17 February 2023 / Accepted: 21 February 2023 / Published: 28 February 2023

Abstract

:
Magnesium (Mg) has good biocompatibility, making it suitable as an implant material. However, Mg has a high corrosion rate because of the reaction between magnesium implants and fluids in the human body. To lower the corrosion rate of magnesium alloys, it is necessary to perform a coating process using tannic acid (TA) and hyaluronic acid (HYA), as we have done in this study. TA, an active ingredient, is relatively inexpensive, easy to find, and can effectively reduce the degradation rate. SEM characterization showed that the TA–HYA layer was formed by chelation between the Mg and TA surfaces. Furthermore, adding HYA to the coating covered the cracks caused by the TA layer and increased the hydrophilic properties. In vitro corrosion tests using Tafel polarization showed that the TA–HYA coating reduced the corrosion rate of the magnesium alloy from 7.379 mm/year to 0.204 mm/year. The immersion test in the SBF solution showed that the TA–HYA layer could bind Mg2+, which is beneficial for new bone growth.

1. Introduction

Many people suffer from bone fractures caused by accidents or sickness annually. According to data published in the Global Burden of Diseases, the number of new fractures worldwide in 2019 was estimated to be 178 million (95% UI 162–196), an increase of 33.4% (30.1–37.0) compared to 1990 [1]. Fractures develop because of the accumulation of microfractures produced by mechanical factors such as tension from unintended loads applied to the bone internally and externally [2,3]. Most fractures are healed by implants inserted into the damaged bone. Every year, more than three million bone transplant surgeries are performed worldwide. The cost of fracture healing in the United States is $32 billion annually [4]. In 2025, the global implant production sector is predicted to reach$66,636 a million [5], as the demand for implants will grow yearly.
Inert alloy materials such as vanadium, stainless steel, titanium, cobalt-chrome, and aluminum are commonly used as bone implants. Implanted orthopedic devices (such as bone screws, plates, artificial joints, and dental implants) improve pain relief and mechanically stabilize bone structures owing to their biocompatibility, low immunogenicity, and corrosion resistance [6]. Unfortunately, these bioinert implants impair osseointegration around the implant, leading to chronic complications, endocrine disruption, reactive oxygen species (ROS), and post-implant failure [7,8]. A minimum of two operations are necessary for implant placement and removal when using bone implants because the degradation resistance of these inert alloy materials is very high.
The essential characteristics of implant materials are their strong biocompatibility and bone-friendly mechanical and chemical properties. With the increased usage of implants, performing the procedure twice is considered inefficient [9]. Against these issues, researchers began looking for metal alloys that could be used as implant materials but only required one procedure and could be left in the body to decompose, earning the name of a biodegradable implant. Magnesium is one of the materials utilized in biodegradable implants because of its strong biocompatibility. Magnesium implants are lighter than other metallic biomaterials because, compared to natural bone, they have a density of 1.8 g/cm3 to 2.1 g/cm3. The value of magnesium alloy itself is close to 1.74 g/cm3 to 2.0 g/cm3 [10].
Furthermore, compared to other types of magnesium material, magnesium AZ31B can also be selected as a biodegradable implant because it has an elastic modulus between 3 and 20 GPa, which is similar to that of normal bone [11], and the percentage of aluminum content is not more than 3%. Al is below the toxicity limit for the human body [12,13]. Furthermore, Willbold et al. demonstrated that aluminum does not permeate into the surrounding tissue during the breakdown of AZ31 [14], and Witte et al. also asserted that modest amounts of aluminum emitted continually throughout the breakdown process are tolerated [14]. Although magnesium AZ31B has a high rate of degradation and is non-toxic to humans, a coating technique is required to control the pace of degradation so that the magnesium implant does not disintegrate before the broken bone heals [15] and will boost cell proliferation in the human body.
Medical use necessitates the selection of alloy composition and the processing technique, which should be a special responsibility for the practical applications of magnesium alloys. Using the ultrafine-grained (UFG) structure in magnesium alloys is one of the numerous strategies to obtain good magnesium alloy characteristics [16]. Besides that, there are several other ways, such as surface coating. Surface coating is a method for preparing a protective layer on magnesium implants so that, in the presence of this coating, magnesium does not come into direct contact with bodily fluids. The coating material must have good biocompatibility and good biodegradability. In addition, the corrosion rate of the coating material must be slower than that of Mg to increase the corrosion resistance; however, biodegradation must occur at the desired rate [17]. In this study, a conversion coating was used. The conversion layer is formed from a specific reaction between the base material and the environment; an oxide layer is produced through a chemical or electrochemical process. The resulting coating is expected to be gas- or liquid-resistant, inert, resistant to mechanical damage, self-healing, environmentally friendly, and cost-effective [18].
One of the reasons for developing a layer on the surface of magnesium is the formation of bonds with Mg2+ ions, which helps to prevent the dissolution of Mg2+ ions. Tannic acid is an organic molecule that can bind to Mg2+ ions and form chelate connections, enhancing corrosion resistance [19,20]. Because tannic acid layers have cracks, they are prone to corrosion [21]. As a polyphenol, tannic acid can be useful for healing; it has therapeutic and pharmacological properties, such as antibacterial, anticancer, antioxidant, anti-inflammatory, anti-viral, and homeostatic properties [22]. According to Asgari et al., magnesium coated with tannic acid has cracks on the surfaces of all of the broader samples from day one to twenty-one. The samples with higher tannic acid were more effective in improving corrosion resistance (up to 180%) [23]. Owing to the presence of cracks on the surface of the layer, the formation of a new layer above the tannic acid layer is a technique to cover the cracks and close the gap.
Hyaluronic acid is a sulfur-free glycosaminoglycan composed of the disaccharide N-acetyl-D-glucosamine group, with a size of 106–107 kDa repeating the D-glucuronic acid group. These compounds are abundant in the skin, tendons, and synovial fluid of the human body [24]. Hyaluronic acid plays an essential role in cell adhesion, proliferation, and differentiation in the human body [25] and has excellent biocompatibility, biodegradability, and non-immunogenicity [26]. According to Dominik et al., HYA can trigger anti-inflammatory and immunosuppressive characteristics for high-molecular-weight HYA and stimulate proinflammatory tissue reactions for low-molecular-weight HYA. It is expected to accelerate bone healing [27]. As a coating substance, hyaluronic acid can mend microcracks in the coatings caused by the use of other materials in metallic implants. Furthermore, a hyaluronic acid coating can improve corrosion resistance [28]. Min et al. evaluated HYA–TA using the DPPH radical assay, and the results were highly effective owing to its excellent antioxidant activity [29] and success in reducing the corrosion rate.
In the present work, to address the deficiency in tannic acid, which can cause cracks in the samples, an additional coating with hyaluronic acid was carried out to protect the cracks. In addition, tannic acid and hyaluronic acid can improve the corrosion resistance of AZ31B magnesium. In this study, a simple conversion coating was carried out to overcome the decay of magnesium, and the results showed that using the TA–HYA coating reduced the corrosion rate and was effective for coating the AZ31B magnesium alloy.

2. Materials and Methods

2.1. Materials

Hydrochloric acid (HCl), sodium chloride (NaCl), sodium bicarbonate (NaHCO3), potassium chloride (KCl), dipotassium phosphate (K2HPO4·3H2O), magnesium chloride hexahydrate (MgCl2·6H2O), calcium chloride (CaCl2), sodium sulfate (Na2SO4), tris(hydroxymethyl)aminomethane (TRIS), and tannic acid (C76H52O46) were provided by Merck (Darmstadt, Germany). Hexamethylenediamine (H2N(CH2)6NH2) was provided by Sigma-Aldrich (Singapore). Hyaluronic acid (C14H21NO11)n was provided by Fenchem Biotek Co., Ltd., Nanjing, China, and AZ31B magnesium alloy was imported from Wuxi Eternal Bliss Alloy Casting and Forging Co., Ltd., Wuxi, Jiangsu, China.

2.2. Sample Selection and Preparation

The material used in this study was AZ31B magnesium alloy. An AZ31B magnesium alloy plate with the chemical composition listed in Table 1 was used for coating and corrosion testing. Cutting and polishing of the sample surface was part of the sample preparation process and was conducted in the following order: First, the AZ31B magnesium alloy was processed into test sample dimensions of 20 mm × 20 mm × 1 mm via wire cutting. After that, the sample’s surface was sanded using SiC emery paper with grids of 400, 800, 1500, and 2000.

2.3. Fabrication of AZ31B/TA and AZ31B/TA/HYA

Tannic acid was mixed with hexamethylenediamine in the first layer to form an amine group in tannic acid, and via chemical conversion, a tannic acid coating was formed on the surface of the AZ31B magnesium alloy according to the methods of Cui et al. and Chen et al. [31,32]. First, 200 mg of tannic acid was dissolved in 100 mL of an aqueous solution. Hexamethylenediamine was then added to the tannic acid solution at a ratio of 1:1. The AZ31B magnesium alloy sample was immersed in this solution for 6 h. After the immersion process, the sample was removed and dried at room temperature. The second coating procedure was based on the research of Zhou et al. [28]; the coating process used 200 mg of hyaluronic acid dissolved in 100 mL of aqua demineralization. The dried sample from the previous coating process was immersed in the solution for 12 h. After the immersion process was completed, the sample was removed and dried at room temperature.

2.4. Solution Preparation for Immersion Test

The coated samples were subjected to an in vitro corrosion test in a solution miming the conditions observed in the human body. As a result, the test solution with simulated bodily fluid, also known as SBF, had a controlled temperature of 36–37 °C. The ion concentration in the SBF solution was identical to that in human blood plasma. The SBF solution was created based on the study conducted by Oyane et al. [31]. SBF type c was chosen as the SBF solution because it has an ion concentration similar to blood plasma and can create apatite from the bone. The following is a description of how to create an SBF solution. The reagents used to prepare the SBF solutions are listed in Table 2.
First, 700 mL of aqua demineralization was placed in a 1 L measuring cup and placed on a hot plate stirrer. Aqua demineralization was heated to a temperature of 36.5 °C and stirred using a magnetic stirrer. The reagents listed in Table 2 were dissolved sequentially. After all the reagents were dissolved, we ensured that no precipitate was formed in the solution, so that the SBF solution could be completely formed. Next, a 1.0 M HCl solution was added to obtain a final pH of 7.4, the SBF solution was cooled, and aqua demineralization was added to a volume of 1000 mL. The SBF solution was maintained at 5–10 °C for a maximum of eight weeks when not used [31].

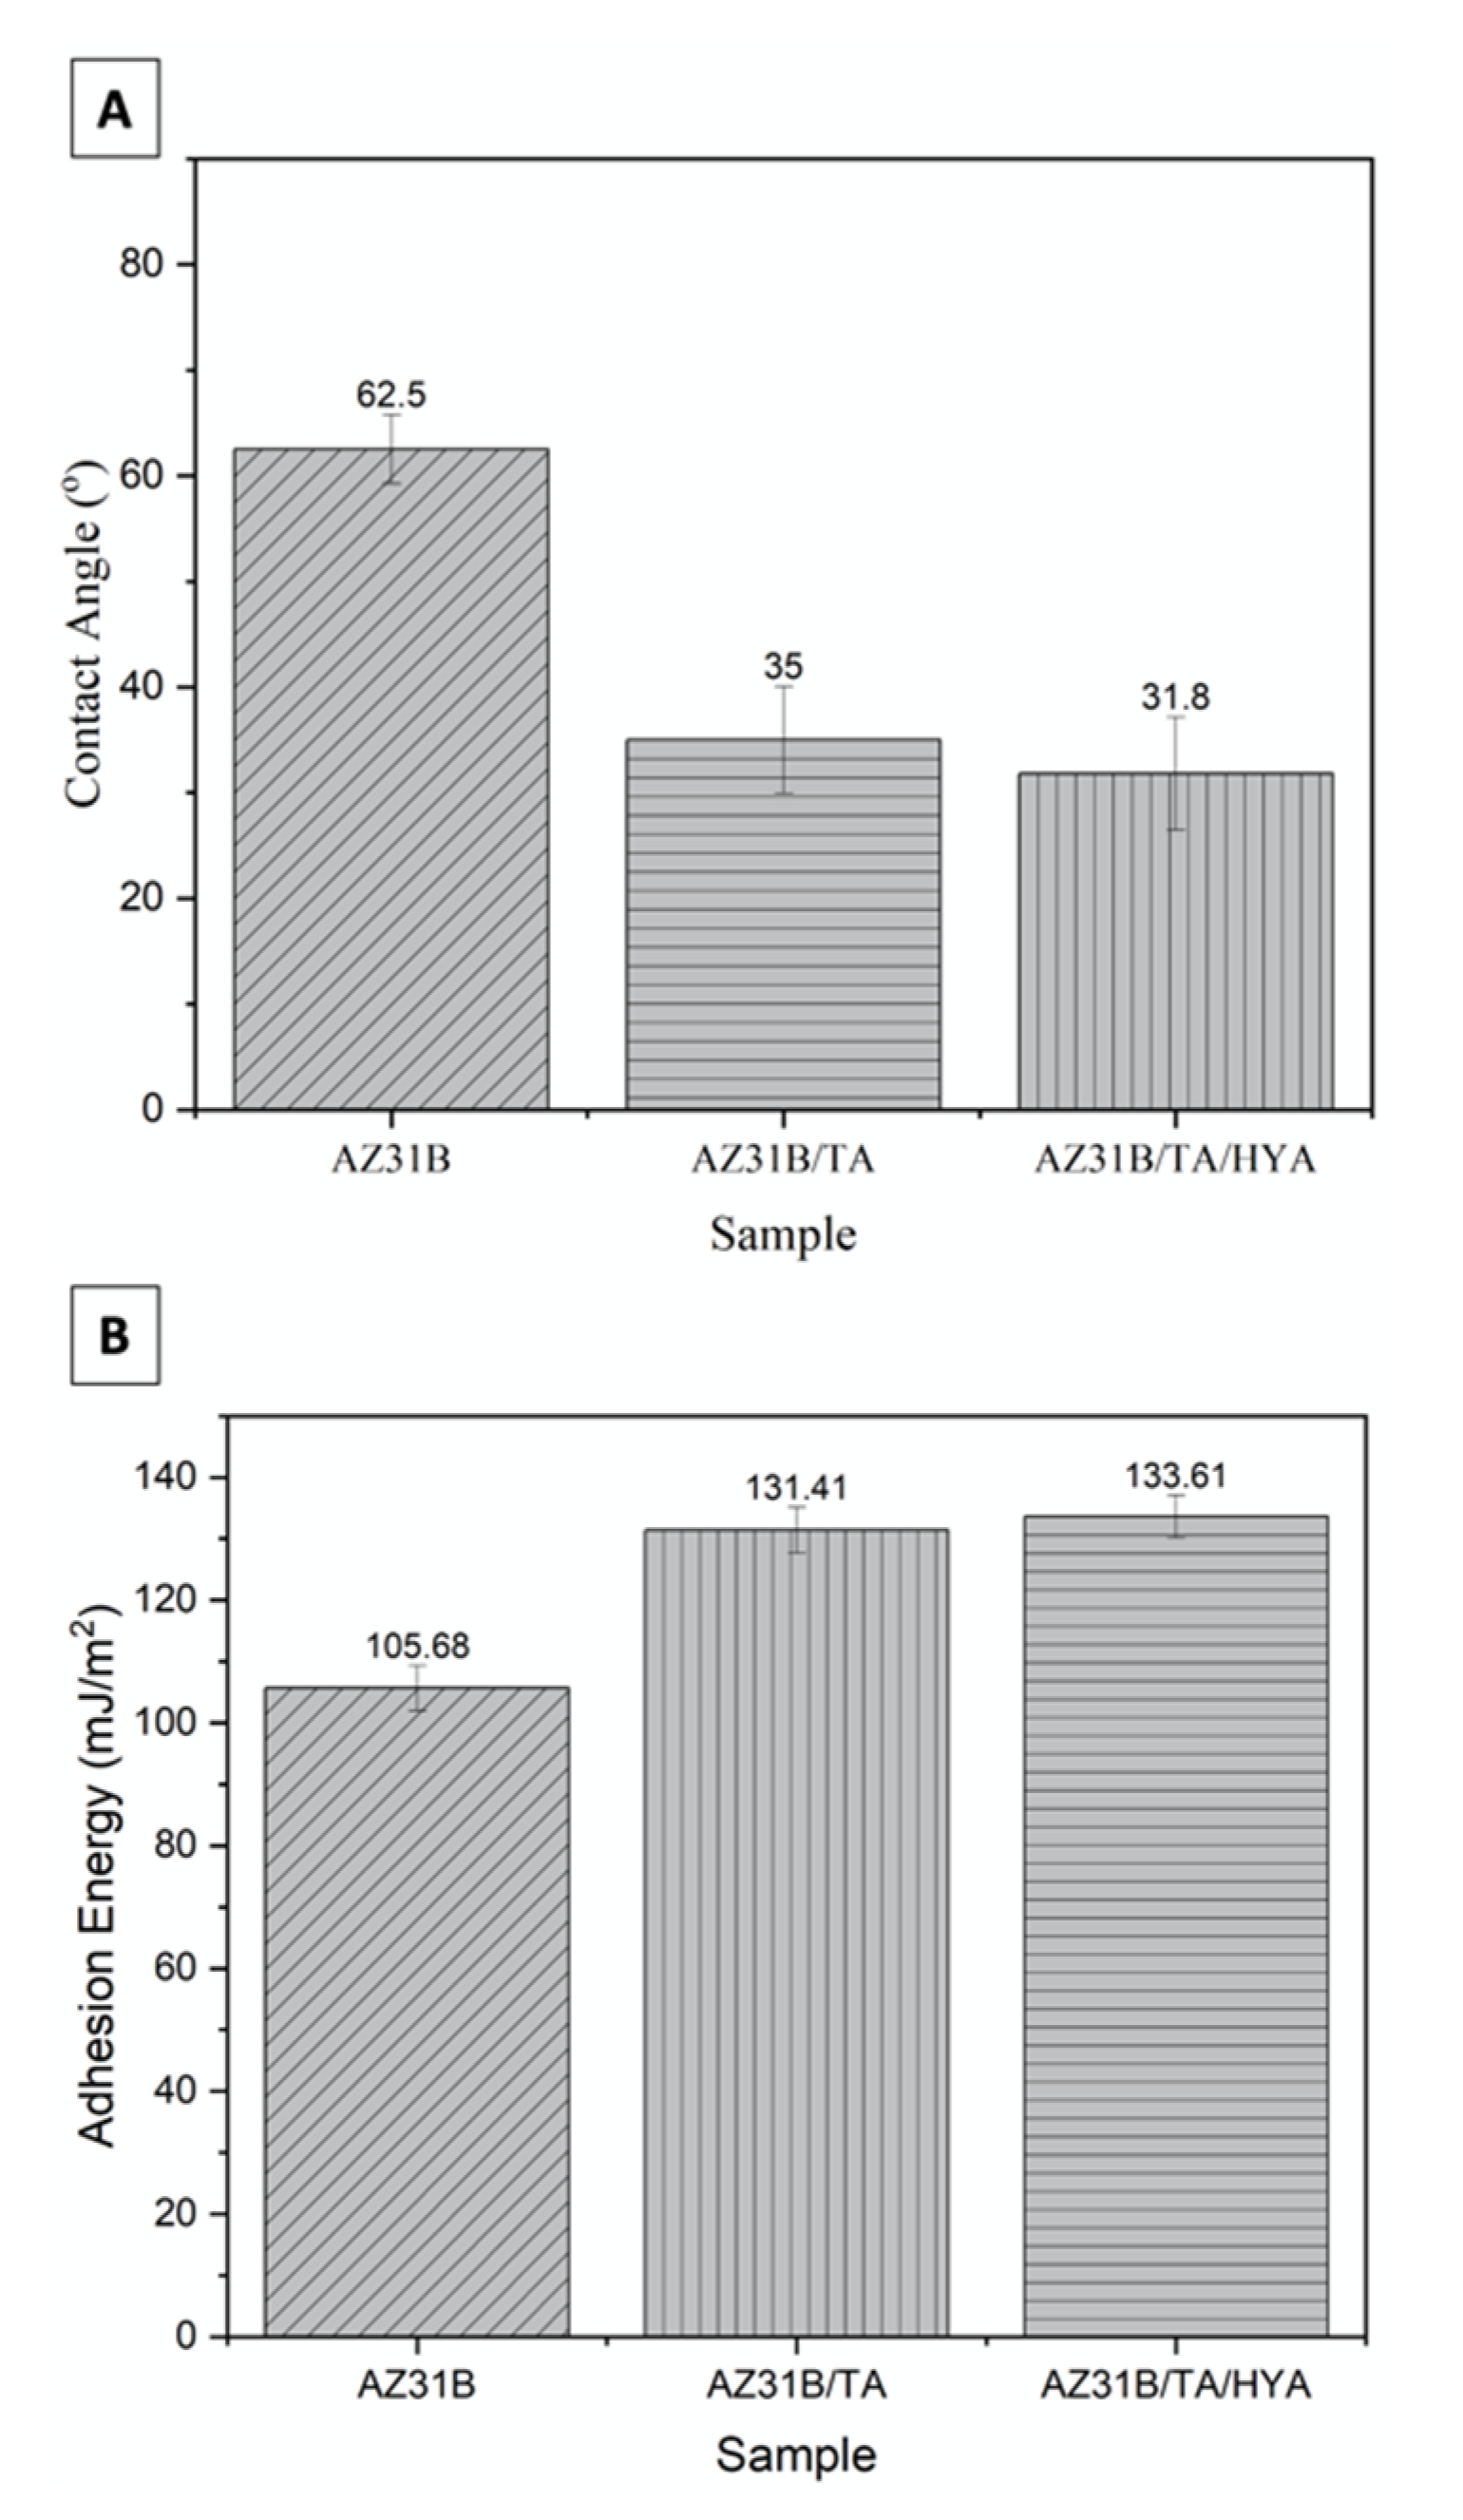
2.5. Contact Angle Test

A contact angle test on the samples was performed to determine the angle created on the surface of the sample by dripping liquid. The test work steps were carried out as follows: AZ31B, AZ31B/TA, and AZ31B/TA/HYA were placed on the holder, pointing at the camera lens. The sample was dripped with liquid media in the form of aqua demineralization on its surface. After the liquid was dripped, the surface of the sample was photographed. The image was processed using ImageJ software to determine the contact angle formed. Work steps were repeated using a liquid medium in the form of an SBF. The contact angle data in each sample can be used to determine the adhesion energy by using the equation below [32].
Wad = γlv (1 + cosθ)
Information:
  • Wad   : adhesion energy (mJ/m2)
  • γlv     : surface tension (mJ/m2)
  • θ       : Contact angle between the liquid and the sample surface (°)

2.6. Corrosion Evaluation

Corrosion evaluation was performed on pure AZ31B as the control, AZ31B/TA, and AZ31B/TA/HYA samples. The comparative corrosion behavior was investigated through immersion, polarization, and electrochemical impedance spectroscopy tests. The details of each test are explained below.

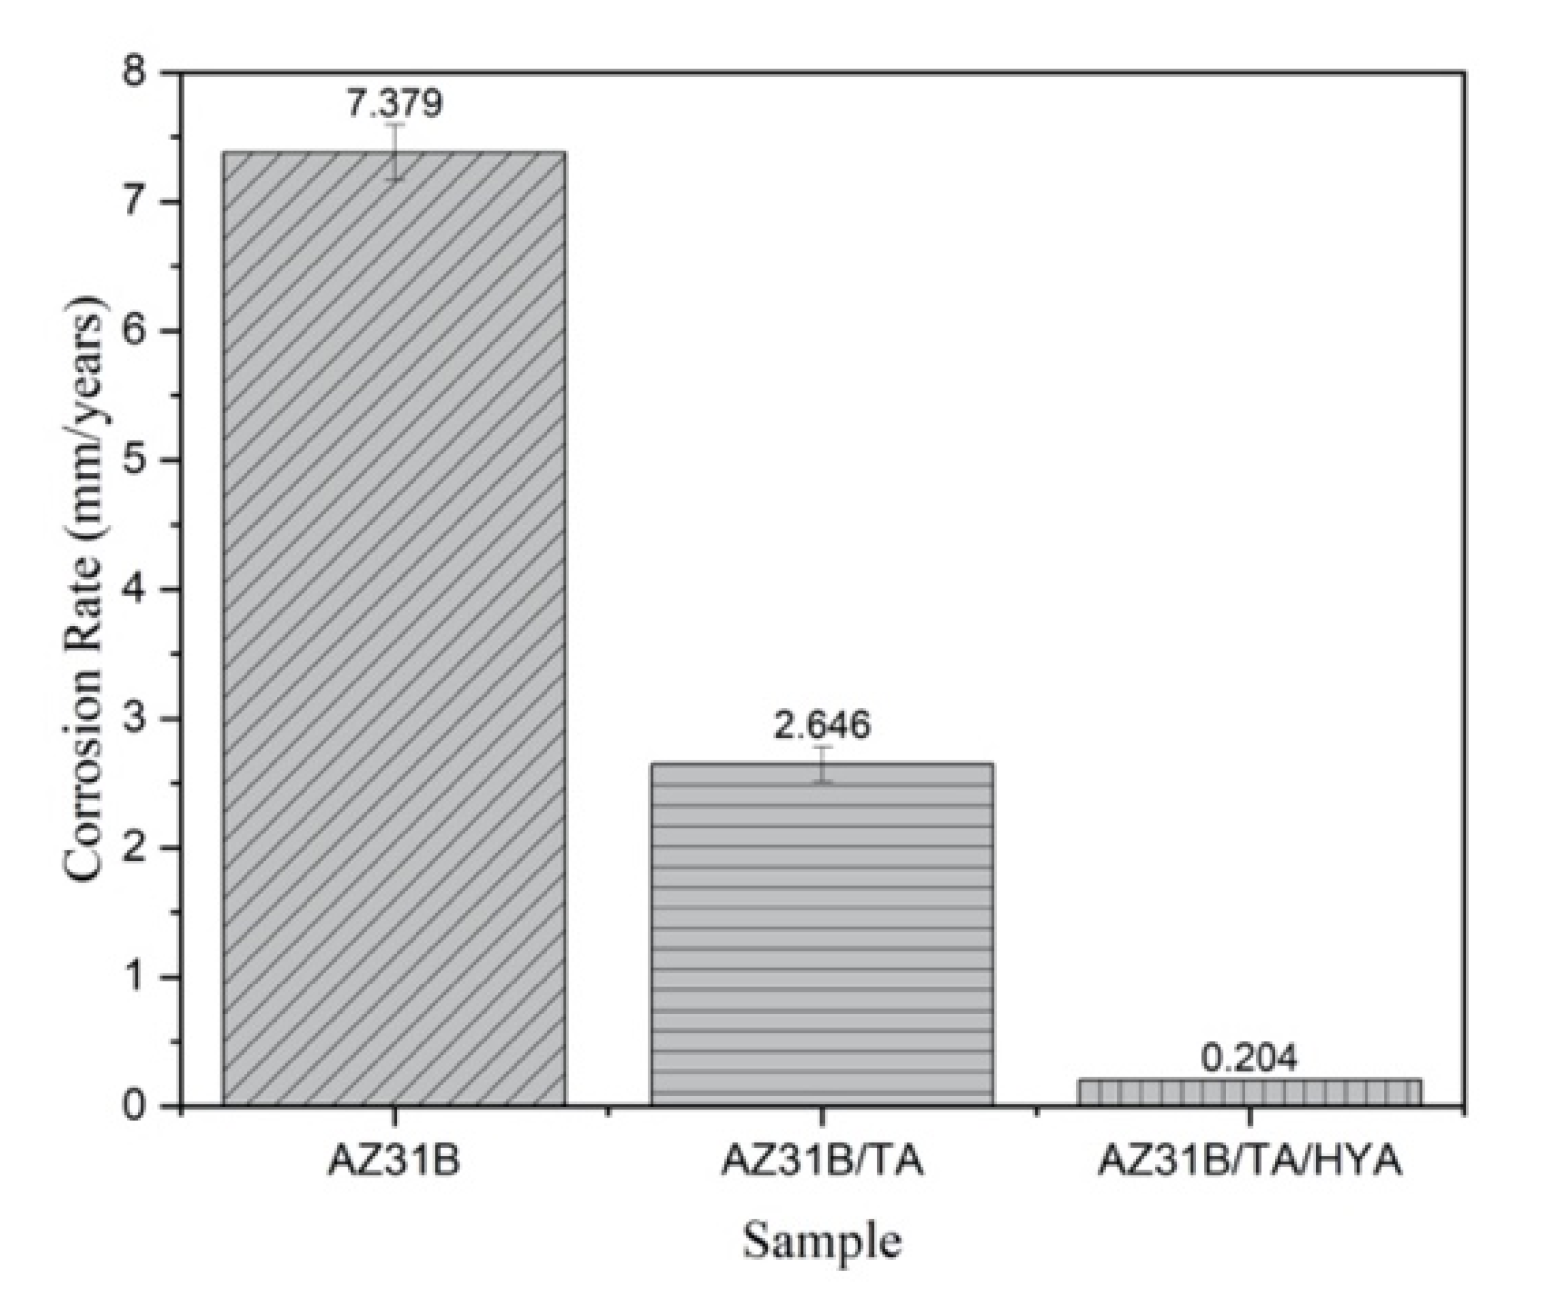
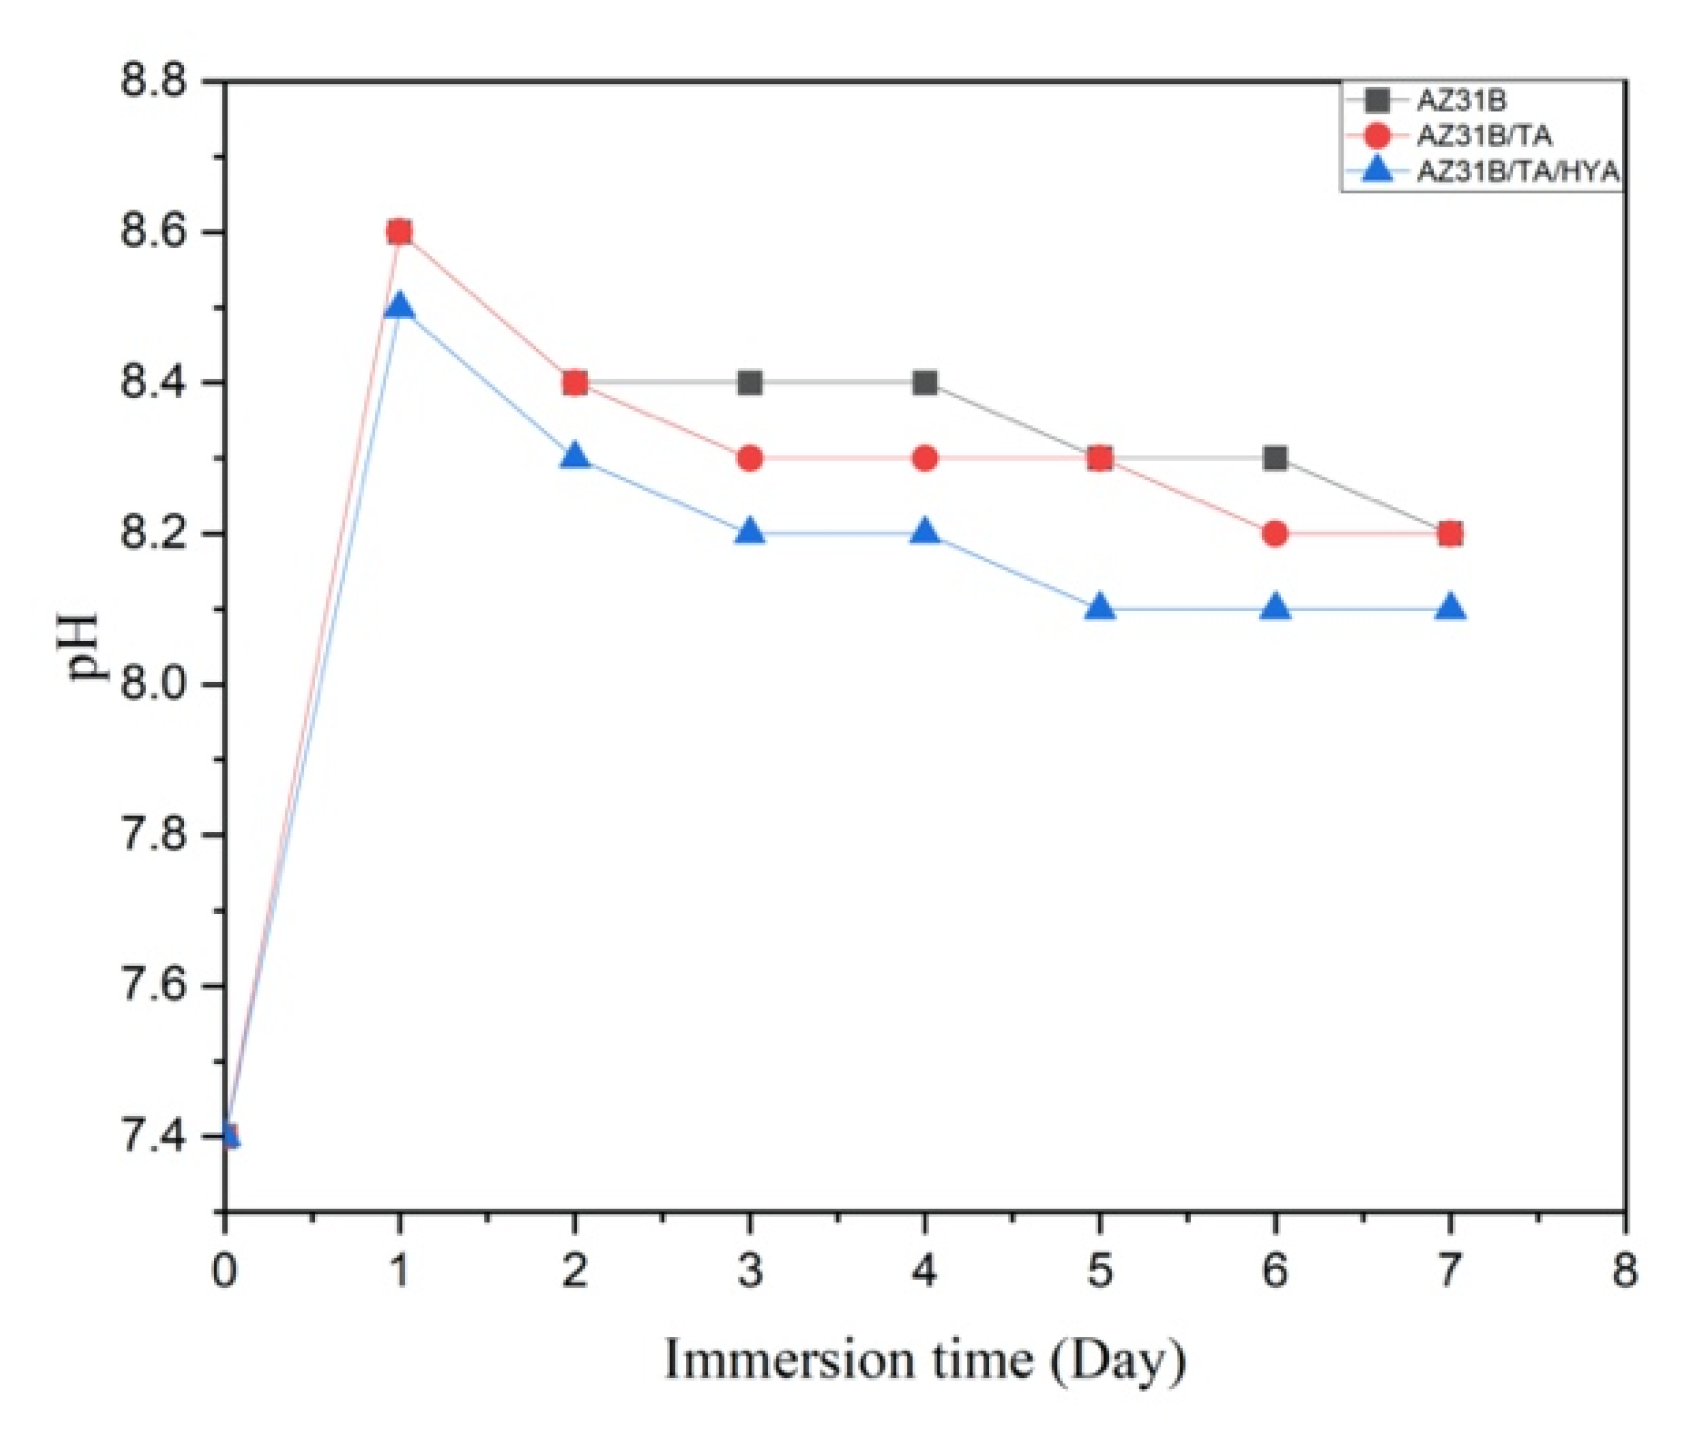
2.6.1. Immersion Test

During the immersion, changes in the mass of the sample with SBF were observed using the sample immersion test method. The initial mass of each sample was measured using a scale before the immersion. The samples were then immersed in the SBF solution (chemical composition listed in Table 2) for seven days and weighed every three days. Every day, the SBF solution was replaced with a new one to keep the ion concentration in the SBF equal to blood plasma and the pH stable. Samples were taken from the SBF solution and dried after seven days of SBF immersion. The sample was dissolved in a solution of CrO3 (200 g/L) and AgNO3 (10 g/L) for 10 min to remove the corrosion products [33]. The cleaned sample was then weighed at its final mass to observe the change in mass after the immersion test.

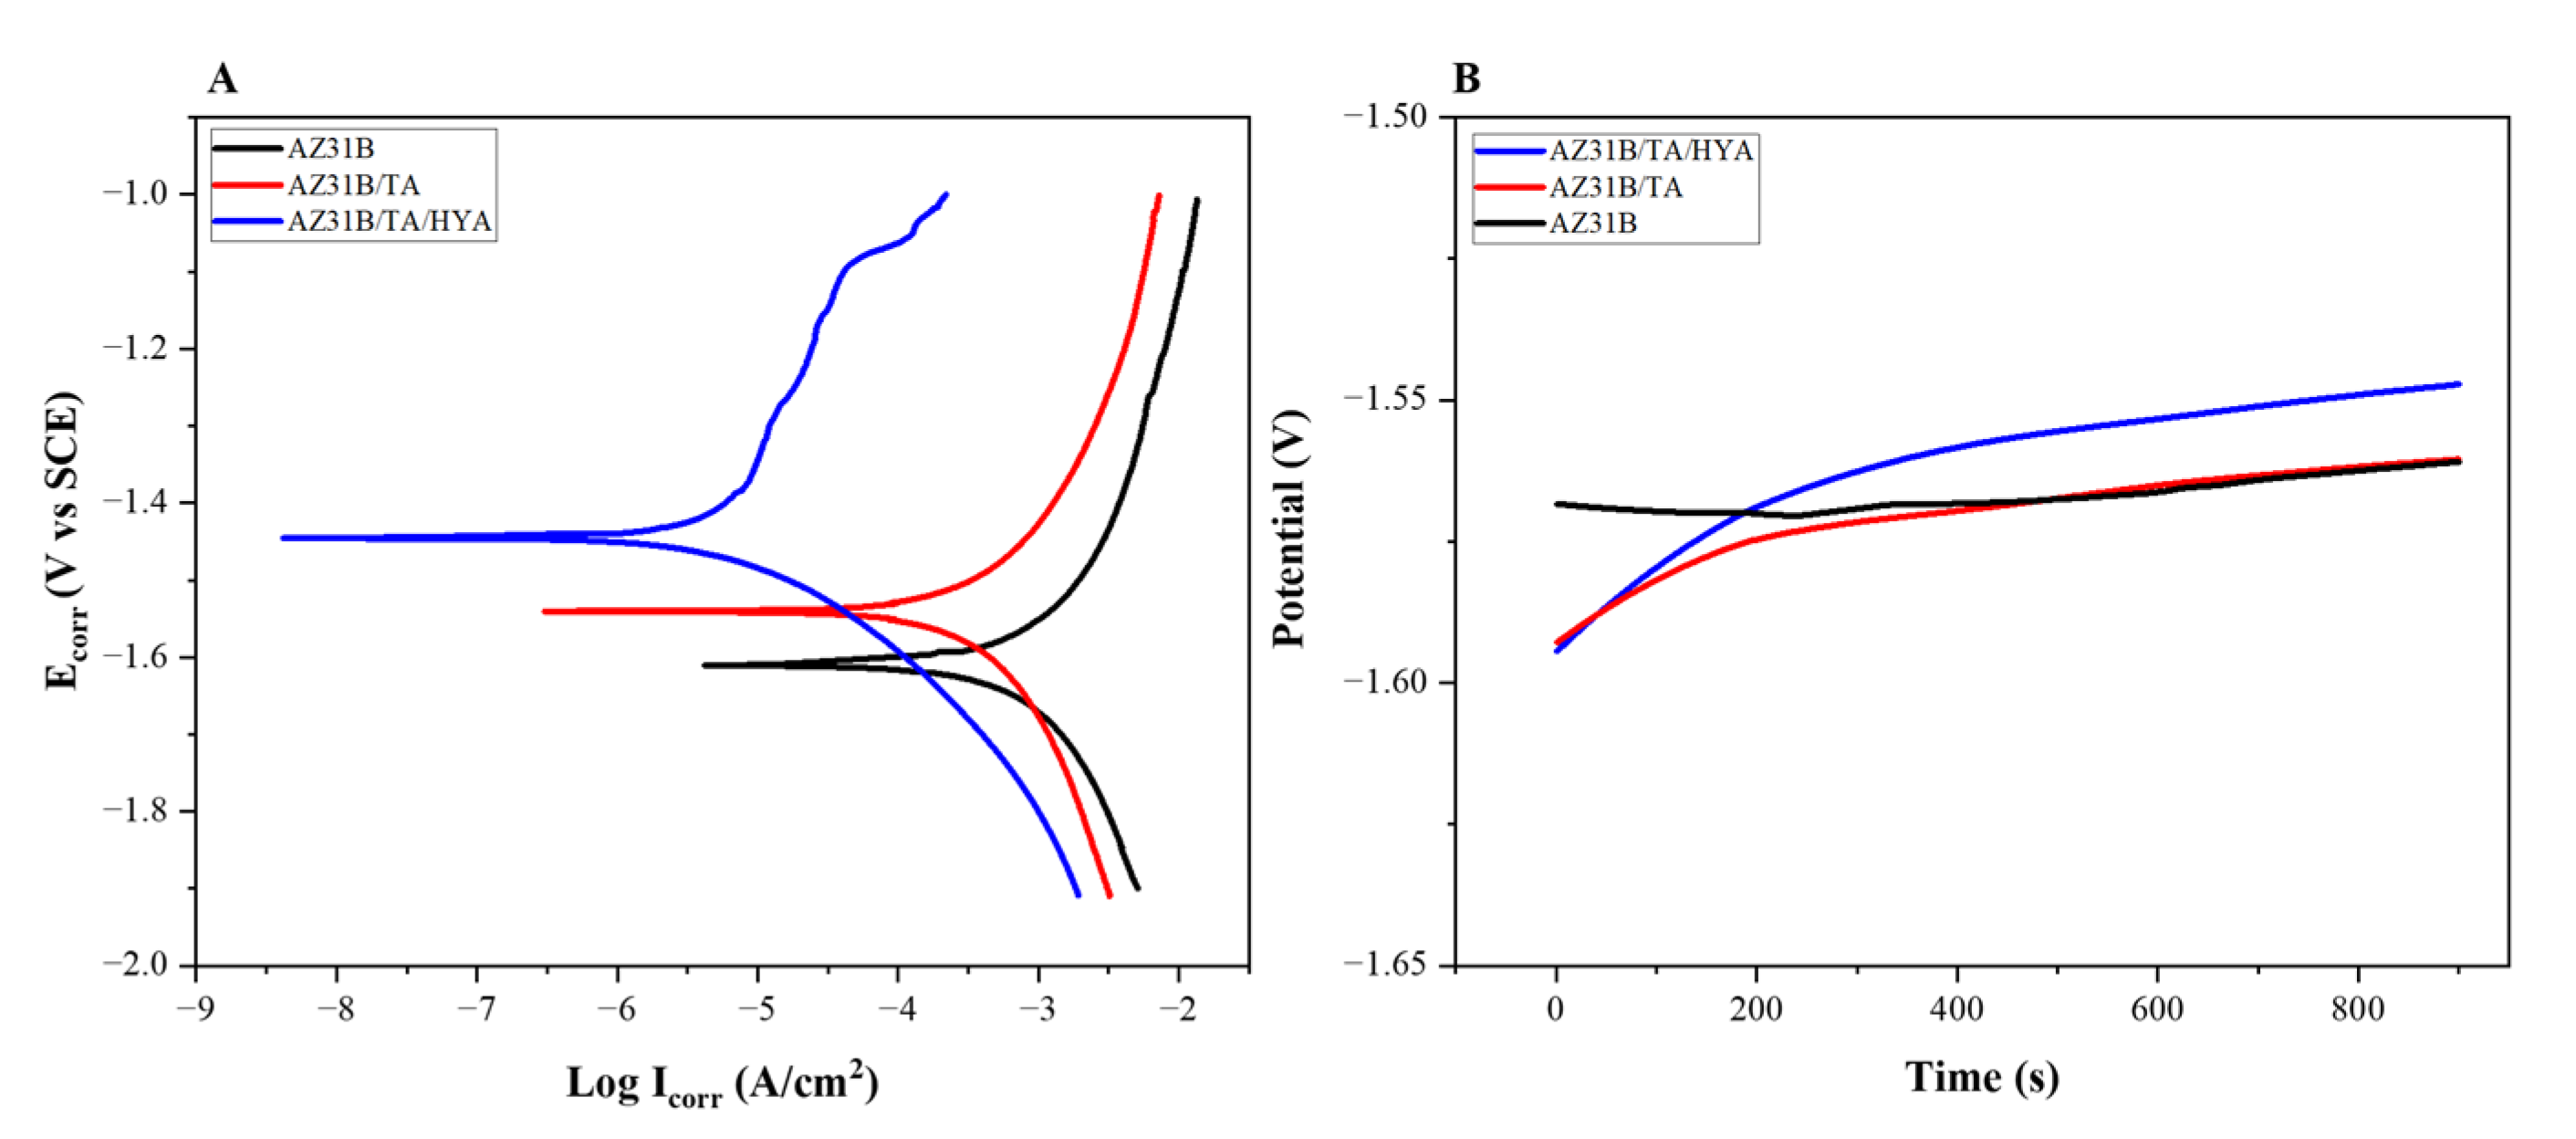
2.6.2. Tafel Polarization Test

The sample was connected to a wire and mounted in a polarizing chamber. Subsequently, the SBF solution was placed in a polarizing container. The reference and auxiliary electrodes were mounted on a sample submerged in the SBF solution. The three electrodes were wired to connect to VersaSTAT. We allowed 15 min for the system to stabilize, started the system after 15 min, and waited for the polarization curve to finish. These steps were repeated for the different samples.

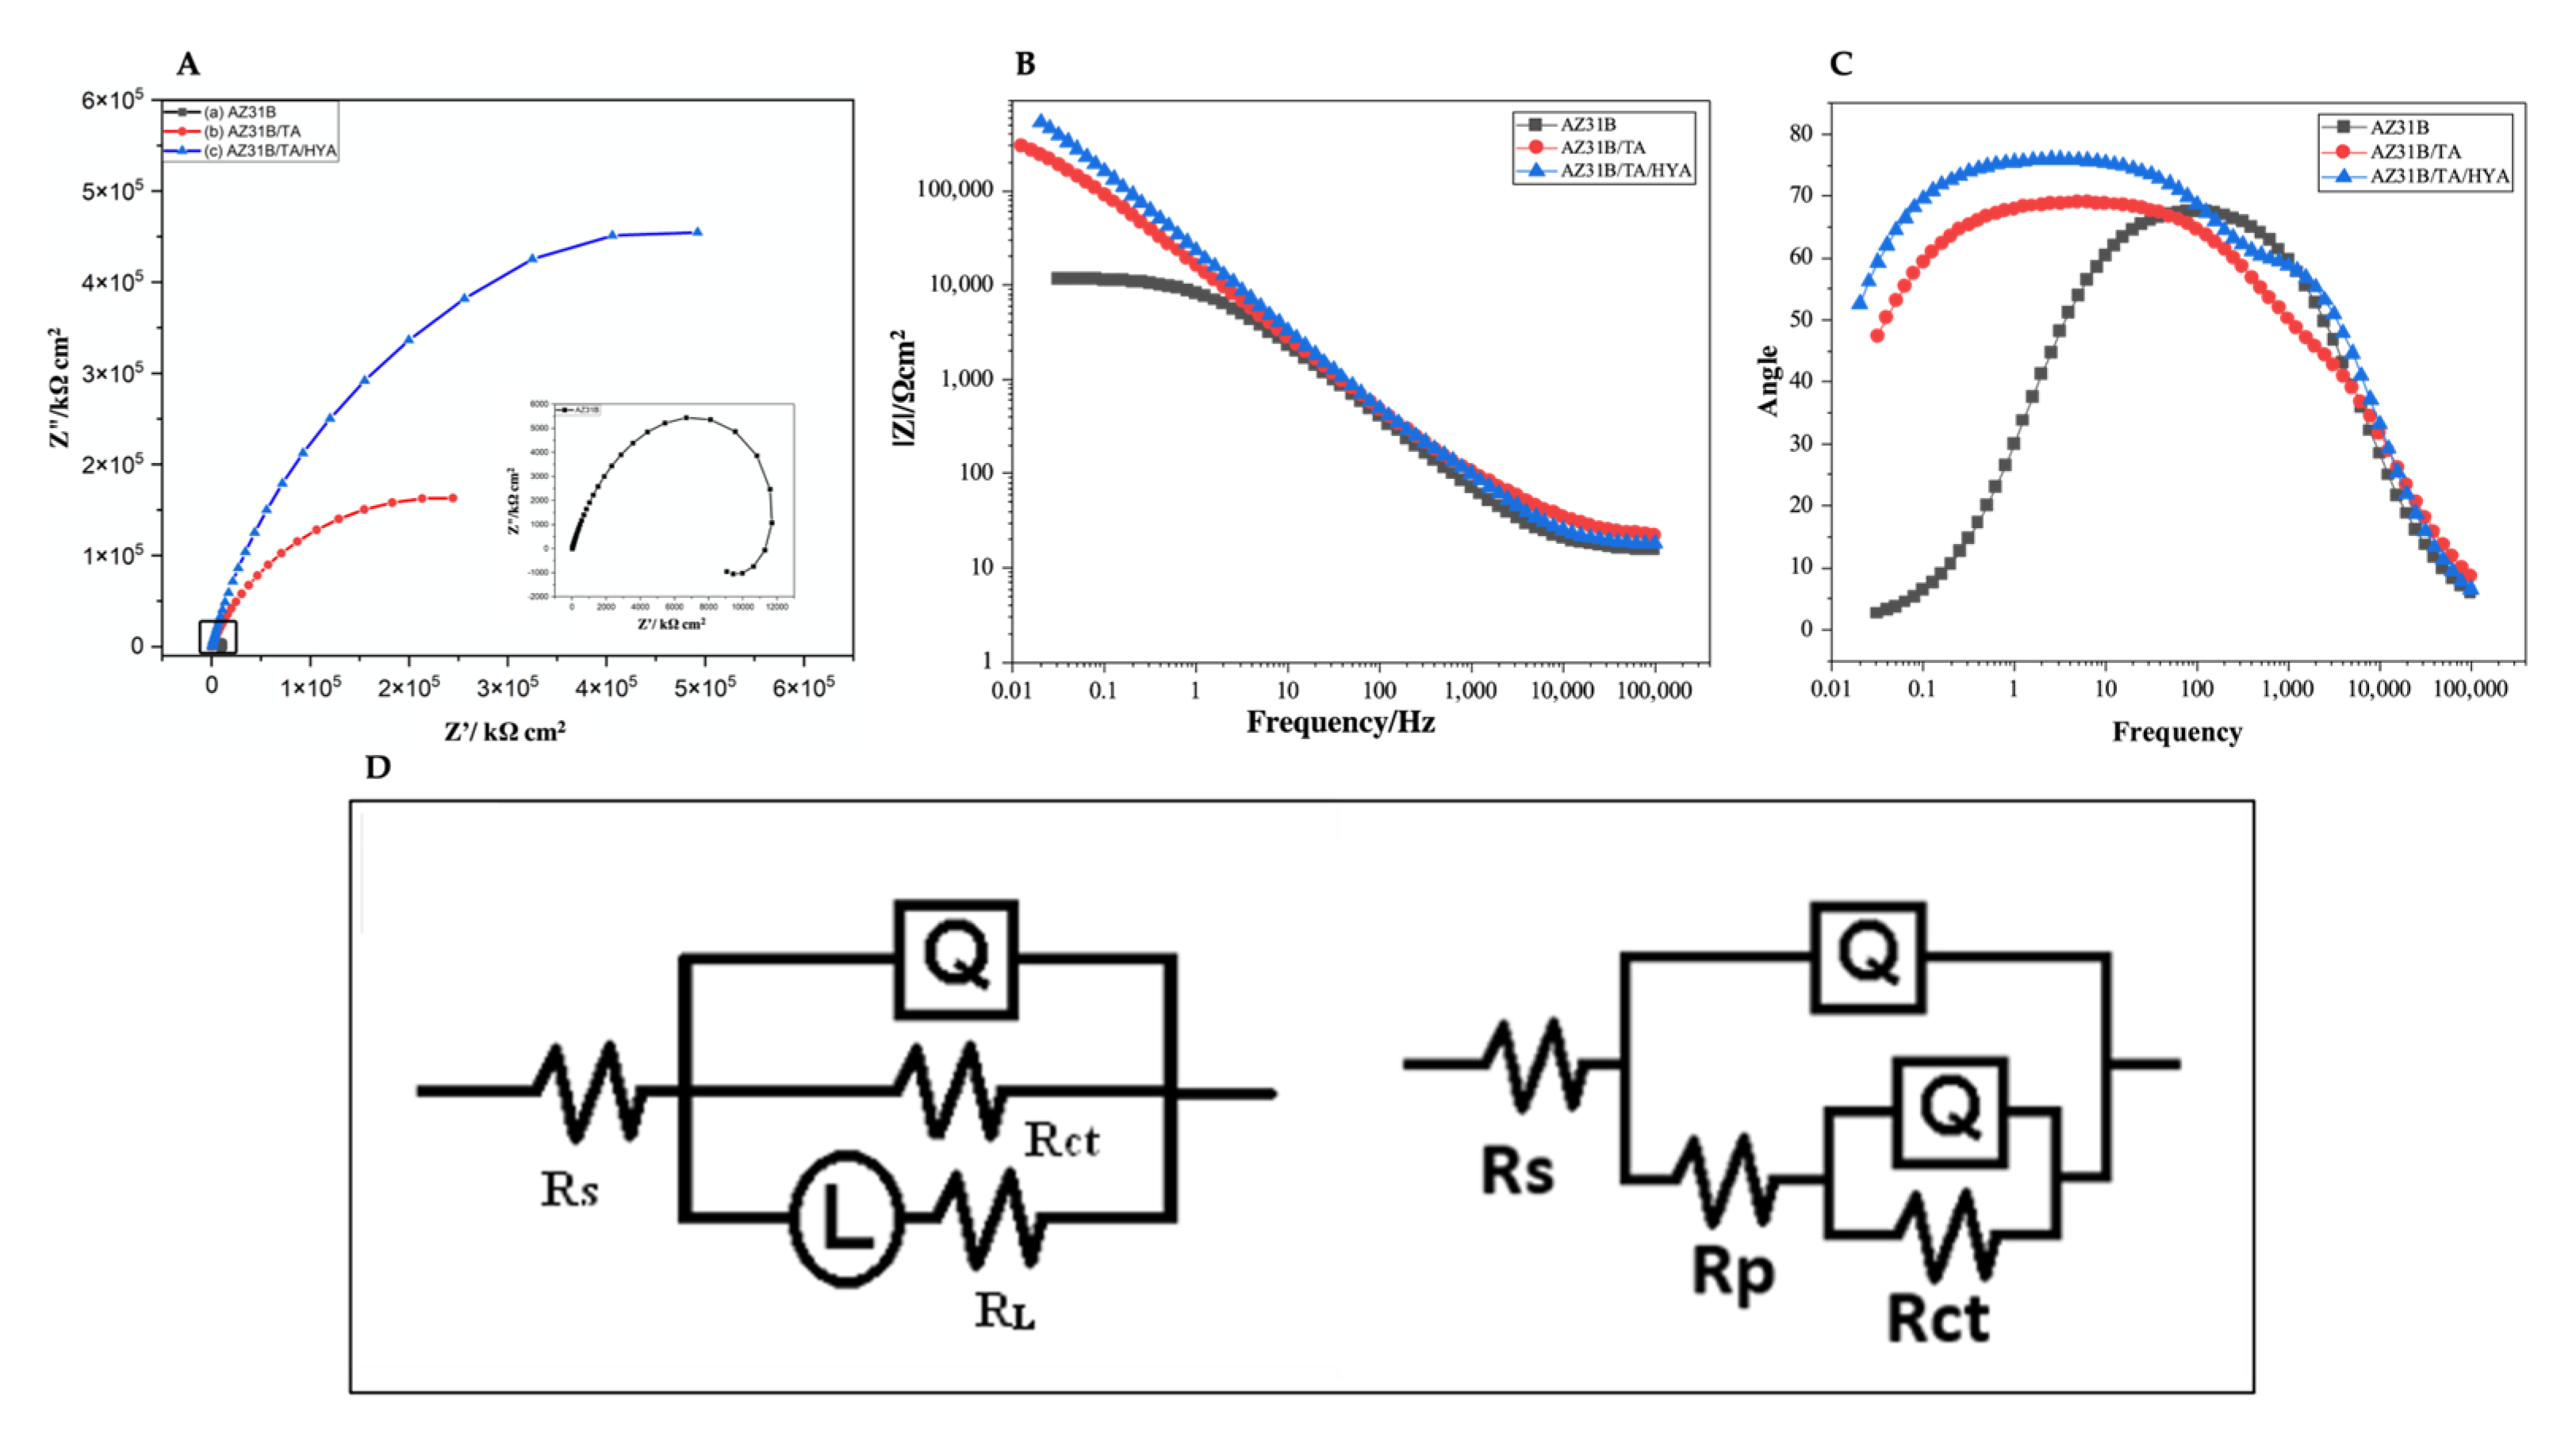
2.6.3. Electrochemical Impedance Spectroscopy Test

The sample was connected to a wire, and a chamber was installed. The SBF solution was then transferred to a container. Reference and auxiliary electrodes were inserted into the chamber. The three electrodes were connected to a Gamry potentiometer by cables. The Gamry application was opened to enter the test parameter data: minimum frequency of 0.01 Hz, maximum frequency of 10,000 Hz, and AC potential with an amplitude of 10 mV. Subsequently, the system was allowed to stabilize for 15 min. We started the system after 15 min and waited for the Nyquist curve to appear; we repeated these steps for the different samples. The test data were then entered into the ZSimpWin application to match with an electrical circuit equivalent to the experiment to obtain the electrochemical data.

2.6.4. Surface Characterization

The morphologies of the samples were examined using a scanning electron microscope (SEM) (SU3500, Hitachi, Tokyo, Japan). Chemical characterization of the samples was performed using Fourier transform infrared spectroscopy (FTIR) (IRPrestige 21, Shimadzu, Japan). X-ray diffraction (XRD) characterization was carried out on samples AZ31B/TA/HYA after immersion to identify the corrosion product compounds produced. XRD measurements of the samples were performed using a D8-Advance, Bruker AXS Inc., Madison, WI, USA. The scan rate was 5°/min using a Cu-Kα anode with an analysis window ranging from 10° to 60°. The phase identifications were performed by comparison to ICCD-PDF Database.

3. Results and Discussion

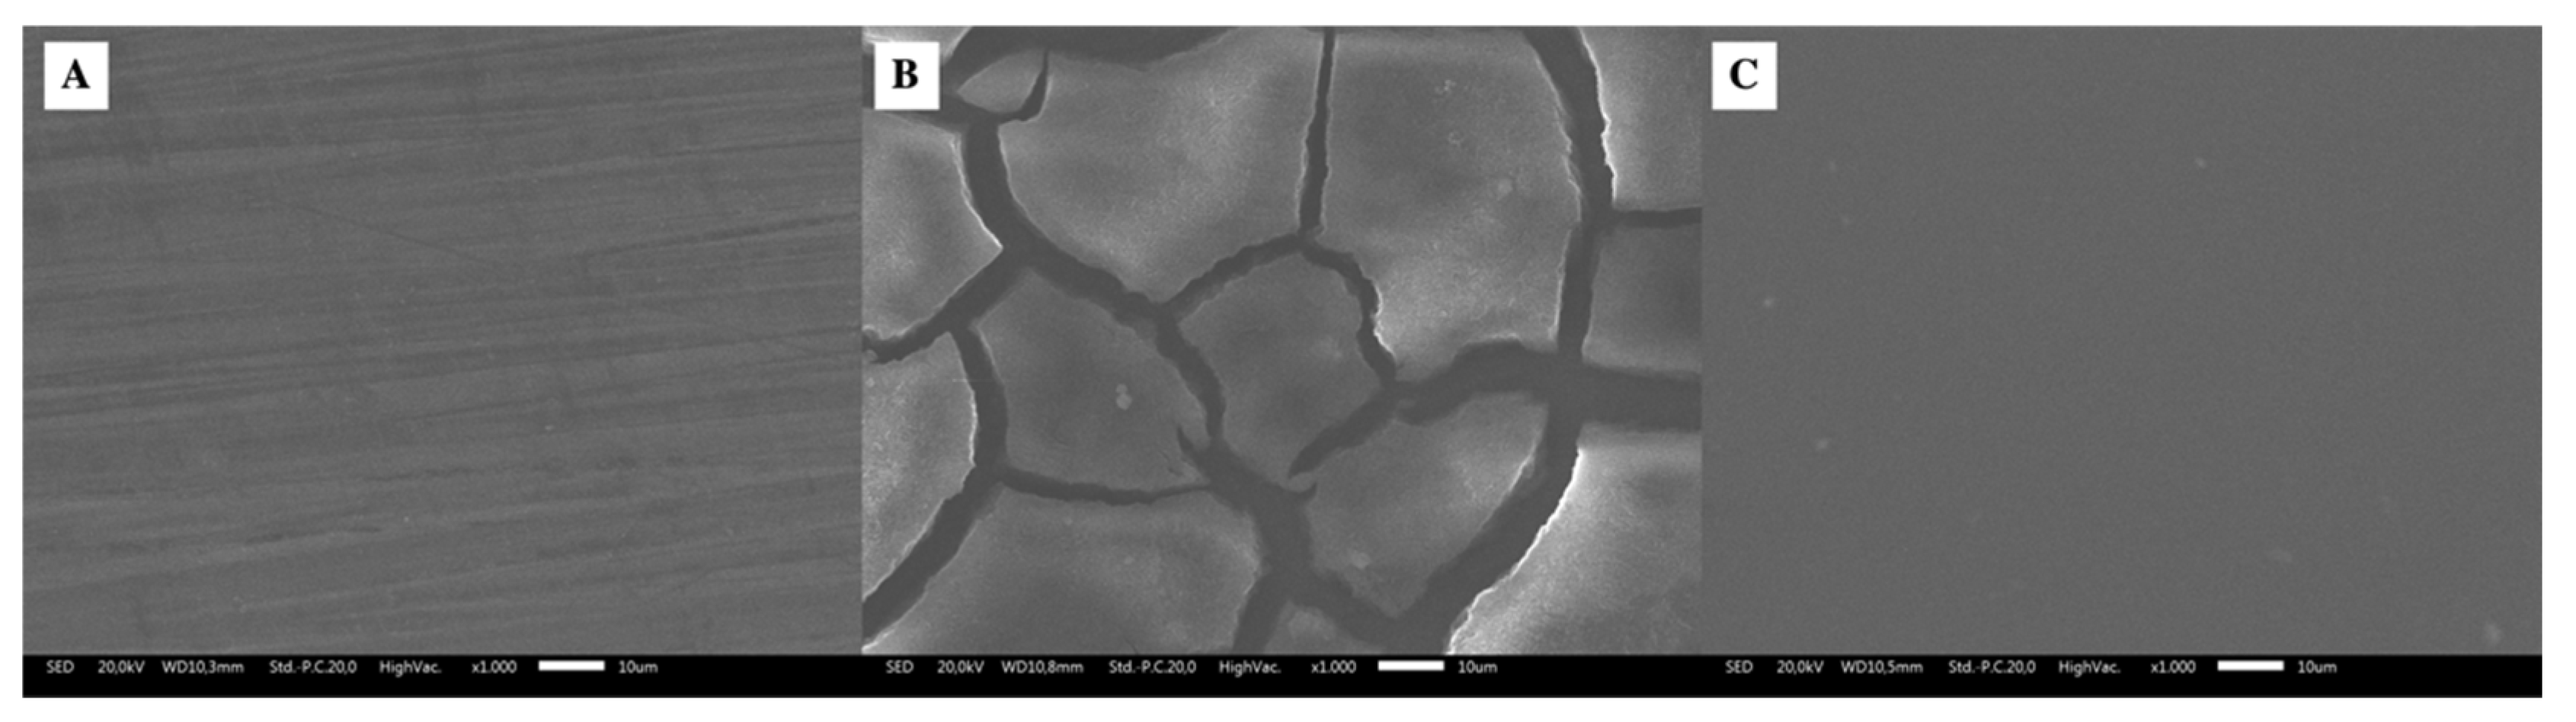
3.1. Surface Morphological Analysis of Samples after Coating

A qualitative morphological investigation using SEM on AZ31B magnesium alloy coated with tannic acid (AZ31B/TA) and hyaluronic acid (AZ31B/TA/HYA) is shown in Figure 1. Figure 1A shows the surface of the native sample of AZ31B magnesium alloy; minor scratches from the polishing process can still be observed on the sample surface. The tannic acid coating was formed on the surface of the sample AZ31B (Figure 1B). Cracks emerge in the layer as a result of the surface of the sample reacting with the tannic acid solution, releasing magnesium ions, which can combine with H2O compounds to create the corrosion product Mg(OH)2, which shields the sample surface but is fragile and easy to shatter. When the immersion procedure was performed for 6 h, a layer of tannic acid formed on the surface of the sample, preventing the surface from reacting with H2O compounds to generate Mg(OH)2 compounds. The weight ratio of tannic acid to hexamethylenediamine employed was 1:1 because if the concentration of hexamethylenediamine is higher than that of tannic acid, forming a layer of Mg(OH)2 is problematic, resulting in lower corrosion resistance [33].
SEM studies of the surface of the AZ31B sample (Figure 1C) with added hyaluronic acid coating following coating with tannic acid revealed that there were no cracks or holes. This means that the hyaluronic acid layer filled the cracks left by the former coating. This is consistent with the authors’ statement that hyaluronic acid can cover cracks caused by the polydopamine coating on the surface of the coated magnesium alloy [28]. Following the SEM examination, the sample was characterized using EDS to determine the elements present on the surface of the sample. According to Table 3, the sample AZ31B/surface TA contains elements of C and O with % weights of 63.30% and 27.18%, respectively, indicating that a layer of tannic acid has been deposited on the sample’s surface. There is also an Mg element with a % weight of 9.30%, which could indicate the formation of Mg(OH)2.
Following the application of a hyaluronic acid coating, elements of C (carbon) and O (oxygen) with % weights of 46.19% and 53.23%, respectively, can be found on the surface of the sample AZ31B/TA/HYA. As a result, the presence of these elements can be a precursor for hyaluronic acid deposition on the sample surface. It can be seen that the AZ31B/TA/HYA sample has a lower percentage of element C produced by EDS than the AZ31B/TA sample. This is due to the fact that the EDS characterization penetrates 100 nm–1 µm from the sample’s top surface [34]. As a result, the surface of the EDS-analyzed sample AZ31B/TA/HYA is the surface of the hyaluronic acid layer, which has less carbon than tannic acid. Furthermore, the percentage of O in the AZ31B/TA/HYA sample was higher than that in the AZ31B/TA sample. This is because, during the layer formation process, hyaluronic acid can form hydrogen bonds with water molecules, increasing the oxygen content of the AZ131B/TA/HYA samples [35]. Because EDS characterization can only show the elements in a specific area on the sample surface and cannot explain the presence of functional groups in the layer to demonstrate the tannic acid–hyaluronic acid layer reaction, further characterization of the layer formed on the sample surface was required.

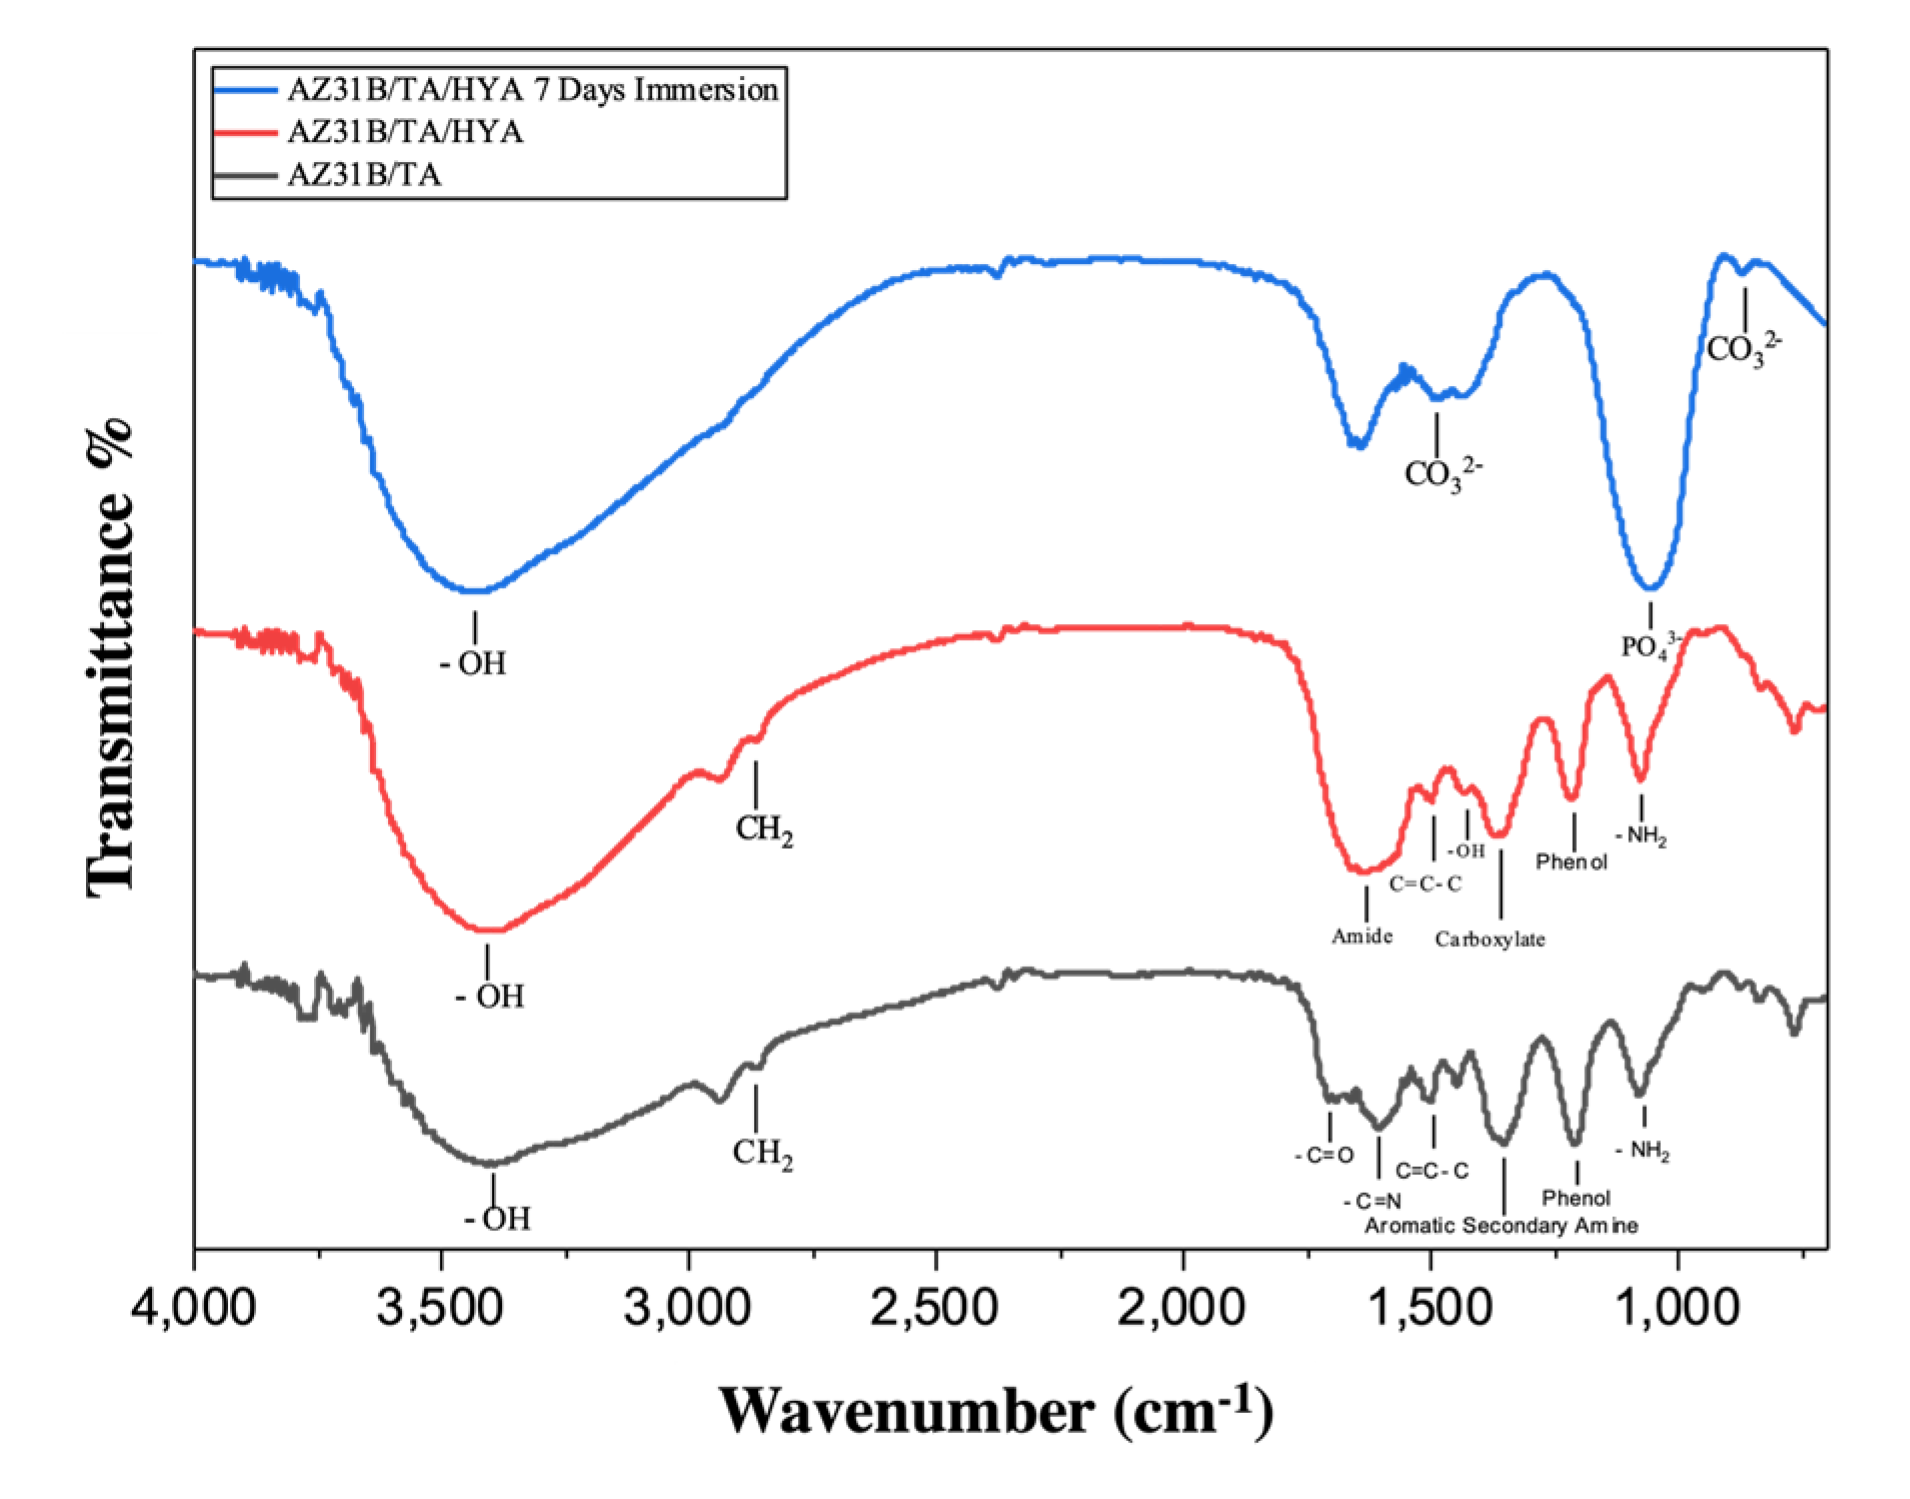
3.2. FTIR Characterization Analysis

After SBF immersion for seven days, FTIR characterization of the sample surface was performed to identify the functional groups present in the samples AZ31B/TA, AZ31B/TA/HYA, and AZ31B/TA/HYA. The FTIR results are shown in Figure 2. Based on Figure 2, the identification of functional groups that correspond to the peaks of the FTIR spectra of the AZ31B/TA, AZ31B/TA/HYA, and AZ31B/TA/HYA samples after SBF immersion for seven days can be seen in Table 4.
Tannic acid can be identified by FTIR characterization in the presence of OH groups, C=C-C aromatic rings, C=O, and phenol groups [36]. According to Table 4, OH, C=C-C aromatic rings, C=O, and phenol groups were identified in the AZ31B/TA sample, indicating the formation of tannic acid in the coating. According to Chen et al., the primary amine group that emerged was hexamethylenediamine, implying that tannic acid and hexamethylenediamine cross-linking were achieved [37]. Tannic acid binds to hexamethylenediamine through Michael’s addition reaction and Schiff’s base reaction. The Michael addition reaction involves the cleavage of the double of the benzene ring, resulting in the formation of a C-N bond. The presence of a double bond between the C element of tannic acid and the N element of hexamethylenediamine (-C=N-) indicates a Schiff’s base reaction. The presence of OH, carboxylate, and amide groups in the FTIR characterization can be used to identify hyaluronic acid, according to Chui et al. [38]. The OH, carboxylate, and amide groups were identified in the FTIR spectra of the AZ31B/TA/HYA samples (Table 4), indicating the formation of hyaluronic acid in the coating. Covalent bonds form between the carboxyl group of hyaluronic acid and the amine group of tannic acid, immobilizing hyaluronic acid in the tannic acid layer [28,33]. After an immersion test for seven days, the FTIR results of the AZ31B/TA/HYA samples revealed the presence of phosphate and carbonate ions. The appearance of phosphate ions and carbonate ions in the FTIR results, according to Zhu et al., can lead to the formation of hydroxyapatite compounds on the sample surface [21].

3.3. Surface Properties Analysis of Samples in Contact with Liquids

To observe the surface of the sample in contact with the liquid, the contact angle on the surface of the sample was measured using water. The results of the contact angle measurement on the AZ31B, AZ31B/TA, and AZ31B/TA/HYA samples are shown in Figure 3. The water contact angle measurement data are shown in Figure 3A. The contact angle values of the three samples were below 90°, indicating that the surface of the sample was hydrophilic [25]. Furthermore, for samples coated with the sample sequence AZ31B > AZ31B/TA > AZ31B/TA/HYA, the contact angle decreased in both water and SBF solutions. The AZ31B/TA/HYA samples had the lowest contact angle values in both aqueous and SBF media, indicating that they increased the hydrophilic properties of the samples. The hydrophilic surface of the sample can have a higher cell affinity than the hydrophobic surface [15]. When the surface of the sample AZ31B/TA/HYA was in contact with water, the contact angle was 31.8°, whereas when the surface was in contact with the SBF solution, the contact angle was 28°. According to Asgari et al., a contact angle range of 20–40° can provide a high level of cell adhesion, allowing the AZ31B/TA/HYA sample to provide a better cell adhesion site. The adhesion energy was calculated using the contact angle data from the three samples using Equation (1), where the surface tension of the water was 72.32 mJ/m2, and that of the SBF solution was 72.53 mJ/m2 [32].
Figure 3B shows a graph of the adhesion energy data for AZ31B, AZ31B/TA, and AZ31B/TA/HYA. According to Indira et al. [32], the contact angle of the sample surface affects the increase in the adhesion energy value. The smaller the contact angle, the greater the value of the adhesion energy. With a value of 133.61 mJ/m2 on water media and 137.72 mJ/m2 on SBF solution media, the AZ31B/TA/HYA sample with the smallest contact angle will produce the highest adhesion energy value. The difference in contact angle and adhesion energy between the water medium and the SBF solution can be explained by the presence of ions in the SBF solution that react with the sample surface, reducing the contact angle and increasing the adhesion energy. The effect of the TA/HYA coating on the AZ31B sample, which can reduce the contact angle and increase the adhesion energy, indicated that the TA/HYA coating can improve the bio-wettability of the AZ31B sample [32].

3.4. Tafel Polarization Analysis

The cathodic polarization curve on the lower part of the curve, which shows the hydrogen evolution reaction, and the anodic polarization curve on the upper part of the curve, which shows the magnesium dissolution reaction, are the two branches of the Tafel polarization curve. The tafel polarization curve results show that coating the AZ31B sample with both TA and TA/HYA causes the curve to shift in a more positive direction on the y-axis. The measured corrosion potential value in the AZ31B/TA/HYA sample was more positive owing to the largest curve shift on the y-axis for the AZ31B sample. Because the energy required to remove electrons in the AZ31B/TA/HYA sample was higher, it was more difficult for the sample to remove electrons, indicating that the magnesium dissolution oxidation reaction in the AZ31B/TA/HYA sample was slower than that in AZ31B/TA sample. It will also inhibit the hydrogen evolution reaction in the sample by inhibiting the oxidation reaction [33]. Ecorr and Icorr values for each sample were determined and shown in Figure 4A for tafel polarization, and Figure 4B for OCP curve on samples AZ31B, AZ31B/TA, and AZ31B/TA/HYA.
According to the data in Table 5, the Ecorr value of the coated sample increased, with the AZ31B/TA/HYA sample having the highest Ecorr value of −1.447 V. The potential of the AZ31B/TA/HYA sample was higher than that of the AZ31B sample. TA and AZ31B indicate that the formed layer is more difficult to damage, thereby increasing the corrosion resistance of the sample [21]. Furthermore, based on the Icorr value of each sample, it can be seen that there is a decrease in Icorr in the order AZ31B/TA/HYA < AZ31B/TA < AZ31B. The Icorr value is derived from electron transfer from the anode to the cathode, resulting in an electric current. The higher the Icorr value, the faster the electron transfer at the anode, resulting in an oxidation reaction that causes corrosion. The reaction that occurs on the surface of the magnesium alloy is as follows [39]:
A n o d i c   R e a c t i o n   : Mg     Mg 2 + + 2 e
C a t o d i c   R e a c t i o n   : 2 H 2 O   + 2 e   H 2 + 2 OH
F o r m a t i o n   P r o d u c t   C o r r o s i o n   : Mg 2 + + 2 OH   Mg OH 2
By contrast, the lower the Icorr value, the slower the electron transfer from the anode, making it more corrosion resistant [21,33] With a decrease in Icorr, the corrosion resistance increased in the coated sample, with the AZ31B/TA/HYA sample having the highest corrosion resistance. Furthermore, to predict the corrosion rate in each sample, we can use the Icorr data from each sample, which can also be an indicator of the corrosion resistance of the sample. The corrosion rate of each sample is shown in Figure 5.
The ability of the AZ31B/TA and AZ31B/TA/HYA samples to withstand the corrosion rate on the magnesium alloy sample AZ31B after the coating is due to the ability of the tannic acid layer to bind Mg2+ via chelation bonds to form complex Mg–tannic bonds, with Mg2+ bound to the tannic acid layer. This can prevent the dissolving of Mg in the sample, increasing the corrosion resistance of the coating [40]. The increase in corrosion resistance in the sample AZ31B/TA/HYA was due to the tannic acid layer on the sample surface and the hyaluronic acid layer on top of the tannic acid layer. The carboxylate group in the hyaluronic acid layer binds Ca2+ ions from the SBF solution to the sample surface when the sample is immersed. Additionally, Ca2+ ions on the sample surface bind to PO43− produced by the SBF solution reaction, forming a hydroxyapatite compound on the sample surface that will act as a corrosion inhibitor [33].

3.5. Electrochemical Impedance Spectroscopy Analysis

Electrochemical impedance spectroscopy testing of the sample was performed to determine the charge transfer resistance that occurred in the sample, both uncoated and after coating. The results of the EIS test were in the form of a nyquist curve, as shown in Figure 6A. The nyquist curve is a semicircular curve with an imperfect shape that depicts the process of interfacial charge transfer between the electrode, electrolyte, and the coating layer on the sample surface. All of the coated samples increased the diameter of the semicircle when compared to the AZ31B sample, with the AZ31B/TA/HYA sample having the largest diameter, thus showing the best corrosion resistance among the other samples. Figure 6B,C present the bode impedance and bode phase plots for AZ31B, AZ31B/TA, and AZ31B/TA/HYA. The equivalent electrical circuit model shown in Figure 6D was used to install the impedance spectrum data for AZ31B, AZ31B/TA, and AZ31B/TA/HYA.
The series circuit represents the arrangement of the SBF solution, coating layer, and magnesium base in this equivalent electrical circuit, whereas the parallel circuit represents phenomena in the sample, such as double-layer formation, electron transfer, and corrosion systems. The resistance (R), a constant phase element (Q), and an inductance comprise an equivalent electrical circuit (L). In an electrical circuit, the resistance is made up of Rs, which stands for solution resistance, Rct, which represents the charge transfer resistance, Rp, which represents the coating resistance, and RL, which represents the inductor resistance. Additionally, using the equation from [41,42] the value of the constant phase element can be found for the Cdl value representing the double-layer capacitance and the Cp value representing the coating capacitance. As shown in Table 6, the electrochemical data were obtained from the test results.
The notch on the Nyquist curve formed by the inductance values obtained from the EIS results for the AZ31B sample without coating indicates that the AZ31B sample was continuously dissolved by charge transfer between the surface of the AZ31B sample and the SBF solution [43]. The Rct value is directly proportional to the difficulty of removing electrons from the sample metal and thus to the corrosion reaction in the sample [33]. As shown in Table 6, the sample AZ31B/TA/HYA has the highest Rct value (1.284 × 106 cm2), followed by the sample AZ31B/TA (4.676 × 105 cm2), and then the AZ31B (1.823 × 104 cm2) samples. As a result, the AZ31B/TA/HYA sample had a higher Rct value than the AZ31B/TA sample and the AZ31B samples, indicating a better corrosion resistance increase. Furthermore, it can be seen that the Cdl value decreased after the coating process was completed on the sample, which could be due to absorption affecting the double layer present at the sample surface–SBF solution interface. The ions from the solution are adsorbed onto the sample surface, forming a double-layer [43]. The AZ31B/TA/HYA sample had the lowest Cdl value, with a value of 2.937 × 10⁻⁶ F/cm2, compared to the AZ31B/TA sample, which had a Cdl value of 5.8962 × 10⁻⁶ F/cm2, and the AZ31B sample, which had a Cdl value of 1.3452 × 10⁻⁵ F/cm2. A low Cdl value indicates an increase in the thickness of the double layer owing to the absorption of ions from the SBF solution so as to form a protective layer on the sample surface.

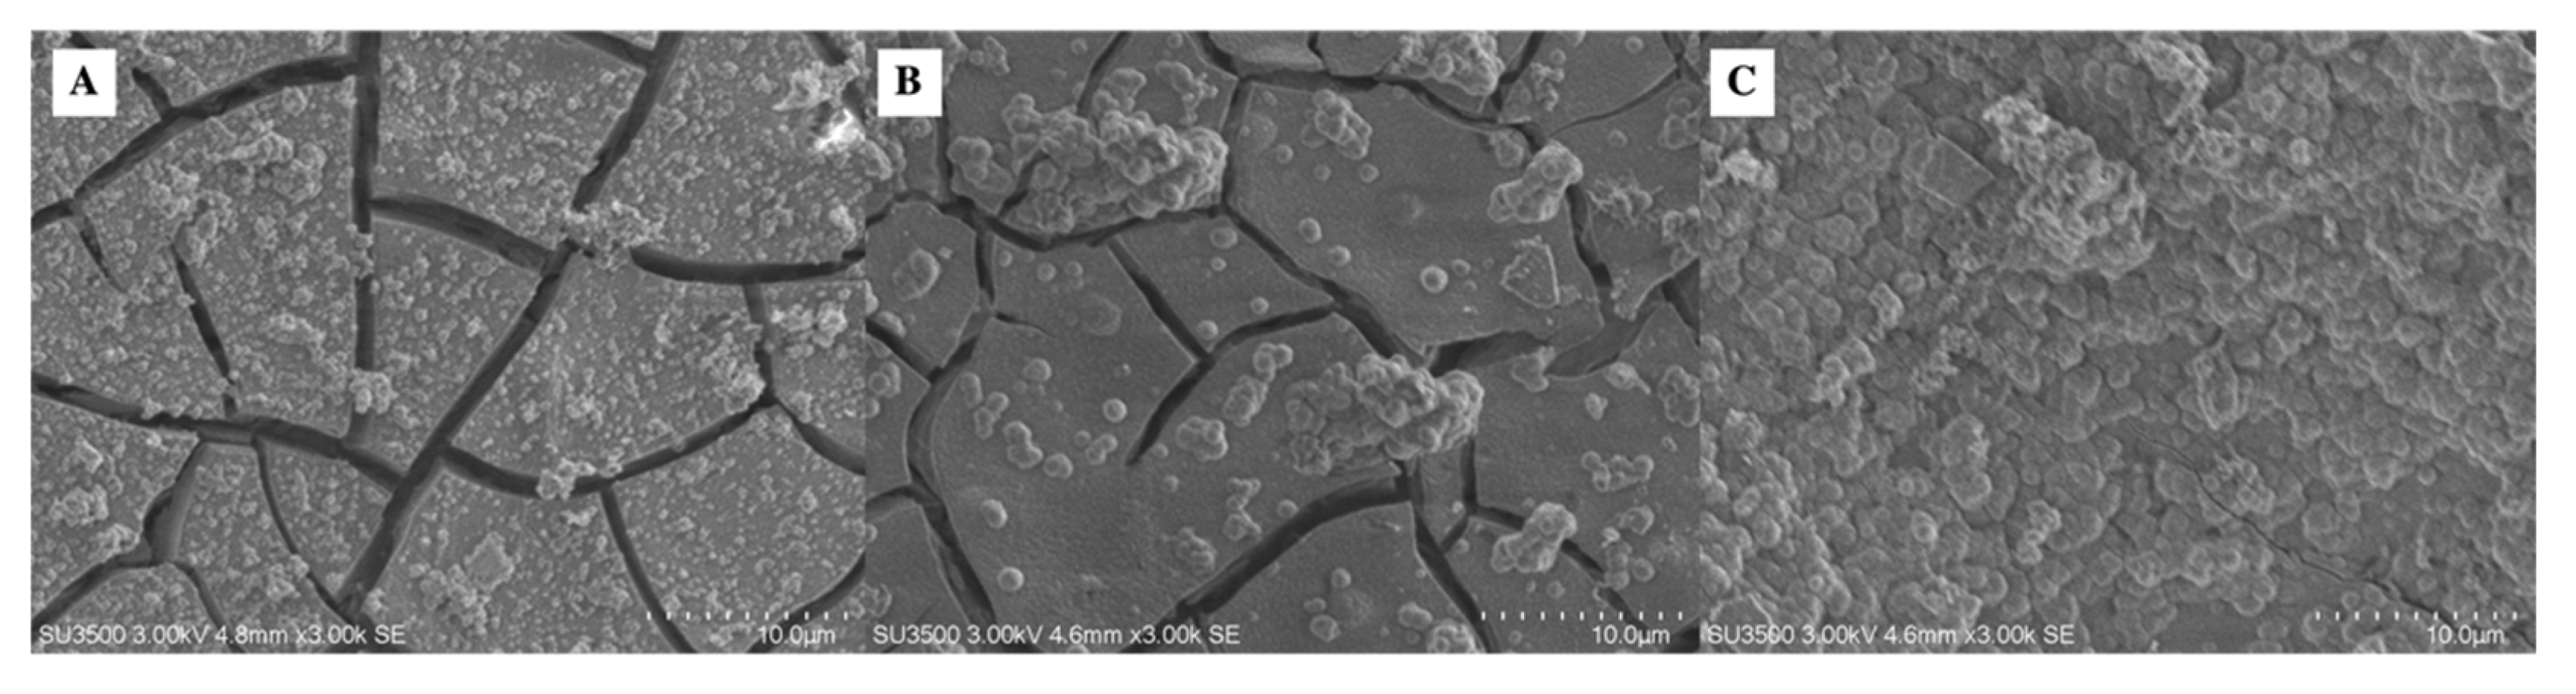
3.6. Surface Morphological Analysis of Samples after Immersion Test

After the immersion test was carried out for seven days in the SBF solution on each sample, observations were made on the sample surface using SEM. The SEM observations are shown in Figure 7. Figure 7A shows the surface of the AZ31B sample, which shows that corrosion occurred, with cracks that are deeper and more numerous than in the samples that were coated with the coating process. Cracks were observed in samples AZ31B/TA and AZ31/TA/HYA; however, they were not as deep as the cracks in sample AZ31B. As a result of the interaction between the sample and the SBF solution, corrosion was deposited onto the sample surface during the immersion test, and it began to cover the cracks on the sample surface. Furthermore, EDS characterization was carried out on the surface of the sample that had been immersed for seven days. The results of EDS characterization are presented in Table 7.
After the immersion test, Ca and P were present on the surface of the sample, according to the EDS data in Table 7. The SBF solution used as the immersion test solution contained these two elements. With a value of 16.28%, the AZ31B/TA/HYA sample had the highest percentage of Ca, followed by the AZ31B/TA sample with a value of 14.96%, and the AZ31B sample with a value of 12.95%. Furthermore, the percentage of P in the AZ31B/TA/HYA sample was 30.16%, followed by the AZ31B/TA sample with a value of 27.53%, and the AZ31B sample with a value of 18.93%. The occurrence of a biomineralization process in each sample can be determined by the deposition of Ca and P elements on the sample surface. Owing to the presence of intermolecular chelation bonds of hyaluronic acid through the carboxyl group (COO), which bind calcium ions (Ca2+), the presence of hyaluronic acid in the sample AZ31B/TA/HYA promotes crystal nucleation and deposition of calcium phosphate on the sample surface [44,45]. EDS data, on the other hand, cannot be used to determine the type of compound formed on the sample surface [46]. Therefore, additional characterization of the immersion test sample surface was required.

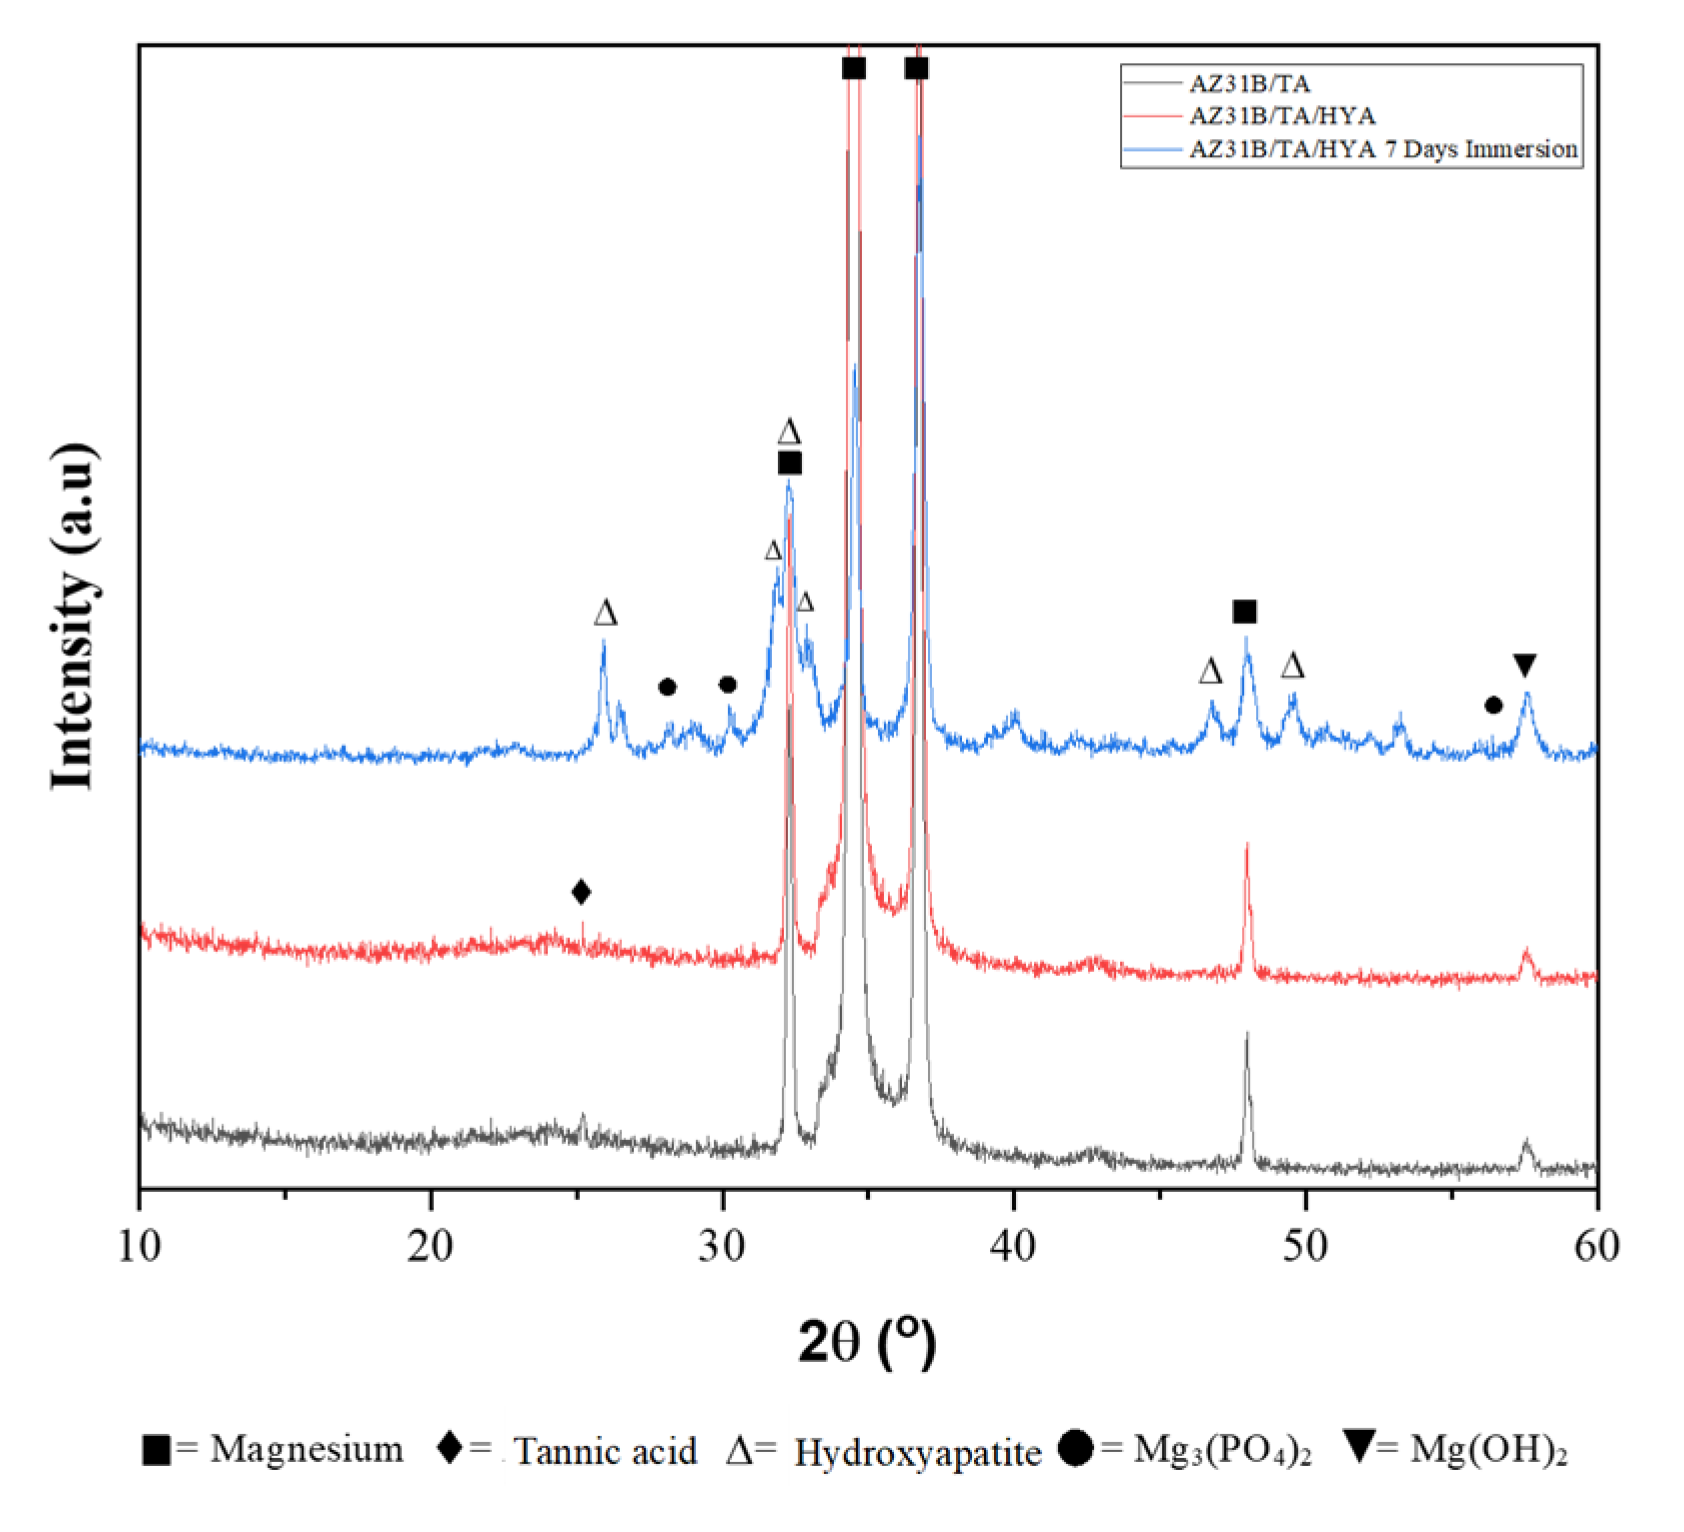
3.7. X-ray Diffraction Analysis

After immersion for seven days, XRD characterization was performed on the sample to identify the compounds present. The XRD curve results were matched with Crystallography Open Database (COD) data in the software named Match! and Figure 8 shows that all the samples identified magnesium at a diffraction angle of 2θ with values of 32.2°, 34.55°, 36.76°, and 47.98°, which matched the COD ID data 9013054. Furthermore, in the samples AZ31B/TA and AZ31B/TA/HYA, the diffraction angle value of 2θ in the range of 10°–30° show that a peak with low counts appears at 25.2°, indicating that there is a layer of tannic acid on the surface of the sample. Apart from the presence of tannic acid, no crystalline phase was found in the 10°–30° range, implying that the layer formed was an amorphous [47]. The hydroxyapatite compounds were found to be 25.9°, 31.89°, 32.2°, 32.87°, 40.02°, 46.78°, and 49.6°, at a diffraction angle of 2θ in the XRD results of the AZ31B/TA/HYA samples after the immersion process, according to COD ID data 9011091. Furthermore, Mg3(PO4)2 compounds were detected at a diffraction angle of 2θ with values of 28.1°, 30.21°, and 56.4° which are in accordance with the COD ID data 1008830, and Mg(OH)2 compounds were also found at a diffraction angle of 2θ with a value of 57.55°, which is in accordance with the COD ID data 9003875. Furthermore, the results of the sample compounds after seven days of SBF immersion on AZ31B/TA/HYA are shown in Table 8.
The formation of hydroxyapatite compounds identified on the surface of the AZ31B/TA/HYA samples from the XRD characterization occurred because the TA/HYA layer has a carboxyl group that binds to Ca2+ ions and then Ca2+ ions will bind to PO43− ions to form hydroxyapatite through a reaction that starts with the reduction of H2PO4 and HPO42− derived from the SBF solution [40]. Furthermore, Ca2+ ions will bind to PO43− ions to form hydroxyapatite through the following reaction [40,48]:
H 2 O 2 + 2 e   2 OH
HPO 4 + OH   HPO 4 2 + H 2 O  
HPO 4 2 + OH   PO 4 3 + H 2 O
10 Ca 2 + + 6 PO 4 3 + 2 OH - >   Ca 10 PO 4 6 OH 2
Covering the cracks with hydroxyapatite increases the corrosion resistance of the magnesium alloy sample [40]. However, the formation of hydroxyapatite was inhibited because of the reaction that occurred between the sample and SBF solution during the immersion test. This is initiated by the corrosion reaction that occurs on the surface of the magnesium alloy.
The formed Mg(OH)2 compound can react with chloride ions from the SBF solution to convert Mg(OH)2 into the more soluble MgCl2, thereby increasing the dissolution of magnesium AZ31B [49]. When the immersion test was carried out on the sample for seven days, there was an increase in Mg2+ ions, which would block the hydroxyapatite growth site on the sample surface, thereby reducing the precipitation on the magnesium surface. The mechanism of inhibition of hydroxyapatite growth begins with Mg2+ ions which react with HPO4− ions to form Mg(H2PO4)2 compounds, which, when reacted with water, form Mg3(PO4)2 corrosion products [50]. H3PO4 consumes OH, which accelerates the reaction and promotes precipitation of insoluble Mg3(PO4)2. The formation of hydroxyapatite was inhibited by the corrosion product deposits.

3.8. Mass Changes Analysis in Seven Days of SBF Immersion

After the SBF immersion test process was completed and the sample surface was cleaned to remove corrosion products, the sample will experience a mass change, as shown in Table 9. After the corrosion products were removed from the surface of the sample during the immersion test process for seven days, the mass of the AZ31B, AZ31B/TA, AZ31B/TA/HYA samples decreased by 0.151 g, 0.100 g, and 0.100 g, respectively. The mass reduction in the sample can be attributed to the pH changes that occur in the sample after seven days of SBF immersion, as shown in Figure 9.
Figure 9 shows that the three samples had a significant increase in pH after the first day of the immersion test. This increase in pH could be due to contact between the sample surface and the SBF solution, resulting in the dissolution Mg2+ and increase in the concentration of OH. Because there is an uncoated sample surface that is not covered during the immersion test, contacts can occur in the samples AZ31B/TA and AZ31B/TA/HYA. The coated surface will prevent the sample surface from making direct contact with the SBF solution. The pH value decreased after soaking for seven days compared to the first day, which could be due to the formation of a protective layer of corrosion products which slows down the dissolution of Mg2+ [23]. The pH of the sample AZ31B/TA/HYA is lower than that of the samples AZ31B/TA and AZ31B. With a lower pH after seven days of SBF immersion, it can be assumed that Mg2+ dissolution and OH concentration in the sample AZ31B/TA/HYA were lower, resulting in the lowest mass reduction.

4. Conclusions

This study successfully fabricated a tannic acid–hyaluronic acid coating on the AZ31B magnesium alloy. According to the SEM analysis, the surface of the AZ31B/TA sample exhibited cracks that appeared in the layer. Because the hyaluronic acid layer had covered the cracks caused by the tannic acid coating process, there were no visible cracks on the surface of the AZ31B/TA/HYA sample. In this study, mineralization occurred in the presence of Ca and P deposits after the immersion test. This can increase corrosion resistance because the layer can bind Mg2+ ions and form hydroxyapatite above the layer. After the coating process, there was a decrease in the contact angles of AZ31B, AZ31B/TA, and AZ31B/TA/HYA using water media. The values were 62.5°, 35°, and 31.8°. The AZ31B sample had an Icorr of 3.29 × 10⁻⁴, the AZ31B/TA sample had an Icorr of 1.18 × 10⁻⁴, and the AZ31B/TA/HYA sample had an Icorr of 9.11 × 10⁻⁶. With a decrease in Icorr, the corrosion resistance increased in the coated sample, with the AZ31B/TA/HYA sample having the highest corrosion resistance. The AZ31B sample had a corrosion rate of 7.379 mm/year, the AZ31B/TA sample had a corrosion rate of 2.646 mm/year, and the AZ31B/TA/HYA sample had a corrosion rate of 0.204 mm/year, which is within the implant corrosion rate range (0.2–0.5 mm/year) and corresponds to bone growth within 3–6 months.

Author Contributions

Writing—original draft, review, and editing A.S. and A.P.; Data collection and interpreting of EIS and tafel works A.N.; Supervision, discuss to the first conception, revising the draft, and final approval of the version to be published H.H. and A.B.; supervision, substantial contribution to the conception, final approval of the version to be published, and agreement to be accountable for all aspects of the work E.P. All authors have read and agreed to the published version of the manuscript.

Funding

This research was funded by “Skema WCR (PN-7)” grant number 079/SP2H/LT/DRPM/2021.

Institutional Review Board Statement

Not applicable.

Informed Consent Statement

Not applicable.

Data Availability Statement

Not applicable.

Acknowledgments

We acknowledge the World Class Research scheme from “The Ministry of Research, Technology, and Higher Education” Indonesia.

Conflicts of Interest

The authors declare no conflict of interest.

References

  1. Wu, A.-M.; Bisignano, C.; James, S.L.; Abady, G.G.; Abedi, A.; Abu-Gharbieh, E.; Alhassan, R.K.; Alipour, V.; Arabloo, J.; Asaad, M.; et al. Global, Regional, and National Burden of Bone Fractures in 204 Countries and Territories, 1990–2019: A Systematic Analysis from the Global Burden of Disease Study 2019. Lancet Healthy Longev. 2021, 2, e580–e592. [Google Scholar] [CrossRef] [PubMed]
  2. Oryan, A.; Monazzah, S.; Bigham-Sadegh, A. Bone Injury and Fracture Healing Biology. Biomed. Environ. Sci. 2015, 28, 57–71. [Google Scholar] [PubMed]
  3. Ghiasi, M.S.; Chen, J.; Vaziri, A.; Rodriguez, E.K.; Nazarian, A. Bone Fracture Healing in Mechanobiological Modeling: A Review of Principles and Methods. Bone Rep. 2016, 6, 87–100. [Google Scholar] [CrossRef] [PubMed]
  4. Tsakiris, V.; Tardei, C.; Clicinschi, F.M. Biodegradable Mg Alloys for Orthopedic Implants—A Review. J. Magnes. Alloy. 2021, 9, 1884–1905. [Google Scholar] [CrossRef]
  5. Shinde, O.S. Orthopedic Implants Market by Product Type (Reconstructive Joint Replacements, Spinal Implants, Dental Implants, Trauma, Orthobiologics, and Others), Biomaterial, and Type: Global Opportunity Analysis and Industry Forecast, 2018–2025. Diakses 2019, 1, 2021. [Google Scholar]
  6. Goriainov, V.; Cook, R.; Latham, J.M.; Dunlop, D.G.; Oreffo, R.O. Bone and Metal: An Orthopaedic Perspective on Osseointegration of Metals. Acta Biomater. 2014, 10, 4043–4057. [Google Scholar] [CrossRef]
  7. Hussain, Z.; Ullah, I.; Liu, X.; Shen, W.; Ding, P.; Zhang, Y.; Gao, T.; Mansoorianfar, M.; Gao, T.; Pei, R. Tannin-Reinforced Iron Substituted Hydroxyapatite Nanorods Functionalized Collagen-Based Composite Nanofibrous Coating as a Cell-Instructive Bone-Implant Interface Scaffold. Chem. Eng. J. 2022, 438, 135611. [Google Scholar] [CrossRef]
  8. Manam, N.S.; Harun, W.S.W.; Shri, D.N.A.; Ghani, S.A.C.; Kurniawan, T.; Ismail, M.H.; Ibrahim, M.H.I. Study of Corrosion in Biocompatible Metals for Implants: A Review. J. Alloys Compd. 2017, 701, 698–715. [Google Scholar] [CrossRef] [Green Version]
  9. Girish, C.; Ajay, P. Biodegradable Bone Implants in Orthopedic Applicaions: A Review. Biocybern. Biomed. Eng. 2020, 40, 596–610. [Google Scholar]
  10. Kamrani, S.; Fleck, C. Biodegradable Magnesium Alloys as Temporary Orthopaedic Implants: A Review. BioMetals 2019, 32, 185–193. [Google Scholar] [CrossRef]
  11. Sharma, S.K.; Saxena, K.K.; Kumar, K.B.; Kumar, N. The Effect of Reinforcements on the Mechanical Properties of AZ31 Composites Prepared by Powder Metallurgy: An Overview. Mater. Today Proc. 2022, 56, 2293–2299. [Google Scholar] [CrossRef]
  12. Mert, F. Wear Behaviour of Hot Rolled AZ31B Magnesium Alloy as Candidate for Biodegradable Implant Material. Trans. Nonferrous Met. Soc. China 2017, 27, 2598–2606. [Google Scholar] [CrossRef]
  13. Ugender, S.; Kumar, A.; Reddy, A.S. Microstructure and Mechanical Properties of AZ31B Magnesium Alloy by Friction Stir Welding. Procedia Mater. Sci. 2014, 6, 1600–1609. [Google Scholar] [CrossRef]
  14. Willbold, E.; Kaya, A.A.; Kaya, R.A.; Beckmann, F.; Witte, F. Corrosion of Magnesium Alloy AZ31 Screws Is Dependent on the Implantation Site. Mater. Sci. Eng. B 2011, 176, 1835–1840. [Google Scholar] [CrossRef]
  15. Rahman, M.; Dutta, N.K.; Choudhury, N.R. Magnesium Alloys With Tunable Interfaces as Bone Implant Materials. Front. Bioeng. Biotechnol. 2020, 8, 564. [Google Scholar] [CrossRef]
  16. Kulyasova, O.B.; Khudododova, G.D.; Dyakonov, G.S.; Zheng, Y.; Valiev, R.Z. Effect of Microstructure Refinement on the Corrosion Behavior of the Bioresorbable Mg-1Zn-0.2Ca and Mg-1Ca Alloys. Materials 2022, 15, 6749. [Google Scholar] [CrossRef]
  17. Yang, Y.; He, C.; E, D.; Yang, W.; Qi, F.; Xie, D.; Shen, L.; Peng, S.; Shuai, C. Mg Bone Implant: Features, Developments and Perspectives. Mater. Des. 2020, 185, 108259. [Google Scholar] [CrossRef]
  18. Hu, H.; Nie, X.; Ma, Y. Corrosion and Surface Treatment of Magnesium Alloys. In Magnesium Alloys—Properties in Solid and Liquid States; InTech: London, UK, 2014; Volume 25, pp. 206–214. [Google Scholar]
  19. Guo, Z.; Xie, W.; Lu, J.; Guo, X.; Xu, J.; Xu, W.; Chi, Y.; Takuya, N.; Wu, H.; Zhao, L. Tannic Acid-Based Metal Phenolic Networks for Bio-Applications: A Review. J. Mater. Chem. B 2021, 9, 4098–4110. [Google Scholar] [CrossRef]
  20. Koopmann, A.-K.; Schuster, C.; Torres-Rodríguez, J.; Kain, S.; Pertl-Obermeyer, H.; Petutschnigg, A.; Hüsing, N. Tannin-Based Hybrid Materials and Their Applications: A Review. Molecules 2020, 25, 4910. [Google Scholar] [CrossRef]
  21. Zhu, B.; Wang, S.; Wang, L.; Yang, Y.; Liang, J.; Cao, B. Preparation of Hydroxyapatite/Tannic Acid Coating to Enhance the Corrosion Resistance and Cytocompatibility of AZ31 Magnesium Alloys. Coatings 2017, 7, 105. [Google Scholar] [CrossRef] [Green Version]
  22. Bigham, A.; Rahimkhoei, V.; Abasian, P.; Delfi, M.; Naderi, J.; Ghomi, M.; Dabbagh Moghaddam, F.; Waqar, T.; Nuri Ertas, Y.; Sharifi, S.; et al. Advances in Tannic Acid-Incorporated Biomaterials: Infection Treatment, Regenerative Medicine, Cancer Therapy, and Biosensing. Chem. Eng. J. 2022, 432, 134146. [Google Scholar] [CrossRef]
  23. Asgari, M.; Yang, Y.; Yang, S.; Yu, Z.; Yarlagadda, P.K.D.V.; Xiao, Y.; Li, Z. Mg−Phenolic Network Strategy for Enhancing Corrosion Resistance and Osteocompatibility of Degradable Magnesium Alloys. ACS Omega 2019, 4, 21931–21944. [Google Scholar] [CrossRef] [PubMed] [Green Version]
  24. Kawada, C.; Kimura, M.; Masuda, Y.; Nomura, Y. Oral Administration of Hyaluronan Prevents Skin Dryness and Epidermal Thickening in Ultraviolet Irradiated Hairless Mice. J. Photochem. Photobiol. B Biol. 2015, 153, 215–221. [Google Scholar] [CrossRef] [PubMed]
  25. Agarwal, S.; Labour, M.-N.; Hoey, D.; Duffy, B.; Curtin, J.; Jaiswal, S. Enhanced Corrosion Resistance and Cytocompatibility of Biomimetic Hyaluronic Acid Functionalised Silane Coating on AZ31 Mg Alloy for Orthopaedic Applications. Mater. Med. 2018, 29, 144. [Google Scholar] [CrossRef] [Green Version]
  26. Li, Y.; Ruan, S.; Wang, Z.; Feng, N.; Zhang, Y. Hyaluronic Acid Coating Reduces the Leakage of Melittin Encapsulated in Liposomes and Increases Targeted Delivery to Melanoma Cells. Pharmaceutics 2021, 13, 1235. [Google Scholar] [CrossRef]
  27. Sieger, D.; Korzinskas, T.; Jung, O.; Stojanovic, S.; Wenisch, S.; Smeets, R.; Gosau, M.; Schnettler, R.; Najman, S.; Barbeck, M. The Addition of High Doses of Hyaluronic Acid to a Biphasic Bone Substitute Decreases the Proinflammatory Tissue Response. Int. J. Mol. Sci. 2019, 20, 1969. [Google Scholar] [CrossRef] [Green Version]
  28. Zhou, Z.; Zheng, B.; Lang, H.; Qin, A.; Ou, J. Corrosion resistance and biocompatibility of polydopamine/hyaluronic acid composite coating on AZ31 magnesium alloy. Surfaces Interfaces 2020, 20, 100560. [Google Scholar] [CrossRef]
  29. Gwak, M.A.; Hong, B.M.; Park, W.H. Hyaluronic Acid/Tannic Acid Hydrogel Sunscreen with Excellent Anti-UV, Antioxidant, and Cooling Effects. Int. J. Biol. Macromol. 2021, 191, 918–924. [Google Scholar] [CrossRef]
  30. Liang, Z.; Qin, G.; Wang, L.; Meng, X.; Li, F. Microstructural Characterization and Mechanical Properties of Dissimilar Friction Welding of 1060 Aluminum to AZ31B Magnesium Alloy. Mater. Sci. Eng. A 2015, 645, 170–180. [Google Scholar] [CrossRef]
  31. Oyane, A.; Kim, H.-M.; Furuya, T.; Kokubo, T.; Miyazaki, T.; Nakamura, T. Preparation and Assessment of Revised Simulated Body Fluids. J. Biomed. Mater. Res. 2003, 65, 188–195. [Google Scholar] [CrossRef]
  32. Indira, K.; Sylvie, C.; Zhongke, W.; Hongyu, Z. Investigation of Wettability Properties of Laser Surface Modified Rare Earth Mg Alloy. Procedia Eng. 2016, 141, 63–69. [Google Scholar] [CrossRef] [Green Version]
  33. Chen, S.; Zhao, S.; Chen, M.; Zhang, X.; Zhang, J.; Li, X.; Zhang, H.; Shen, X.; Wang, J.; Huang, N. The Anticorrosion Mechanism of Phenolic Conversion Coating Applied on Magnesium Implants. Appl. Surf. Sci. 2018, 463, 953–967. [Google Scholar] [CrossRef]
  34. Baillot, R.; Deshayes, Y. Tools and Analysis Methods of Encapsulated LEDs. In Reliability Investigation of LED Devices for Public Light Applications; ISTE Press: Amsterdam, The Netherlands, 2017; pp. 43–106. [Google Scholar]
  35. Dovedytis, M.; Liu, Z.J.; Bartlett, S. Hyaluronic Acid and Its Biomedical Applications: A Review. Eng. Regen. 2020, 1, 102–113. [Google Scholar] [CrossRef]
  36. Chen, X.; Li, G.; Lian, J.; Jiang, Q. Study of the Formation and Growth of Tannic Acid Based Conversion Coating on AZ91D Magnesium Alloy. Surf. Coat. Technol. 2009, 204, 736–747. [Google Scholar] [CrossRef]
  37. Santiago-Medina, F.-J.; Pizzi, A.; Basso, M.C.; Delmotte, L.; Celzard, A. Polycondensation Resins by Flavonoid Tannins Reaction with Amines. Polymers 2017, 9, 37. [Google Scholar] [CrossRef] [PubMed] [Green Version]
  38. Kim, Y.-K.; Jang, Y.-S.; Kim, S.-Y.; Lee, M.-H. Functions achieved by the hyaluronic acid derivatives coating and hydroxide film on bio-absorbed Mg. Appl. Surf. Sci. 2018, 473, 31–39. [Google Scholar] [CrossRef]
  39. Lan, X.; Zhang, J.; Wang, Z.; Zhang, R.; Sand, W.; Zhang, L.; Duan, J.; Zhu, Q.; Hou, B. Corrosion of an AZ31B Magnesium Alloy by Sulfate-Reducing Prokaryotes in a Mudflat Environment. Microorganisms 2022, 10, 839. [Google Scholar] [CrossRef]
  40. Cui, L.-Y.; Liu, H.-P.; Xue, K.; Zhang, W.-L.; Zeng, R.-C.; Li, S.-Q.; Xu, D.; Han, E.-H.; Guan, S.-K. In Vitro Corrosion and Antibacterial Performance of Micro-Arc Oxidation Coating on {AZ}31 Magnesium Alloy: Effects of Tannic Acid. J. Electrochem. Soc. 2018, 165, C821–C829. [Google Scholar] [CrossRef]
  41. He, X.; Zhang, G.; Pei, Y.; Zhang, H. Layered hydroxide/polydopamine/hyaluronic acid functionalized magnesium alloys for enhanced anticorrosion, biocompatibility and antithrombogenicity in vascular stents. J. Biomater. Appl. 2020, 34, 1131–1141. [Google Scholar] [CrossRef]
  42. Hernandez-Alvarado, L.A.; Hernandez, L.S.; Lomeli, M.A.; Miranda-Vidales, J.M.; Narvaez, L.; Escudero, M.L. Corrosion rates of reabsorbable Mg-based materials coated with phytic acid. Corros. Eng. Sci. Technol. 2021, 56, 714–727. [Google Scholar] [CrossRef]
  43. Xu, W.; Han, E.-H.; Wang, Z. Effect of tannic acid on corrosion behavior of carbon steel in NaCl solution. J. Mater. Sci. Technol. 2018, 35, 64–75. [Google Scholar] [CrossRef]
  44. Zhai, P.; Peng, X.; Li, B.; Liu, Y.; Sun, H.; Li, X. The application of hyaluronic acid in bone regeneration. Int. J. Biol. Macromol. 2019, 151, 1224–1239. [Google Scholar] [CrossRef] [PubMed]
  45. Chen, Y.; Feng, Y.; Deveaux, J.G.; Masoud, M.A.; Chandra, F.S.; Chen, H.; Zhang, D.; Feng, L. Biomineralization Forming Process and Bio-inspired Nanomaterials for Biomedical Application: A Review. Minerals 2019, 9, 68. [Google Scholar] [CrossRef] [Green Version]
  46. Newbury, D.E.; Ritchie, N.W.M. Is Scanning Electron Microscopy/Energy Dispersive X-Ray Spectrometry (SEM/EDS) Quantitative? Scanning 2013, 35, 141–168. [Google Scholar] [CrossRef] [PubMed]
  47. Li, Y.-M.; Miao, X.; Wei, Z.; Cui, J.; Li, S.Y.; Han, R.; Zhang, Y.; Wei, W. Iron-Tannic Acid Nanocomplexes: Facile Synthesis and Application for Removal of Methylene Blue from Aqueous Solution. J. Nanomater. Biostruct. 2016, 11, 1045–1061. [Google Scholar]
  48. Schwartz, A.; Kossenko, A.; Zinigrad, M.; Gofer, Y.; Borodianskiy, K.; Sobolev, A. Hydroxyapatite Coating on Ti-6Al-7Nb Alloy by Plasma Electrolytic Oxidation in Salt-Based Electrolyte. Materials 2022, 15, 7374. [Google Scholar] [CrossRef]
  49. Yang, L.; Zhang, E. Biocorrosion Behavior of Magnesium Alloy in Different Simulated Fluids for Biomedical Application. Mater. Sci. Eng. C 2009, 29, 1691–1696. [Google Scholar] [CrossRef]
  50. Xin, Y.; Liu, C.; Zhang, X.; Tang, G.; Tian, X.; Chu, P.K. Corrosion Behavior of Biomedical AZ91 Magnesium Alloy in Simulated Body Fluids. J. Mater. Res. 2007, 22, 2004–2011. [Google Scholar] [CrossRef] [Green Version]
Figure 1. The SEM images of different samples (A) Native AZ31B; (B) AZ31B/TA; and (C) AZ31B/TA/HYA.
Metals 13 00494 g001
Figure 2. FTIR characteristics of AZ31B, AZ31B/TA, and AZ31B/TA/HYA, after seven days SBF immersion.
Metals 13 00494 g002
Figure 3. (A) Water contact angle data on samples AZ31B, AZ31B/TA, and AZ31B/TA/HYA; (B) Adhesion energy data on samples AZ31B, AZ31B/TA, and AZ31B/TA/HYA.
Metals 13 00494 g003
Figure 4. (A) Tafel polarization curve on samples AZ31B, AZ31B/TA, and AZ31B/TA/HYA; (B) OCP curve on samples AZ31B, AZ31B/TA, and AZ31B/TA/HYA.
Metals 13 00494 g004
Figure 5. Corrosion rate value on sampleAZ31B; AZ31B/TA; and AZ31B/TA/HYA.
Metals 13 00494 g005
Figure 6. (A) A nyquist curve on the samples AZ31B, AZ31B/TA, and AZ31B/TA/HYA; (B) Bode impedance plot on the samples AZ31B, AZ31B/TA, and AZ31B/TA/HYA; (C) Bode phase plot on the samples AZ31B, AZ31B/TA, and AZ31B/TA/HYA; and (D) Equivalent electrical circuit (left) AZ31B without coating; (right) AZ31B with coating.
Metals 13 00494 g006
Figure 7. The SEM images of different samples after seven days of SBF immersion (A) Native AZ31B; (B) AZ31B/TA; and (C) AZ31B/TA/HYA.
Metals 13 00494 g007
Figure 8. XRD results of samples AZ31B, AZ31B/TA, and AZ31B/TA/HYA after seven days of SBF immersion test.
Metals 13 00494 g008
Figure 9. Changes in the pH of the solution in the immersion process of AZ31B, AZ31B/TA, and AZ31B/TA/HYA samples for seven days.
Metals 13 00494 g009
Table 1. AZ31B magnesium alloy chemical composition [30]. Copyright 2015 Elsevier.
MaterialChemical Composition (%wt)
AlFeMnNiSiZnMg
AZ31B Magnesium Alloy2.250.0050.440.0010.0161.10Bal.
Table 2. Chemical composition of SBF solution (g·L−1) [31]. Copyright 2003 Wiley.
ReagentsComposition
Purity (%)c-SBF
NaCl>99.58.036 g
NaHCO3>99.50.352 g
KCl>99.50.255 g
K2HPO4·3H2O>990.230 g
MgCl2·6H2O>980.311 g
1.0 M–HCl-40 mL
CaCl2>950.293 g
Na2SO4>990.072 g
TRIS>99.96.603 g
1.0–HCl-±0.2 mL
Table 3. EDS results of samples AZ31B, AZ31B/TA, and AZ31B/TA/HYA after coating.
ElementsSamples (%wt)
AZ31BAZ31B/TAAZ31B/TA/HYA
Magnesium95.969.30.58
Aluminium3.290.22-
Zinc0.75--
Carbon-63.346.19
Oxygen-27.1853.23
Table 4. Identification results of functional groups in the sample after seven days of SBF immersion.
SamplesWavenumbers
(cm−1)
Functional Groups
AZ31B/TA1074.35Primary amine
1205.51Phenol
1350.17Aromatic secondary amine
1498.69C=C-C Aromatic ring stretch
1602.85-C=N-
1705.07Ketone (C=O)
2860.43Methylene (>CH2)
3390.86Hydroxyl group
AZ31B/TA/HYA1072.42Primary amine
1213.23Phenol
1367.53Carboxylate
1425.40-OH from carboxylic acid
1496.76C=C-C Aromatic ring stretch
1633.71Amide
2862.36Methylene (>CH2)
3408.22Hydroxyl group
AZ31B/TA/HYA after seven days of SBF immersion867.97Carbonate ion
1053.13Phosphate ion
1479.40Carbonate ion
3427.51Hydroxyl Group
Table 5. Ecorr and Icorr data on AZ31B, AZ31B/TA, and AZ31B/TA/HYA samples.
SamplesEcorr (V)log Icorr (A/cm2)Icorr (A/cm2)βa (V.dec−1)βc (V.dec−1)
AZ31B−1.6101−3.48163.29 × 10−40.120.12
AZ31B/TA−1.5412−3.92801.18 × 10−40.090.09
AZ31B/TA/HYA−1.4470−5.04069.11 × 10−60.540.14
Table 6. EIS measurement results on samples AZ31B, AZ31B/TA, and AZ31B/TA/HYA.
SamplesAZ31BAZ31B/TAAZ31B/TA/HYA
Rs (Ω cm2)14.0220.8217.32
Cp (F/cm2)-1.487 × 10−62.171 × 10−6
Rp (Ω cm2)-206.9535.6
Cdl (F/cm2)1.345 × 10−55.896 × 10−62.937 × 10⁻⁶
Rct (Ω cm2)1.823 × 1044.676 × 1051.284 × 106
RL (Ω cm2)1.592 × 10⁴--
L (Henri)1.079 × 10⁴--
Table 7. EDS results of samples AZ31B, AZ31B/TA, and AZ31B/TA/HYA after seven days SBF immersion test.
SamplesSamples (% wt)
AZ31BAZ31B/TAAZ31B/TA/HYA
Magnesium14.947.315.74
Calcium12.9514.9616.28
Phosphorus18.9327.5330.16
Carbon4.35.675.00
Oxygen48.8844.5453.23
Table 8. Sample compounds after seven days of SBF immersion on AZ31B/TA/HYA.
Compound FormulaCompound NameCOD Number
MgMagnesium9013054
Ca5(PO4)3OHHydroxyapatite9011091
Mg3(PO4)2Magnesium Phosphate1008830
Mg(OH)2Magnesium Hydroxide9003875
Table 9. Mass change data of each sample afterseven days of SBF immersion test.
SamplesMass (gr)Mass Difference (gr)Standard
Deviation
Before Immersion TestAfter Immersion Test
AZ31B0.6100.459−0.1510.0037
AZ31B/TA0.4100.310−0.1000.0055
AZ31B/TA/HYA0.3700.310−0.0600.0050
Disclaimer/Publisher’s Note: The statements, opinions and data contained in all publications are solely those of the individual author(s) and contributor(s) and not of MDPI and/or the editor(s). MDPI and/or the editor(s) disclaim responsibility for any injury to people or property resulting from any ideas, methods, instructions or products referred to in the content.

