Article

Effect of Heat Treatment on the Electrochemical Behavior of AA2055 and AA2024 Alloys for Aeronautical Applications

by
Heriberto Rivera-Cerezo
1,
Citlalli Gaona-Tiburcio
1,*,
Jose Cabral-Miramontes
1,
Raúl Germán Bautista-Margulis
2,
Demetrio Nieves-Mendoza
3,
Erick Maldonado-Bandala
3,
Francisco Estupiñán-López
1 and
Facundo Almeraya-Calderón
1,*
1
Universidad Autónoma de Nuevo León, FIME, Centro de Investigación e Innovación en Ingeniería Aeronáutica (CIIIA), San Nicolás de los Garza 66455, Mexico
2
División Académica de Ciencias Biológicas, Universidad Juárez Autónoma de Tabasco, Villahermosa 86040, Mexico
3
Facultad de Ingeniería Civil, Universidad Veracruzana, Xalapa 91000, Mexico
*
Authors to whom correspondence should be addressed.
Metals 2023, 13(2), 429; https://doi.org/10.3390/met13020429
Submission received: 1 February 2023 / Revised: 17 February 2023 / Accepted: 17 February 2023 / Published: 19 February 2023
(This article belongs to the Section Corrosion and Protection)

Abstract

:
Since their development, third-generation aluminum–lithium alloys have been used in aeronautical and other applications due to their good properties, replacing conventional Al-Cu and Al-Zn alloys and resulting in an increase in payload and fuel efficiency. The aim of this work was to investigate the influence of different heat treatments on the electrochemical corrosion behavior of the alloys AA2055 and AA2024 in the presence of three different electrolytes at room temperature, using an electrochemical noise (EN) technique in accordance with the ASTM-G199 standard. In the time domain, the polynomial method was employed to obtain the noise resistance (Rn), the localization index (IL), skewness, and kurtosis, and in the frequency domain, employing power spectral density analysis (PSD). The microstructure and mechanical properties of the alloys were characterized using scanning electron microscopy (SEM) and the Vickers microhardness test (HV). The results demonstrated better mechanical properties of the AA2055 alloy, which had a Vickers hardness of 77, 174, and 199 in the heat treatments T0, T6, and T8, respectively. An electrochemical noise resistance (Rn) of 2.72 × 10⁵ Ω·cm2 was obtained in the AA2055 T8 alloy evaluated in a NaCl solution, while the lowest Rn resistance of 2.87 × 101 Ω·cm2 occurred in the AA2024 T8 alloy, which was evaluated in a HCl solution. The highest electrochemical noise resistance (Rn) was obtained in the AA2055 alloys, which had received the T6 and T8 heat treatments in the three solutions.

1. Introduction

Much progress has been made within the aeronautical industry in the development of new structural materials and engines with specific properties that allow for the proper functioning of aircraft under operating conditions. The main objectives pursued in the development of new aeronautical materials are an increase in their mechanical properties, a reduction of weight, and the prolongation of the useful life of the components [1,2,3,4,5,6]. This translates into lower operating costs in aircraft, such as a longer service life, better fuel efficiency, higher payload, and flight range. Due to operating conditions, aircraft are subjected to various atmospheric environments, which are sometimes very aggressive and cause the chemical degradation of fuselages and metallic structures and their various components [3,4,5,6,7]. Marine atmospheres are characterized by the presence of fine seawater particles (chlorides) that are deposited on exposed metal surfaces.
Industrial atmospheres present pollutants, such as sulfur compounds (SO2), from the combustion of coal, oil, and other fuels. Sulfur dioxide is oxidized by some catalytic processes that transform it into sulfuric acid, which is deposited in microscopic droplets on exposed surfaces. There are also chemical plants that emit pollutants in the form of chlorides; these are usually much more corrosive than acid sulfates. One such example is hydrochloric acid, which has a high reactivity with most metals [8].
Corrosion control within the aeronautical industry is an issue that is very important considering the aging of aircraft fleets, the unavailability of aircraft, or, in the worst case, catastrophic failures. Aluminum alloys have long been widely used in the aeronautical industry [7]. Composite materials have been gaining ground. Fiber-reinforced polymer matrix composites are the most widely used composites due to the great interest that polymers arouse in many applications owing to their low density, high corrosion resistance, and high versatility of mechanical properties [9].
Although composite materials have been gaining ground in this industry, aluminum alloys are still important for the construction of aircraft airframes, structures, and components. This is mainly due to the low density of aluminum, its ease of alloying with other metallic materials, and its corrosion resistance, among other properties [9].
The 2xxx-series aluminum alloys, which use Cu as the main alloying element, are some of the main alloys used in the manufacture of aviation components. Cu has a maximum solubility of 5.65% in the matrix. This solubility decreases with temperature, allowing these alloys to be heat-treated and achieve hardening by the precipitation of phases such as θ (Al2Cu). Mg is often used in combination with Cu to form a S (Al2CuMg) phase [10,11].
Of the 2xxx-series alloys, the AA2024 alloy is one of the most widely used in aeronautics. The high mechanical resistance of this alloy is due to its thermal treatment in a solution, followed by tempering at room temperature and artificial aging [12].
The precipitation mechanism consists of a sequence of precipitates before the final equilibrium phase occurs. Coherent precipitates, known as Guinier–Preston–Bagaryatsky (GPB) zones, are initially formed from the supersaturated solid solution (SSS) matrix. As aging continues, the S″ phase is entered, which is like the stable phase, S. Finally, S′ dissolves and the stable phase S precipitates. The 2xxx series alloys are susceptible to localized corrosion due to the formation of galvanic cells between the intermetallic particles and the matrix [12,13,14,15].
On the other hand, third-generation Al-Li alloys have been the subject of research and have been increasingly used in the aerospace industry. As Li is the lightest metallic element (0.53 g/cm3), its addition to the Al-Cu-Li alloy decreases its density and improves the modulus elasticity. It has been observed that for every 1% of lithium added, a 3% decrease in density and a 6% increase in rigidity of the resulting alloy are achieved [1,2,3,4].
Third-generation Al-Li alloys combine improved mechanical properties, stiffness, corrosion resistance, fracture toughness, and density. This makes them comparable to traditional aluminum alloys such as the 2xxx- and 7xxx-series alloys. Third-generation Al-Li alloys contain a maximum of 1.8% of lithium [16,17,18].
AA2055 is an unconventional 2xxx series alloy containing Li, Zn, Mg, and Ag. It is considered one of the most promising candidates for applications in the aeronautics and aerospace industries. It also has applications in aerospace structures. It contains the element Ag, which helps in the nucleation of hardening precipitates such as the Ω phase (Al2Cu) and the T1 phase (Al2CuLi) [19,20].
To optimize the precipitation process of the alloy, the controlled addition of elements such as Mg, Zr, Ag, and Zn, and the control of the heat treatment are important. In the precipitation process of Al-Li alloys, it is recognized that the T1(Al2CuLi) phase is the predominant phase. It is considered the main hardening precipitate, and it is produced during artificial aging at temperatures between 120 °C and 200 °C [21,22].
Localized corrosion can occur due to a precipitated reactive phase within the matrix and in the grain boundary regions. The treatments applied to the Al-Li alloys create different electrochemical potentials concerning the matrix. The coupling of these two leads to a phenomenon known as galvanic coupling, generating a great susceptibility to intergranular corrosion. Other factors that influence the susceptibility to corrosion in these alloys are the conditions or means of exposure: some aircraft structures are exposed cyclically to corrosive environments and high temperatures, whether in static or flight conditions [23,24,25,26,27].
It is interesting to evaluate the corrosion performance of a traditionally used alloy and compare it with the new Al-Li AA2055 alloy to assess the advantages of each one. Such a study has not been reported in the literature. The evaluation of such corrosion studies based on heat treatment will allow for a better understanding of the precipitation processes that occur in these alloys and their influence on electrochemical behavior. The electrochemical noise technique used in this work has an advantage in that an external disturbance is not applied to polarize the sample; rather, the processes that occur in the system under study and are recorded during the tests are carried out in a controlled manner during the corrosion process. This work aims to evaluate the electrochemical corrosion of the AA2024 (aluminum–copper) and AA2055 (aluminum–lithium) alloys subjected to different heat treatments.

2. Materials and Methods

The materials used in this study, the AA2024 and AA2055 alloys, were obtained in the form of an extruded, round bar with a diameter of 5 cm and a length of 20 cm. The AA2055 represents the third generation of aluminum–lithium alloys. The nominal chemical compositions of both alloys are shown in Table 1 [28,29,30].

2.1. Heat Treatments

The aluminum alloys were received in the following condition: an AA2024 alloy with T351 treatment consisting of a solution treated + cold worked + natural age. An AA2055 alloy in T84 condition: this treatment consists of a solution treated + cold worked + artificial aged and ½ hard.
The samples were cut into slices 5 cm in diameter by 5 mm thick. Six samples of each alloy were cut to carry out the heat treatments and the metallographic analysis, providing a total of 18 samples. The six samples of each alloy were polished with abrasive paper up to grade 600 and then washed with an ultrasonic cleaner and acetone for five minutes before being put through various heat treatments. A first group of six samples was kept in the state of heat treatment in which they had been purchased so that samples of AA2024-T351 and AA2055-T8 were obtained. Alloy sample AA2024-T351 was aged at 190 °C for 12 h, so this sample is referred to as AA2024-T8. A second group of six samples of both alloys was subjected to an annealed heat treatment until they reached a T0 condition. A third group of six samples underwent solution treatment. They were later quenched in cold water and subjected to artificial aging until they reached a T6 condition. Figure 1 summarizes the different stages of heat treatments carried out on both alloys. The described heat treatments were carried out using a Thermolyne furnace (Thermo-scientific, Dubuque, IA, USA) [31,32].

2.2. Metallographic Preparation of Samples

The thermally treated samples were prepared metallographically. They were polished successively with silicon carbide grit papers of 600, 800, 1200, and 4000 grades. Subsequently, diamond pastes of 3 microns and 1 micron were used successively to give the samples a mirror-polish finish [32]. Keller etching reagent (95 mL H2O, 1.0 mL HF, 2.5 mL HNO3, and 1.5 mL HCl) was used to reveal the microstructure of the alloys [33].

2.3. Optical Microscopy (OM) and Scanning Electron Microscopy (SEM) Characterization

A microstructural analysis of the heat-treated alloys was performed using optical microscopy (OM) (Zeiss Discovery V12 model, Carl Zeiss Microscopy GmbH, Jena, Germany) to identify the microstructure of the samples at a magnification of 500X, using field emission scanning electron microscopy equipment (FESEM Zeiss equipment, model Gemini Sigma 300 VP, Jena, Germany) operating at 20 KV and a work distance of 12 mm. The chemical compositions of the AA2024 and AA2055 alloys were obtained using energy-dispersive X-ray spectroscopy (EDS, JEOL-JSM-5610LV, JEOL Tokyo, Japan). The SEM micrographs by SEM were captured using a backscattered electron (BSE) detector. The grain size was determined by the ASTM E112 [34] standard, using the comparison method and taking images with a magnification of 200X.

2.4. Vickers Microhardness Measurements

Vickers microhardness tests, based on the ASTM E384 standard [35], were performed on the heat-treated samples in a microhardness tester (Wilson Tester 402 MVD, Wilson Lake Bluff, IL, USA). The tests used a load of 100 g, a loading duration of 15 s in all cases, and 15 readings per sample. The final microhardness value for each sample was obtained by averaging a total of 10 measurements.

2.5. Electrochemical Techniques

According to the ASTM G199-09 standard [36], electrochemical noise (EN) measurements were carried out on samples with different heat treatments: T0, T6, and T8. Measurements were recorded simultaneously using an Gill-AC potentiostat/galvanostat/ZRA (Zero Resistance Ammeter), (ACM Instruments Company, Manchester, UK). All the corrosion tests were performed in triplicate. For each experiment, two nominally identical specimens were used as the working electrodes (WE1 and WE2), and a saturated calomel electrode was used as the reference electrode (RE). The working electrodes were prepared to be subjected to electrochemical noise tests by polishing them with an abrasive paper with a grade of up to 600. They were subsequently ultrasonically washed with acetone for 5 min. In total, 9 specimens of each alloy were machined for electrochemical testing. The electrochemical current noise (ECN) was measured with a galvanic coupling current between two identical working electrodes; simultaneously, the electrochemical potential noise (EPN) was measured by linking one of the working electrodes and a reference electrode. The current and potential electrochemical noise were monitored concerning the time for each electrode–electrolyte combination. For each set of EN measurements, 2048 data points were obtained with a scanning rate of 1 data/s. The corrosion measurements were performed by immersing the aluminum alloy samples, with an exposed surface area of 1.0 cm2, in 3.5 wt. % NaCl, 1 wt. % H2SO4, and 1 wt. % HCl solutions. Aluminum alloys in aircraft are exposed to different atmospheres, such as marine and industrial (acid rain). Exposure to sulfuric acid can simulate an acid rain environment, which is formed from the chemical reactions of the sulfur dioxide and nitrogen oxides found in the atmosphere with water and chemical contaminants, resulting in nitric and sulfuric acids.
EN data were processed with a program made in MATLAB 2018a software (Math Works, Natick, MA, USA). The DC trend signal was removed from the original EN signal using the polynomial method, and statistical data (Rn, kurtosis, and skewness) were obtained from the signal without DC kurtosis. Regarding the power spectral density (PSD) data, a Hann window was applied before being transformed to the fast Fourier transform (FFT) frequency domain. [6,37,38].

3. Results and Discussion

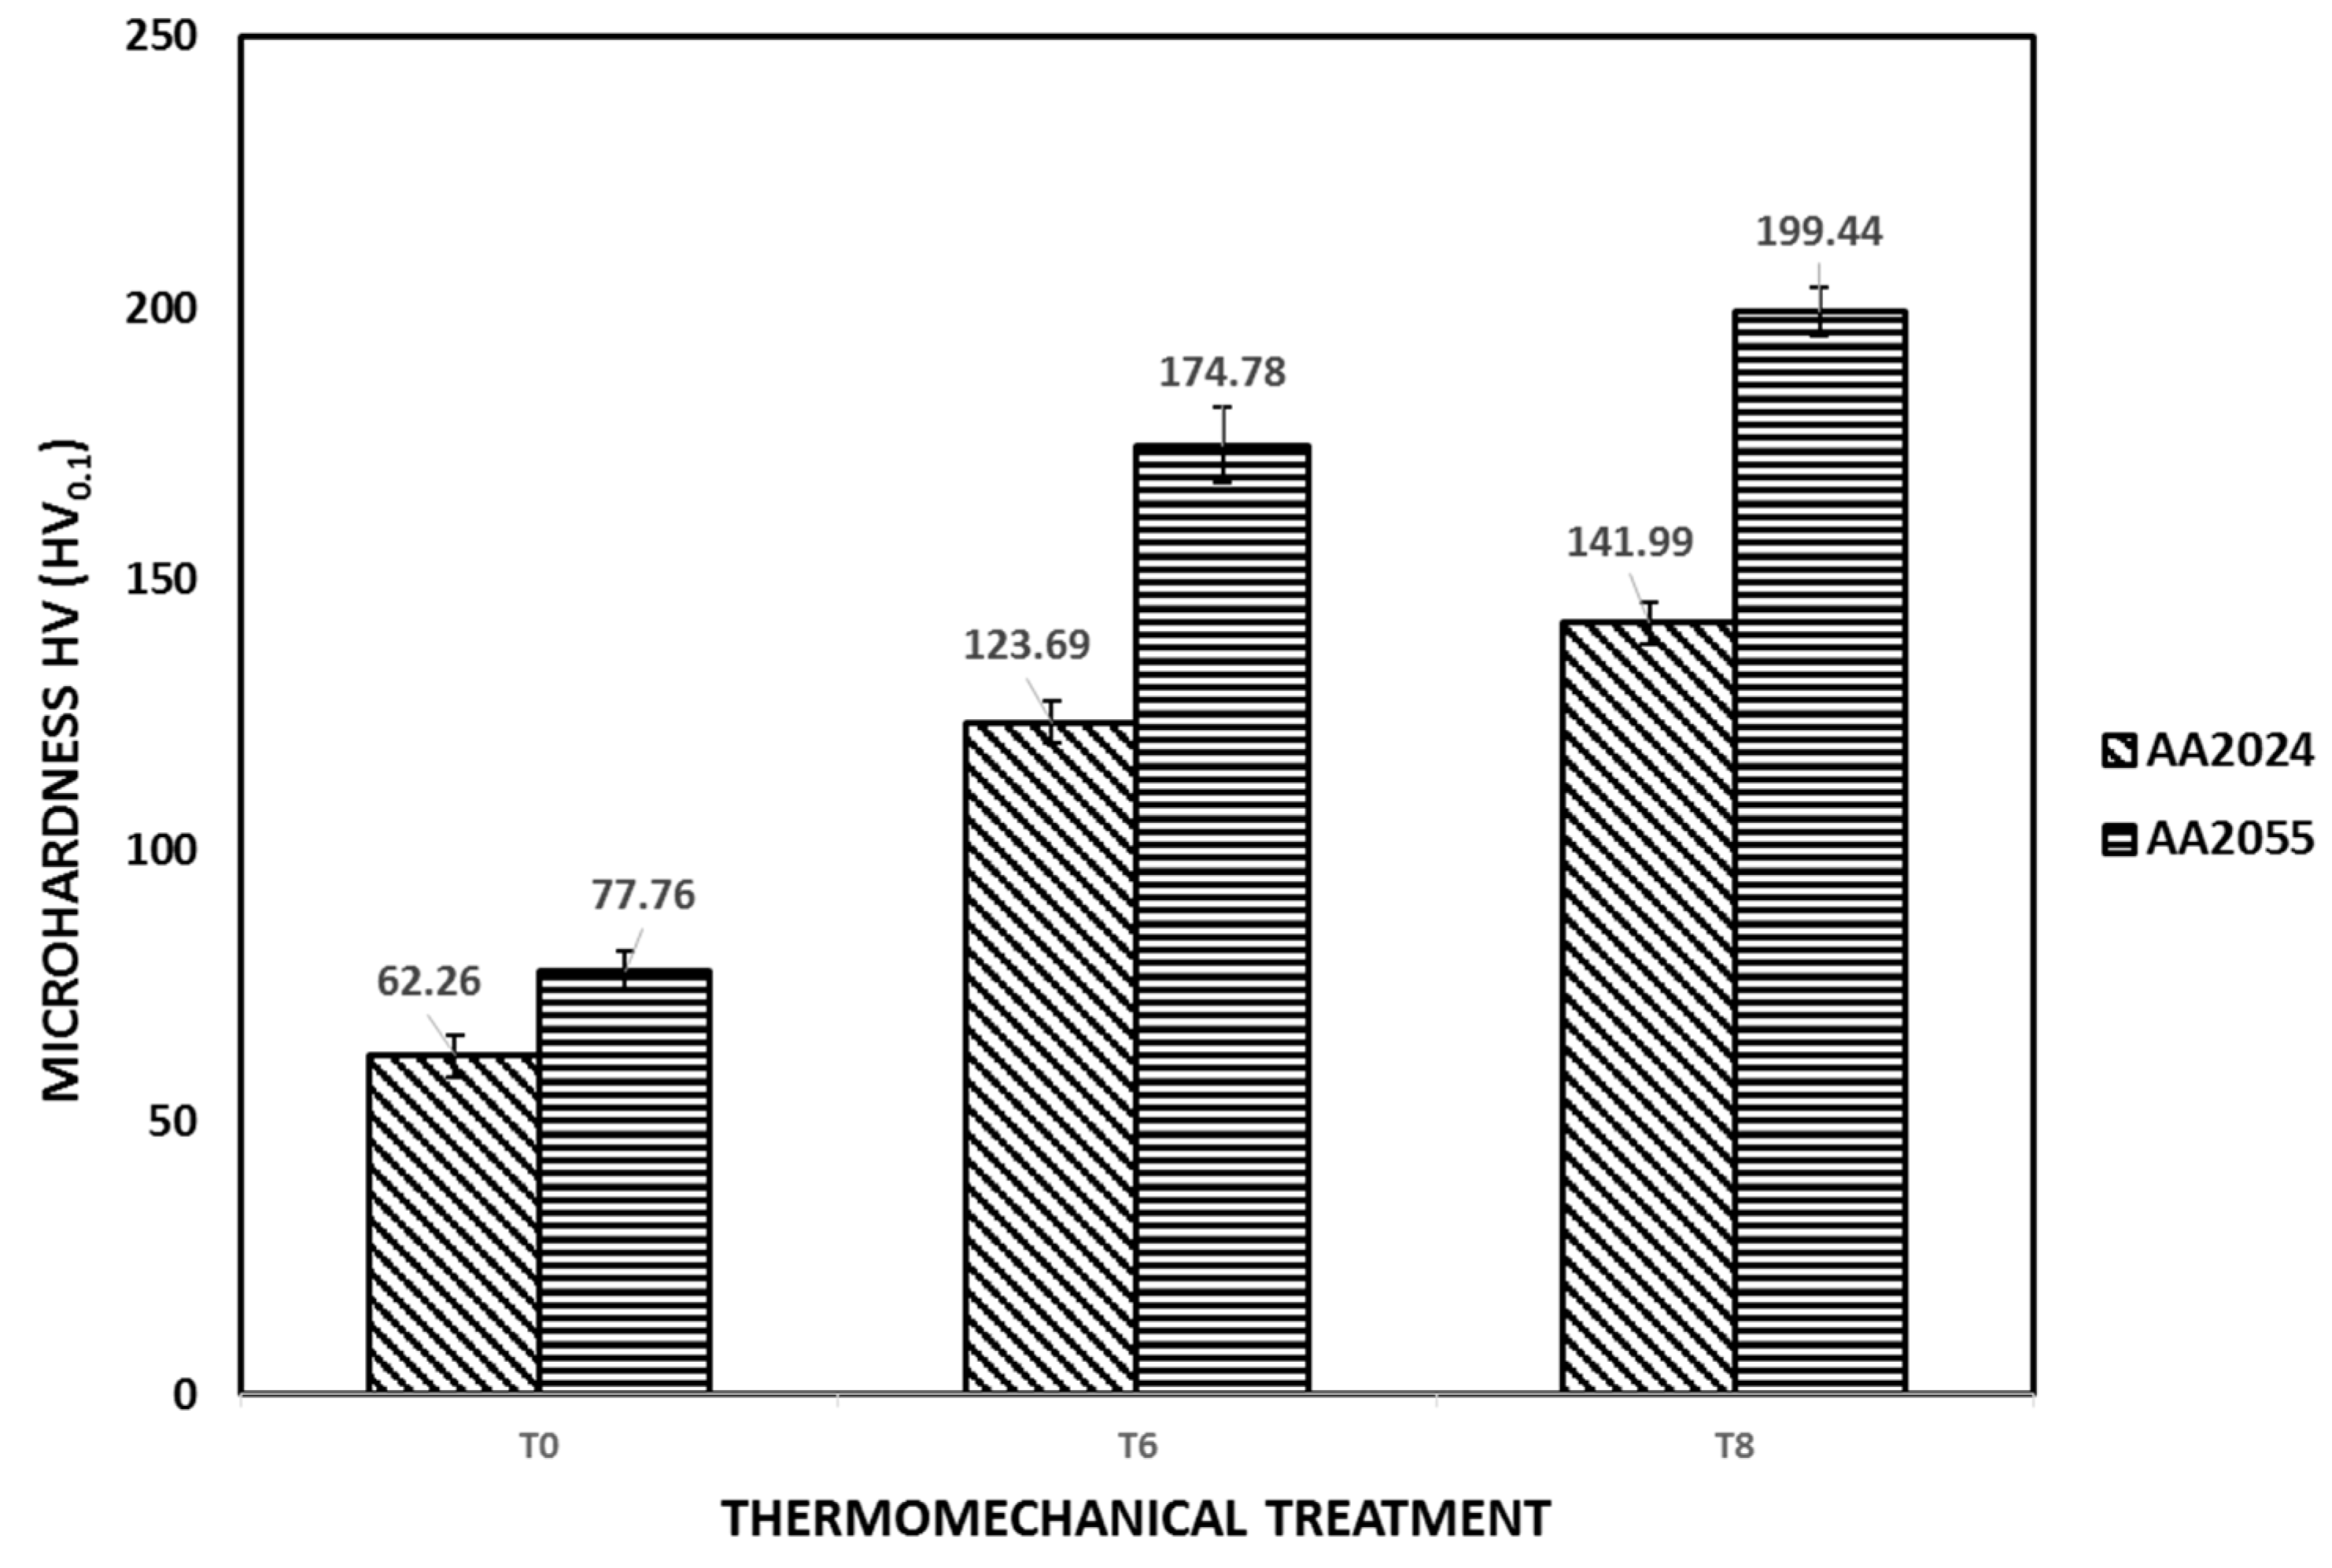
3.1. Vickers Microhardness Measurements

The results of the microhardness tests are shown in Figure 2. The alloys from the T0 heat treatment condition presented the lowest microhardness measurements (HV 62.3–77.8) for both alloys. The alloys from the T6 heat treatment condition presented higher microhardness values (HV 123–174.8) compared to the T0 alloys. These were followed by the alloys from the T8 condition, which presented the highest microhardness measurements (HV 142.0–199.4).
This behavior is attributed to the fact that during the annealing process (T0 treatment), the effects of cold working are eliminated; that is, the thermal energy applied allows for the movement of dislocations, thus eliminating residual stresses. After recrystallization, the microstructure of the new grains has a very low dislocation density. On the other hand, the hardening precipitates; which are developed during the solution process, followed by quenching and artificial aging (T6 treatment); block the movement of dislocations, thus increasing the hardness of the alloys among other mechanical properties. Similarly, cold working (T8 treatment) prior to artificial aging further increases the hardness of the alloys. Cold working is applied in this condition to develop dislocations inside the grains. Dislocations are preferential for precipitating nucleation sites; therefore, in this heat treatment condition, hardening precipitates are not only generated at the grain boundaries but also inside the grains [39,40].
The AA2055 alloy presented the highest microhardness values compared to AA2024 regardless of the heat treatment performed. This is attributed to the fact that the Ag element provides hardening solid solutions and increases the precipitation kinetics of the T1 phase (Al2CuLi). It also helps to achieve a better distribution of said phase [41,42,43,44,45]. Zhou et al. [46] and Bai et al. [47] promoted the formation of Ω phases (Al2Cu) in Al-Cu-Mg alloys. Furthermore, it was widely reported that Ag and Mg decrease the fault-stacking energy of the alloy, which causes the dislocation mobility to be reduced [48,49,50,51]

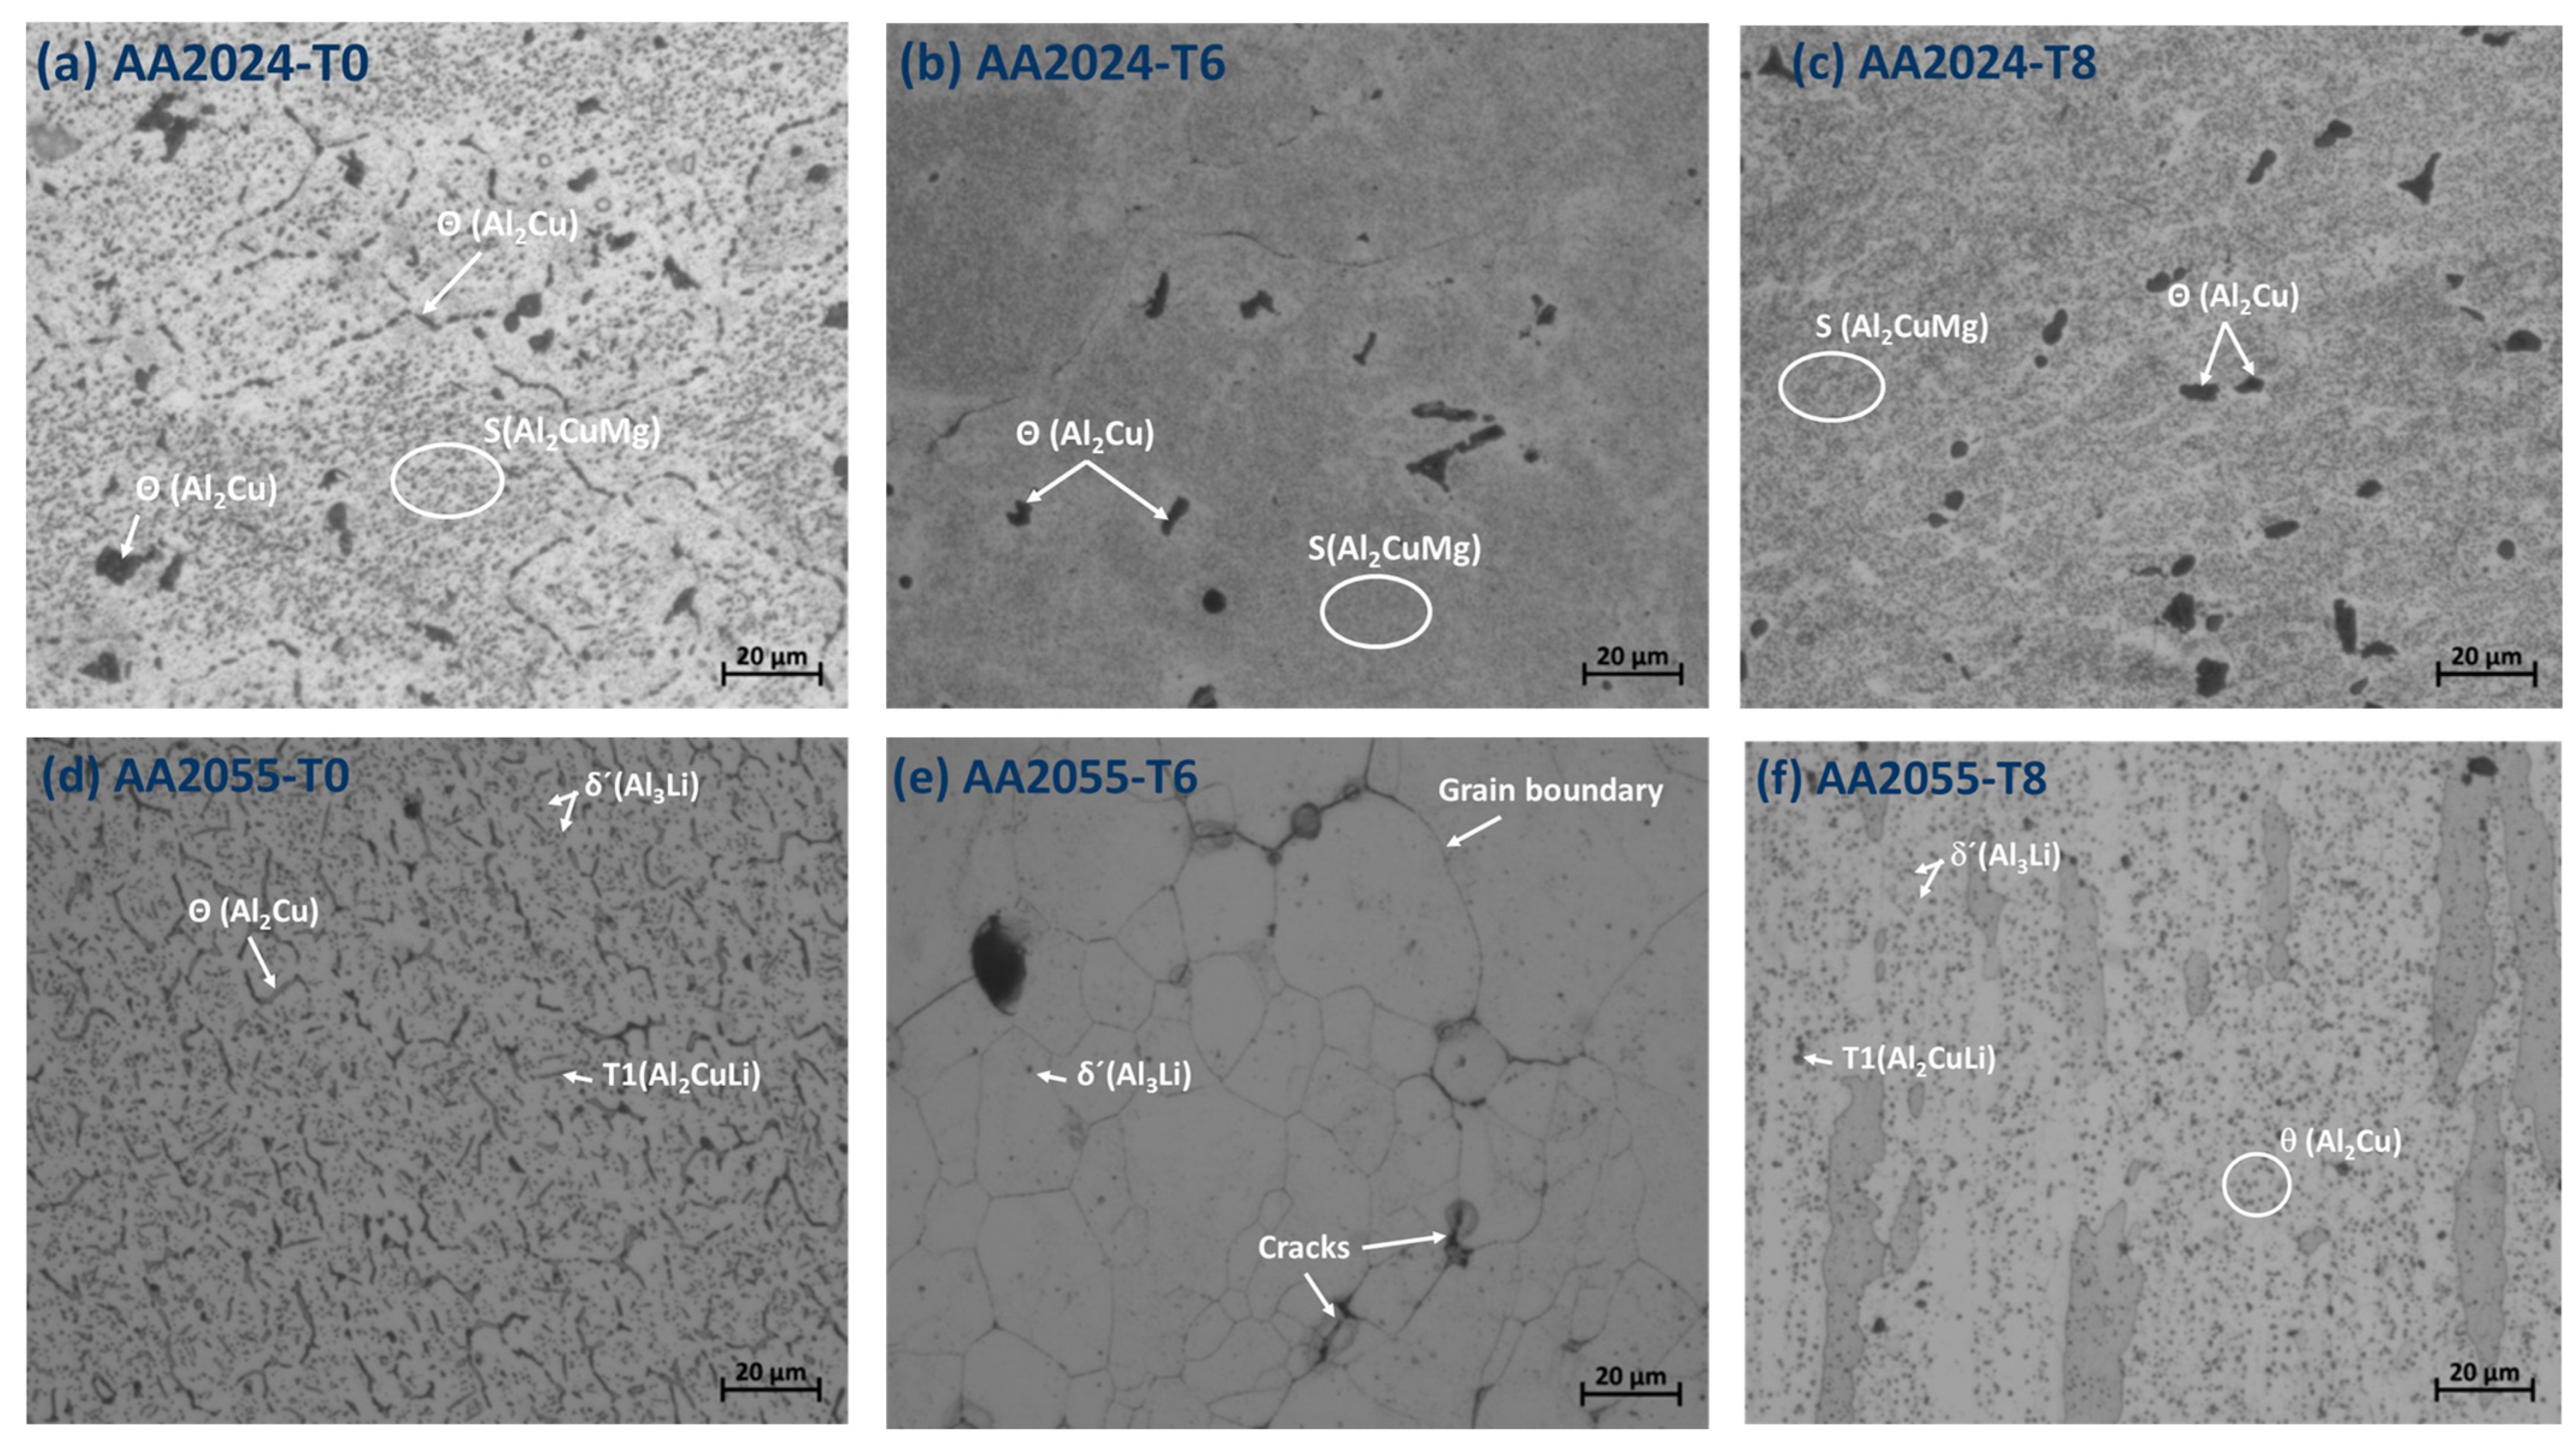
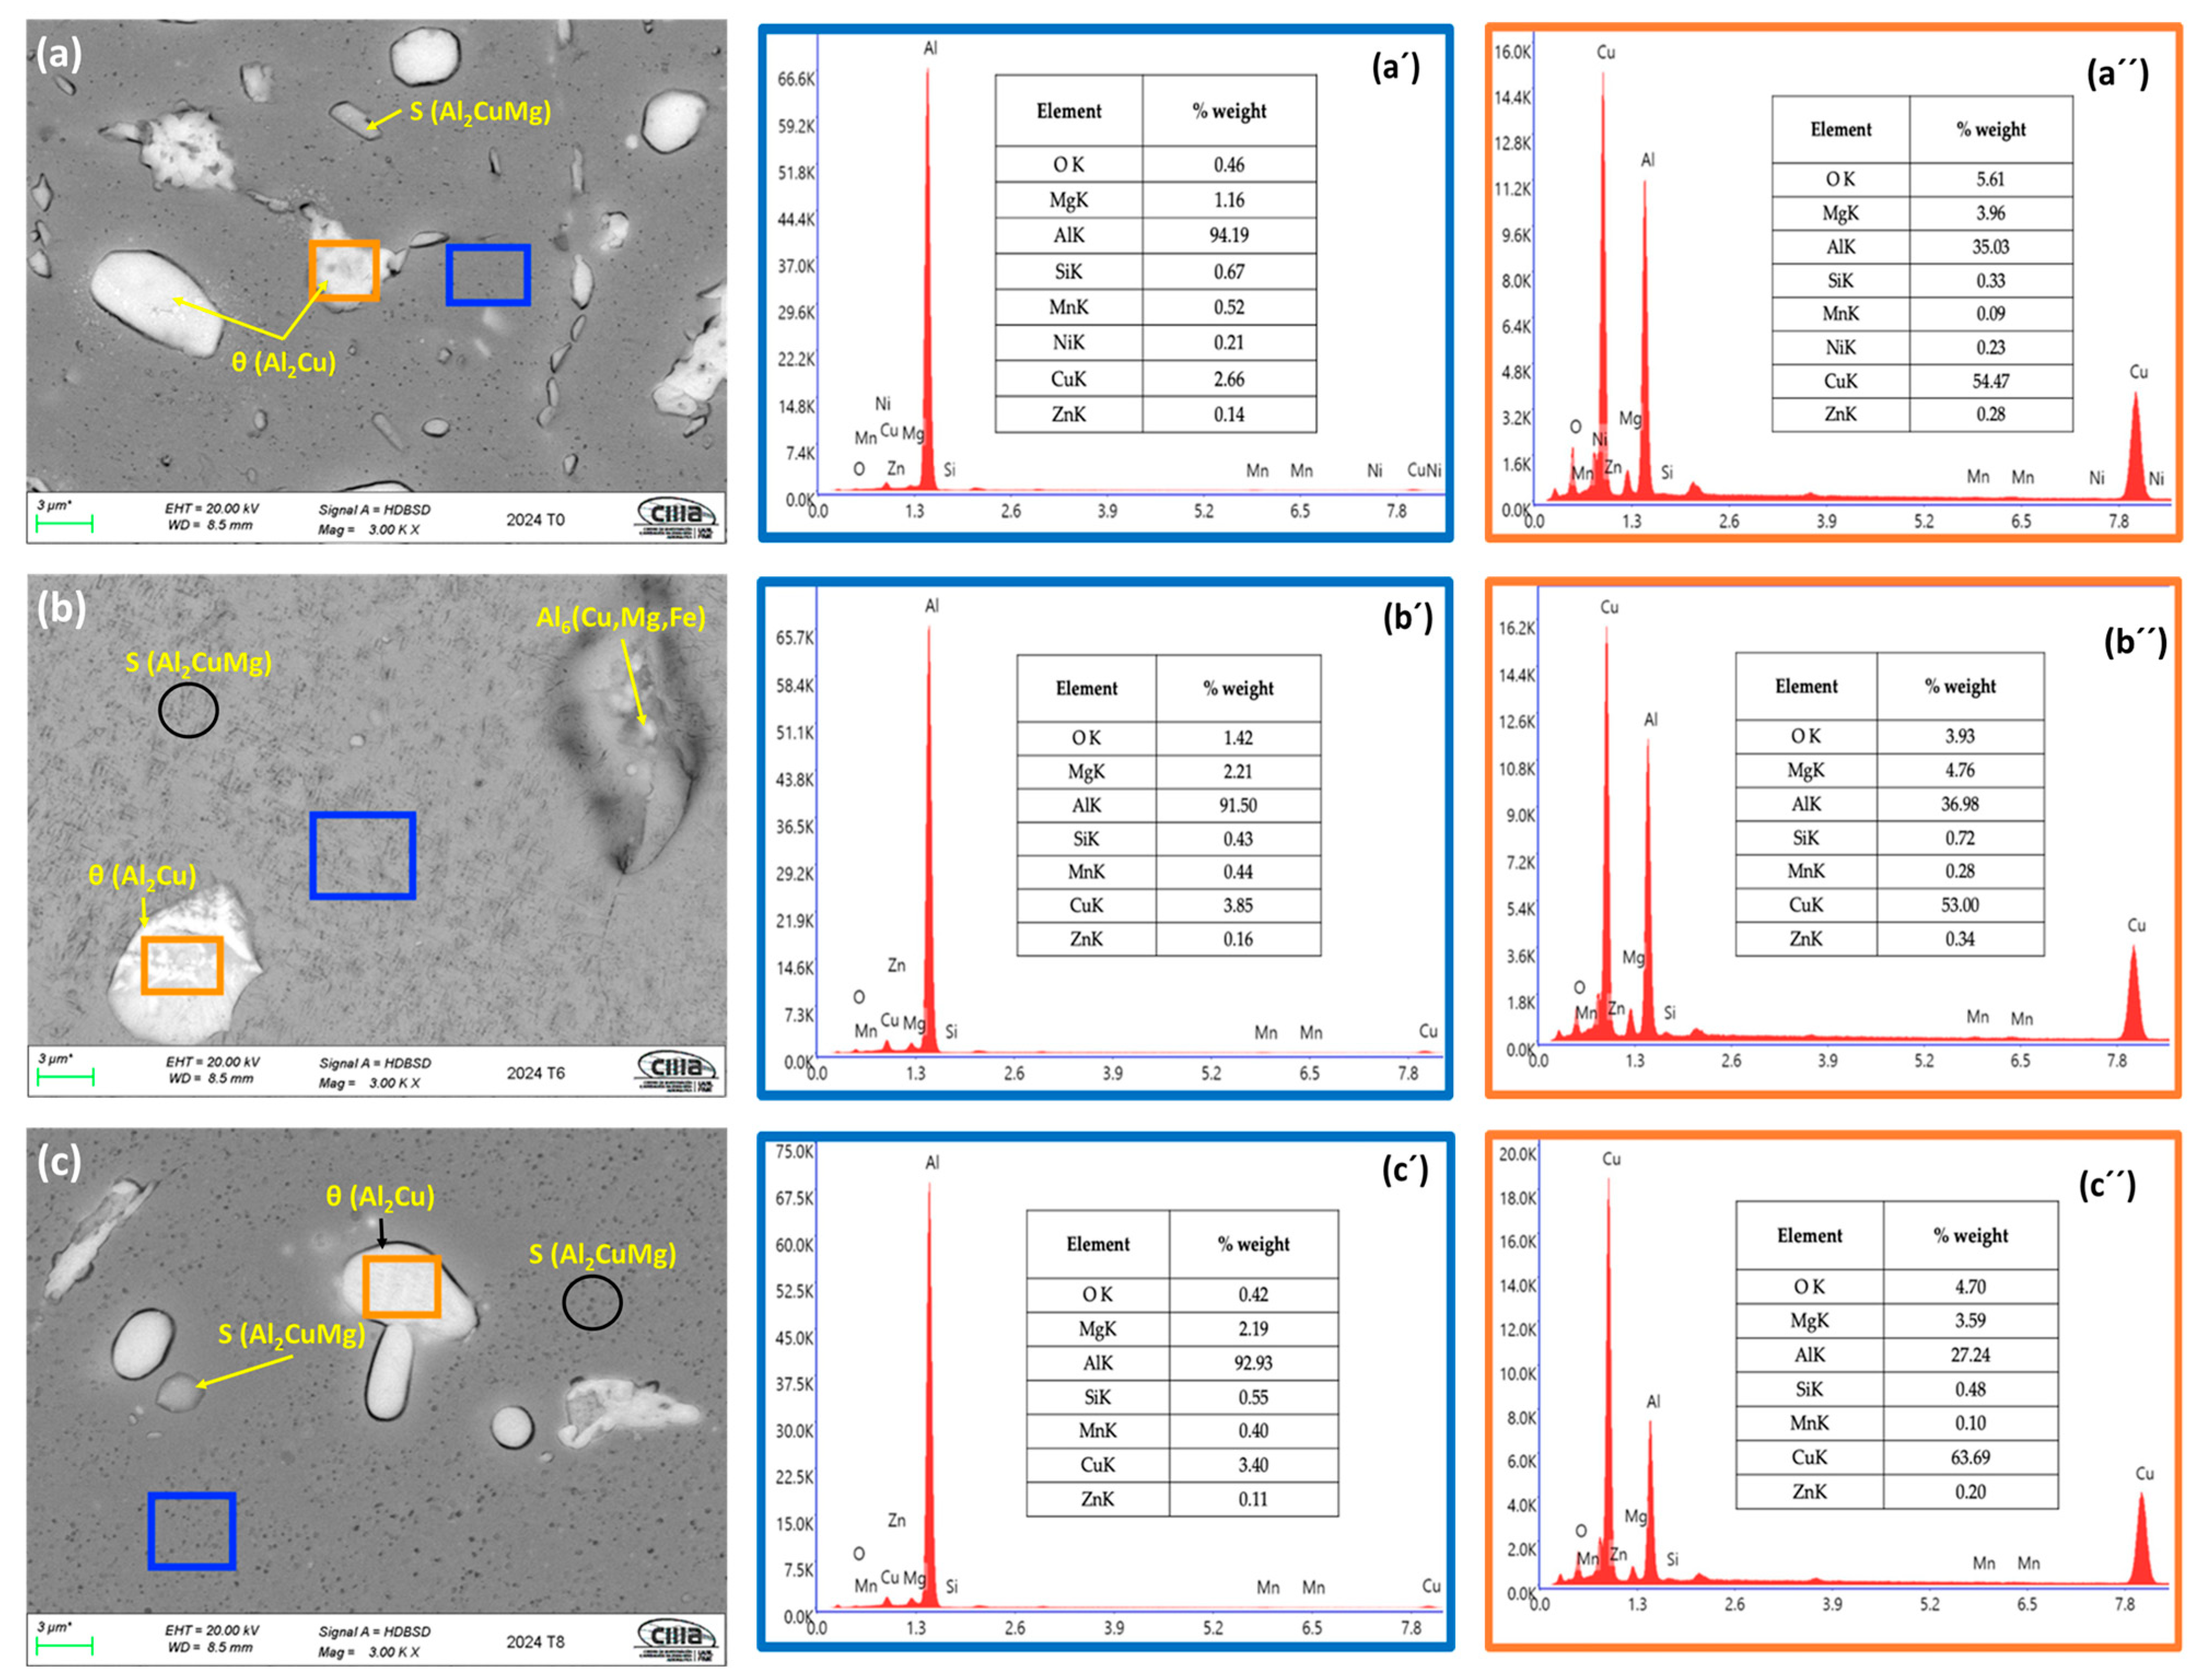
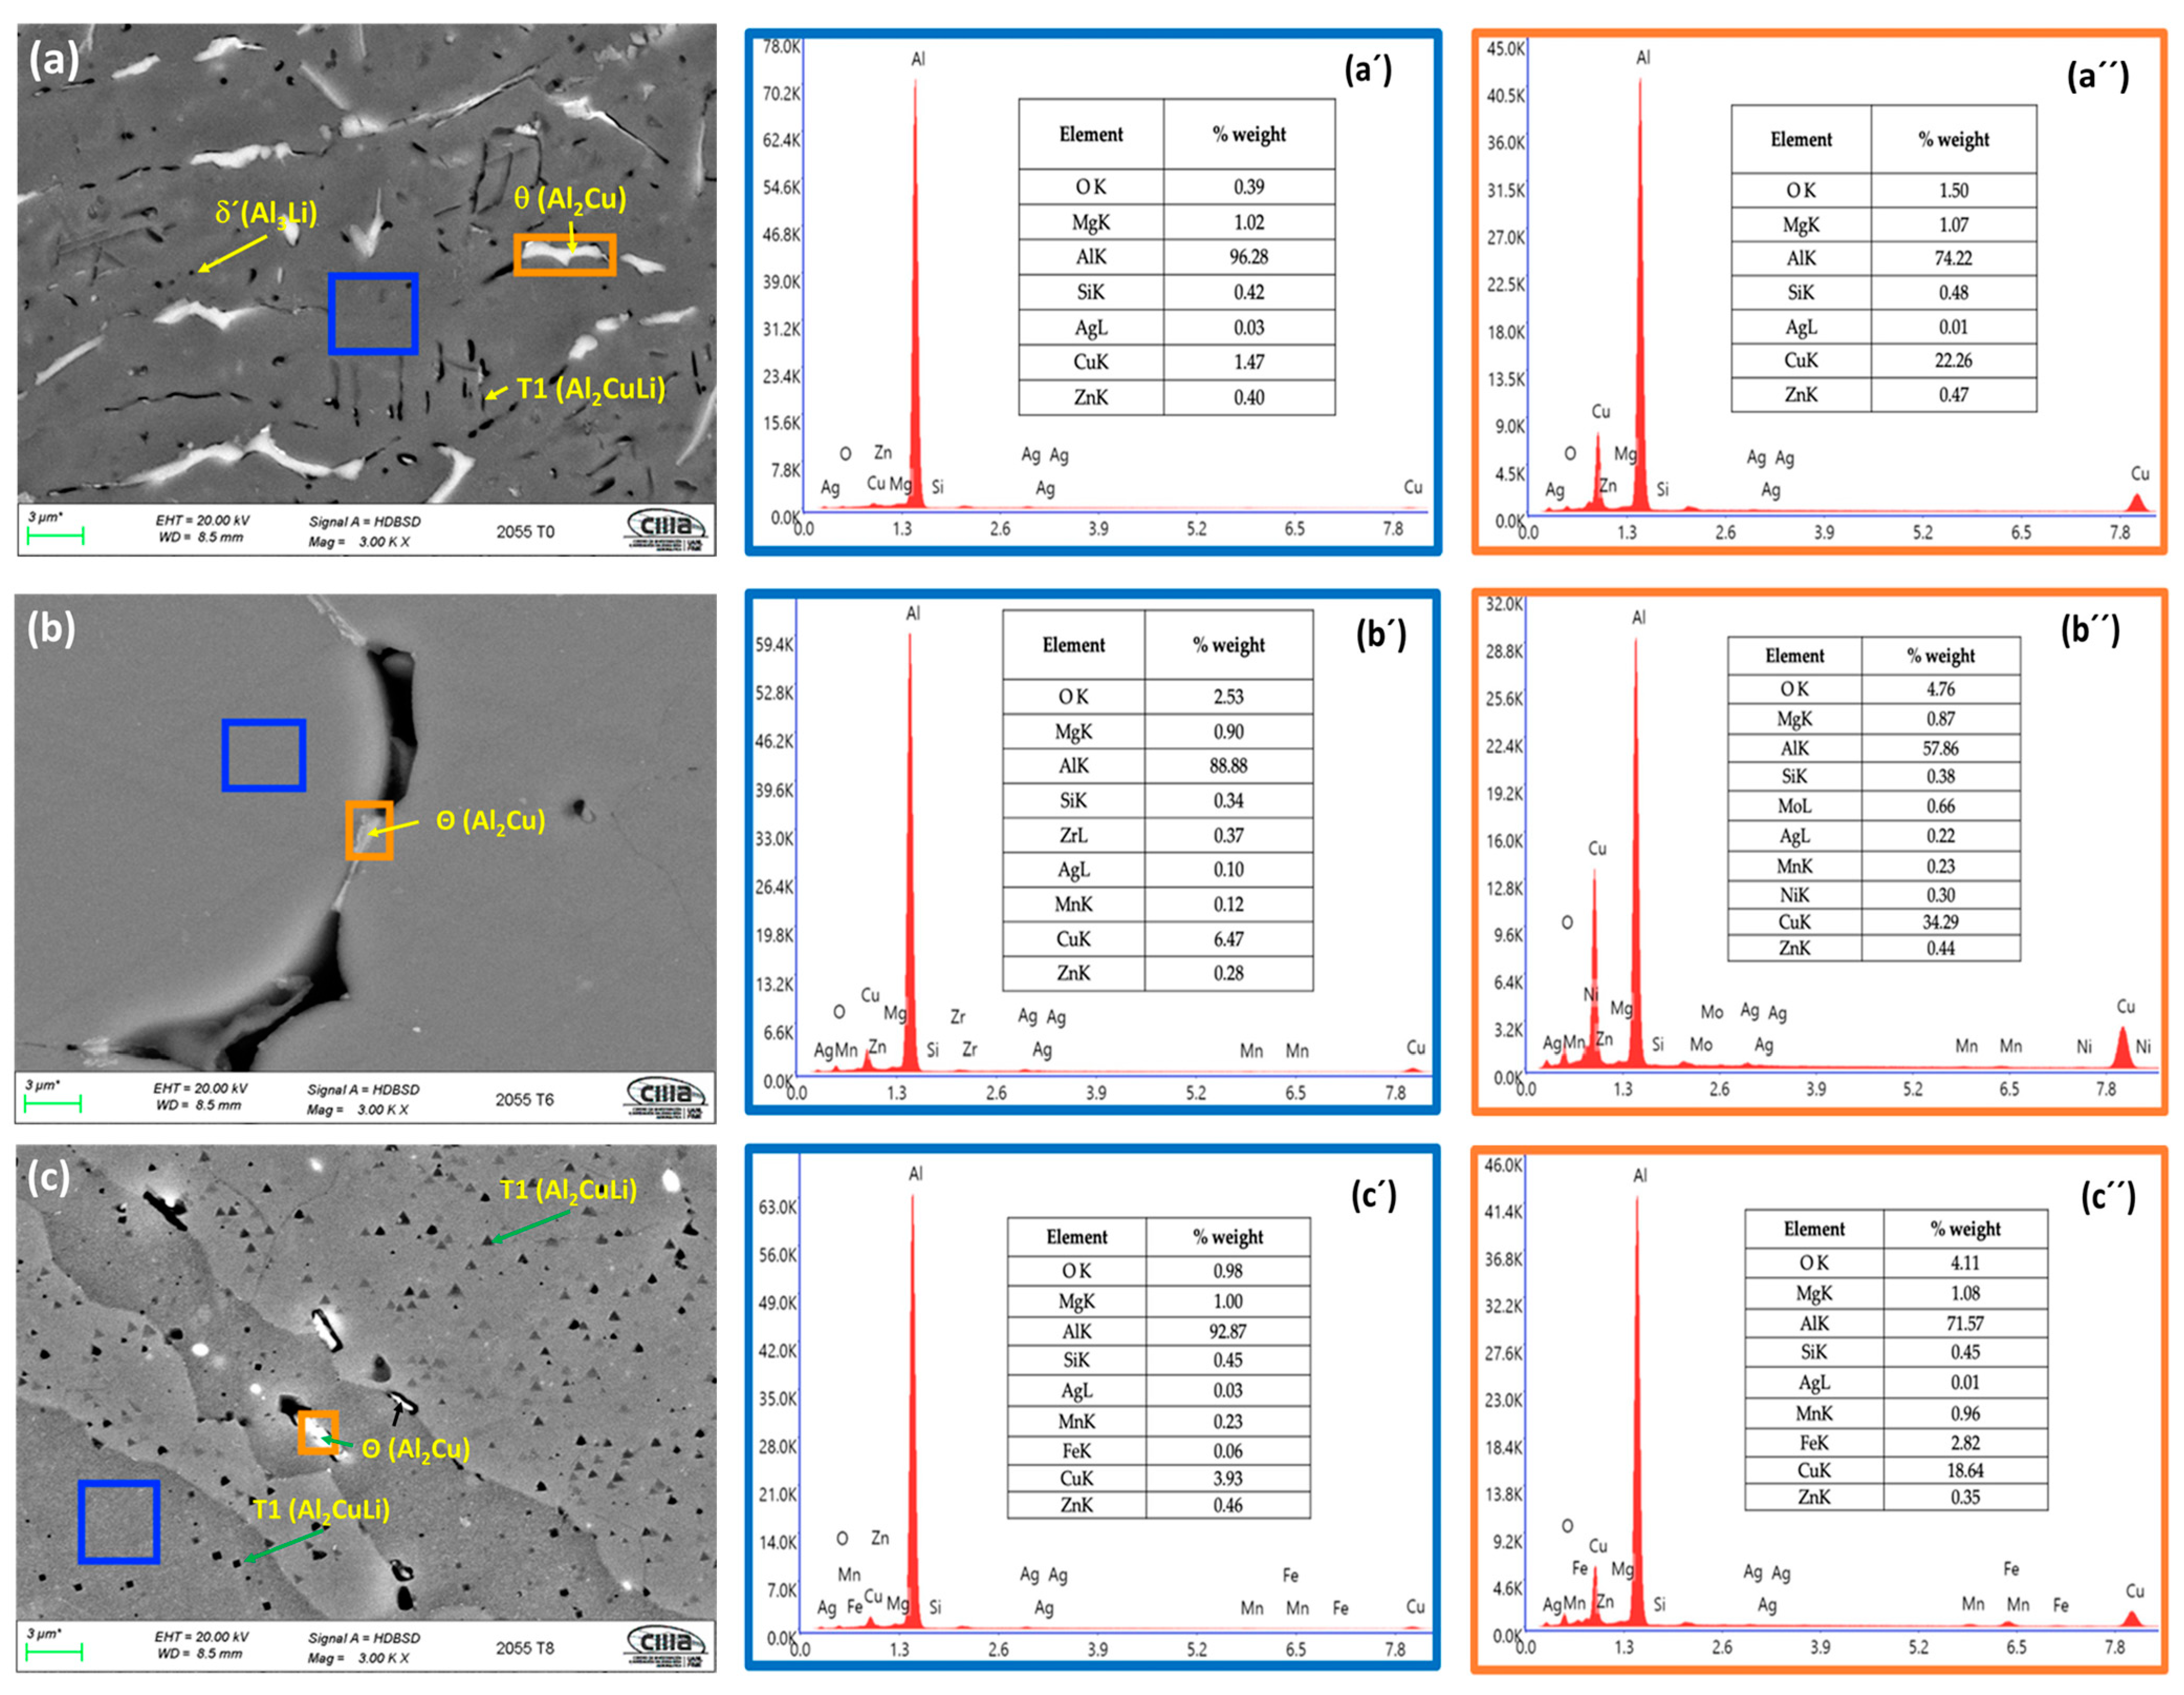
3.2. OM and SEM Microstructural Analysis

Figure 3a–f show the microstructures, obtained by optical microscopy, of the AA2024 and AA2055 alloys under the three heat treatments.
For the AA2024 and AA2055 alloys from the T0 condition, an equiaxed grain morphology was present: this is the product of recrystallization. Randomly distributed, intermetallic particles, which appear dark on the alloy surface, were also observed, as was a heterogeneous precipitation at the grain boundaries, which was driven by grain boundary surface energy. Adjacent zones presented, which are known as free of precipitation and were devoid of the alloying element. The precipitation-free zones constitute a preferential path for dislocation movement, resulting in a general weakening of the alloy [52,53].
Under condition T6, the heterogeneous precipitation disappeared at the grain boundaries. The homogeneous precipitation distributed over the metal surface was maintained, although in less quantity. These precipitates, which originated from the alloys’ artificial aging process after quenching, contribute to increasing the hardness in the alloy [54]. Except for the presence of deformed grains brought on by cold working, the structure of the alloy under condition T8 was identical to that of the alloy under condition T6.
The main phases that appeared in the AA2024 alloy were the θ (Al2Cu) phase and the S(Al2CuMg) phase. Using an elemental microanalysis with EDS, the composition of these particles was obtained to determine the phase to which they corresponded [55].
For the AA2055 alloys, it was observed that for the alloy in treatment condition T0, recrystallized grains were found due to the annealing heat treatment; in the same way, free zones of precipitation were observed. Also, hardening precipitates were observed whose platelet-shaped morphology is typical of the AA2055 alloy [56,57]. The main hardening phases were the T1(Al2CuLi) phase, the θ(Al2Cu) phase, and the δ′(Al3Li) phase [57]. There were no precipitates in the grain boundaries, and the amount of homogeneous precipitation, a consequence of artificial aging that is dispersed on the surface, appeared in a lesser quantity. Grain boundary cracks developed in this sample, probably due to thermal shock from rapid cooling. The commercial alloy AA2055-T8 presented a morphology of elongated grains due to cold working as well as hardening precipitates that were distributed over the entire surface of the sample.
Table 2 shows the grain size obtained from the OM images of the AA2024 and AA2055 alloys with the heat treatments T0, T6, and T8. For the AA2024 aluminum, an increase in grain size from 7.5 µm to 17 µm was observed when the T8 heat treatment was applied. In the AA2055 alloy, there was a decrease in grain size when the alloy was subjected to heat treatments T6 and T8. The decrease in grain size is associated with hardening mechanisms and an increase in mechanical properties such as hardness [58]. For alloys with a smaller grain size, the corrosion resistance improved. The capacity of high-grain boundary density surfaces to passivate more quickly or the physical breakdown of second-phase intermetallic particles are often attributed to improved corrosion resistance [59,60].
Figure 3. OM microstructure of the AA2024 (ac) and AA2055 (df) aluminum alloys under the three heat treatment conditions.
Metals 13 00429 g003
Figure 4a–c show the SEM micrographs and the microanalyses performed on the AA2024-T0, AA2024-T6, and AA2024-T8 alloys, respectively.
In this figure, it can be observed that the AA2024-T0 and AA2024-T8 alloys presented a higher number of precipitated particles compared to the AA2024-T6 alloy.
Figure 4a shows the SEM image of the AA2024-T0 alloy surface. These micrographs present the matrix in a dark tone, and the randomly distributed intermetallic particles appear in a light tone. There are light-colored precipitates at the grain boundaries which may be the result of the slow cooling rate. EDS microanalysis showed the surface of the matrix to be rich in Al: 94.19% by weight. The amounts of Cu and Mg were in the range of 1 to 3% by weight. The content of the rest of the elements was less than 1%. When analyzing the precipitated particles, some (orange box) were observed with a high Cu content (57.47% by weight), higher than the Al content (35.03% by weight), and with an Mg content of the order of 4 % in weight. These particles could correspond to the composition of the S(Al2CuMg) phase [9,61]. Other particles with high amounts of Al and Cu could correspond to the θ (Al2Cu) phase. Figure 4b shows the SEM micrographs of the AA2024-T6 alloy. A surface with a smaller number of precipitated particles was observed: they were distributed on the surface and are of a very varied morphology, from circular particles with diameters of up to 10µm to elongated particles and particles with lengths of more than 20µm. Additionally, the presence of the AlCuFeMg phase was observed, which is a metallic inclusion present in this type of alloy [61]. Defined grain boundaries were also observed.
Microanalyses revealed an Al-rich surface matrix with lower levels of Cu and Mg. Similar to the previous alloy, the S phase was found in the precipitates in an abundance of Cu and Mg (orange box). Figure 4c, which represents the AA2024-T8 alloy, shows a similar distribution of precipitates. The matrix composition was quite similar to the earlier samples, and the occurrence of precipitated S and θ phases was once again confirmed.
Figure 4. SEM-BSE micrographs of AA2024 alloy under (a) T0, (b) T6 and (c) T8 heat treatment conditions and EDS spectrum [T0 (a′, a″), T6 (b′, b″) and T8 (c′, c″)].
Metals 13 00429 g004
Figure 5a–c show the SEM images and the microanalyses performed on the AA2055-T0, AA2055-T6, and AA2055-T8 alloys respectively.
In the AA2055-T0 alloy, a microstructure composed of a dark tone matrix with a high Al content, greater than 95%, was observed. Elongated dark zones were observed, and apparently voids arose when the precipitates were removed by mechanical polishing. The precipitates with an elongated morphology, light in color, had a composition with a high content of Al and Cu, probably corresponding to the hardening phases T1(Al2CuLi) or θ′(Al2Cu), which are the typical hardening phases in these alloys [42,43,44]. In the AA2055-T6 alloy, a lower number of precipitates was observed at the grain boundaries. Under this heat treatment condition, the alloy produced many cracks, especially at the grain boundaries. This was possibly due to residual stresses generated by temperature gradients during the heat treatment, as previously mentioned. Figure 5c shows the surface of the commercial AA2055-T8 alloy in which there are elongated grains oriented in the cold working direction. Small black dots can be seen, which could be holes generated when precipitated particles are removed during mechanical polishing.
Figure 5. SEM-BSE micrographs of AA2055 alloy under (a) T0, (b) T6 and (c) T8 heat treatment conditions and EDS spectrum [T0 (a′, a″), T6 (b′, b″) and T8 (c′, c″)].
Metals 13 00429 g005

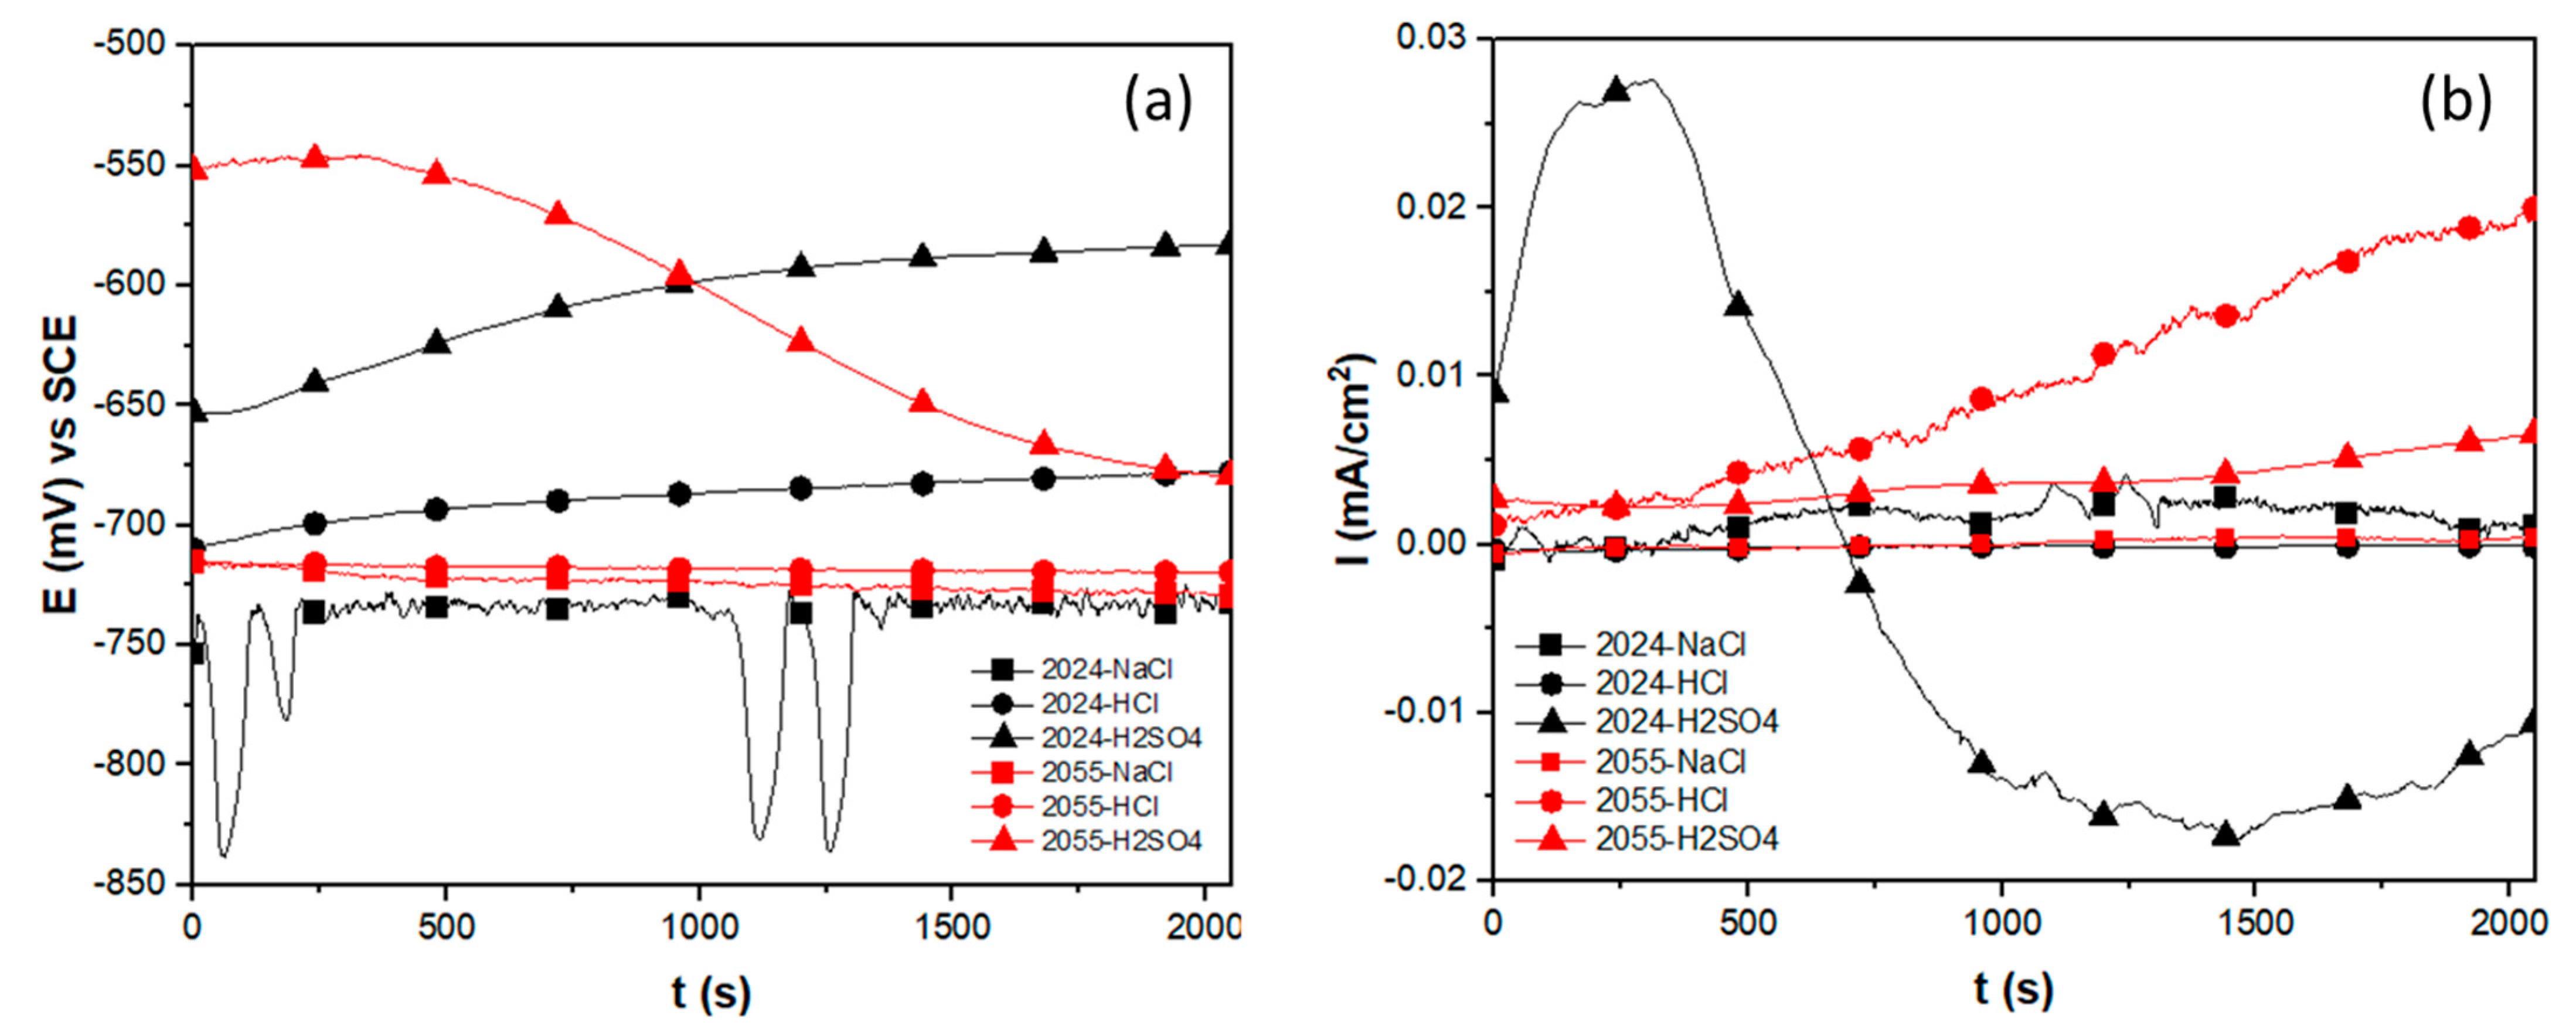
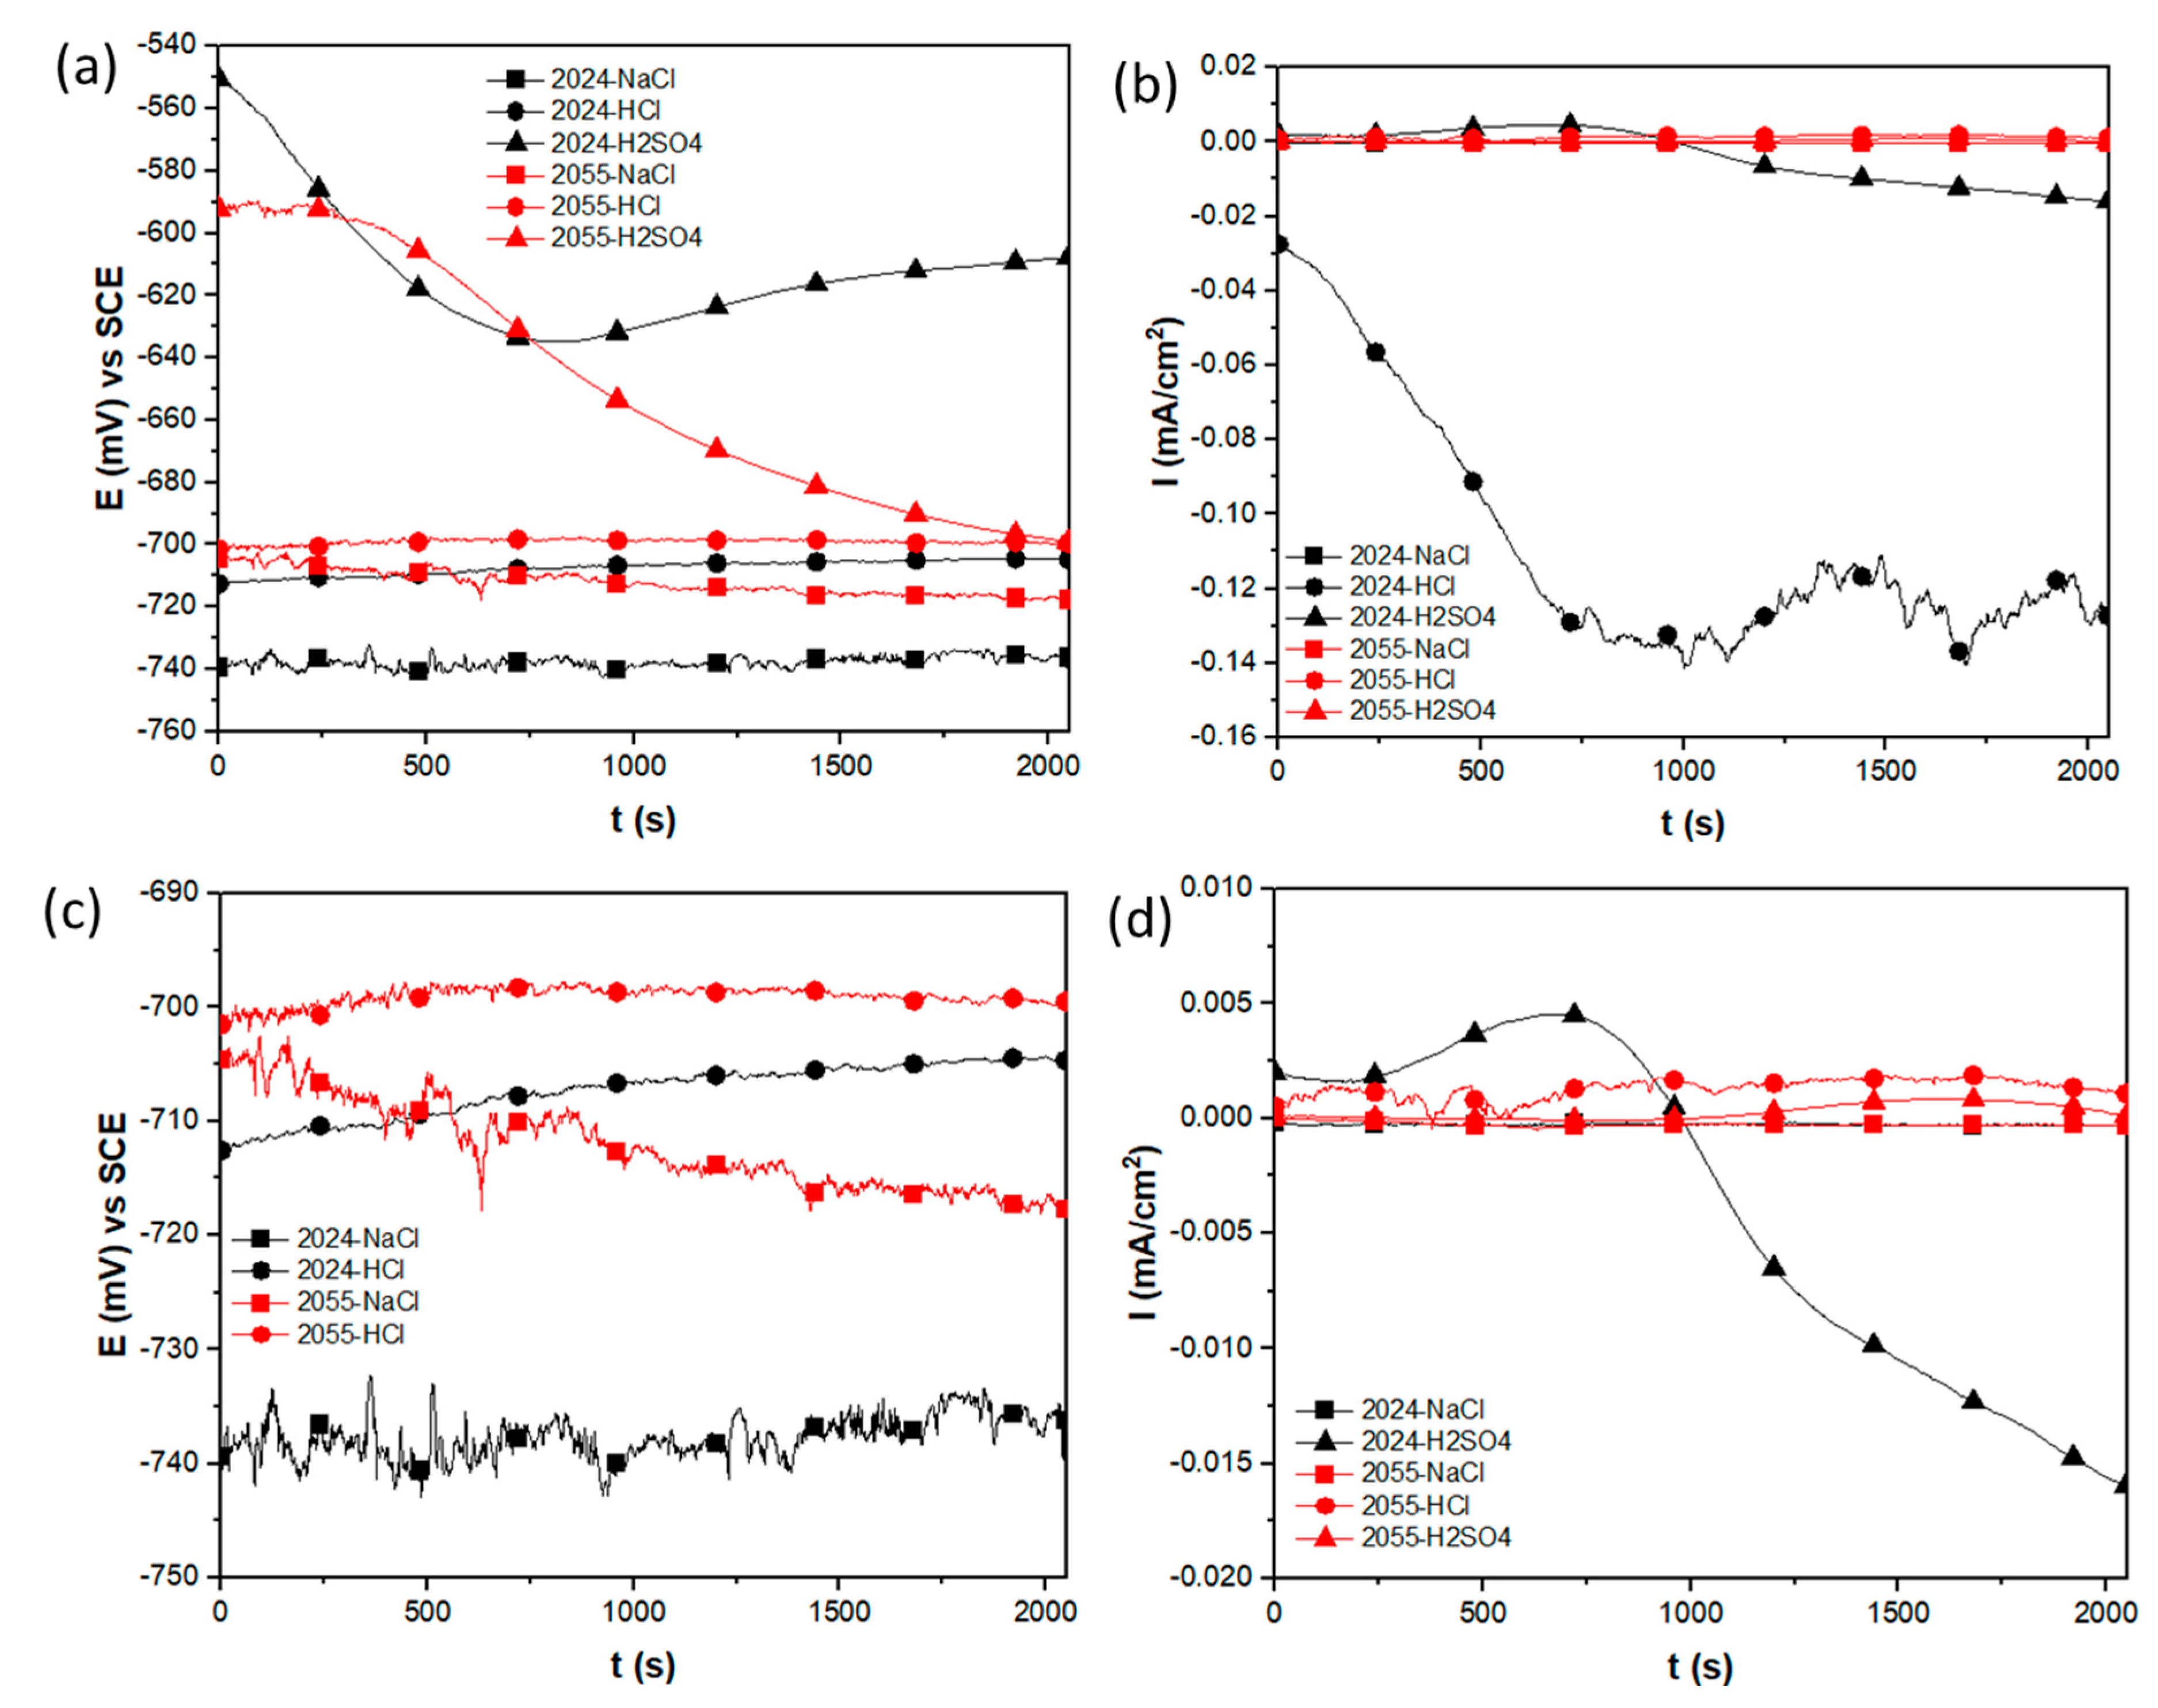
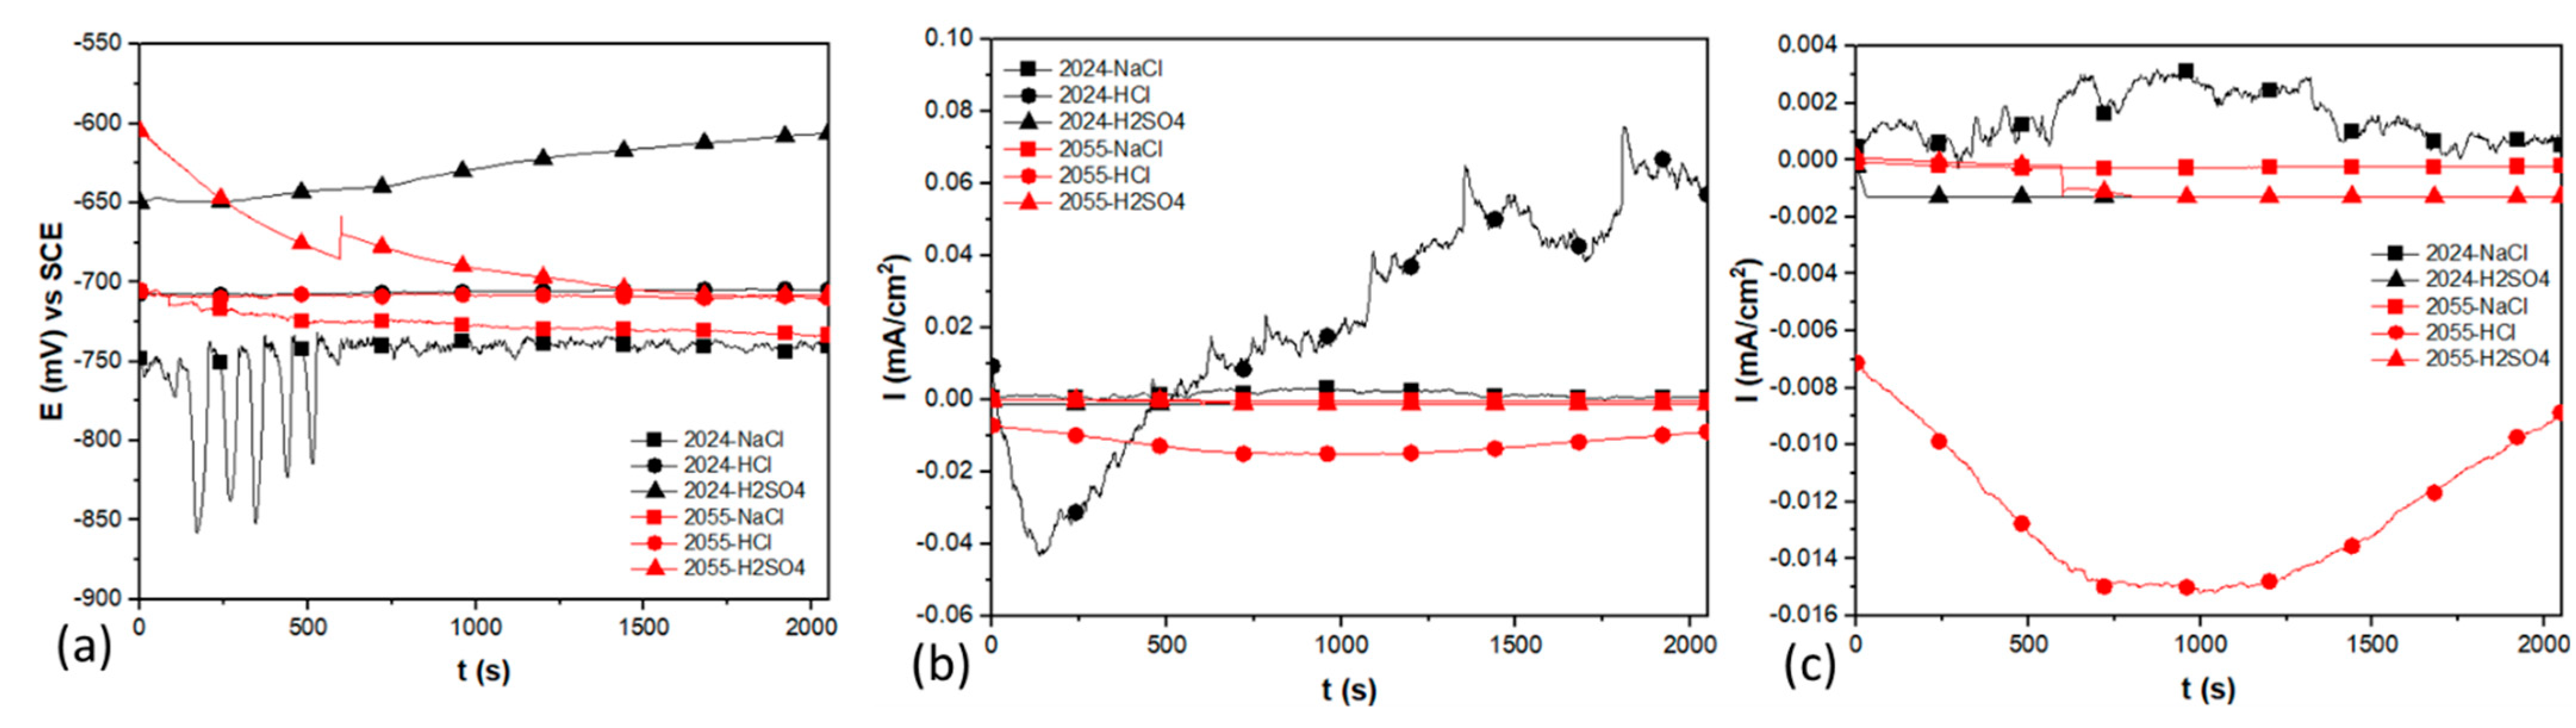
3.3. Analysis of Electrochemical Noise (Time Domain)

Figure 6 shows the electrochemical noise signals, both in potential (EPN) and in current (ECN), obtained for AA2024 and AA2055 aluminum alloys in the presence of the three types of electrolytes and under heat treatment condition T0. These signals include the DC trend.
In Figure 6a, which corresponds to the EPN signal, it can be observed that both alloys in the H2SO4 solution present nobler potentials than the rest of the signals. No notable transients were observed during the test, which may mean that both alloys remained in a passive state.
The AA2024-T0 alloy in the 3.5 wt. % NaCl solution presented intense fluctuations in potential of approximately 110 mV (−840 to −730 mV). These presented from the beginning of the test and continued up to 240 s. Later, they presented again at 1100 and 1250 s. Small, low-amplitude, high-frequency transients were also observed throughout the test.
In Figure 6b, which corresponds to the ECN signal, notable transients can be observed for the AA2024-T0 signal in the 3.5 wt. % NaCl solution that corresponds to the EPN signals for this alloy, which were discussed in the previous paragraph.
The signal corresponding to AA2024-T0 in the presence of H2SO4 presented a wide variation in the current demand that started with an increase (0.01 to 0.028 mA/cm2) up to an appreciable decrease (0.028 to −0.018 mA/cm2). However, this signal did not present appreciable transients.
The AA2055-T0 alloy in the presence of HCl presented transient currents of low amplitude and high frequency in addition to an almost constant trend towards a higher current demand, a characteristic sign of uniform corrosion processes or a passive state.
Figure 6. Electrochemical potential noise (a) and electrochemical current noise (b) noise-time series for AA2024 and 2055 alloys in T0 heat treatment condition, exposed in 3.5 wt. % NaCl, 1 wt. % HCl, and 1 wt. % H2SO4 solutions.
Metals 13 00429 g006
The alloys subjected to heat treatment condition T0 and exposed to NaCl and HCl solutions showed a higher susceptibility to localized corrosion. This behavior can be related to the high amount of precipitated, intermetallic particles observed on the surface of the explosion which could be forming galvanic pairs with the matrix. This can also be attributed to the free precipitation adjacent to the grain boundaries observed on the surface of the flash zones since it has been reported in the literature [62,63,64,65] that these depletion zones are more susceptible to located corrosion.
Figure 7 shows the EPN and ECN signals, obtained for both alloys, in the presence of the three electrolytes and under the T6 heat treatment condition. Likewise, the DC trend is included.
In Figure 7a, corresponding to the EPN signal, it can be observed that both alloys in H2SO4 presented nobler potentials than the rest of the signals. No notable transients were observed during the test, which may indicate that both alloys remained in a passive state, although alloy 2055-T6 in H2SO4 showed a continuous trend towards active potentials.
The AA2024-T6 alloy, which was exposed to a NaCl solution, presented the most active and transient potentials of low amplitude and high frequency, characteristic of uniform corrosion.
The 2024-T6 and 2055-T6 alloys in the HCl solution and the 2055-T6 alloy in the NaCl solution showed similar behaviors, with no appreciable trend and very low-amplitude transients. In Figure 8c, in which the scale was enlarged, the transients in the signal of the AA2024-T6 alloy can be observed more clearly.
Figure 7b shows a large decrease in the current demand for the 20204T6 alloy signal in the HCl solution (−0.03 to −0.013 mA/cm2). Low-amplitude transients were also observed in this signal from 750 s of the test. The rest of the signals showed similar behavior without an appreciable change in the current demand.
In Figure 7d, the ECN signals are presented with the enlarged scale. A very similar behavior was observed for the signals of the AA2055-T6 alloy in the presence of the three solutions.
The AA2024-T6 alloy in the presence of the NaCl solution showed the highest susceptibility to localized corrosion, although to a lesser degree than the same alloy from the T0 condition. This behavior may be associated with the lower number of precipitates observed on the surface of the alloy compared to 2024-T0 as well as their more even distribution, which reduces the incidence of localized corrosion. Similarly, solutions containing Cl ions (HCl and NaCl solutions) developed a uniform or localized corrosion process in the metal.
Figure 7. Electrochemical potential noise (a) and electrochemical current noise (b) noise-time series for AA2024 and 2055 alloys in T6 heat treatment condition, exposed in 3.5 wt. % NaCl, 1 wt. % HCl, and 1 wt. % H2SO4 solutions. (c) Windowing of electrochemical potential noise (EPN) from −690 to −750 mV (d); windowing of electrochemical current noise (ECN) from 0.010 to −0.020 mA.
Metals 13 00429 g007
Figure 8 shows the EPN and ECN signals, obtained for both alloys in the presence of the three electrolytes and under the T8 heat treatment conditions. The DC trend is included.
In Figure 8a, corresponding to the EPN signal, it can again be observed that the 2024 and 2055 alloys from the T8 condition, in the presence of H2SO4, presented more noble potentials than the rest of the signals. In addition, the incidence 2055 presented, again, a trend towards possible assets as the test time elapsed.
Large amplitude fluctuations were also observed, approximately 130 mV (−860 to −730 mV) in the potential for the 2024 detection in NaCl solution, which, as for the T0 and T6 conditions, presented the most active potentials. These fluctuations appeared at 100 s and were maintained for approximately 550 s; later transients of low amplitude and high frequency appeared during the rest of the test. This behavior can again be attributed to the number of precipitates observed on the surface and the presence of Cl−1 ions, as pitting corrosion of high-strength Al alloys such as AA2024 has been reported to be associated with the development of intermetallic particles, mainly in media containing chlorides [66]. Two of the most important intermetallic particles are θ′(Al2Cu) and S(Al2CuMg). The S phase is associated with whole nucleation [62]. The corrosion behavior of these particles was extensively investigated [66,67,68,69,70]. Buchheit et al. [67] and Zhu et al. [71] reported that this phase is an anodic site that favors whole nucleation. The rest of the signals showed similar behavior, consisting of a low tendency to potential variation and transients of very low amplitude.
The ECN signals can be observed in Figure 8b. In this context, the 2024-T8 disturbance exposed to NaCl presented a tendency towards a greater current demand as well as transients of 0.02 mA/cm2 amplitude and low frequency. The rest of the signals did not present appreciable current transients. Carrying out an extension of the scale, it can be observed that the alloys in the presence of H2SO4 did not present a variation in the current demand.
Figure 8. Electrochemical potential noise (a) and electrochemical current noise (b) noise-time series for AA2024 and 2055 alloys in T8 heat treatment condition, exposed to 3.5 wt. % NaCl, 1 wt. % HCl, and 1 wt. % H2SO4 solutions. (c) Windowing of electrochemical current noise (ECN) from 0.004 to −0.016 mA.
Metals 13 00429 g008

Analysis Utilizing Statistical Parameters

The continuous change in potential and/or current values in the electrochemical noise time series is known as a DC trend or drift. The fact that there is a DC trend in the EN signals means that they are not stationary. This can lead to misinterpretation when applying analysis procedures. Frequently, it is recommended to eliminate the trend to obtain stationary records. Eliminating the trend improves the reliability of data analysis methods [72,73,74,75,76,77].
To properly interpret the most common statistical parameters, the analyzed signals must be stationary: that is, their mean and standard deviation do not vary over time. Statistical methods treat time records as a collection of individual potential or current data regardless of the order in which the values appear in the series. There is no correlation between the data of a series. A temporal record can be represented by its distribution of values and is expressed in terms of its cumulative probability density function.
The voltage and current values are recorded as time series xn, n = 1, …, N, where x represents the potential (V) or current (i) signal and N is the total number of points in the time series [77,78,79,80].
One of the statistical parameters used was the standard deviation, which allows for the evaluation of the dispersion of a data set with respect to the mean value. Its application can be very useful to quantify the amplitude of the fluctuations. It is defined as the square root of the variance (Equation (1)) [80,81].
σ   standard   deviation = x σ 2
where x σ 2 , the variance, is calculated using Equation (2):
  x σ 2 variance = n = 1 N x n x ¯ 2 N 1
The use of the standard deviations of the potential, σ v ,   and current intensity, σ i ,   for the interpretation of the noise records can be achieved through their relationship, called noise resistance Rn, calculated by the relationship between the standard deviations of the records of potential and current intensity (Equation (3)) [82].
Rn   noise   resistance = σ v σ i A
The localization index (LI) is used to compare the value of the average current with the magnitude of the fluctuations, thus facilitating the discrimination between localized and uniform corrosion processes. To calculate the localization index, the root mean square of the current is used, considering that the current passes between the two working electrodes regardless of their direction (Equation (4)) [81,83,84,85].
LI   localization   index   = σ i i x ¯ 2 = n = 1 N i n i ¯ 2 n = 1 N i n 2
The localization index is bounded between the values 0 and 1. The LI value is used to classify the process that is taking place, according to the Table 3.
As an alternative to the previous parameters, the skewness ( x σ 3 ) is used to measure the symmetry of the signal and the kurtosis ( x σ 4 ) to detect changes in the distribution of its values. These values are calculated using Equations (5) (skewness) and (6) (kurtosis) [86,87].
x σ 3 skewness = n = 1 N x n x ¯ 3 N 1 σ 3
x σ 4 kurtosis = n = 1 N x n x ¯ 4 N 1 σ 4
The above values are moments of the series. In this way, x σ 2 is the second moment of the temporal register: that is, the variance; x σ 3 the third (the skewness); and x σ 4 , the fourth (the kurtosis).
The determination of these statistical parameters generates a standard error in the results. This standard error is given by Equation (7) [87,88]:
SE   standard   error   = 24 N
where N is the number of data studied in the electrochemical noise technique.
In the present study, SE = 0.108.
The types of corrosion, determined by kurtosis and skewness, are given in Table 4 [89,90].
The EN parameters derived from the statistical analysis of the current and potential time series measurements are shown in Table 5, corresponding to the aluminum alloys with different heat treatments which were exposed to 3.5 wt. % NaCl, 1 wt. % HCl, and 1 wt. % H2SO4 solutions.
For the aluminum alloys exposed to a 3.5 wt. % NaCl solution, the noise resistance values (Rn) were, for the most part, of the order of 104. Only for the case of alloy AA20055 under condition T8 was the order of Rn 105. When analyzing the values of the localization index (LI), it can be observed that alloy AA2024 under conditions T0 and T8 presented localized corrosion. This result coincides with what was observed in the time series of Figure 7a,b, where intense transients associated with localized corrosion were observed. The AA2055-T0 alloy presented localized corrosion, which could agree with what was observed in the trend toward a higher current demand (Figure 6d) and toward active potentials (Figure 6a,c). These statements are further reinforced if the higher amount of surface precipitation in the AA2024-T0, AA2024-T8, and AA2055-T0 alloys is observed in the optical microscopy images (Figure 3) and SEM (Figure 4a,c and Figure 5a). Conditions AA2024-T6, AA2055-T6, and AA2055-T8 showed mixed corrosion. Analyzing the skew values, it can be observed that uniform-type corrosion was indicated for all the alloys, while the kurtosis values indicated pitting corrosion in the same way for all the alloys. If the visual analysis of the time series in Figure 6 is considered, it could be stated that the alloys AA2024T6, AA2055T6, and AA2055T8 presented uniform corrosion. With the fact that the kurtosis value indicated pitting corrosion, it could be assumed that the amount was so high as to be considered uniform. In general, it can be stated that in NaCl solution, the AA2024-T0, AA2024-T8, and AA2055-T0 alloys showed localized corrosion, while the AA2024T6, AA2055T6, and AA2055T8 alloys showed uniform corrosion.
For the aluminum alloys exposed to a 1 wt. % HCl solution, the statistical parameters of the aluminum alloys indicate that the Rn values were between the orders of magnitude of 101 to 103. The lowest Rn values were found in the AA2024 alloys under the T6 and T8 conditions, while the highest Rn values were found in the AA2024- T0 and AA2055-T8 alloys. The LI values indicated that localized corrosion occurred in the AA2024-T0, AA2024-T8, and AA2055-T6 alloys, while the mixed corrosion occurred in the AA2024-T6 and AA2055-T0 alloys. In the AA2055-T8 alloy, the LI value indicated the presence of uniform corrosion.
The kurtosis values indicated the presence of pitting corrosion for most of the alloys; only the AA2055-T8 alloy presented uniform corrosion. The skew values indicated that pitting corrosion occurred for the AA2024-T0 and AA2024-T8 alloys, while the rest of the alloys presented uniform corrosion. The three statistical parameters confirm localized corrosion for the AA2024-T0 and AA2024-T8 alloys. The same was confirmed for these alloys in the presence of 3.5% NaCl. As previously mentioned, these alloys presented a greater amount of surface precipitates. The AA2055-T6 alloy may show localized corrosion as confirmed by LI and kurtosis. This is reasonable considering that the ECN time series (Figure 7d) exhibited wide current fluctuations. In addition, the cracks present on the surface of the alloy that facilitate the development of this type of corrosion should be mentioned. Bertocci et al. pointed out [90] that aged AA2055 is dominated by fine precipitates, T1, ϑ’ and S, which provide good tensile properties; however, they can form galvanic pairs with the matrix, causing the breakdown of the passive layer and the consequent dissolution of the material in the presence of solutions that contain Cl ions. For the AA2055-T0 alloy, mixed corrosion was confirmed for LI, pitting for kurtosis, and uniform corrosion for skew. If the trend towards an increase in current and active potentials is considered (Figure 8), in addition to the high surface precipitation (Figure 3 and Figure 5a), it could be assumed that localized corrosion occurred for this alloy. The AA2024-T6 and 2055-T8 alloys showed uniform corrosion. In general, the alloys with the greatest susceptibility to localized corrosion processes in HCl solution, were AA2024-T0, AA2024-T8, AA2055-T6, and AA2055-T0.
For the aluminum alloys exposed to 1 wt. % H2SO4 solutions, the results indicated that the Rn values were mostly around 104. The lowest Rn value was found in the AA2024-T0 alloy, whose order of magnitude was 102. The localization index indicated the presence of mixed corrosion in most of the alloys; however, only the AA2055-T0 alloy presented uniform corrosion. The kurtosis values indicated pitting corrosion in most of the alloys except for the AA2024-T6 alloy, which indicated uniform corrosion. Bias values indicated uniform type corrosion in most alloys. Only the AA2024-T8 alloy showed pitting corrosion. In this case, it can be mentioned that the kurtosis presented a discrepancy when indicating pitting corrosion for most of the alloys, while the values of LI and bias mostly indicated mixed corrosion and uniform corrosion, respectively. Furthermore, considering the visual analysis of the time series, stability was observed in most of the alloys as they did not present notable transients in potential or current. In the case of the AA2024-T8 alloy, mixed corrosion was indicated for LI and pitting corrosion was indicated for kurtosis and skewness. However, regarding the ECN time series of Figure 9c, it was observed that there was a drop in the current demand. The same was true for the AA2055-T8 alloy. It can be assumed that these two alloys remained in a passive state. For the rest of the alloys, it can be stated that uniform corrosion processes occurred.

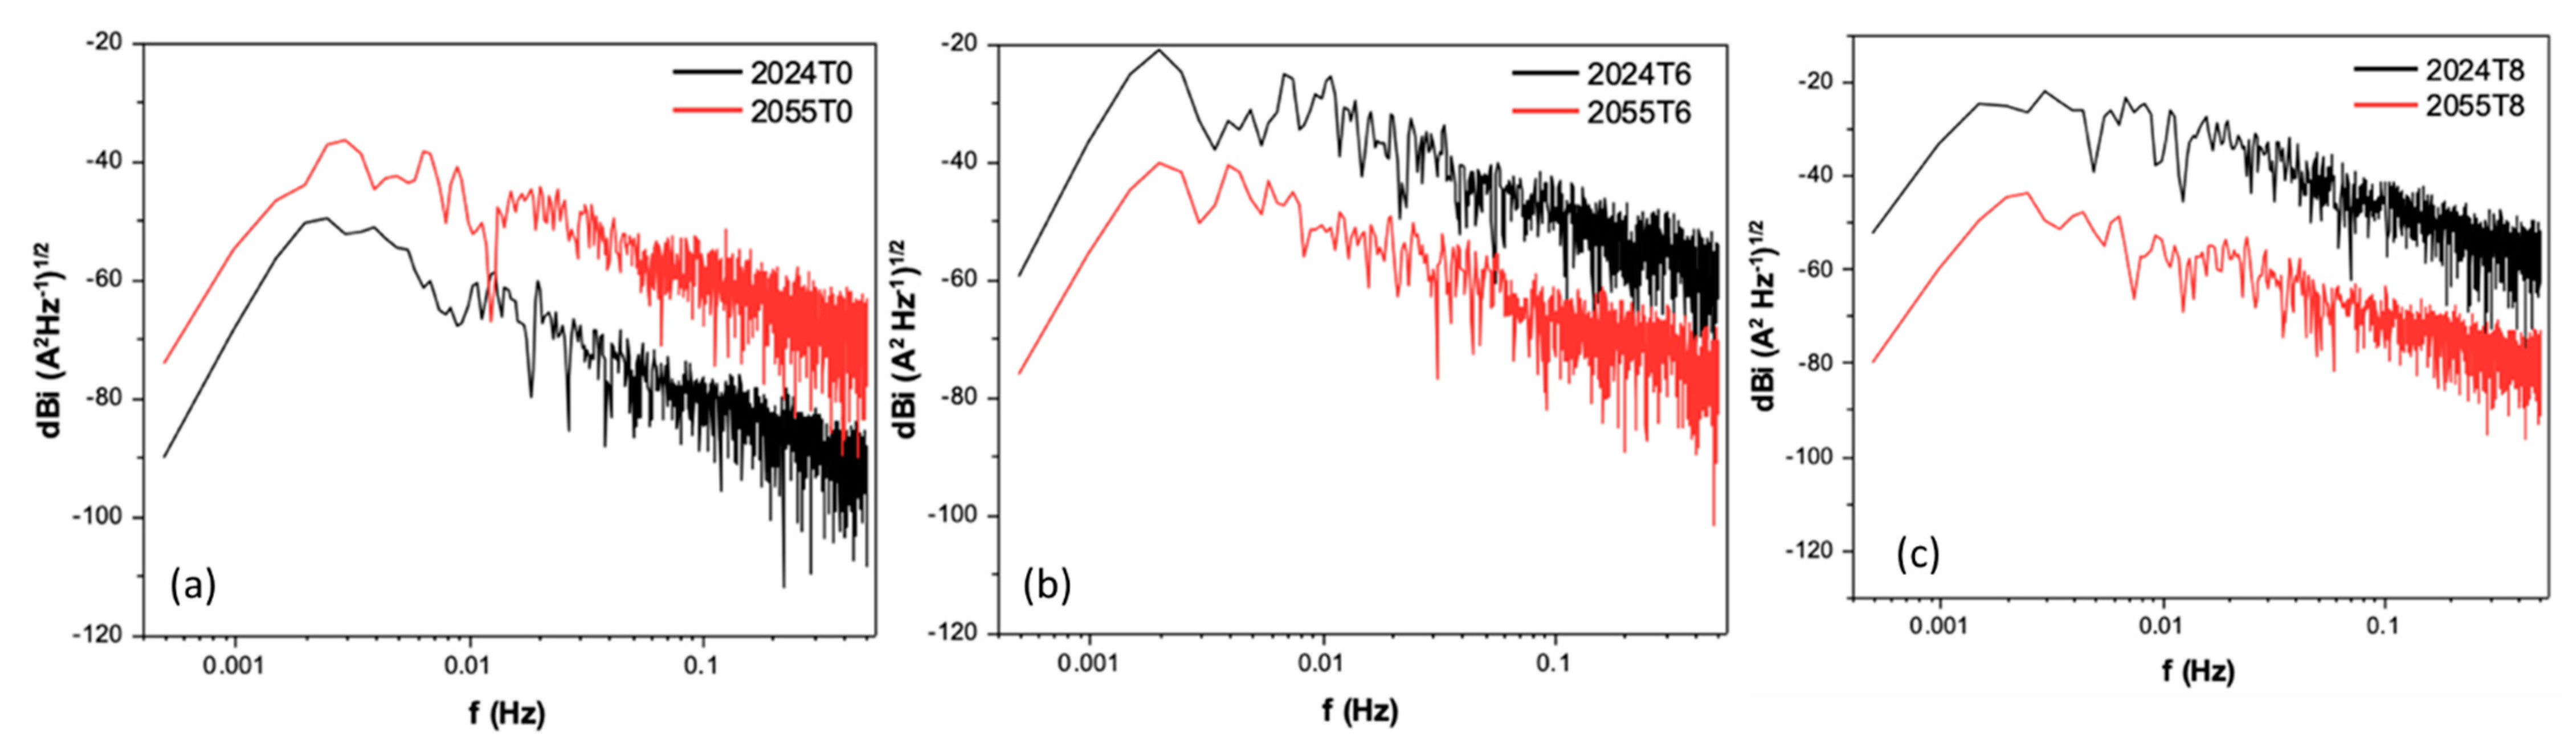
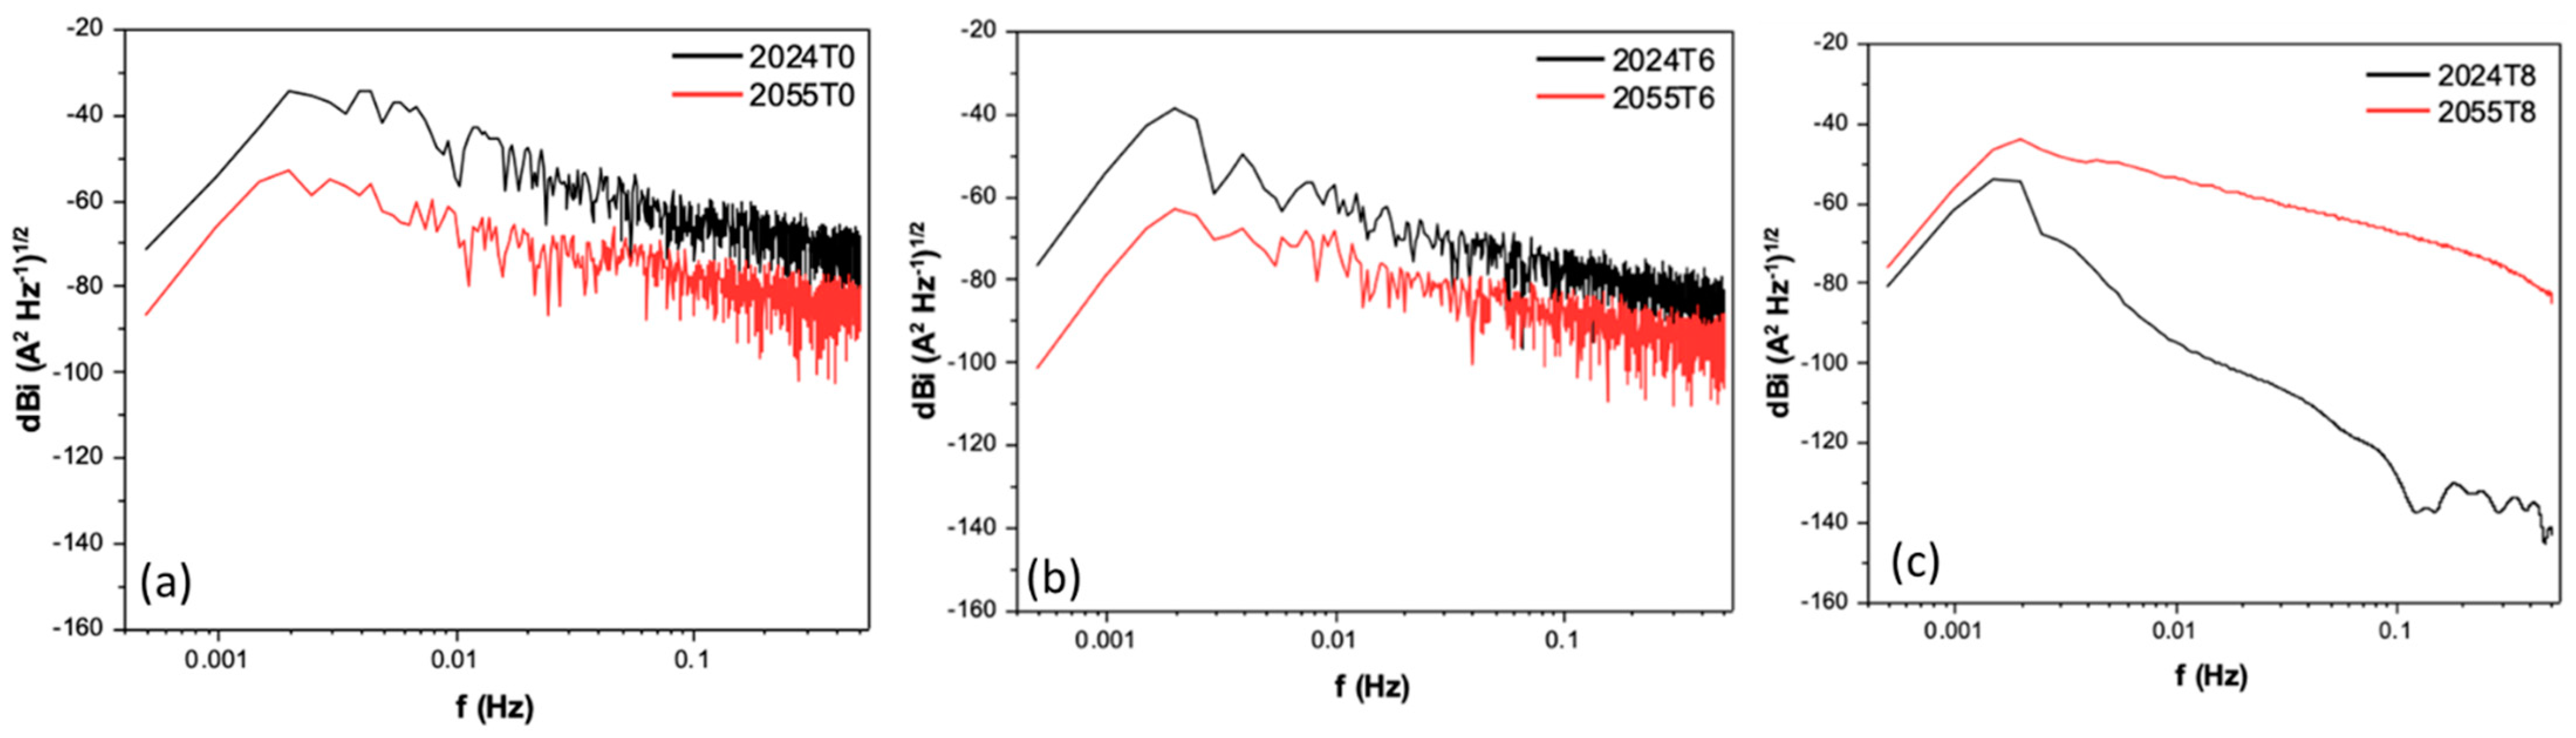
3.4. Power Spectral Density (Frequency Domain)

Through analysis in the frequency domain, utilizing power spectral density (PSD) signals, it is also possible to obtain information about the electrochemical processes present at the metal–electrolyte interface. It is considered important to carry out this analysis to try to corroborate the results obtained through the analysis of the statistical parameters.
Normally, the characteristics of spectral power density signals allow for the definition of three parameters: the slope of the high-frequency linear zone, β, the value of the power at the limit of zero frequency, ψ0, and the cutoff frequency that separates the areas of high and low frequencies, fc. These parameters have been related to the mechanisms and rates of corrosion present [90].
Electrochemical noise data can be expressed as a function of frequency using fast Fourier transform (FFT). This can be achieved using Equations (8) and (9) [91].
R x x = 1 N n = 0 N m + 1 x n · x n + m             w h e n   v a l u e s   a r e   f r o m   0 < n < N
ψ x k = Υ · t m N · n = 1 N x n x n ¯ · e 2 π k n 2 N
where Rxx represents a correlation signal, N represents the total data, and n represents a series of data. The product of m gives the delay time in which Rxx is defined by the time interval existing between each point of xn, x(n + m). The power spectral density is represented by ψx (k) and is expressed in frequency units, γ is a constant with a value of 2 if k = 1…(N/2)—1 and γ = 1 if k = N/2, k is the quantization of the frequency values, and tm is the time.
The slope value ( β x )   is used to find the corrosion mechanism. This slope is based on the cutoff frequency, i.e., the point where the slope starts. The slope is defined by β x and is represented by Equation (10).
log ψ x = β x log f
where ψx is the amplitude of the power spectral density spectra, −βx is the slope, and f is the frequency. The use of −βx to interpret electrochemical noise signals is based on the fact that the voltage and current signals vary depending on the process taking place [92]. The PSD is related to the total energy present in the system. Hence, the zero-limit frequency (Ψ0) provides information about the dissolution of the material [92,93]. The dissolution of the material occurs only in the current PSD. Table 6, proposed by Mansfeld et. al., determines the type of corrosion that occur on the surface of the alloys [94,95,96].
Figure 9 shows the current PSD graphs for the two studied alloys under the three heat treatment conditions, in the presence of 3.5 wt. % NaCl solution, using dBi as a function of frequency f(Hz). The value of the slope (β) in the current is related to the corrosion mechanism. In this exposure medium, the AA2024 alloy presented fewer negative values (higher values) of the power density at the zero-limit frequency (ψ0) for the three heat treatment conditions, indicating higher kinetics of corrosion or dissolution of the material. In the case of the AA2024-T8 and AA2024-T0 alloys, they presented the steepest slopes (more negative slopes). In the case of the heat treatment condition T8, the difference between the d(B) values between both alloys was very pronounced, while for the heat treatment condition T6 the behavior of both alloys was very similar. Again, the AA2024-T0 and AA2024-T8 alloys showed higher corrosion kinetics, which coincides with those values observed for the statistical parameters and visual analysis.
Figure 10 shows the PSD diagrams for both alloys under the three heat treatment conditions and exposed to a 1% HCl solution. Higher values of ψ0 were observed for the AA2024-T6 and 2024-T8 alloys, indicating higher corrosion kinetics.
In the T0 heat treatment condition, the AA2024 alloy presented lower dB values than the AA2055 but a steeper slope. In this condition, both alloys showed strong dB fluctuations.
Figure 11 shows the PSD diagrams for both alloys under the three heat treatment conditions and exposed to a 1 wt. % H2SO4 solution.
This figure shows a higher value of ψ0 for the AA2024 alloys under conditions T0 and T6, indicating higher kinetics of corrosion or dissolution of the material. For heat treatment T8, it was observed that the alloys did not present appreciable fluctuations. This coincides with the time series observed in Figure 8c, in which there was a drop in the current demand to subsequently remain without trend and without transients, indicating that both alloys remained in a passive state in the presence of the 1 wt. % H2SO4 solution.
Table 7 summarizes the values of the PSD parameters obtained. It was observed that in the presence of NaCl solution, the current slope values indicate pitting corrosion processes for aluminum alloys in the three heat treatment conditions except for AA2055-T8, whose slope value is related to uniform corrosion processes. For the T6 condition, both alloys presented similar behavior. The alloys with the highest corrosion kinetics were AA2024-T0 and AA2024-T8, while the alloy with the lowest corrosion kinetics was AA2055-T8. In the case of the AA2024-T0 and AA2024-T8 alloys, the results observed in this analysis coincide perfectly with those commented on in the visual analysis of the time series (Figure 5). Similarly, the IL and kurtosis values indicated localized corrosion processes (Table 5).
In the presence of HCl solution, the slope values indicated that pitting occurred in both alloys subjected to the three heat treatment conditions. Although the most negative slopes correspond to the alloys AA2024-T0 and AA2024-T8, it can be summarized that in the presence of 1 wt. % HCl solution, the AA2024T0 and AA2024T8 alloys presented higher corrosion kinetics.
In the presence of H2SO4, the values of the slopes correspond to pitting corrosion. However, it can be observed that the alloys AA2024-T8 and AA2055-T8 presented the most negative slopes, although, as previously mentioned, these alloys did not present fluctuations in the graphs of PSD. It is therefore assumed that they remained in a passive state during the test.
The alloys that presented less-negative slopes are AA2055-T0 and AA2055-T6. However, based on the value of the slope for these alloys and the visual analysis of Figure 8a,c, it can be stated that the main processes could be either mixed or uniform corrosion for these alloys.
Equal slope values were observed for the alloys AA2024-T0 and AA2024-T6, corresponding to a greater susceptibility to corrosion.
It is notorious that the AA2024 alloy in general showed greater susceptibility to corrosive processes compared to the AA2055 alloy. This can be related to the high Cu content in the AA2024 alloy as it is documented that Cu, in addition to other elements, precipitates as larger intermetallic particles which reach high surface densities and have electrochemical potentials. Therefore, regardless of the matrix, localized corrosion processes are developed [64,92,93,94,95,96,97].
According to the current observations in the values of the statistical parameters and the PSD analysis, it can be affirmed that the alloys AA2024-T6 and AA2055-T8 presented a better corrosion performance, which can be attributed to the lesser number of particles. Precipitates were observed in the microstructure of these alloys. For AA2024-T6, few intermetallic particles and precipitates were observed compared to AA2024-T0 and T8. The more homogeneous surface inhibited the development of the electrochemical activity [98].
Similarly, few precipitates were observed in the microstructure of AA2055-T8. The cold deformation may have caused a better distribution of the precipitates towards the interior of the grains. In addition, the content of Ag and Zn decreased the potential difference between the second phases and the matrix.

4. Conclusions

In this research work, a study was carried out on the corrosion performance of the AA2024 and AA2055 alloys, which were subjected to three different thermal treatments in the presence of three different electrolytes.
  • Results indicated that the high Cu content in the AA2024 alloy was reflected in the composition of the precipitates on its surface. This composition, obtained by EDS, showed a higher content of Cu than Al. The high content of Cu reduces corrosion resistance;
  • Solution heat treatment, followed by rapid quenching and subsequent artificial aging, caused many cracks in the AA2055 alloy. These cracks developed at the grain boundaries, probably because of rapid cooling. However, this alloy did not present a great susceptibility to corrosion, as in the case of AA2024;
  • A higher susceptibility to corrosion was observed for the AA2024-T0 and AA2024-T8 alloys, which could have been due to the higher number of particles precipitated on the surface of these alloys;
  • Vickers microhardness values of 77, 174, and 199 were obtained in the AA2055 alloy with the heat treatments T0, T6, and T8 respectively. These are higher values than those obtained in the AA2024 alloy in the same heat treatments;
  • Higher corrosion kinetics were also observed in the presence of 3.5 wt. % NaCl and 1 wt. % HCl solutions. This may be explained by the presence of the Cl ion, which has the characteristics of strong penetration or adsorption and subsequently reduces the protection of the passive layer, leading to the evolution of hydrogen during anodic dissolution;
  • The highest electrochemical noise resistance occurred in the AA2055 alloy under the T8 conditions evaluated in NaCl and HCl. In the case of H2SO4, T6 was shown to be the best treatment, reaching Rn values of 2.72 × 10⁵ ohm·cm2 in NaCl, 4.16 × 10³ ohm·cm2 in HCl, and 5.81 × 10⁴ ohm·cm2 in H2SO4;
  • The alloys that showed a better balance between corrosion performance and microhardness were the AA2024-T6 and AA2055-T8 alloys;
  • The statistical analysis of the electrochemical noise signals in the time domain (LI, kurtosis, skewness) presented different types of corrosion in the alloys AA2024 and AA2055. Pitting corrosion was predominant, which is due to the precipitates present in both materials as a consequence of the heat treatments applied;
  • The analysis by power spectral density (frequency domain) resulted in a type of pitting corrosion for the alloys AA2024 and AA2055 in the three evaluation solutions;
  • The AA2055-T6 alloy also presented high microhardness values, however, a microstructure with cracks propagated over the grain boundaries was revealed. This behavior was likely present due to the temperature gradient generated during tempering, giving rise to corrosion processes in the alloy;
  • The T6 and T8 heat treatments improved the corrosion resistance of the AA2055 aluminum alloy in NaCl, HCl and H2SO4 solutions compared to conventional AA2024 alloys.

Author Contributions

Conceptualization, C.G.-T., F.A.-C. and J.C.-M.; methodology, H.R.-C., E.M.-B., F.E.-L. and C.G.-T.; data curation, F.A.-C., R.G.B.-M., D.N.-M., H.R.-C. and F.E.-L.; formal analysis, F.A.-C., J.C.-M. and C.G.-T.; writing—review and editing, F.A.-C., J.C.-M. and C.G.-T. All authors have read and agreed to the published version of the manuscript.

Funding

This research received no external funding.

Data Availability Statement

Not applicable.

Acknowledgments

The authors would like to thank the UANL-CA-316 working group and Universidad Autónoma de Nuevo León (UANL) for the facilities given to developing this investigation.

Conflicts of Interest

The authors declare no conflict of interest.

References

  1. Dursun, T.; Soutis, C. Recent developments in advanced aircraft aluminum alloys. Mater. Des. 2014, 56, 862–871. [Google Scholar] [CrossRef]
  2. Mouritz, P.A. Introduction to Aerospace Materials, 1st ed.; Woodhead Publishing: Cambridge, UK, 2012; pp. 202–223. [Google Scholar]
  3. Zhang, X.; Chen, Y.; Hu, J. Recent advances in the development of aerospace materials. Prog. Aerosp. Sci. 2018, 97, 22–34. [Google Scholar] [CrossRef]
  4. Gloria, A.; Montanari, R.; Richeta, M.; Varone, A. Alloys for Aeronautic Application: State of the Art and Perspectives. Metals 2019, 9, 662. [Google Scholar] [CrossRef] [Green Version]
  5. Cabral-Miramontes, J.; Gaona-Tiburcio, C.; Estupinán-López, F.; Lara-Banda, M.; Zambrano-Robledo, P.; Nieves-Mendoza, D.; Maldonado-Bandala, E.; Chacón-Nava, J.; Almeraya-Calderón, F. Corrosion Resistance of Hard Coat Anodized AA 6061 in Citric–Sulfuric Solutions. Coatings 2020, 10, 601. [Google Scholar] [CrossRef]
  6. Prassad, N.E.; Gokhale, A.A.; Wanhil, R.J.H. Aluminum Lithium Alloys: Progressing, Properties and Applications, 1st ed.; Elsevier: Edinburgh, UK, 2013; pp. 461–462. [Google Scholar]
  7. Moreto, J.A.; Gamboni, O.C.; Marino, C.E.B. Corrosion behaviour of Al-Li alloys used as aircraft materials. Koroze Ochr. Mater. 2012, 31, 60–74. [Google Scholar]
  8. Gianni, L.; Cavallini, M.; Natali, S.; Adriaens, S. Wet and dry accelerated aging tests in a spray chamber to understand the effects of acid rain frequencies on bronze corrosion. Int. J. Electrochem. Sci. 2013, 8, 1822–1838. [Google Scholar]
  9. Zhu, L.; Li, N.; Childs, P.R.N. Light-weightin in aerospace component and system design. Propul. Power Res. 2018, 7, 103–119. [Google Scholar] [CrossRef]
  10. Aamir, M.; Giasin, K.; Tolouei-Rad, M.; Vafadar, A. A review: Drilling performance and hole quality of aluminum alloys for aerospace applications. J. Mater. Res. Technol. 2020, 9, 12484–12500. [Google Scholar] [CrossRef]
  11. Donatus, U.; Thompson, G.E.; Omotoyinbo, J.A.; Alaneme, K.K.; Aribo, S.; Agbabiaka, O. Corrosion pathways in aluminum alloys. Trans. Nonferrous Met. Soc. China 2017, 27, 55–62. [Google Scholar] [CrossRef]
  12. Estupiñán-López, H.F.; Almeraya-Calderón, F.; Bautista Margulis, G.R.; Baltazar Zamora, M.A.; Martínez-Villafañe, A.; Uruchurtu, C.J.; Gaona-Tiburcio, C. Transient analysis of electrochemical noise for 316 and duplex 2205 stainless steels under pitting corrosion. Int. J. Electrochem. Sci. 2011, 6, 1785–1796. [Google Scholar]
  13. Mousavi, S.H.; Sadeghi, D.; Lee, H.; Shin, W.; Park, N. TEM study S’ hardening precipitates in the cold rolled and aged AA2024 aluminum alloy: Influence on microstructural evolution, tensile properties & electrical conductivity. J. Mater. Res. Technol. 2021, 13, 798–807. [Google Scholar]
  14. Siskou, N.; Charalampidou, C.; Alexopoulos, N.D.; Kourkoulis, S.K. Effect of corrosion exposure on aluminum alloy 2024 for different artificial ageing conditions. Procedia Struct. Integr. 2018, 10, 79–84. [Google Scholar] [CrossRef]
  15. Merisalu, M.; Aarik, L.; Kozlova, J. Effective corrosion protection of aluminum AA2024-T3 with novel thin nanostructured oxide coating. Sur. Coat. Tech. 2021, 411, 126993. [Google Scholar] [CrossRef]
  16. Martínez-Villafañe, A.; Almeraya-Calderón, M.F.; Gaona-Tiburcio, C.; Gonzalez-Rodriguez, J.G.; Porcayo-Calderón, J. High-Temperature Degradation and Protection of Ferritic and Austenitic Steels in Steam Generators. J. Mater. Eng. Perform. 1997, 7, 108–113. [Google Scholar] [CrossRef]
  17. García, J.L.; Garay, C.G.; Gómez, I.K.; Ruiz, M.A. Influence of plastic deformation and Cu/Mg ratio on the strengthening mechanisms and precipitation behavior of AA2024 aluminum alloys. J Mater. Res. Technol. 2019, 8, 5471–5475. [Google Scholar] [CrossRef]
  18. El-Aty, A.A.; Xu, Y.; Guo, X. Strengthening mechanism, deformation behavior, and anisotropic mechanical properties of Al-Li alloys: A review. J. Adv. Res. 2018, 10, 49–67. [Google Scholar] [CrossRef]
  19. Ma, Y.; Zhou, X.; Huang, W.; Liao, Y. Chrystallographic defects induced localized corrosion in AA2099-T8 aluminum alloy. Corros. Eng. Sci. Technol. 2015, 50, 420–424. [Google Scholar] [CrossRef]
  20. Zhang, X.; Zhou, X.; Hashimoto, T.; Lindsay, J.; Ciuca, O.; Luo, C.; Sun, Z.; Zhang, X.; Tang, Z. The influence of grain structure on the corrosion behavior of 2A97-T3 Al-Cu-Li alloy. Corros. Sci. 2017, 116, 14–21. [Google Scholar] [CrossRef]
  21. Gialanella, S.; Malandruccolo, A. Aerospace Alloys, 1st ed.; Springer: Cham, Switzerland, 2020; pp. 129–189. [Google Scholar]
  22. Ma, Y.; Zhou, X.; Meng, X.; Huang, W.; Liao, Y. Influence of thermomechanical treatments on localized corrosion susceptibility and propagation mechanism of AA2099 Al-Li alloy. Trans. Nonferrous Met. Soc. China 2016, 26, 1472–1481. [Google Scholar] [CrossRef]
  23. Araullo-Peters, G.V.; Geuser, B.; Deschamps, F. Microstructural evolution during ageing of Al-Cu-Li-x alloys. Acta Mater. 2014, 66, 199–208. [Google Scholar] [CrossRef] [Green Version]
  24. Li, S.; He, C.; Fu, J.; Xu, J.; Xu, G. Evolution of microstructure and properties of novel aluminum-lithium alloy with different roll casting process parameters during twin-roll casting. Mater. Charact. 2020, 161, 110–145. [Google Scholar] [CrossRef]
  25. Liu, Q.; Zhu, R.H.; Liu, D.Y.; Xu, Y. Correlation between artificial aging and intergranular corrosion sensitivity of a new Al-Cu-Li alloy sheet. Mater. Corros. 2017, 68, 65–76. [Google Scholar] [CrossRef]
  26. Zhang, S.F.; Zeng, W.D.; Yang, W.H.; Shi, C.L. Ageing response of an Al-Cu-Li 2198 alloy. Mater. Des. 2014, 63, 368–374. [Google Scholar] [CrossRef]
  27. Eskin, D.G. Aluminum–Lithium Alloys. Process Metallurgy, Physical Metallurgy, and Welding, 1st ed.; CRC Press: Boca Ratón, FL, USA ; Taylor & Francis Group: Boca Ratón, FL, USA, 2017; Volume 8. [Google Scholar]
  28. Jambora, M.; Novýa, F.; Bokůvkaa, O.; Trško, L. The natural aging behavior of the AA 2055 Al-Cu-Li alloy. Transp. Res. Proc. 2019, 40, 42–45. [Google Scholar] [CrossRef]
  29. Alloy Data Sheet and Properties. Available online: https://unitedaluminum.com/2024-aluminum-alloy/ (accessed on 7 December 2022).
  30. Harry, C. Heat Treater´s Guide. Practices and Procedures for Nonferrous Alloys, 3rd ed.; ASTM International: West Conshohocken, OH, USA, 2006. [Google Scholar]
  31. Campbell, F.C. Manufacturing Technology for Aerospace Structural Materials, 1st ed.; Elsevier: New York, NY, USA, 2006. [Google Scholar]
  32. ASTM E3-95; Standard Practice for Preparation of Metallographic Specimens. ASTM International: West Conshohocken, PA, USA, 1995.
  33. ASM Handbook. Metallography and Microstructure; ASTM International: West Conshohocken, PA, USA, 2004; Volume 9.
  34. ASTM E112-96; Standard Test Methods for Determining Average Grain Size. ASTM International: West Conshohocken, PA, USA, 1996.
  35. ASTM E384-22; Standard Test Methods for Micro indentation Hardness of Materials. ASTM International: West Conshohocken, PA, USA, 2022.
  36. ASTM G199-09; Standard Guide for Electrochemical Noise Measurement. ASTM International: West Conshohocken, PA, USA, 2009.
  37. Samaniego-Gámez, P.; Almeraya-Calderón, F.; Martin, U.; Ress, J.; Gaona-Tiburcio, C.; Silva-Vidaurri, L.; Cabral-Miramontes, J.; Bastidas, J.M.; Chacón-Nava, J.G.; Bastidas, D.M. Efecto del tratamiento de sellado en el comportamiento frente a corrosión de la aleación anodizada de aluminio-litio AA2099. Rev. Met. 2020, 56, e180. [Google Scholar] [CrossRef]
  38. Lara, M.; Gaona, C.; Zambrano, P.; Delgado, M.; Cabral, J.; Nieves, D.; Maldonado, E.; Estupiñan, F.; Chacón, J.; Almeraya, F. Alternative to Nitric Acid Passivation of 15-5 and 17-4PH Stainless Steel Using. Materials 2020, 12, 2836. [Google Scholar] [CrossRef] [PubMed]
  39. Lumley, R. Fundamentals of Aluminum Metallurgy. Production, Processing, and Applications; Woodhead Publishing: Sawston, UK, 2011. [Google Scholar]
  40. Cabral-Miramontes, J.A.; Bastidas, D.M.; Baltazar, M.A.; Zambrano-Robledo, P.; Bastidas, J.M.; Almeraya-Calderón, F.M.; Gaona-Tiburcio, C. Corrosion Behavior of Zn-TiO2 and Zn-ZnO Electrodeposited Coatings in 3.5% NaCl Solution. Int. J. Electrochem. Sci. 2019, 14, 4226–4239. [Google Scholar] [CrossRef]
  41. Polmear, I.J. Light Alloys-From Traditional Alloys to Nanocrystal, 4th ed.; Butterworth-Heinemann: Oxford, UK, 2005. [Google Scholar]
  42. Dorin, T.; Vahid, A.; Lamb, J. Fundamentals of Aluminum Metallurgy; Elsevier: Amsterdam, The Netherlands, 2018; Chapter 11. [Google Scholar]
  43. Li, H.G.; Ling, J.; Xu, Y.W.; Sun, Z.G.; Liu, H.B.; Zheng, X.W.; Tao, J. Effect of aging treatment on precipitation behavior and mechanical properties of a novel aluminum-lithium alloy. Acta Metall. Sin. Engl. Lett. 2015, 28, 671–677. [Google Scholar] [CrossRef]
  44. Sainfort, P.; Dubost, B. Coprecipitation hardening in Al-Li-Cu-Mg alloys. J. Phys. Colloq. 1987, 48, C3-407–C3-413. [Google Scholar] [CrossRef]
  45. Martins, F.; Terada, M.; Santos, A. Comparison of corrosion resistance of the AA2524-T3 and AA2024-T3. Metals 2021, 11, 980. [Google Scholar]
  46. Zhou, Y.; Liu, Z.; Bai, S.; Ying, P.; Lin, L. Effect of Ag additions on the lengthening rate of W plates and formation of s phase in Al-Cu-Mg alloys during thermal exposure. Mater. Charact. 2017, 123, 1–8. [Google Scholar] [CrossRef]
  47. Bai, S.; Ying, P.; Liu, Z.; Wang, J.; Li, J. Quantitative transmission electron microscopy and atom probe tomography study of Ag-dependent precipitation Ω phase in Al-Cu-Mg alloys. Mater. Sci. Eng. A 2017, 687, 8–16. [Google Scholar] [CrossRef]
  48. Chen, Z.; Zhao, K.; Fan, L.; Li, H.G. Combinative hardening effects of precipitation in a commercial aged Al–Cu–Li–X alloy. Mater. Sci. Eng. A 2013, 588, 59–64. [Google Scholar] [CrossRef]
  49. Maldonado-Bandala, E.; Jiménez-Quero, V.; Olguin-Coca, J.; Lizarraga, L.G.; Baltazar-Zamora, M.A.; Ortiz, A.; Almeraya, C.F.; Zambrano, R.P.; Gaona-Tiburcio, C. Electrochemical Characterization of Modified Concretes with Sugar Cane Bagasse Ash. Int. J. Electrochem. Sci. 2011, 6, 4915–4926. [Google Scholar]
  50. Itoh, G.; Cui, Q.; Kanno, M. Effects of a small additions of magnesium and silver on the precipitation of T1 phase in an Al-4%Cu-1.1%Li-0.2%Zr alloy. Mater. Sci. Eng. A 1996, 211, 128–137. [Google Scholar] [CrossRef]
  51. Zhu, R.; Liu, Q.; Li, J.; Xiang, S.; Chen, Y.; Zhang, X. Dynamic restoration mechanism and physical based constitutive model of 2050 Al-Li alloy during hot compression. J. Alloys Compd. 2015, 650, 75–78. [Google Scholar] [CrossRef]
  52. Samaniego-Gámez, P.O.; Almeraya-Calderon, F.; Maldonado-Bandala, E.; Cabral-Miramontes, J.; Nieves-Mendoza, D.; Olguin-Coca, J.; Lopez-Leon, L.D.; Silva Vidaurri, L.G.; Zambrano-Robledo, P.; Gaona-Tiburcio, C. Corrosion Behavior of AA2055 Aluminum-Lithium Alloys Anodized in the Presence of Sulfuric Acid Solution. Coatings 2021, 11, 1278. [Google Scholar] [CrossRef]
  53. Queiroz, F.M. Estudo Do Comportamento de Corrosao Dos Intermetálicos Presentes Na Liga AA2024-T3, Por meio De Técnicas De Microscopia Associadas A Técnicas Electroquímicas. Ph.D. Thesis, Universidade de Sao Paulo, Sao Paulo, Brazil, 2008. [Google Scholar]
  54. The Aluminum Association International. International Alloy. Designation and Chemical Compositions Limits for Wrought Aluminum and Wrought Aluminum Alloys with Support for On-Line Access From: Aluminum Extruders Council Use for the Information; The Aluminum Association: Arlington County, VA, USA, 2015. [Google Scholar]
  55. Boag, A.; Hughes, A.E.; Wilson, N.C.; Torpy, A.; MacRae, C.M.; Glenn, A.M.; Muster, T.H. How complex is the microstructure of AA2024-T3? Corr. Sci. 2009, 51, 1565–1568. [Google Scholar] [CrossRef]
  56. Gaona-Tiburcio, C.; Montoya, R.M.; Cabral, M.J.A.; Estupiñan, L.F.; Zambrano, R.P.; Orozco, C.R.; Chacon-Nava, J.G.; Baltazar, Z.M.A.; Almeraya-Calderon, F. Corrosion resistance of multilayer coatings deposited by PVD on inconel 718 using electrochemical impedance spectroscopy technique. Coatings 2020, 10, 521. [Google Scholar] [CrossRef]
  57. Jiang, B.; Yi, D.; Yi, X.; Zheng, F.; Wang, H. Effect of trace of added Sc on microstructure and mechanical properties of 2055 aluminum alloy. Mater. Charact. 2018, 141, 248–259. [Google Scholar] [CrossRef]
  58. Nokhrin, A.; Shadrina, I.; Chuvil’deev, V.; Kopylov, V. Study of Structure and Mechanical Properties of Fine-Grained Aluminum Alloys Al-0.6wt.%Mg-Zr-Sc with Ratio Zr:Sc = 1.5 Obtained by Cold Drawing. Materials 2019, 12, 316. [Google Scholar] [CrossRef] [Green Version]
  59. Kus, E.; Lee, Z.; Nutt, S.; Mansfeld, F. A Comparison of the Corrosion Behavior of Nanocrystalline and Conventional Al 5083 Samples. Corrosion 2006, 62, 152–161. [Google Scholar] [CrossRef]
  60. Chung, M.K.; Choi, Y.S.; Kim, J.G.; Kim, Y.M.; Lee, J.C. Effect of the number of ECAP pass time on the electrochemical properties of 1050 Al alloys. Mat. Sci. Eng. 2004, 366, 282–291. [Google Scholar] [CrossRef]
  61. Deng, Y.; Bai, J.; Wu, X. Investigation on formation mechanism of T1 precipitate in an Al-Cu-Li alloy. J. Alloys Compd. 2017, 723, 661–666. [Google Scholar] [CrossRef]
  62. Queiroz, F.M.; Magnani, M.; Costa, I.; de Melo, H.G. Investigation of the corrosion behavior of AA2024-T3 in low concentrated chloride media. Corros. Sci. 2008, 50, 2646–2657. [Google Scholar] [CrossRef]
  63. Jáquez-Muñoz, J.M.; Gaona-Tiburcio, C.; Chacón-Nava, J.; Cabral-Miramontes, J.; Nieves-Mendoza, D.; Maldonado-Bandala, E.M.; Delgado, A.D.; Flores-De Los Rios, J.P.; Bocchetta, P.; Almeraya-Calderón, F. Electrochemical Corrosion of Titanium and Titanium Alloys Anodized in H2SO4 and H3PO4 Solutions. Coatings 2022, 12. [Google Scholar] [CrossRef]
  64. Xia, D.H.; Song, S.Z.; Behnamian, Y. Detection of corrosion degradation using electrochemical noise (EN): Review of signal processing methods for identifying corrosion forms. Corros. Eng. Sci. Technol. 2016, 51, 527–544. [Google Scholar] [CrossRef]
  65. Baltazar-Zamora, M.A.; Maldonado-Bandala, E.; Loya Tello, M.; Santiago-Hurtado, G.; Olguín Coca, F.J.; Ortiz-Cedano, A.; Barrios D, C.P.; Núñez J., R.; Zambrano R., P.; Gaona-Tiburcio, C.; et al. Efficiency of Galvanized Steel Embedded in Concrete Previously Contaminated with 2, 3 and 4% of NaCl. Int. J. Electrochem. Sci. 2012, 7, 2997–3007. [Google Scholar]
  66. Buchheit, R.G.; Grant, R.P.; Hlava, P.F.; Mckenzie, B. Local dissolution phenomena associated with s phase (Al2CuMg) particles in aluminum alloy 2024-T3. J. Electrochemical. Soc. 1997, 144, 2621–2628. [Google Scholar] [CrossRef]
  67. Buchheit, R.; Boger, R.; Carroll, M.; Leard, R.; Paglia, C.; Searles, J. The electrochemistry of intermetallic particles and localized corrosion in Al alloys. JOM 2001, 53, 29–33. [Google Scholar] [CrossRef]
  68. Blanc, C.; Lavelle, B.; Mankowski, G. The role of precipitates enriched with copper on the susceptibility to pitting corrosion of the 2024 aluminum alloy. Corros. Sci. 1997, 39, 495–510. [Google Scholar] [CrossRef]
  69. Blanc, C.; Gastaud, S.; Mankowski, G. Mechanistic studies of the corrosion of 2024 aluminum alloy in nitrate solutions. J. Electrochem. Soc. 2003, 150, B396. [Google Scholar] [CrossRef]
  70. Campestrini, P.; Terryn, H.; Hovestad, A.; de Wit, J.H.W. Formation of a cerium-based conversion coating on AA2024: Relationship with the microstructure. Surf. Coat. Technol. 2004, 176, 365–381. [Google Scholar] [CrossRef]
  71. Zhu, D.; van Ooij, W.J. Corrosion protection of AA 2024-T3 by bis-[3-(triethoxysilyl) propyl] tetrasulfide in sodium chloride solution. Part 2: Mechanism for corrosion protection. Corros. Sci. 2003, 45, 2177–2197. [Google Scholar] [CrossRef]
  72. Sanchez, J.M.; Cottis, R.A.; Botana, F.J. Shot noise and statistical parameters for the estimation of corrosion mechanisms. Corros. Sci. 2005, 47, 3280–3299. [Google Scholar] [CrossRef]
  73. Botana, P.J.; Bárcena, M.M.; Villero, Á.A. Ruido Electroquímico: Métodos de Análisis; Septem Ediciones: Cadiz, Spain, 2002; pp. 50–70. [Google Scholar]
  74. Mansfeld, F.; Sun, Z.; Hsu, C.H.; Nagiub, A. Concerning trend removal in electrochemical noise measurements. Corros. Sci. 2001, 43, 341–352. [Google Scholar] [CrossRef]
  75. Bertocci, U.; Huet, F.; Nogueria, R.P.; Rousseau, P. Drift removal procedures in the analysis of electrochemical noise. Corrosion 2022, 58, 337–347. [Google Scholar] [CrossRef]
  76. Gusmano, G.; Montespereli, G.; Pacetti, S.; Petitti, A.; D’Amico, A. Electrochemical noise resistance as a tool for corrosion rate prediction. Corrosion 1997, 53, 860. [Google Scholar] [CrossRef]
  77. Legat, A.; Dolecek, V. Corrosion monitoring system based on measurement and analysis of electrochemical noise. Corrosion 1995, 51, 295–300. [Google Scholar] [CrossRef]
  78. Dawson, D.L. Electrochemical noise measurement: The definitive in-situ technique for corrosion applications? In Electrochemical Noise Measurement for Corrosion Applications STP 1277; Kearns, J.R., Scully, J.R., Roberge, P.R., Reirchert, D.L., Dawson, L., Eds.; ASTM International: West Conshohocken, PA, USA, 1996; pp. 3–39. [Google Scholar]
  79. Cottis, R.; Turgoose, S.; Mendoza, J. The Effects of Solutions Resistance on Electrochemical Noise Resistance Measurements: A Theorical Analysis. Electrochemical Noise Measurements for Corrosion Applications. STP 1277; Kearns, J.R., Scully, J.R., Roberge, P.R., Reirchert, D.L., Dawson, L., Eds.; ASTM International: Russell, OH, USA, 1996; pp. 93–100. [Google Scholar]
  80. Cottis, R.A.; Turgoose, S.; Neuman, R. Corrosion Testing Made Easy: Impedance and Noise Analysis; Syrett, B.C., Ed.; NACE International: Houston, TX, USA, 1999. [Google Scholar]
  81. Stern, M.; Geary, A.L. Electrochemical polarization. I. A theoretical analysis of the shape of the polarization curves. J. Electrochem. Soc. 1957, 104, 56–63. [Google Scholar] [CrossRef]
  82. Jáquez-Muñoz, J.M.; Gaona-Tiburcio, C.; Cabral-Miramontes, J.; Nieves-Mendoza, D.; Maldonado-Bandala, E.; Olguín-Coca, J.; López-Léon, L.D.; Flores-De los Rios, J.P.; Almeraya-Calderón, F. Electrochemical Noise Analysis of the Corrosion of Titanium Alloys in NaCl and H2SO4 Solutions. Metals 2021, 11, 105. [Google Scholar] [CrossRef]
  83. Santiago, G.; Baltazar, M.A.; Galván, R.; López, L.; Zapata, F.; Zambrano, P.; Gaona, C.; Almeraya, F. Electrochemical Evalu-ation of Reinforcement Concrete Exposed to Soil Type SP Contaminated with Sulphates. Int. J. Electrochem. Sci. 2016, 11, 4850–4864. [Google Scholar] [CrossRef]
  84. Mansfeld, F.; Sun, Z. Localization index obtained from electrochemical noise analysis. Corrosion 1999, 55, 915–918. [Google Scholar] [CrossRef]
  85. Reid, S.A.; Eden, D.A. Assessment of Corrosion. U.S. Patent 6,264,824 B1, 24 July 2001. [Google Scholar]
  86. Cottis, R. Interpretation of electrochemical noise data. Corrosion 2001, 57, 265–285. [Google Scholar] [CrossRef]
  87. Bertocci, U.; Huet, F. Noise analysis applied to electrochemical systems. Corrosion 1995, 51, 131–144. [Google Scholar] [CrossRef]
  88. Bertucci, U.; Gabrielli, C.; Huet, F.; Keddam, M.; Rousseau, P. Noise resistance applied to corrosion measurements: II. Experimental tests. J. Electroche. Soc. 1997, 144, 37. [Google Scholar] [CrossRef]
  89. Homborg, A.M.; Tinga, T.; Zhang, X.; Van Westing, E.P.M.; Ferrari, G.M.; Wit, J.H.W.; Mol, J.M.W. A critical appraisal of the interpretation of electrochemical noise for corrosion studies. Corrosion 2017, 70, 971–987. [Google Scholar] [CrossRef]
  90. Lee, C.C.; Mansfeld, F. Analysis of electrochemical noise data for a passive system in the frequency domain. Corr. Sci. 1998, 40, 959–962. [Google Scholar] [CrossRef]
  91. Coakley, J.; Vorontsov, V.A.; Littlell, K.C.; Heenan, R.K.; Ohnuma, G.; Jones, N.G.; Dye, D. Nanoprecipitation in a beta-titanium alloy. J. Alloy. Compd. 2015, 623, 146–156. [Google Scholar] [CrossRef] [Green Version]
  92. Froes, F.; Quian, M.; Niinomi, M. Titanium for Consumer Applications. Real World Use of Titanium; Elsevier: Amsterdam, The Netherlands, 2019; pp. 27–65. [Google Scholar]
  93. Hong, J.; Shufa, L.; Wei, Z. Investigation of pitting corrosion and hydrogen evolution of aluminum and AA2024 alloy by simultaneous electrochemical measurements and imaging. Electrochem. Commun. 2021, 132, 107135. [Google Scholar]
  94. Mansfeld, F.; Sun, Z.; Hsu, C.H. Electrochemical noise analysis (ENA) for active and passive systems in chloride media. Electrochim. Acta 2001, 46, 3651–3664. [Google Scholar] [CrossRef]
  95. Chen, G.S.; Gao, M.; Wei, R.P. Microconstituent-Induced Pitting Corrosion in Aluminum Alloy 2024-T3. Corrosion 1996, 52, 8–15. [Google Scholar] [CrossRef]
  96. Diaz, E.F.; Gonzalez-Rodriguez, J.G.; Martinez-Villafañe, A.; Gaona-Tiburcio, C. H2S Corrosion Inhibition of an Ultra High Strength Pipeline by Carboxyethyl-Imidazoline. J. Appl. Electrochem. 2010, 40, 1633–1640. [Google Scholar] [CrossRef]
  97. Montoya-Rangel, M.; de Oca, N.G.M.; Gaona-Tiburcio, C.; Colás, R.; Cabral-Miramontes, J.; Nieves-Mendoza, D.; Maldonado-Bandala, E.; Chacón-Nava, J.; Almeraya-Calderón, F. Electrochemical Noise Measurements of Advanced High-Strength Steels in Different Solutions. Metals 2020, 10, 1232. [Google Scholar] [CrossRef]
  98. Ramirez, A.; Gonzalez, J.; Campillo, B.; Gaona, T.; Dominguez, P.; Lezama, L.; Chacón, N.; Neri, F.; Martinez, V. An Electrochemical Study of the Corrosion Behavior of a Dual Phase Steel in 0.5m H2SO4. Int. J. Electrochem. Sci. 2010, 5, 1786–1798. [Google Scholar]
Figure 1. Summary of sequences of temperatures and times for both alloys under different heat treatment conditions.
Metals 13 00429 g001
Figure 2. Microhardness test results of AA2024 and AA2055 alloys under T0, T6, and T8 heat treatment conditions.
Metals 13 00429 g002
Figure 9. Power spectral density (PSD), in current, for aluminum alloys under (a) T0, (b) T6, and (c) T8 heat treatment conditions, exposed to a 3.5 wt. % NaCl solution.
Metals 13 00429 g009
Figure 10. Power spectral density (PSD) in current, for aluminum alloys under (a) T0, (b) T6, and (c) 8 heat treatment conditions, exposed to a 3.5 wt. % HCl solution.
Metals 13 00429 g010
Figure 11. Power spectral density (PSD) in current, for aluminum alloys under (a) T0, (b) T6, and (c) T8 heat treatment conditions, exposed to a 3.5 wt. % H2SO4 solution.
Metals 13 00429 g011
Table 1. The nominal chemical composition of aluminum alloys (w.%).
AlloysElements
CuLiZnAgMgMnZrFeSiAl
20553.2–4.21.0–1.30.30–0.700.20–0.700.20–0.600.10–0.500.05–0.150.1 max0.07 maxBalance
20243.8–4.9-0.25 max-1.2–1.80.30–0.90.050.50 max0.50 maxBalance
Table 2. Grain size for aluminum alloys AA2024 and AA2055 with different heat treatments.
MaterialHeat Treatment
Condition
Grain Size NumberGrain Size
(µm)
AA2024T047.5
T647.55
T8717
AA2055T0819
T659
T859
Table 3. The type of corrosion process depends on the localization index (LI).
Corrosion TypeLI
Localized1.0–0.1
Mixed 0.1−0.01
Uniform0.01−0.001
Table 4. Types of corrosion as a function of skewness and kurtosis values.
Corrosion TypePotentialCurrent
SkewnessKurtosisSkewnessKurtosis
Uniform < ± 1 <3 < ± 1 <3
Pitting<−2>>3 > ± 2 >>3
Transgranular (SCC)420−420
Intergranular (SCC 1)−6.618 to 1141.5 to 3.26.4 to 15.6
Intergranular (SCC 2)–2 to –65 to 453 to 610 to 60
Table 5. Electrochemical noise parameters for aluminum alloys under heat treatment conditions and exposed to 3.5 wt. % NaCl, 1 wt. % HCl, and 1 wt. % H2SO4 solutions.
SolutionsMaterialsHeat Treatment ConditionRn
(ohm·cm2)
Icorr
(mA/cm2)
LICorrosion
Type
Kurtosis (I)Corrosion
Type
Skew
(I)
Corrosion
Type
NaClAA2024T0 5.04 × 10 4 5.16 × 10 4 0.199localized6.4Pitting0.2Uniform
T6 6.02 × 10 4 4.32 × 10 4 0.086mix3.6Pitting0.6Uniform
T8 4.83 × 10 4 5.38 × 10 4 0.206localized3.5Pitting−0.3Uniform
AA2055T0 1.09 × 10 4 2.38 × 10 3 0.167localized3.1Pitting0.2Uniform
T6 5.59 × 10 4 4.64 × 10 4 0.065mix8.1Pitting−0.8Uniform
T8 2.72 × 10 5 9.57 × 10 5 0.013mix8.1Pitting0.9Uniform
HClAA2024T0 4.87 × 10 3 5.34 × 10 3 0.142localized4.9Pitting1Pitting
T6 6.18 × 10 1 4.2 × 10 1 0.026mix4Pitting−0.6Uniform
T8 2.78 × 10 1 9.38 × 10 1 0.108localized7.5Pitting1.5Pitting
AA2055T0 5.47 × 10 2 4.74 × 10 2 0.027mix3.8Pitting−0.3Uniform
T6 1.37 × 10 3 1.89 × 10 2 0.151localized7.3Pitting0.3Uniform
T8 4.16 × 10 3 6.26 × 10 3 0.006uniform2.8Uniform−0.3Uniform
H2SO4AA2024T0 4.06 × 10 2 6.4 × 10 2 0.038mix3.9Pitting−0.3Uniform
T6 2.31 × 10 3 1.12 × 10 2 0.015mix1.9Uniform−0.1Uniform
T8 1.16 × 10 4 2.24 × 10 3 0.033mix38Pitting1.1Pitting
AA2055T0 1.43 × 10 4 1.82 × 10 3 0.006uniform3.6Pitting0.1Uniform
T6 5.81 × 10 4 4.47 × 10 4 0.017mix4.9Pitting−0.3Uniform
T8 2.27 × 10 4 1.14 × 10 3 0.087mix11Pitting0.07Uniform
Table 6. β intervals to indicate the type of corrosion.
Corrosion typeβV (dB (V)/Decade)βI (dB (A)/Decade)
MinimumMaximumMinimumMaximum
Uniform0 −70 −7
Pitting−20−25−7−14
Passive−15−25−11
Table 7. Parameters obtained by PSD for heat treatment condition and exposed to 3.5 wt. % NaCl, 1 wt. % HCl, and 1 wt. % H2SO4 solutions.
SolutionsMaterialsHeat Treatment Condition Ψ 0 dBi βV
(dB(V)/Decade)
βI
(dB(A)/Decade)
Corrosion
Type
NaClAA2024T0−116.2−21.5−13.8Pitting
T6−125.7−11.7−9.1Pitting
T8−118.7−17.6−13.2Pitting
AA2055T0−130.5−10.2−8.2Pitting
T6−146.7−12.0−8.0Pitting
T8−141.4−11.7−3.5Uniform
HClAA2024T0−130.2−12.7−14.6Pitting
T6−104.8−11.9−12.8Pitting
T8−90.9−12.0−14.1Pitting
AA2055T0−112.5−9.7−12.0Pitting
T6−115.1−11.3−12.6Pitting
T8−118.7−11.8−12.9Pitting
H2SO4AA2024T0−108.9−12.3−12.2Pitting
T6−121.4−11.5−12.2Pitting
T8−119.1−13.8−25.5Pitting
AA2055T0−126.14−9.8−9.6Pitting
T6−146.95−10.0−9.1Pitting
T8−114.9−8.4−15.0Pitting
Disclaimer/Publisher’s Note: The statements, opinions and data contained in all publications are solely those of the individual author(s) and contributor(s) and not of MDPI and/or the editor(s). MDPI and/or the editor(s) disclaim responsibility for any injury to people or property resulting from any ideas, methods, instructions or products referred to in the content.

