Article

Effect of the Synthesis Route on the Microstructure of HfxTi(1−x)NbVZr Refractory High-Entropy Alloys

1
Hydrogen Research Institute, Université du Québec à Trois-Rivières, 3351 des Forges, Trois-Rivières, QC G9A 5H7, Canada
2
CNRS, University Bordeaux, Bordeaux INP, ICMCB, UMR 5026, 33600 Pessac, France
*
Author to whom correspondence should be addressed.
Metals 2023, 13(2), 343; https://doi.org/10.3390/met13020343
Submission received: 7 December 2022 / Revised: 19 January 2023 / Accepted: 5 February 2023 / Published: 8 February 2023
(This article belongs to the Special Issue Deformation Behavior and Mechanical Properties of High Entropy Alloys)

Abstract

:
In the present work, the effects of (i) Ti replacement by Hf and (ii) the synthesis method on microstructure and crystal structure evolution in the high-entropy alloy HfxTi(1−x)NbVZr are reported. The results of scanning electron microscopy and X-ray diffraction analysis of alloys prepared by both arc-melting and induction-melting are compared with theoretical thermodynamic calculations using the CALPHAD approach. The non-equilibrium thermodynamic calculations agree well with the experimental observations for the arc-melted alloys: a mixture of body-centered cubic (BCC) and cubic C15 Laves phases occurs for low-Ti-concentration alloys and a single BCC phase is obtained for high-Ti alloys. The agreement is not as good when using the induction-melting method: equilibrium solidification calculations predict that the most stable state is a phase mixture of BCC, hexagonal close-packed, and a cubic C15 Laves phase, while experimentally only one BCC and one hexagonal C14 Laves phase were found. The estimation of the exact cooling rate and the lack of a thermodynamic database can explain the difference. In addition, for both methods, the thermodynamic calculation confirms that for a high Ti concentration, the BCC phase is stable, whereas phase separation is enhanced with a higher Hf concentration.

1. Introduction

High-entropy alloys (HEAs) are a relatively new type of alloy as described by Cantor et al. [1] and Yeh et al. [2]. An HEA contains a minimum of four principal elements where each element has a concentration of 5 to 35 at.%. This results in a high-entropy mixture (1.61R compared to less than 0.69R for conventional alloys, where R is the gas constant) [1,2]. In HEAs, increasing the number of principal elements increases the configurational entropy of a mixture of a random solid solution. Due to the high-entropy effect, single-phase disordered solid solutions are often formed rather than multiphase structures (with intermetallic compounds) [3,4,5].
HEAs often solidify in body-centered cubic (BCC) [6], face-centered cubic (FCC) [7], or hexagonal close-packed (HCP) [8] structures. Nevertheless, Laves phases, which are very common intermetallic phases having an AB2 stoichiometry, can also sometimes be observed (mainly hexagonal MgZn2 (C14), cubic MgCu2 (C15) and more rarely hexagonal MgNi2 (C36)) [9,10,11].
In order to synthesize these HEAs, different methods can be used (e.g., mainly melting and powder metallurgy) [12,13,14], which may result in different microstructures and properties [15,16,17,18]. For example, Sleiman et al. [18] synthesized, by arc-melting and mechanical alloying, a multicomponent alloy of composition Ti0.3V0.3Mn0.2Fe0.1Ni0.1. The arc-melted alloy had a multiphase structure, whereas the one synthesized by mechanical alloying resulted in a single BCC phase. Montero et al. [19] reported the synthesis optimization of a Ti0.325V0.275Zr0.125Nb0.275 HEA. In their work, the authors prepared the alloy by two different methods (i.e., high-temperature arc-melting and ball-milling under argon). In both cases, a BCC structure having different lattice parameters was reported. Additionally, different microstructures can be obtained by changing the composition, as reported in the study by Fazakas et al. [15]. In their work, the authors synthesized by induction-melting two equiatomic multicomponent alloys having the compositions Ti20Zr20Hf20Nb20V20 and Ti20Zr20Hf20Nb20Cr20. The results showed that different structures can be obtained depending on the composition: the Ti20Zr20Hf20Nb20V20 alloy has a BCC structure, whereas the Ti20Zr20Hf20Nb20Cr20 contain two phases: a BCC and two intermetallic compounds (Cr2Nb and Cr2Hf). In a recent work, Sleiman et al. [18] investigated the effect of the substitution of Nb by V on the microstructure of the TiHfZrN1−xV1+x alloy for x = 0, 0.1, 0.2, 0.4, 0.6, and 1. They found that upon the substitution of Nb by V, all the alloys were multiphase, and the BCC was progressively replaced by HCP and FCC phases.
HEAs have been studied for their mechanical properties, as well as corrosion and oxidation resistance. Recently, HEAs have also been considered for hydrogen storage [20,21]. In HEAs, the random distribution of elements provides a large diversity of local environments for hydrogen. Additionally, among the HEA compositions reported in the literature, the BCC alloys based on refractory elements are interesting since these individual metals can absorb large hydrogen quantities and form hydride phases with a maximum content of H/M ≈ 2, where H is the amount of hydrogen per formula unit and M is the number of metallic atoms per formula unit. For example, the TiZrNbHfTa alloy [22] crystallizes in a BCC structure and its hydrogen capacity is about 1.65 wt.%. However, the highest hydrogen uptake has been obtained for TiZrHfNbV. This equimolar alloy can absorb up to 2.7 wt.% of hydrogen (i.e., 2.5 H/M), which is larger than a conventional transition metal hydride (H/M = 2.0) [23]. The large storage capacity is attributed to the lattice strain in the alloy, favoring hydrogen absorption at both tetrahedral and octahedral interstitial sites. This study triggered the research in this field, and many BCC HEAs have been reported (e.g., Ti0.325V0.325Zr0.125Nb0.275 [19], TiHfZrNb1−xV1+x alloy for x = 0, 0.1, 0.2, 0.4, 0.6, and 1 [18], TiVNb)100−xCrx (with x = 15, 25 and 35 at.% [17], among others).
To lighten the alloy and thus increase the wt.% of H uptake, some of Hf can be replaced by Ti. Therefore, the composition HfxNbTi(1−x)VZr (x = 0, 0.25, 0.5, 0.75 and 1) was investigated. Two different methods were used to study the potential microstructure difference: (i) arc-melting (rather fast cooling rate) and (ii) induction-melting (slower cooling rate). The microstructure was investigated by scanning electron microscopy (SEM) and X-ray diffraction (XRD). The experimental results were compared to thermodynamic calculations using the CALPHAD method.

2. Materials and Methods

The Hf-Nb-Ti-V-Zr refractory alloys with composition HfxNbTi(1−x)VZr (x = 0 to 1, with a compositional step of 0.25) were prepared by the arc-melting and induction-melting, respectively, of nominal mixtures of the constitutive elements. Melting was performed under an argon atmosphere in order to avoid any oxidation of the material. All the raw elements were purchased from Alfa Aesar® (Tewksbury, MA, USA) and had the following purities: Ti (99.9%), Hf (99.9%), V (99.7%), Zr (99.5%), and Nb (99.9%). Raw elements were weighed in the appropriate proportion for each sample and melted together. The arc-melted samples were turned over five times, and the induction-melted two times to achieve homogeneity. Some of the as-cast samples were sealed into quartz tubes under vacuum and equilibrated by annealing at 600 °C for 1 month. The crystal structure was identified by X-ray diffractometry using Cu Kα radiation (Bruker D8 Focus X-ray or Brucker D8.1 diffractometer, Brucker, Madison, WI, USA). For the X-ray diffraction, the samples were reduced into powder using a hardened stainless-steel mortar and pestle. The crystallographic parameters (lattice parameters, crystallite size, and strain) were evaluated by Rietveld refinement of the X-ray diffraction patterns using Topas software (Brucker, Madeson, WI, USA) [24]. Scanning electron microscopy (SEM), (TESCAN, Brno, Czech Republic) and energy dispersive X-ray spectroscopy (EDS), (TESCAN, Brno, Czech Republic) were performed using a Tescan Vega3-SB SEM to distinguish the different phases. For the EDS measurements, an average of over five measurements was taken in each microstructure contrast.
Equilibrium phase diagrams for the studied alloys were calculated based on the CALPHAD method, using ThermoCalc software (Thermo-Calc Software AB, Solna, SWEDEN) and the TCHEA4 thermodynamic database developed by ThermoCalc [4]. A Scheil–Gulliver non-equilibrium solidification model [25,26] was employed to predict phase formation during solidification. The major assumptions of this model are local thermodynamic equilibrium at the liquid–solid interface, infinite diffusion in liquid, and no back diffusion in solid.

3. Results and Discussion

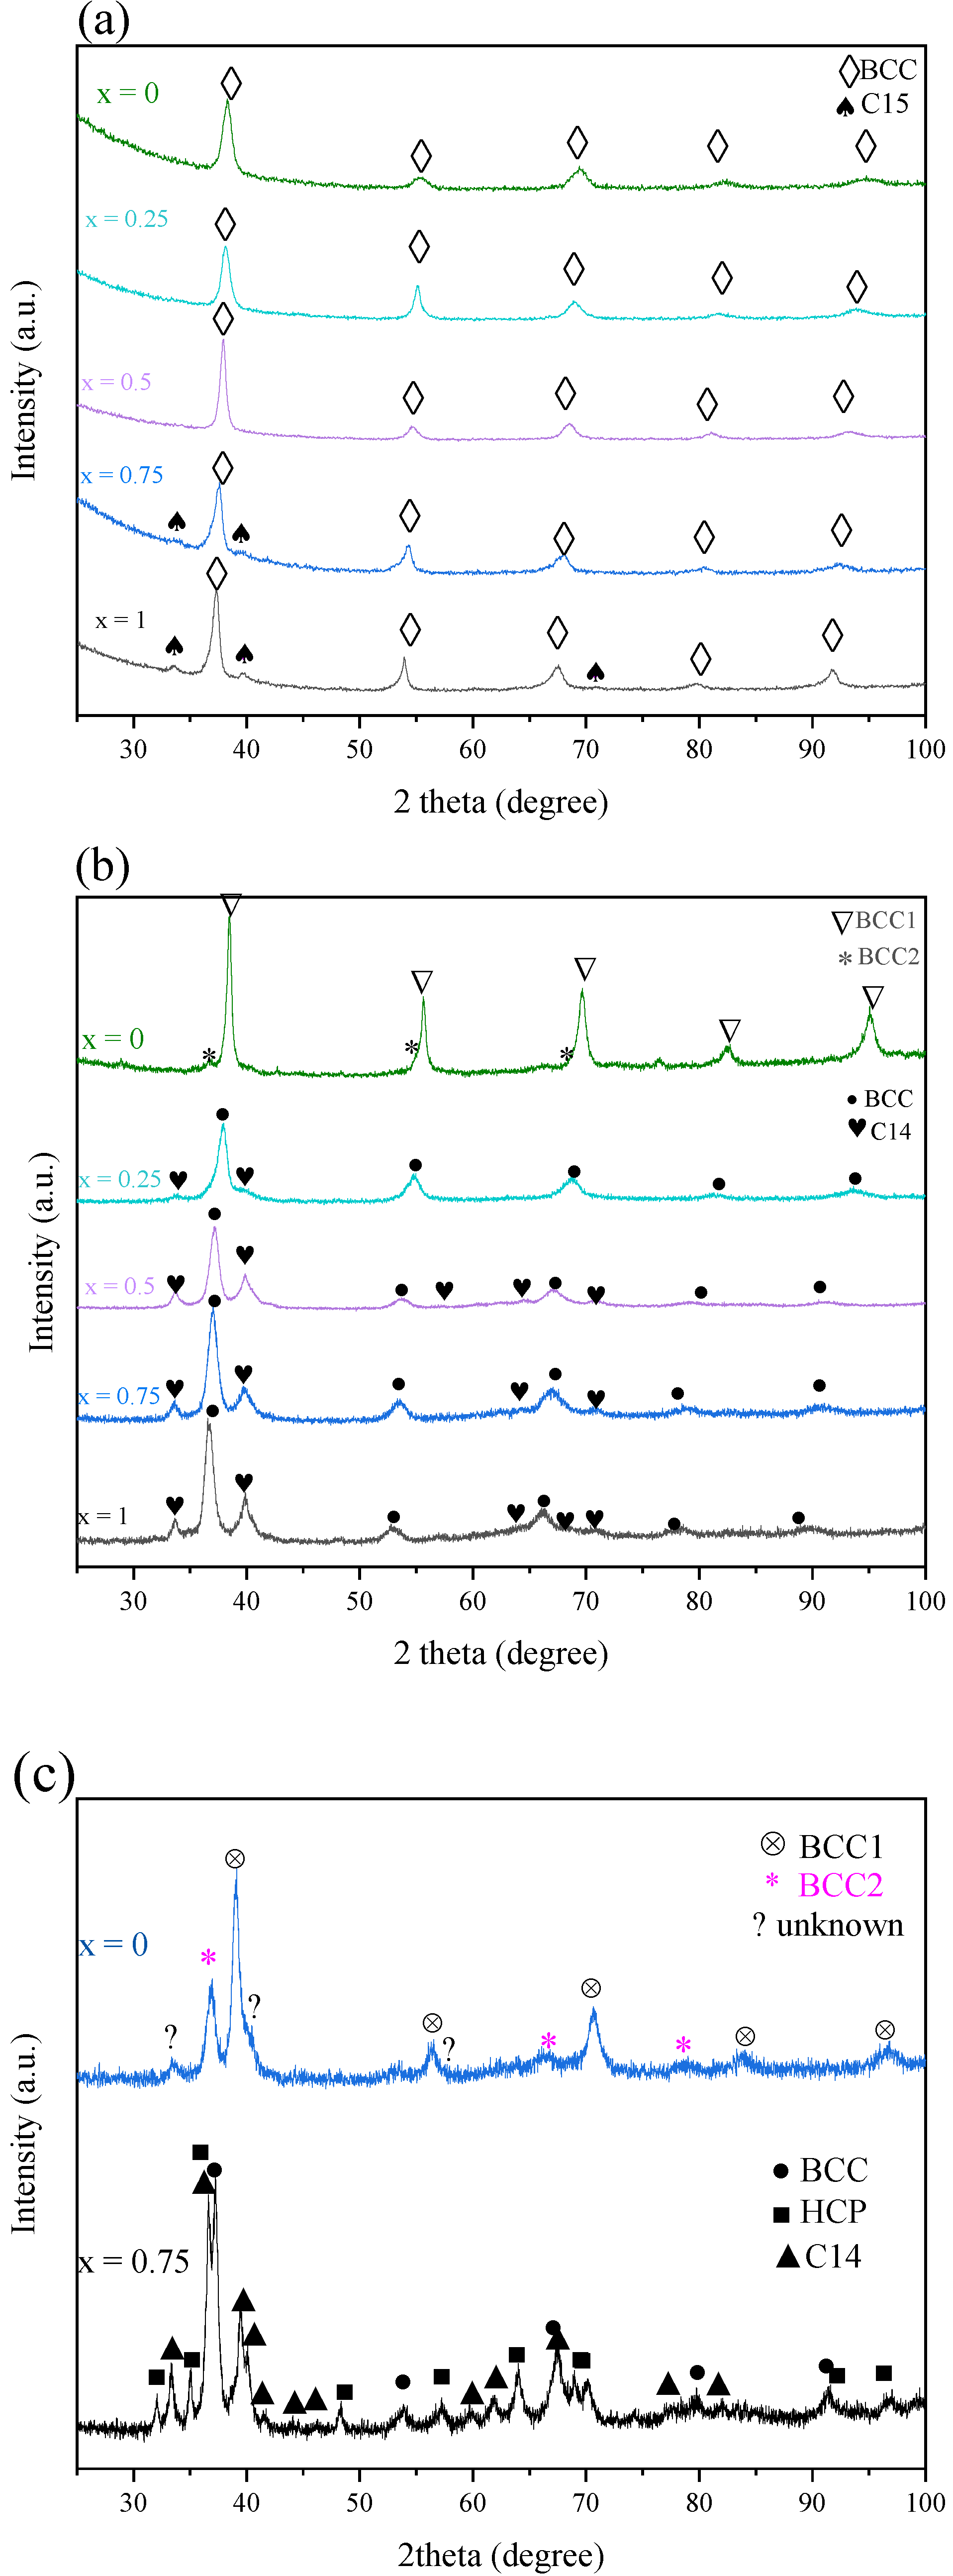
3.1. Crystal Structure
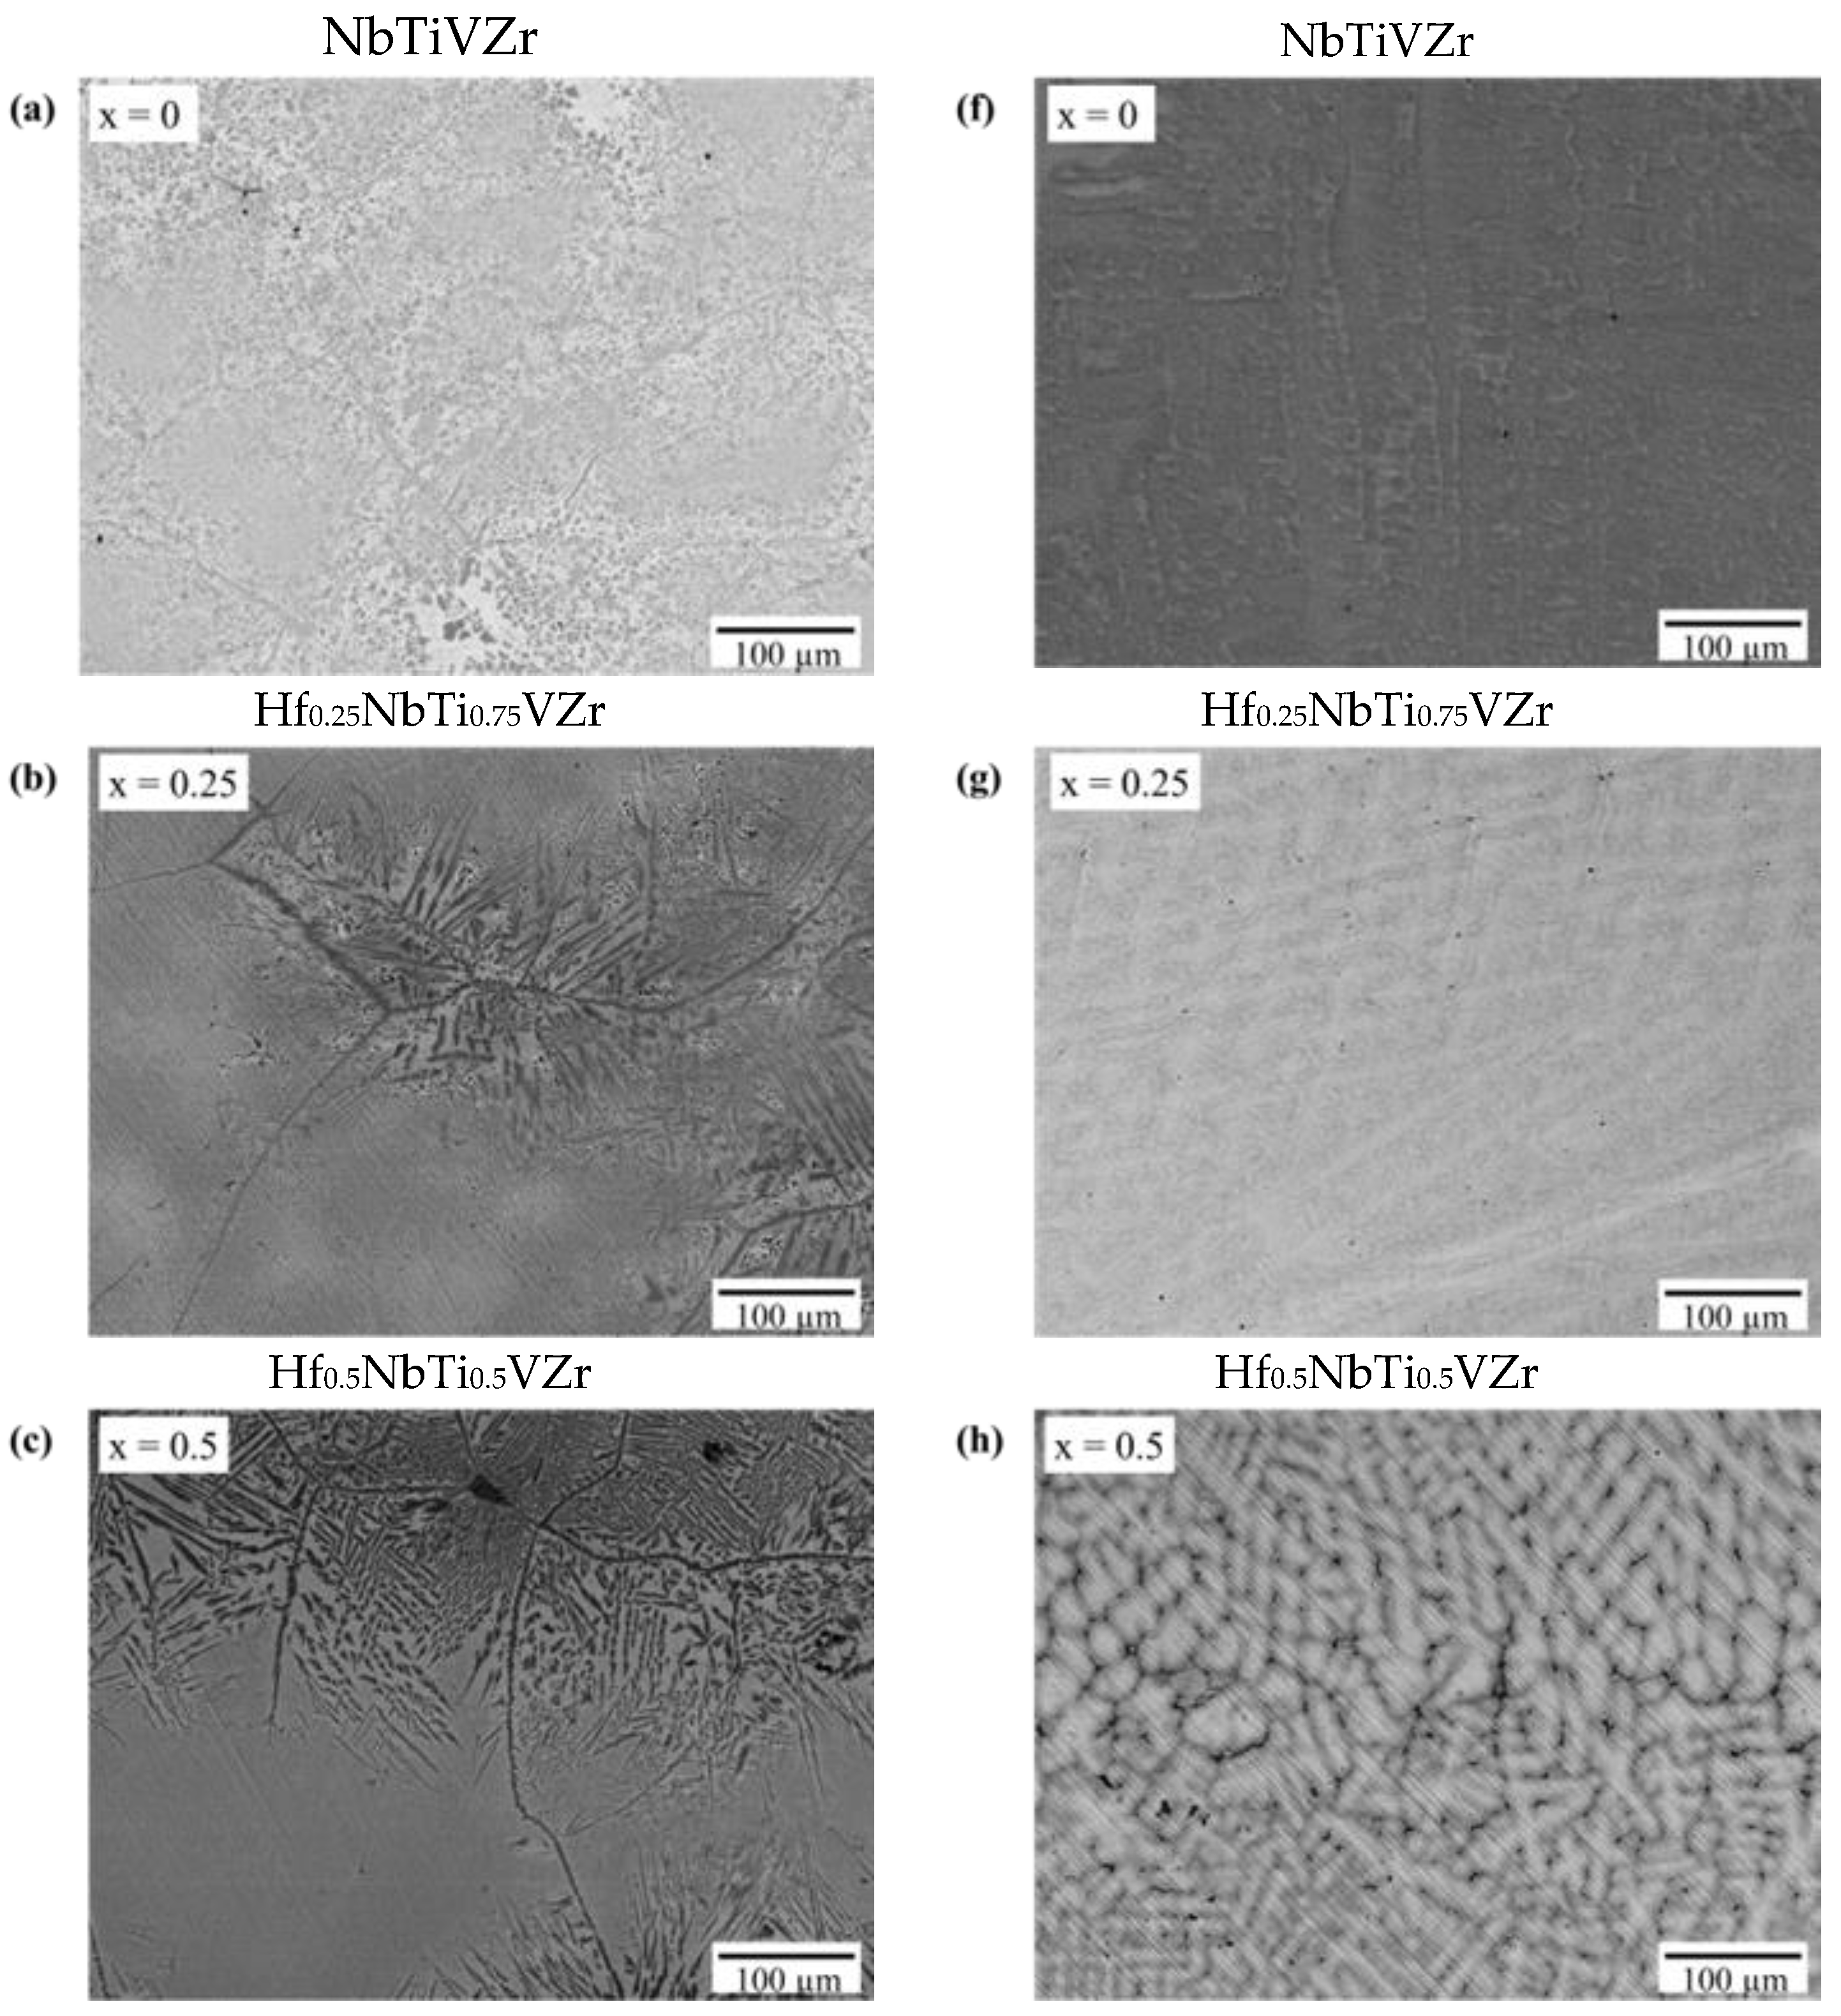
X-ray diffraction patterns from the HfxNbTi(1−x)VZr alloys are shown in Figure 1, and the identified phases and their lattice parameters are given in Table 1. The studied alloys all crystallize in a body-centered cubic (BCC) structure under the three conditions investigated, i.e., rapidly cooled during arc-melting, slowly cooled during induction-melting and equilibrated during annealing at 600 °C for one month. The absence of superlattice peaks indicates a disordered BCC (A2) phase.
The quaternary NbTiVZr (x = 0) alloy exhibits either a single BCC phase after arc-melting or two BCC phases after induction-melting or annealing. Although, Bragg peaks of a third phase that was not identified are visible on the diffraction pattern of the annealed sample. Expectedly, the lattice parameter of the BCC phase increases when Ti is substituted by Hf, from a = 0.3310 nm in NbTiVZr up to 0.3454 nm in HfNbVZr. Furthermore, the substitution of Ti by Hf causes the formation of secondary phases whose nature depends on the thermal history. In the arc-melted alloys (rapid cooling) for x = 0.75 and 1, the secondary phase is identified as an ordered cubic Laves phase (C15), while in the induction-melted alloys (slow cooling), it is a hexagonal Laves phase (C14) for x = 0.25–1. In the annealed condition, three phases are identified for x = 0.75: disordered BCC, ordered C14 Laves, and disordered HCP (A3).

3.2. Microstructure

SEM backscattered images and the EDS analysis of the studied Hf-Nb-Ti-V-Zr alloys are given in Figure 2 and Table 2, respectively. Their microstructures dramatically change with the cooling conditions and the Ti substitution rate. Overall, the microstructure of the quaternary NbTiVZr alloy (x = 0) shows no or little contrast in both cooling conditions. As an increasing amount of Ti is substituted by Hf, the contrast increases, and dark regions, enriched with V according to spot EDS, are observed with different morphologies depending on the cooling conditions.
After induction-melting (slower cooling), the microstructure of NbTiVZr exhibits a gray matrix with regions that appear brighter in the BSE images (Figure 2a). Spot EDS shows that the bright regions are enriched with Zr while the surroundings are enriched in V. Considering the composition of the phases (Table 2) and the atomic radius of the constituent atoms, we can infer that the BCC1 (a = 0.3310 nm) identified from XRD analysis corresponds to the V-rich phase while BCC2 (a = 0.3463 nm) is the Zr-rich phase. The substitution of Ti by Hf causes the formation of the dark regions that consist of chained particles distributed inside large matrix grains and at their boundaries (Figure 2b–e). These dark particles are enriched with V, while the surrounding matrix phase (in gray) has a composition close to the nominal alloy composition. The formation of bright Zr-enriched regions and a small volume fraction of V-enriched particle chains was observed by Senkov et al. [16] in NbTiVZr alloy after annealing at 1200 °C followed by a slow cooling (10 °C/min). In the studied alloys, the V-enriched particles were evidenced only in the Hf-containing alloys with a volume fraction that increased from 11% in Hf0.25NbTi0.75VZr to 55% in HfNbVZr. According to the XRD patterns, the V-enriched dark particles match with the C14 Laves phase, while the bright matrix phase can be identified as the BCC phase. Pacheco et al. [27] also observed the formation of a V-rich C14 Laves phase and a BCC matrix phase in the quinary HfNbTiVZr HEA after annealing at or below 1000 °C. The C14 structure (AB2 type) has two non-equivalent atom positions for the B atom (Wyckoff positions are 2a and 6h). In the case of the Hf-rich alloys (HfNbVZr) synthesized by induction-melting, the refinement of the XRD pattern indicates that for the Wyckoff position, 2a is mainly occupied by Nb atoms (the occupancies are 0.81 for Nb atom and 0.19 for V atom), while V atoms mainly occupy the 6h position (the occupancies are 0.91 for V atom and 0.09 for Nb atom). Consequently, for 5.84 (=0.91 ∗ 6 + 0.19 ∗ 2) atoms of V in the B sites, there are 2.16 (=0.09 ∗ 6 + 0.81 ∗ 2) Nb atoms, which gives a V/Nb ratio of 2.70, near the one obtained from spot EDS, i.e., 2.56. Therefore, this analysis suggests that the A site of the C14 Laves phase is mainly occupied Hf and Zr atoms.
After arc-melting, the microstructure of NbTiVZr (Figure 2f) exhibits a light contrast on the BSE images; however, only one BCC phase is detected by XRD. The present results for NbTiVZr alloy corroborate those by Tong et al. [28] and Nygard et al. [29], reporting the formation of a single-phase BCC microstructure for the same alloy composition. The alloys remain in a single BCC phase up to a Ti substitution rate of 0.50. Then, for higher Hf concentrations up to HfNbVZr (Figure 2h–j), the microstructure of arc-melted alloys consists of dendrites (bright regions) with a composition close to the nominal alloy composition and an inter-dendritic region (dark gray) enriched with V. Given the results from XRD, we can assign the bright dendrites as the BCC phase and the dark inter-dendritic regions as the C15 Laves phase. In summary, arc-melting considerably changes the microstructures of HfxTi(1−x)NbVZr compared to induction-melting. In particular, the C14 Laves phase is replaced by the C15 Laves phase enriched with V.

3.3. Thermodynamic Modeling

In order to interpret the effects of the processing route and the substitution of Ti by Hf on the microstructure of the studied Hf-Nb-Ti-V-Zr alloys, the experimental results are compared with the equilibrium phase diagrams and non-equilibrium solidification paths calculated using the CALPHAD approach. The HfxTi(1−x)NbVZr alloys processed either by arc-melting or induction-melting are all under as-solidified conditions. However, in the case of arc-melting, one can expect a non-equilibrium solidification due to rapid cooling. In contrast, during induction-melting, the situation is closer to equilibrium solidification due to a slower cooling rate, as confirmed by the similarity of the phases formed at equilibrium after annealing at 600 °C for one month, as shown from the XRD analysis.

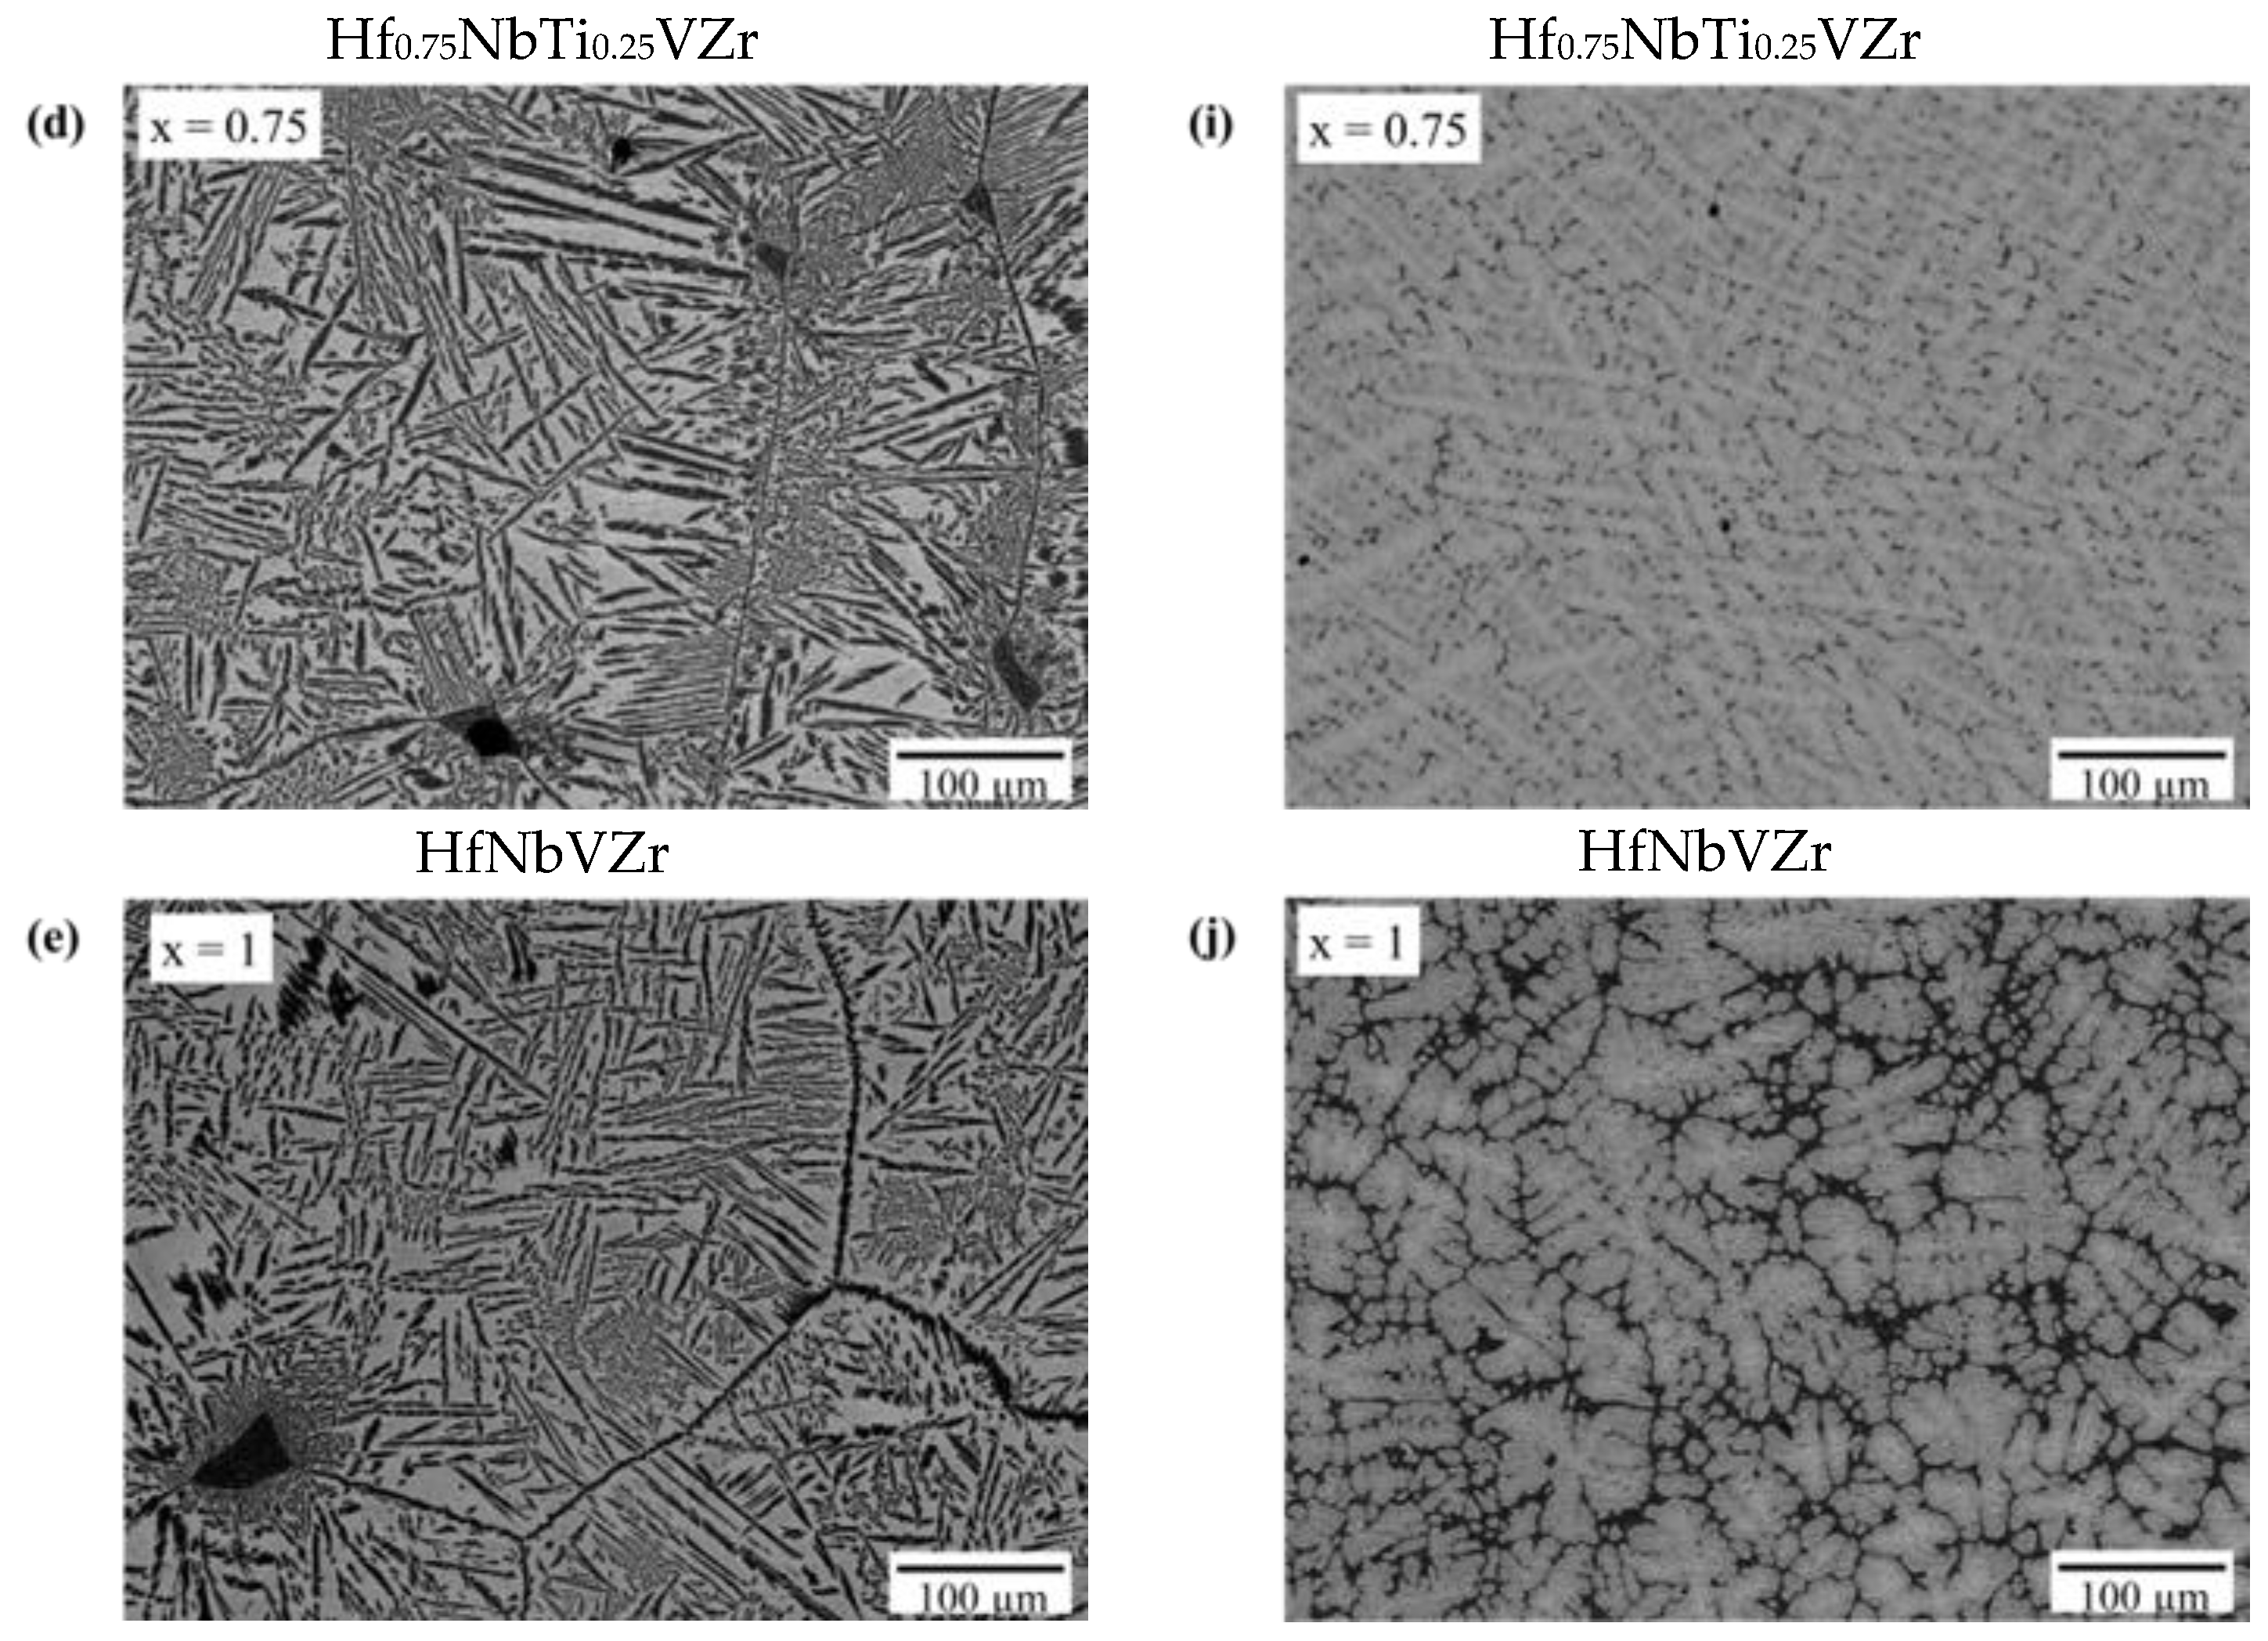
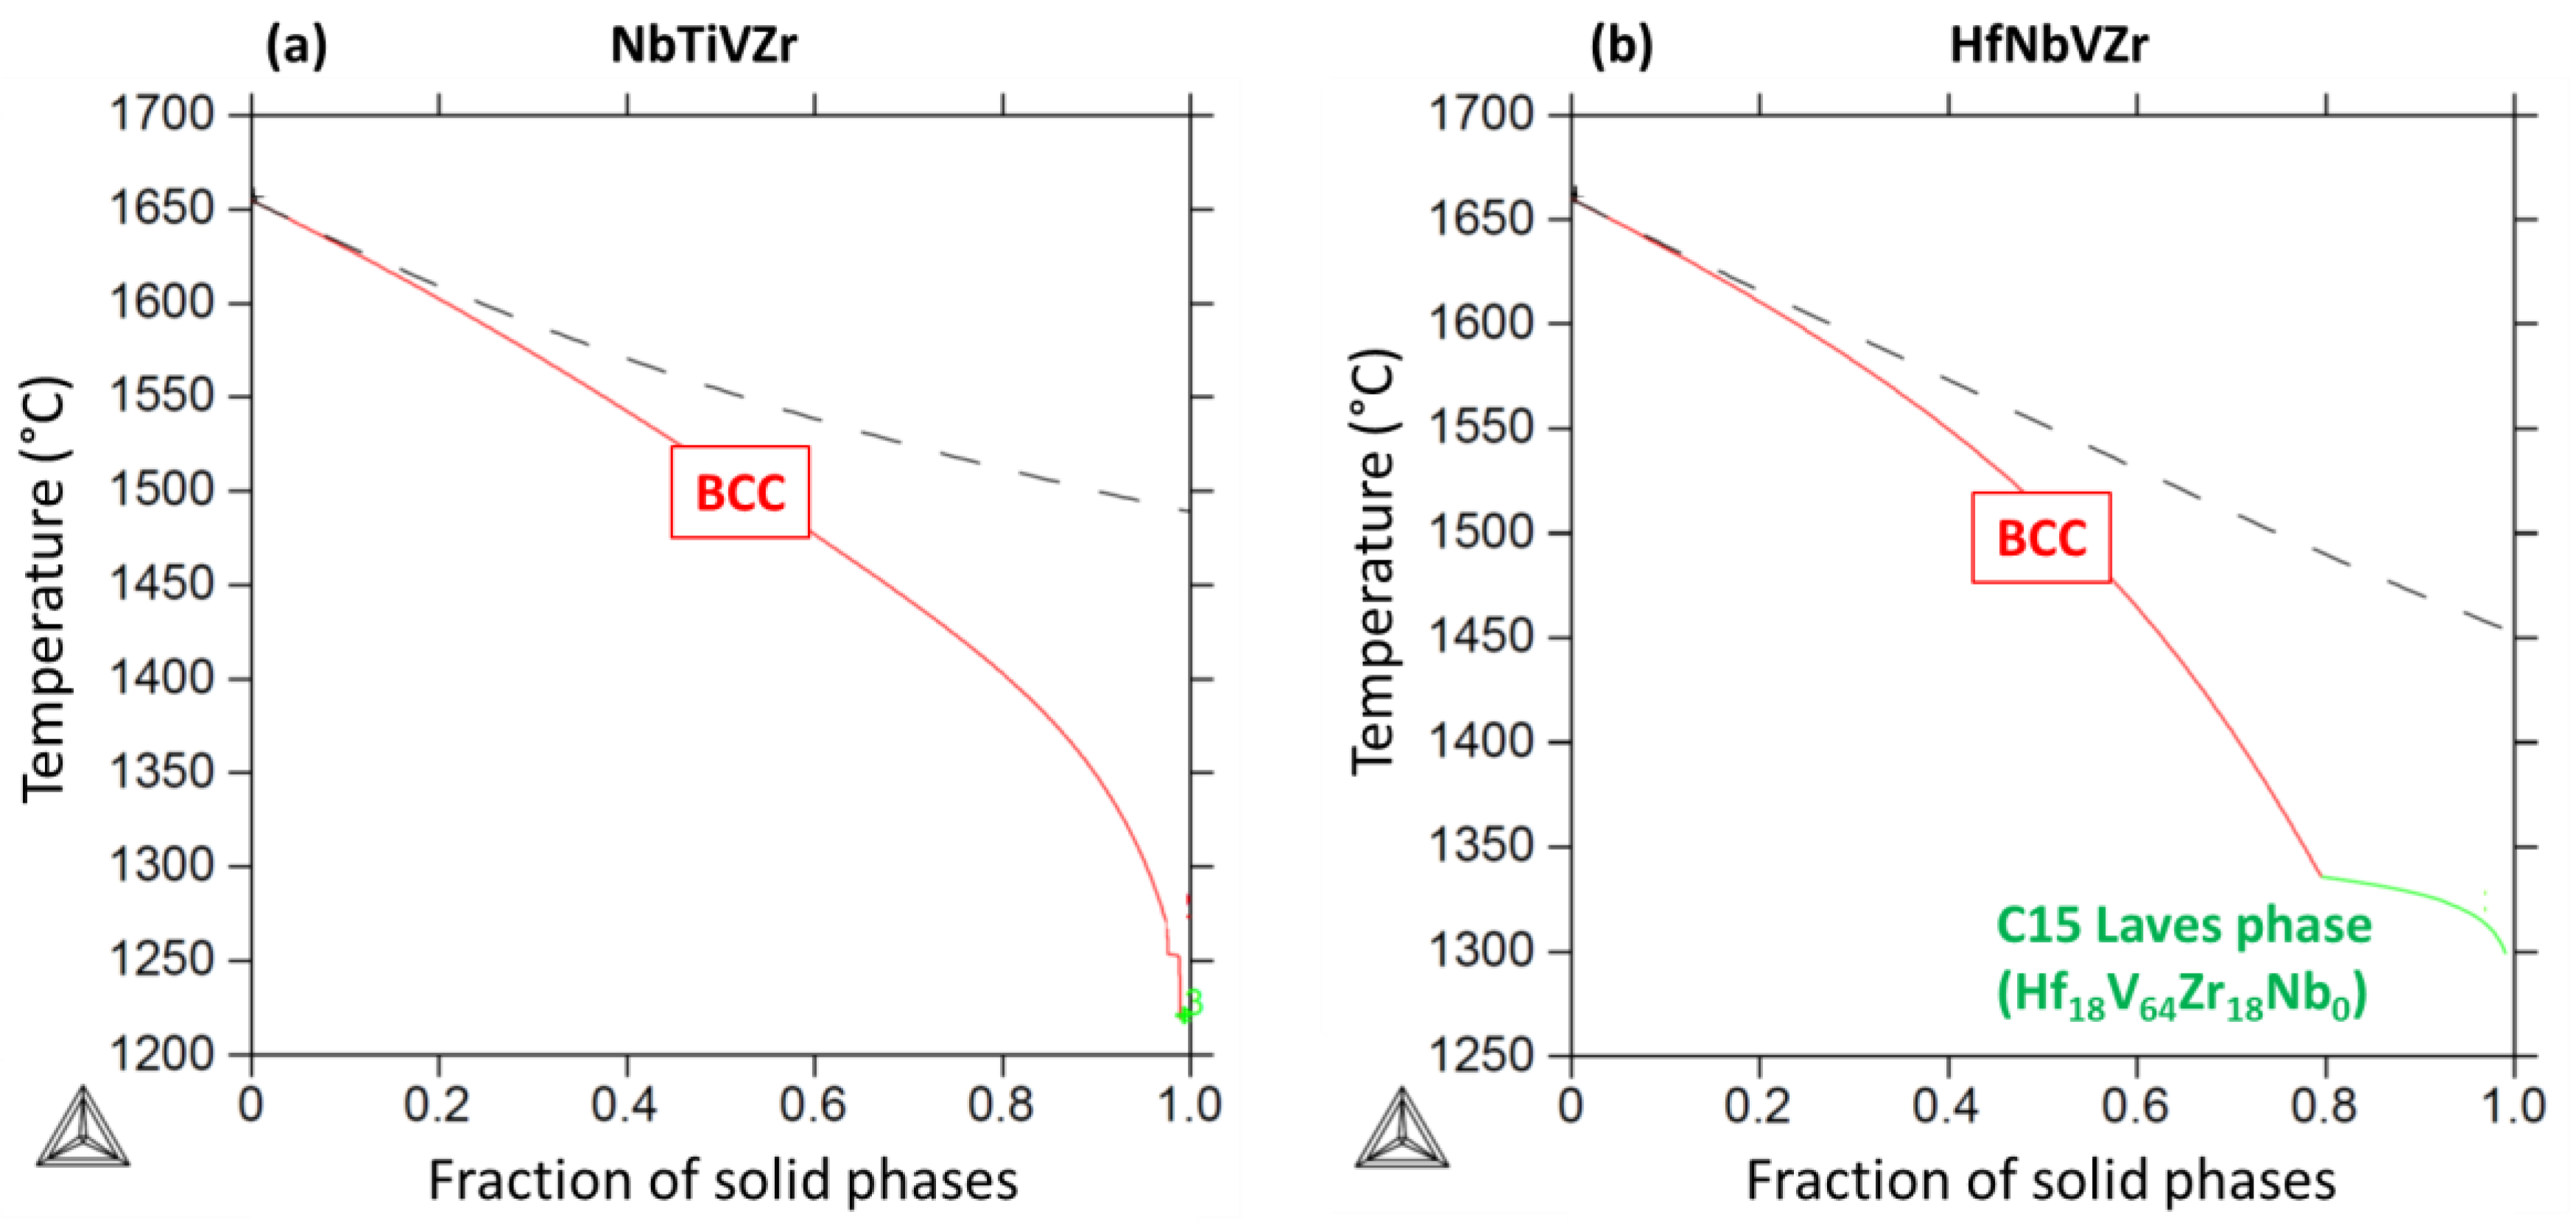
3.3.1. Non-Equilibrium Solidification

Figure 3a,b shows the calculated solid fraction as a temperature function for NbTiVZr and HfNbVZr alloys according to the Scheil–Gulliver model. The simulation indicates that the solidification of NbTiVZr starts at 1656 °C with the formation of the BCC phase and is completed at 1223 °C. While the non-equilibrium solidification of NbTiVZr involves only the BCC phase, an additional ordered C15 Laves phase forms in the HfNbVZr alloy at 1332 °C. For this alloy, the solidification starts at 1660 °C and is completed at 1300 °C. After complete solidification, HfNbVZr consists of 80% BCC (A2) and 20% C15 phases enriched with V. The present predictions agree with the experimental observations of the arc-melted alloys, which have undergone rapid solidification: the formation of a single disordered BCC solid solution for NbTiVZr, whereas HfNbVZr additionally contains a large amount of an ordered C15 Laves phase formed in the BCC inter-dendritic regions. Previous thermodynamic modeling of the non-equilibrium solidification of NbTiVZr and CrNbTiZr showed similar microstructures, with a single-phase disordered BCC structure in NbTiVZr and an additional C15 Laves phase for the Cr-containing alloy [17], as for HfNbVZr.

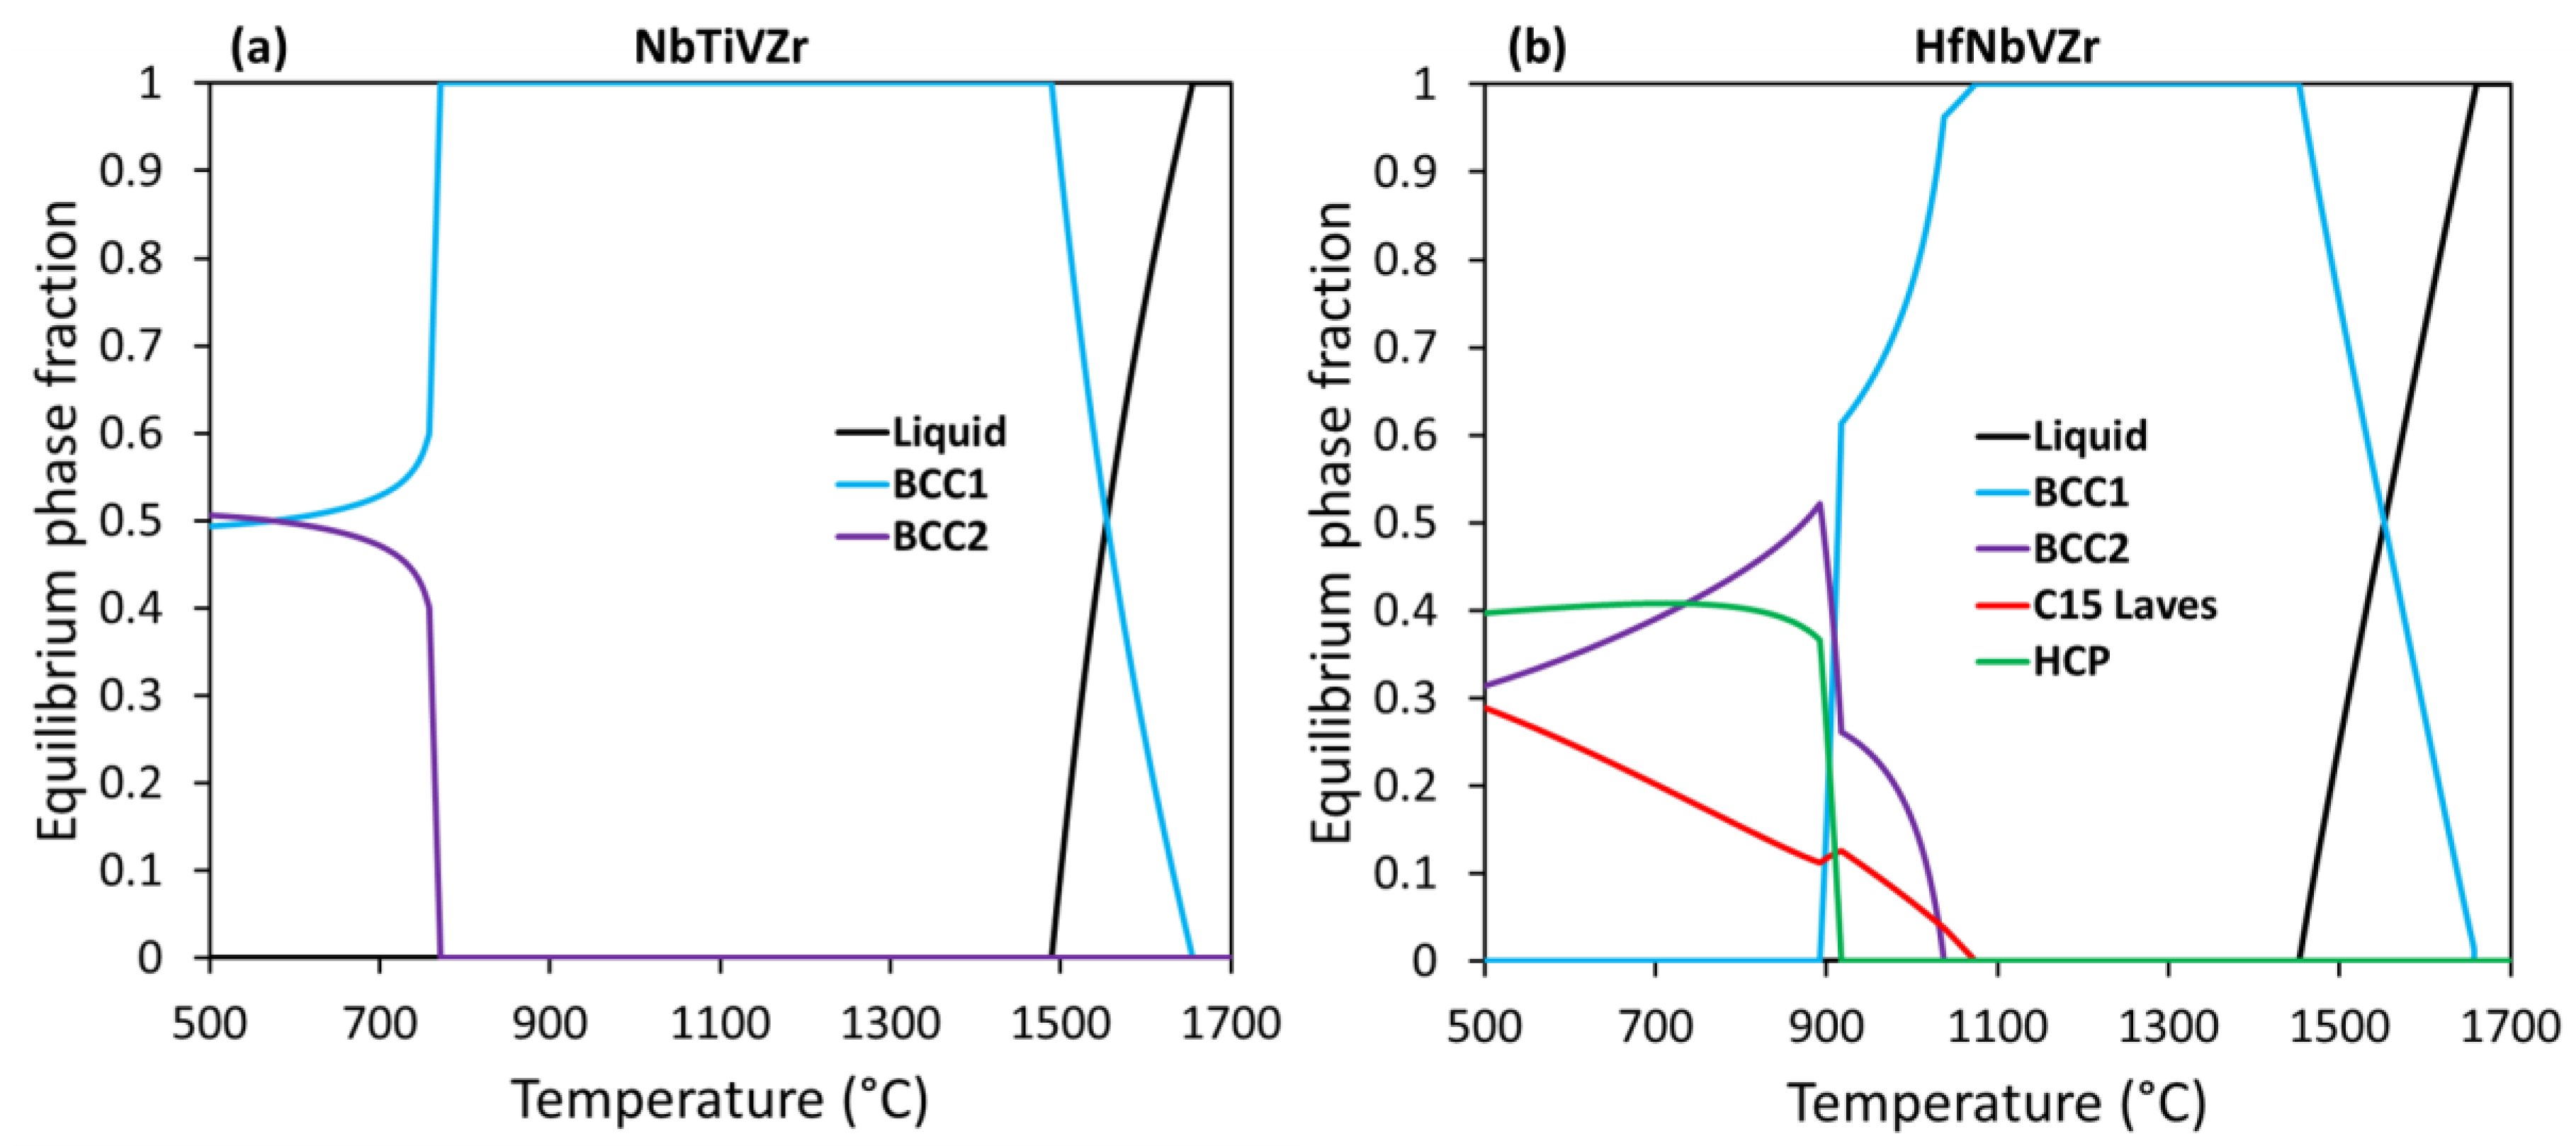
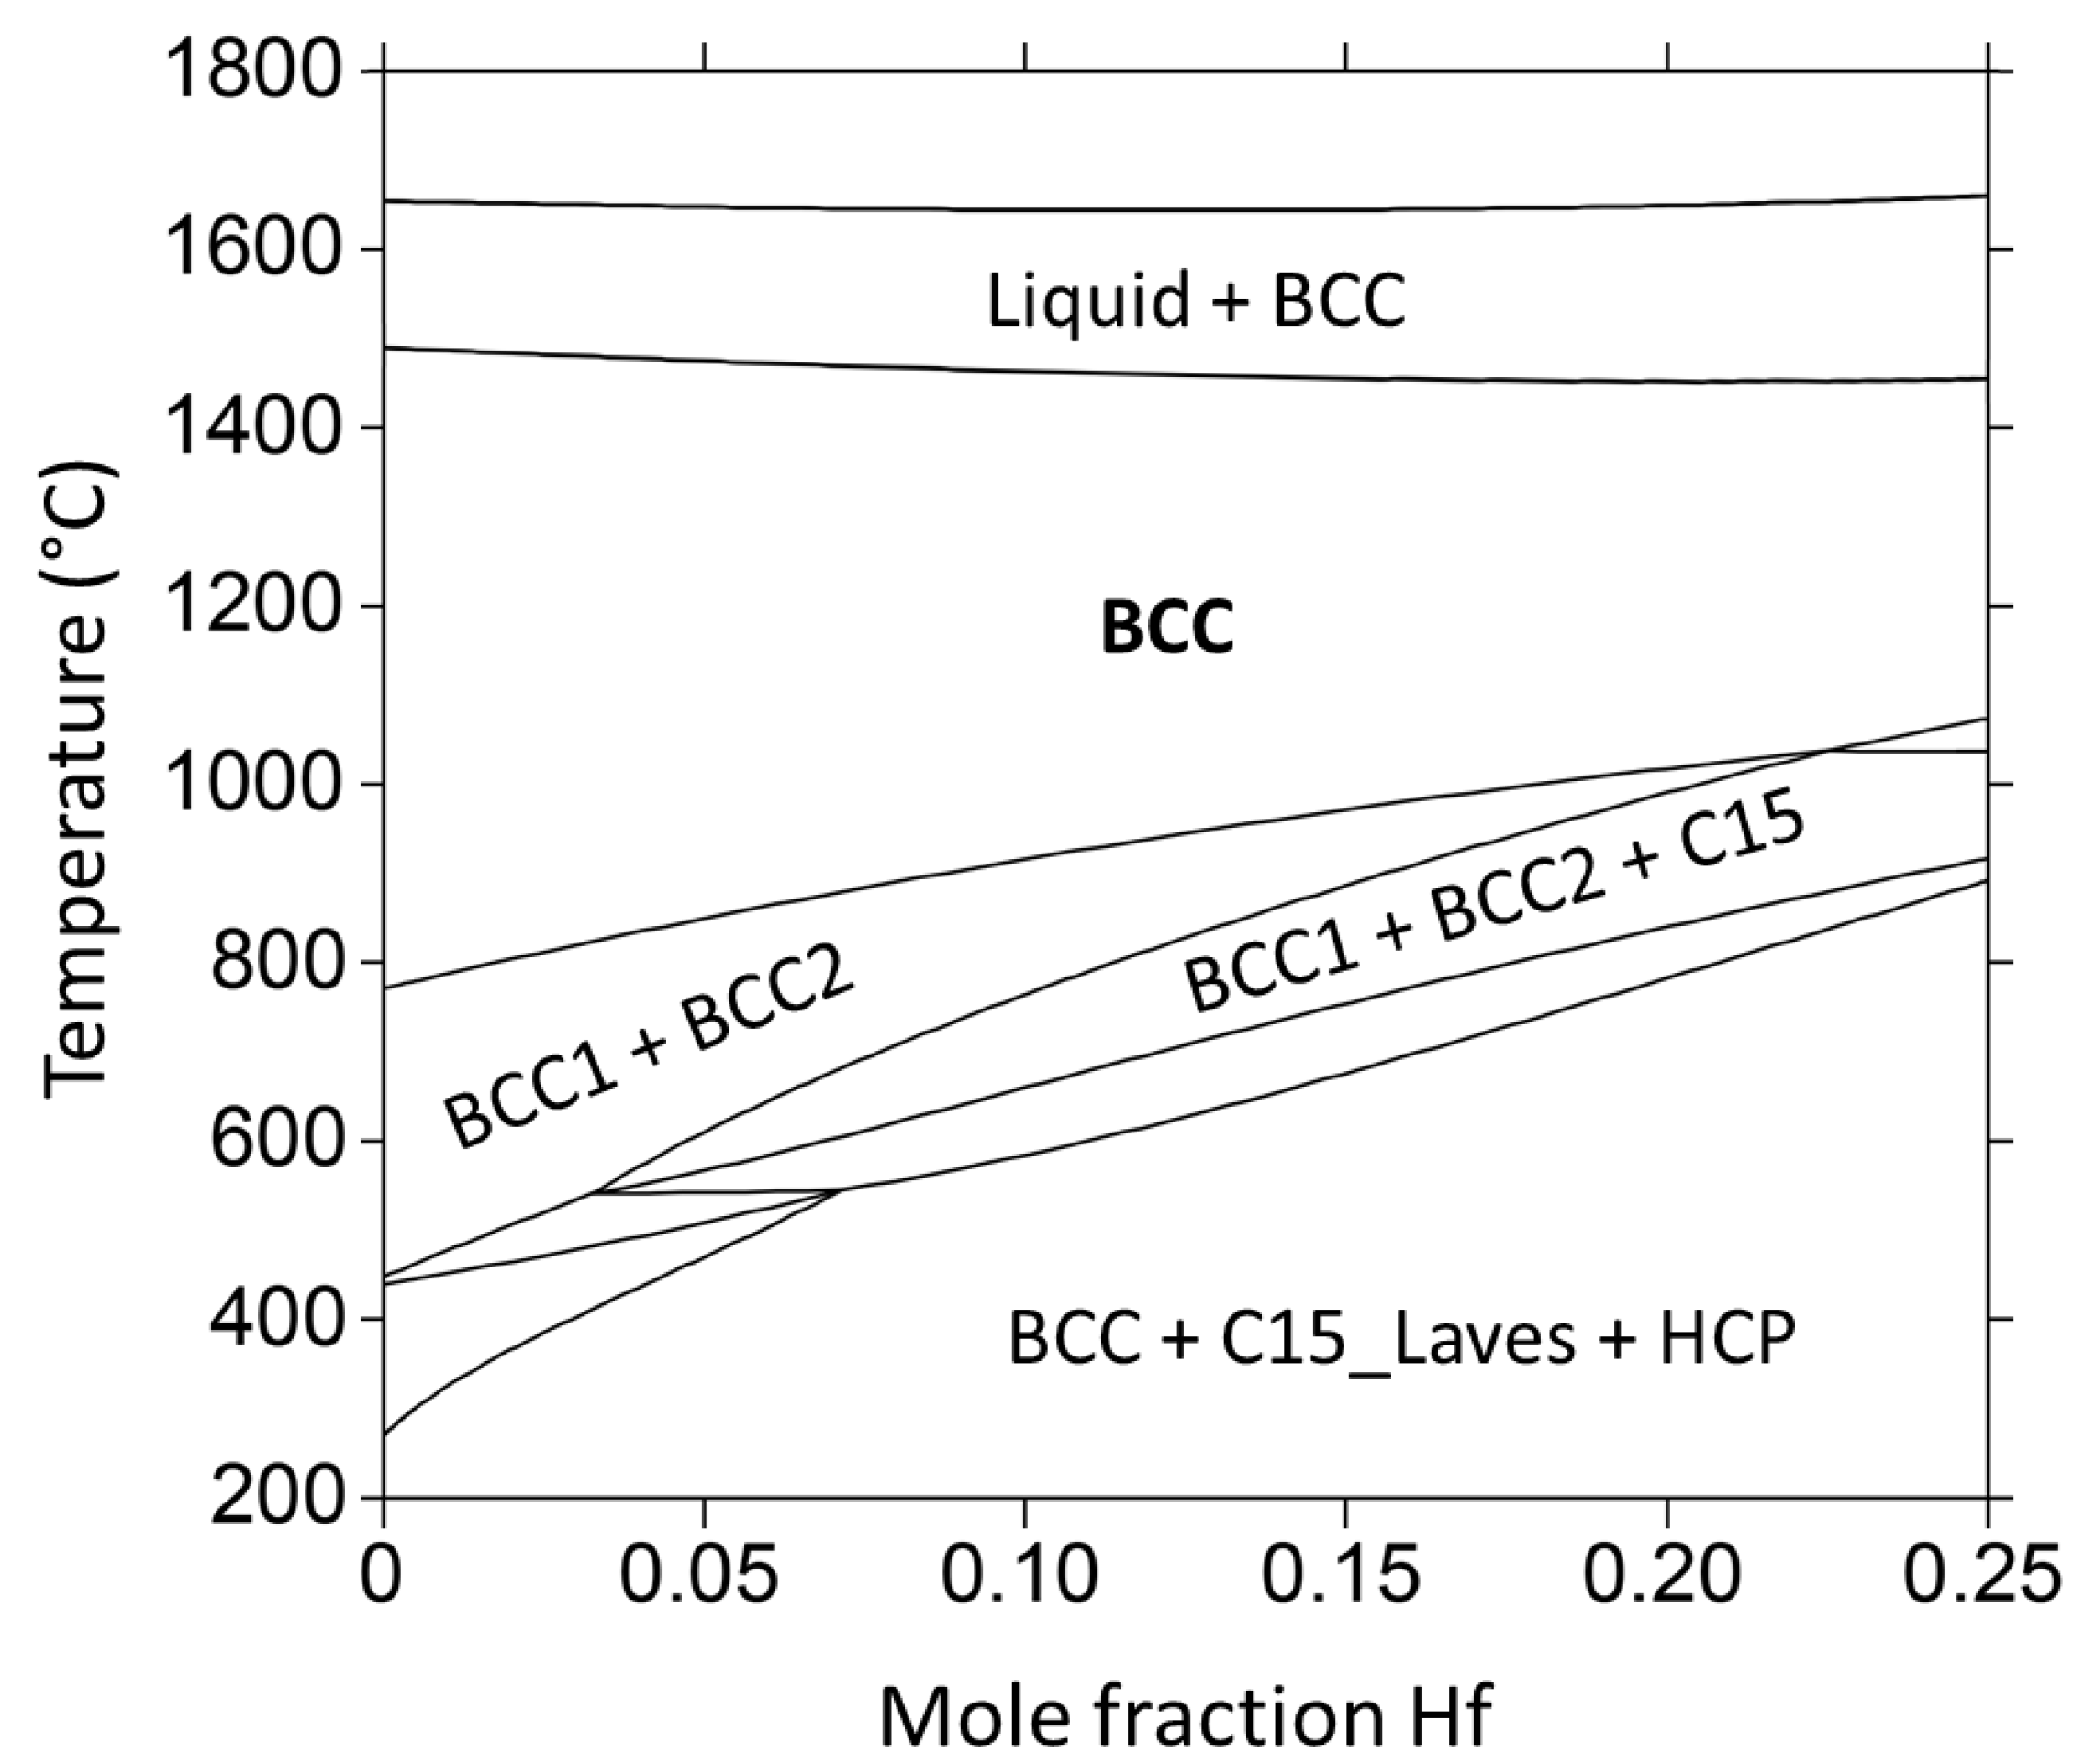
3.3.2. Equilibrium Phase Diagrams

The calculated fractions of equilibrium phases as a function of temperature for the NbTiVZr and HfNbVZr alloys are provided in Figure 4, and the reaction equations and phase transition temperatures are given in Table 3. The liquidus and solidus temperatures of NbTiVZr are 1655 and 1490 °C, respectively. Under equilibrium conditions, the disordered BCC phase’s solidification range (165 °C) is much narrower than in non-equilibrium solidification (433 °C). Upon cooling, the high-temperature BCC phase separates below 771 °C into two BCC phases, (Ti,Zr)-rich and (V,Nb)-rich. At 600 °C, which represents the annealed temperature, the predicted equilibrium consists of 50% (Ti,Zr)-rich BCC (Nb14Ti33V11Zr42) and 50% (Nb,V)-rich BCC (Nb36Ti17V39Zr8). The present thermodynamic modeling using TCHEA4 predicts a similar phase diagram to a previous study [16] conducted with the software Pandat and the PanTi thermodynamic database, even though the volume fractions and transformation temperatures are significantly shifted. The calculated results support the experimental data, which show that the microstructure after induction-melting (slow cooling) or annealing at 600 °C consists of a mixture of two disordered BCC solid solutions, one enriched with Ti and Zr atoms, and the other with Nb and V atoms, resulting from the decomposition of the high-temperature single-phase BCC formed during primary solidification.
A single-phase BCC region and a BCC → BCC1 + BCC2 phase transformation are also predicted for the ternary NbTiZr sub-system, according to Senkov et al. [30]. The comparison between the predictions for the NbTiVZr quaternary system and its NbTiZr ternary sub-component shows that the addition of V results in a slight destabilization of the disordered BCC solid solution, which spans over a smaller temperature range in the NbTiVZr alloy (Table 3), but without the formation of a new structure.
In HfNbVZr, a single-phase BCC region is predicted above 1080 °C. At lower temperatures, BCC partially transforms to the BCC2 phase, and the formation of HCP and C15 Laves phases occurs upon further cooling. It can be seen that both CALPHAD predictions and the experiment agree when predicting the primary solidification of a BCC phase. However, the HCP phase is not observed on the as-cast microstructure, but rather on the annealed. Additionally, the predicted C15 phase is replaced by a hexagonal C14 Laves phase in the experimental results for the as-cast and Hf-rich annealed samples. The fact that we observe the presence of the C14 phase in the slowly cooled alloy (induction-melting) or after annealing at 600 °C suggests that C14 is the most stable Laves phase, while the C15 observed after rapid cooling (arc-melting) is metastable. Additionally, these discrepancies between the predictions and experiments for the HfNbVZr alloy suggest incomplete thermodynamic descriptions of the Hf-containing sub-ternary systems. Indeed, for the present Hf-Nb-Ti-V-Zr quinary system, only four of the ten sub-ternary systems have been fully assessed in the TCHEA4 database.
The effects of Ti substitution by Hf on the phase equilibria is visualized on the isopleth in Figure 5. It maps the phase fields across the temperature–composition plane connecting NbTiVZr and HfNbVZr. A large single-phase BCC field spans between the two quaternary compositions, which is bounded by the liquid phase at high temperatures and the C15 Laves phase at low temperatures. Hf decreases the stability of the BCC phase and enhances the phase separation, resulting in the formation of the Laves phases. These evolutions of the relative stability of the phases across the NbTiVZr–HfNbVZr isopleth account well for some of the experimental observations for the alloys with the highest Ti concentrations, but the predictions become less reliable for the occurrence of the intermetallic Laves phase in Hf-rich alloys.

4. Conclusions

The effect of two different synthesis methods: (i) arc-melting (for fast cooling) and (ii) induction-melting (for slow cooling) and the effect of Hf replacement by Ti on microstructure evolution and crystal structure of HfxNbTi(1−x)VZr (x = 0, 0.25, 0.5, 0.75 and 1) HEA was studied. These alloys were assessed by thermodynamic calculations using the CALPHAD approach. The conclusions are:
(1)
The dendritic microstructures seen in arc-melting were replaced by an acicular structure upon induction-melting. As expected, changing the synthesis routes allowed the modification of the microstructure.
(2)
In all the synthesized alloys, a BCC phase was present with the cell parameter ranging from 3.311 Å to 3.392 Å. The arc-melted alloys with a low Ti concentration (x ≤ 0.25) exhibited an additional cubic C15 phase (a = 7.376 to 7.460 Å), whereas a hexagonal C14 phase (with a = 5.326 to 5.319 Å and c = 8.619 to 8.561 Å) was detected in the induction-melted alloys (x = 0 to 0.75).
(3)
The effect of Ti substitution by Hf was explained by the equilibrium phase diagram calculations. The calculations confirmed that Ti increased the stability of the BCC phase, whereas Hf enhanced phase separation, resulting in Laves phases formation.
(4)
The Scheil–Gulliver model and the lever rule were applied to simulate the non-equilibrium solidification of the arc-melted alloys (e.g., the fast cooling justifying the non-equilibrium state), and equilibrium solidification for induction-melting (e.g., the slower cooling inducing a close to equilibrium state). For the arc-melted alloys, the thermodynamic calculations successfully predicted the formation of a primary BCC and C15 phases for low Ti concentrations (HfNbVZr) and a single BCC phase in alloys with high Ti concentrations (TiNbVZr). However, there was a discrepancy in predicting the phase formation using the induction-melting method since the calculation predicted the formation of BCC, C15 and HCP phases upon cooling, while experimentally a BCC and hexagonal C14 were present, suggesting the need to improve the database.

Author Contributions

Conceptualization, M.M., S.G. and J.L.B.; methodology, M.M. and S.G.; validation, S.G., J.H. and J.L.B.; formal analysis, M.M., S.G. and J.L.B.; investigation, M.M. and S.G.; writing—original draft preparation, M.M.; writing—review and editing, M.M., S.G., J.H. and J.L.B.; supervision, J.L.B.; project administration, J.H. and J.L.B.; funding acquisition J.L.B. All authors have read and agreed to the published version of the manuscript.

Funding

This research was funded in parts from a NSERC discovery grant.

Data Availability Statement

Data available by contacting the authors.

Acknowledgments

The authors thank the Region Nouvelle Aquitaine for financial support to this work through a PhD grant.

Conflicts of Interest

The authors declare no conflict of interest.

References

  1. Cantor, B.; Chang, I.T.H.; Knight, P.; Vincent, A.J.B. Microstructural development in equiatomic multicomponent alloys. Mater. Sci. Eng. A 2004, 375–377, 213–218. [Google Scholar] [CrossRef]
  2. Yeh, J.W.; Chen, S.K.; Lin, S.J.; Gan, J.Y.; Chin, T.S.; Shun, T.T.; Tsau, C.H.; Chang, S.Y. Nanostructured high-entropy alloys with multiple principal elements: Novel alloy design concepts and outcomes. Adv. Eng. Mater. 2004, 6, 299–303. [Google Scholar] [CrossRef]
  3. Gorsse, S.; Miracle, D.B.; Senkov, O.N. Mapping the world of complex concentrated alloys. Acta Mater. 2017, 135, 177–187. [Google Scholar] [CrossRef]
  4. Gorsse, S.; Couzinié, J.P.; Miracle, D.B. From high-entropy alloys to complex concentrated alloys. Comptes Rendus Phys. 2018, 19, 721–736. [Google Scholar] [CrossRef]
  5. Ye, Y.F.; Wang, Q.; Lu, J.; Liu, C.T.; Yang, Y. High-entropy alloy: Challenges and prospects. Mater. Today 2016, 19, 349–362. [Google Scholar] [CrossRef]
  6. Zlotea, C.; Bouzidi, A.; Montero, J.; Ek, G.; Sahlberg, M. Compositional effects on the hydrogen storage properties in a series of refractory high entropy alloys. Front. Energy Res. 2022, 10, 991447. [Google Scholar] [CrossRef]
  7. Yu, Z.; Yan, Y.; Qiang, J.; Gao, W.; Wang, X.; Liu, X.; Du, W. Microstructure evolution and compressive property variation of AlxCoCrFeNi high entropy alloys produced by directional solidification. Intermetallics 2023, 152, 107749. [Google Scholar] [CrossRef]
  8. Bhattacharjee, P.P.; Sathiaraj, G.D.; Zaid, M.; Gatti, J.R.; Lee, C.; Tsai, C.; Yeh, J. Microstructure and texture evolution during annealing of equiatomic CoCrFeMnNi high-entropy alloy. J. Alloys Compd. 2014, 587, 544–552. [Google Scholar] [CrossRef]
  9. Floriano, R.; Zepon, G.; Edalati, K.; Mohammadi, A. Hydrogen storage properties of new A3B2-type TiZrNbCrFe high-entropy alloy. Int. J. Hydrog. Energy 2021, 46, 23757–23766. [Google Scholar] [CrossRef]
  10. Edalati, P.; Floriano, R.; Mohammadi, A.; Li, Y.; Zepon, G.; Li, H.W.; Edalati, K. Reversible room temperature hydrogen storage in high-entropy alloy TiZrCrMnFeNi. Scr. Mater. 2020, 178, 387–390. [Google Scholar] [CrossRef]
  11. Pickering, E.J.; Jones, N.G. High-entropy alloys: A critical assessment of their founding principles and future prospects. Int. Mater. Rev. 2016, 61, 183–202. [Google Scholar] [CrossRef]
  12. Xiang, S.; Luan, H.; Wu, J.; Yao, K.F.; Li, J.; Liu, X.; Tian, Y.; Mao, W.; Bai, H.; Le, G.; et al. Microstructures and mechanical properties of CrMnFeCoNi high entropy alloys fabricated using laser metal deposition technique. J. Alloys Compd. 2019, 773, 387–392. [Google Scholar] [CrossRef]
  13. Senkov, O.N.; Miracle, D.B.; Chaput, K.J.; Couzinie, J.P. Development and exploration of refractory high entropy alloys—A review. J. Mater. Res. 2018, 33, 3092–3128. [Google Scholar] [CrossRef]
  14. Xing, Y.; Li, C.J.; Mu, Y.K.; Jia, Y.D.; Song, K.K.; Tan, J.; Wang, G.; Zhang, Z.Q.; Yi, J.H.; Eckert, J. Strengthening and deformation mechanism of high-strength CrMnFeCoNi high entropy alloy prepared by powder metallurgy. J. Mater. Sci. Technol. 2023, 132, 119–131. [Google Scholar] [CrossRef]
  15. Fazakas, E.; Zadorozhnyy, V.; Varga, L.K.; Inoue, A.; Louzguine-Luzgin, D.V.; Tian, F.; Vitos, L. Experimental and theoretical study of Ti20Zr20Hf 20Nb20X20 (X = v or Cr) refractory high-entropy alloys. Int. J. Refract. Met. Hard Mater. 2014, 47, 131–138. [Google Scholar] [CrossRef]
  16. Senkov, O.N.; Senkova, S.V.; Woodward, C.; Miracle, D.B. Low-density, refractory multi-principal element alloys of the Cr-Nb-Ti-V-Zr system: Microstructure and phase analysis. Acta Mater. 2013, 61, 1545–1557. [Google Scholar] [CrossRef]
  17. Strozi, R.B.; Leiva, D.R.; Zepon, G.; Botta, W.J.; Huot, J. Effects of the chromium content in (Tivnb)100−xcrx body-centered cubic high entropy alloys designed for hydrogen storage applications. Energies 2021, 14, 3068. [Google Scholar] [CrossRef]
  18. Sleiman, S.; Huot, J. Microstructure and First Hydrogenation Properties of TiHfZrNb1−xV1+x Alloy for x = 0, 0.1, 0.2, 0.4, 0.6 and 1. Molecules. 2022, 27, 1054. [Google Scholar] [CrossRef]
  19. Montero, J.; Zlotea, C.; Ek, G.; Crivello, J.C.; Laversenne, L.; Sahlberg, M. TiVZrNb Multi-Principal-Element Alloy: Synthesis Optimization, Structural, and Hydrogen Sorption Properties. Molecules 2019, 24, 2799. [Google Scholar] [CrossRef]
  20. Montero, J.; Ek, G.; Laversenne, L.; Nassif, V.; Sahlberg, M.; Zlotea, C. How 10 at% al addition in the ti-v-zr-nb high-entropy alloy changes hydrogen sorption properties. Molecules 2021, 26, 2470. [Google Scholar] [CrossRef]
  21. Ek, G.; Nygård, M.M.; Pavan, A.F.; Montero, J.; Henry, P.F.; Sørby, M.H.; Witman, M.; Stavila, V.; Zlotea, C.; Hauback, B.C.; et al. Elucidating the Effects of the Composition on Hydrogen Sorption in TiVZrNbHf-Based High-Entropy Alloys. Cite This Inorg. Chem. 2021, 60, 1124–1132. [Google Scholar] [CrossRef] [PubMed]
  22. Zlotea, C.; Sow, M.A.; Ek, G.; Couzinié, J.P.; Perrière, L.; Guillot, I.; Bourgon, J.; Møller, K.T.; Jensen, T.R.; Akiba, E.; et al. Hydrogen sorption in TiZrNbHfTa high entropy alloy. J. Alloys Compd. 2019, 775, 667–674. [Google Scholar] [CrossRef]
  23. Sahlberg, M.; Karlsson, D.; Zlotea, C.; Jansson, U. Superior hydrogen storage in high entropy alloys. Sci. Rep. 2016, 6, 1–6. [Google Scholar] [CrossRef] [PubMed]
  24. Coelho, A.A. TOPAS and TOPAS-Academic: An optimization program integrating computer algebra and crystallographic objects written in C++. J. Appl. Crystallogr. 2018, 51, 210–218. [Google Scholar] [CrossRef]
  25. Scheil, E. Bemerkungen zur Schichtkristallbildung. Int. J. Mater. Res. 1942, 34, 70–72. [Google Scholar] [CrossRef]
  26. Gulliver, G.H. The quantitative effect of rapid cooling upon the constitution of binary alloys. J. Inst. Met. 1915, 13, 263–291. [Google Scholar]
  27. Pacheco, V.; Lindwall, G.; Karlsson, D.; Cedervall, J.; Fritze, S.; Ek, G.; Berastegui, P.; Sahlberg, M.; Jansson, U. Thermal Stability of the HfNbTiVZr High-Entropy Alloy. Inorg. Chem. 2019, 58, 811–820. [Google Scholar] [CrossRef]
  28. Tong, C.J.; Chen, Y.L.; Chen, S.K.; Yeh, J.W.; Shun, T.T.; Tsau, C.H.; Lin, S.J.; Chang, S.Y. Microstructure characterization of AlxCoCrCuFeNi high-entropy alloy system with multiprincipal elements. Metall. Mater. Trans. A Phys. Metall. Mater. Sci. 2005, 36, 881–893. [Google Scholar] [CrossRef]
  29. Nygård, M.M.; Ek, G.; Karlsson, D.; Sørby, M.H.; Sahlberg, M.; Hauback, B.C. Counting electrons—A new approach to tailor the hydrogen sorption properties of high-entropy alloys. Acta Mater. 2019, 175, 121–129. [Google Scholar] [CrossRef]
  30. Senkov, O.; Gorsse, S.; Wheeler, R.; Payton, E.; Miracle, D.B. Effect of Re on the Microstructure and Mechanical Properties of NbTiZr and TaTiZr Equiatomic Alloys. Metals 2021, 11, 1819. [Google Scholar] [CrossRef]
Figure 1. XRD (X-ray diffraction) patterns of the alloys HfxNbTi(1−x)VZr after (a) arc-melting, (b) induction-melting, and (c) annealing at 600 °C for 1 month.
Metals 13 00343 g001
Figure 2. SEM (scanning electron microscopy) images in backscattered electron (BSE) mode of the as-cast HfxNbTi(1−x)VZr (x = 0–1) synthesized by induction-melting (ae) and arc-melting (fj).
Metals 13 00343 g002aMetals 13 00343 g002b
Figure 3. Non-equilibrium solidification simulations showing the molar fraction of solid for (a) NbTiVZr and (b) HfNbVZr, using the TCHEA4 database. The dashed line represents the equilibrium state.
Metals 13 00343 g003
Figure 4. Equilibrium phase diagrams of (a) NbTiVZr and (b) HfNbVZr, calculated using the TCHEA4 database.
Metals 13 00343 g004
Figure 5. Pseudo-binary isopleth for HfxTi(1−x)NbVZr system calculated using the TCHEA4 database.
Metals 13 00343 g005
Table 1. Lattice parameters a and c of the observed phases in the arc-melted, induction-melted and annealed HfxNbTi(1−x)VZr (x = 0–1) alloys. The error on each value is indicated between brackets.
Alloy
HfxNbTi(1−x)VZr
Arc-MeltedInduction-MeltedAnnealed
(600 °C for 1 Month)
Phase abundanceLattice
parameter (nm)
Phase
abundance
Lattice
parameter
(nm)
Phase
abundance
Lattice
parameter
(nm)
x = 0 (NbTiVZr)100% BCC, a = 0.3311 (2)94% BCC1, a = 0.3310 (1)
6% BCC2, a = 0.3463 (2)
59% BCC1, a = 0.3271 (3)
22% BCC2, a = 0.3464 (2)
19% unknown
x = 0.25
(Hf0.25NbTi0.75VZr)
100% BCC, a = 0.3334 (3)89% BCC, a = 0.3335 (3)
11% C14, a = 0.5276 (4), c = 0.8642 (11)
-
x = 0.50
Hf0.5NbTi0.5VZr
100% BCC, a = 0.3356 (2) 51% BCC, a = 0.3326 (1)
49% C14, a = 0.5326 (2), c = 0.8619 (5)
-
x = 0.75
(Hf0.75NbTi0.25VZr)
87% BCC, a = 0.3371 (2)
13% C15, a = 0.7376 (4)
54% BCC, a = 0.3420 (2)
46% C14, a = 0.5319 (2), c = 0.8561 (7)
27% BCC, a = 0.3400 (3)
51% C14, a = 0.5356 (5),
c = 0.8641 (3)
22% HCP, a = 0.3211 (2)
c = 0.5104 (2)
x = 1 (HfNbVZr)85% BCC, a = 0.3392 (6)
15% C15, a = 0.746 (5)
45% BCC, a = 0.3454 (2)
55% C14, a = 0.5312 (3), c = 0.8561 (8)
-
Table 2. Chemical composition (in at.%) of the phases of HfxNbTi(1−x)VZr (x = 0–1) synthesized by arc-melting and induction-melting from EDS measurements. The accuracy is about 1 to 2% for all the measurements.
ConditionPhaseHfNbTiVZr
Arc-meltedx = 0 (NbTiVZr)
Gray matrix (BCC)023242725
x = 0.25 (Hf0.25NbTi0.75VZr)
Gray matrix (BCC)527192722
x = 0.5 (Hf0.5NbTi0.5VZr)
Bright dendrites (BCC)1129132422
Dark regions1022133025
x = 0.75 (Hf0.75NbTi0.25VZr)
Bright dendrites (BCC)162662724
Dark regions
(C15 Laves)
131744521
x = 1 (HfNbVZr)
Bright dendrites (BCC)232802325
Dark regions
(C15 Laves)
151804619
Induction-meltedx = 0 (NbTiVZr)
Gray matrix (BCC1)018253323
Bright regions (BCC2)018262530
x = 0.25 (Hf0.25NbTi0.75VZr)
Gray matrix (BCC)521261631
Dark particles
(C14 Laves)
51694722
x = 0.5 (Hf0.5NbTi0.5VZr)
Gray matrix (BCC)1126162126
Dark particles
(C14 Laves)
101755018
x = 0.75 (Hf0.75NbTi0.25VZr)
Gray matrix (BCC)1729101528
Dark particles
(C14 Laves)
131935115
x = 1 (HfNbVZr)
Gray matrix (BCC)253201529
Dark particles
(C14 Laves)
151704622
Table 3. Predicted liquidus, solidus, and equilibrium phase transformation temperatures (°C) in the studied alloys in comparison with published results.
Reaction.NbTiVZrNbTiVZr [16]NbTiZr [30]HfNbVZr
L → BCC (liquidus)16551760≈18201663
L → BCC (solidus)14901668≈16401453
BCC1 → BCC1 + BCC2771726≈700-
BCC1 → C15---1073
BCC1 → C15 + BCC2---1038
BCC1 → C15 + BCC2 + HCP---923
Disclaimer/Publisher’s Note: The statements, opinions and data contained in all publications are solely those of the individual author(s) and contributor(s) and not of MDPI and/or the editor(s). MDPI and/or the editor(s) disclaim responsibility for any injury to people or property resulting from any ideas, methods, instructions or products referred to in the content.

