

Effect of the Gas Temperature on Agglomeration of Au Nanoparticles Synthesized by Spark Discharge and Their Application in Surface-Enhanced Raman Spectroscopy
 , , , and
Abstract
:1. Introduction
2. Materials and Methods
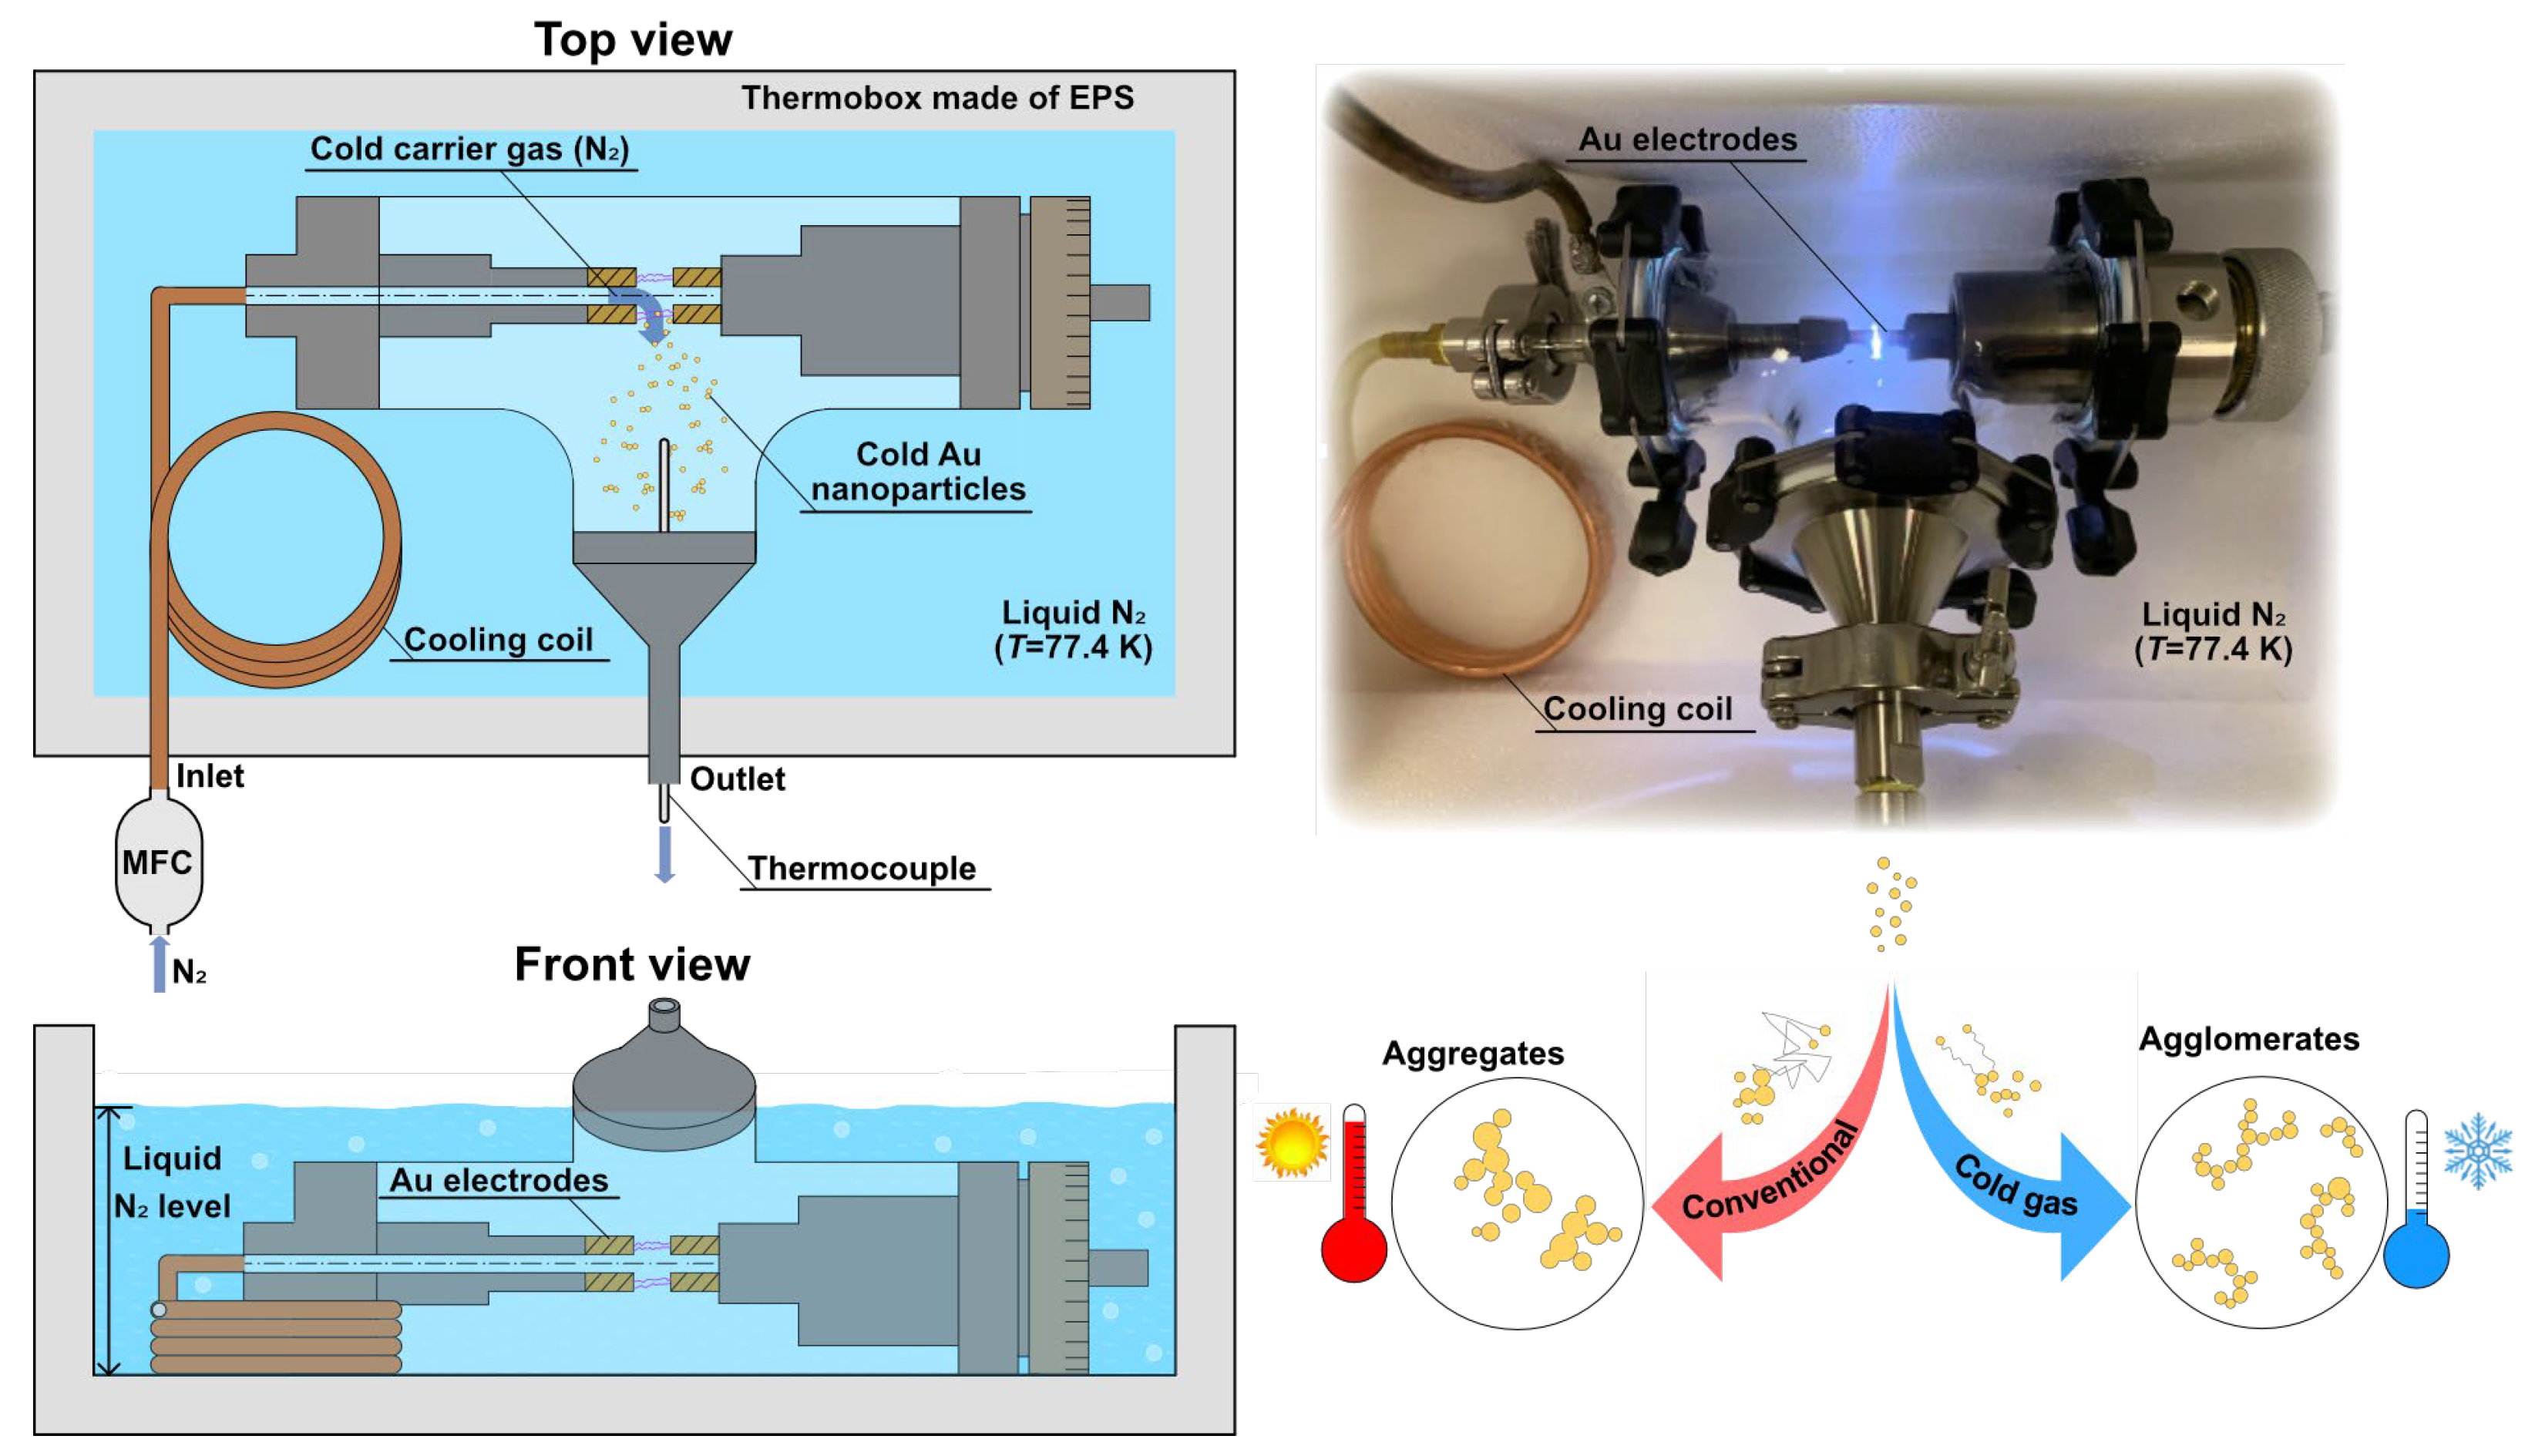
2.1. Synthesis of Nanoparticles in a Spark Gas Discharge
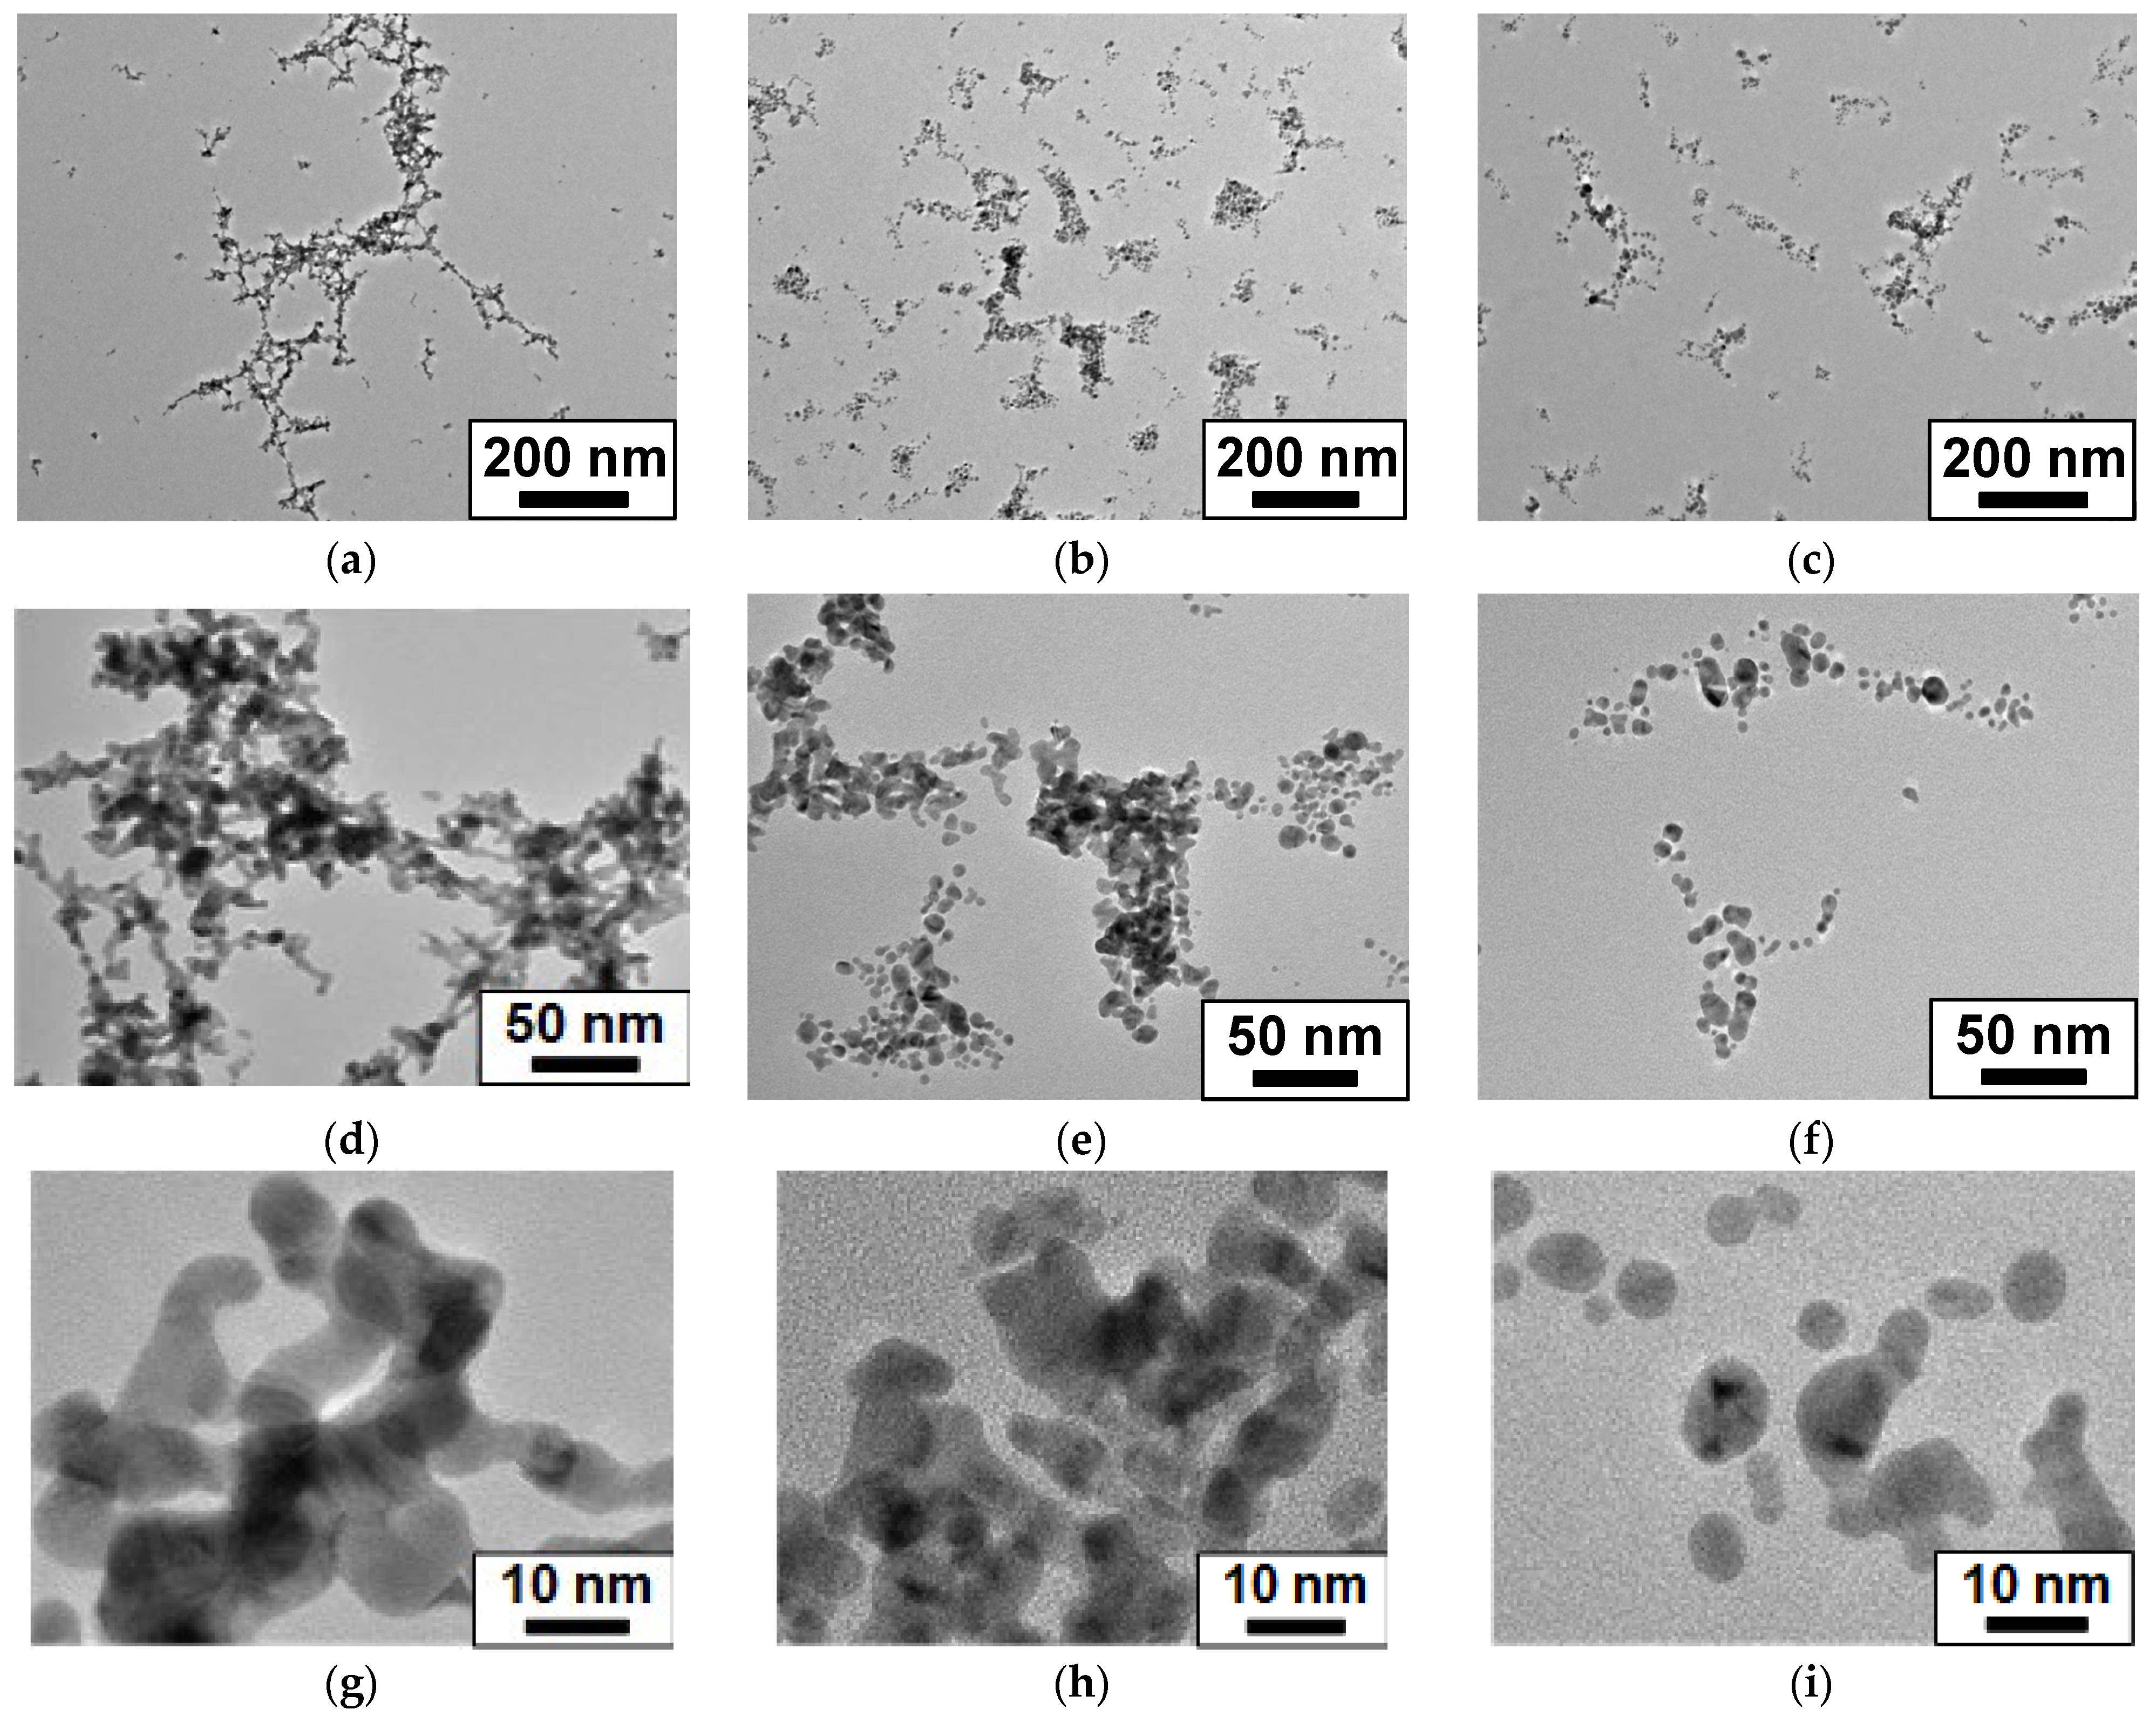
2.2. Study of the Size and Morphology of Primary Nanoparticles and Their Agglomerates

2.3. Mass Production Rate of Nanoparticle Synthesis
2.4. Aerosol Printing and Measurements of SERS Structures
3. Results
4. Conclusions
Author Contributions
Funding
Data Availability Statement
Conflicts of Interest
References
- Feng, J.; Guo, X.; Ramlawi, N.; Pfeiffer, T.V.; Geutjens, R.; Basak, S.; Nirschl, H.; Biskos, G.; Zandbergen, H.W.; Schmidt-Ott, A. Green Manufacturing of Metallic Nanoparticles: A Facile and Universal Approach to Scaling Up. J. Mater. Chem. A 2016, 4, 11222–11227. [Google Scholar] [CrossRef]
- Feng, J.; Chen, D.; Pikhitsa, P.V.; Jung, Y.; Yang, J.; Choi, M. Unconventional Alloys Confined in Nanoparticles: Building Blocks for New Matter. Matter 2020, 3, 1646–1663. [Google Scholar] [CrossRef]
- Snellman, M.; Eom, N.; Ek, M.; Messing, M.E.; Deppert, K. Continuous Gas-Phase Synthesis of Core–Shell Nanoparticles via Surface Segregation. Nanoscale Adv. 2021, 3, 3041–3052. [Google Scholar] [CrossRef] [PubMed]
- El-Aal, M.A.; Seto, T. Spark discharge deposition of au/cu nanoparticles for surface-enhanced Raman scattering. Surf. Interface Anal. 2021, 53, 824–828. [Google Scholar] [CrossRef]
- Palásti, D.J.; Villy, L.P.; Kohut, A.; Ajtai, T.; Geretovszky, Z.; Galbács, G. Laser-Induced Breakdown Spectroscopy Signal Enhancement Effect for Argon Caused by the Presence of Gold Nanoparticles. Spectrochim. Acta Part B At. Spectrosc. 2022, 193, 106435. [Google Scholar] [CrossRef]
- Snellman, M.; Samuelsson, P.; Eriksson, A.; Li, Z.; Deppert, K. On-Line Compositional Measurements of AuAg Aerosol Nanoparticles Generated by Spark Ablation Using Optical Emission Spectroscopy. J. Aerosol Sci. 2022, 165, 106041. [Google Scholar] [CrossRef]
- Jung, W.; Jung, Y.-H.; Pikhitsa, P.V.; Feng, J.; Yang, Y.; Kim, M.; Tsai, H.-Y.; Tanaka, T.; Shin, J.; Kim, K.-Y.; et al. Three-Dimensional Nanoprinting via Charged Aerosol Jets. Nature 2021, 592, 54–59. [Google Scholar] [CrossRef]
- Van Ginkel, H.J.; Vollebregt, S.; Zhang, G.; Schmidt-Ott, A. Mass and density determination of porous nanoparticle films using a quartz crystal microbalance. Nanotechnology 2022, 33, 485704. [Google Scholar] [CrossRef]
- Ramirez Benavides, J.A.; Krasnikov, D.V.; Gubarev, V.V.; Novikov, I.V.; Kondrashov, V.A.; Starkov, A.V.; Krivokorytov, M.S.; Medvedev, V.V.; Gladush, Y.G.; Nasibulin, A. Renewable Single-Walled Carbon Nanotube Membranes for Extreme Ultraviolet Pellicle Applications. Carbon 2022, 198, 364–370. [Google Scholar] [CrossRef]
- Bhowmick, S.; Maisser, A.; Suleimanov, Y.V.; Schmidt-Ott, A.; Biskos, G. Electronic Structure, Stability, and Electrical Mobility of Cationic Silver Oxide Atomic Clusters. J. Phys. Chem. A 2022, 126, 6376–6386. [Google Scholar] [CrossRef]
- Tsantilis, S.; Pratsinis, S.E. Soft- and Hard-Agglomerate Aerosols Made at High Temperatures. Langmuir 2004, 20, 5933–5939. [Google Scholar] [CrossRef]
- Kallay, N.; Žalac, S. Stability of Nanodispersions: A Model for Kinetics of Aggregation of Nanoparticles. J. Colloid Interface Sci. 2002, 253, 70–76. [Google Scholar] [CrossRef]
- Ma, X.; Zare, Y.; Rhee, K.Y. A Two-Step Methodology to Study the Influence of Aggregation/Agglomeration of Nanoparticles on Young’s Modulus of Polymer Nanocomposites. Nanoscale Res. Lett. 2017, 12, 621. [Google Scholar] [CrossRef]
- Villy, L.P.; Kohut, A.; Kéri, A.; Bélteki, Á.; Radnóczi, G.; Fogarassy, Z.; Radnóczi, G.Z.; Galbács, G.; Geretovszky, Z. Continuous Spark Plasma Synthesis of Au/Co Binary Nanoparticles with Tunable Properties. Sci. Rep. 2022, 12, 18560. [Google Scholar] [CrossRef]
- Sapountzi, F.M.; Lavorenti, M.; Vrijburg, W.; Dimitriadou, S.; Tyburska-Pueschel, B.; Thüne, P.; Niemantsverdriet, H.; Pfeiffer, T.V.; Tsampas, M.N. Spark Ablation for the Fabrication of PEM Water Electrolysis Catalyst-Coated Membranes. Catalysts 2022, 12, 1343. [Google Scholar] [CrossRef]
- Wojtaszek, K.; Skibińska, K.; Cebula, F.; Tokarski, T.; Escribà-Gelonch, M.; Hessel, V.; Wojnicki, M. Synthesis and Catalytic Studies of Nanoalloy Particles Based on Bismuth, Silver, and Rhenium. Metals 2022, 12, 1819. [Google Scholar] [CrossRef]
- Kohut, A.; Horváth, V.; Pápa, Z.; Vajda, B.; Kopniczky, J.; Galbács, G.; Geretovszky, Z. One-Step Fabrication of Fiber Optic SERS Sensors via Spark Ablation. Nanotechnology 2021, 32, 395501. [Google Scholar] [CrossRef]
- El-Aal, M.A.; Seto, T.; Kumita, M.; Abdelaziz, A.A.; Otani, Y. Synthesis of Silver Nanoparticles Film by Spark Discharge Deposition for Surface-Enhanced Raman Scattering. Opt. Mater. 2018, 83, 263–271. [Google Scholar] [CrossRef]
- Isaac, N.A.; Ngene, P.; Westerwaal, R.J.; Gaury, J.; Dam, B.; Schmidt-Ott, A.; Biskos, G. Optical Hydrogen Sensing with Nanoparticulate Pd–Au Films Produced by Spark Ablation. Sens. Actuators B Chem. 2015, 221, 290–296. [Google Scholar] [CrossRef]
- Isaac, N.A.; Pikaar, I.; Biskos, G. Metal oxide semiconducting nanomaterials for air quality gas sensors: Operating principles, performance, and synthesis techniques. Microchim. Acta 2022, 189, 196. Available online: https://link.springer.com/article/10.1007/s00604-022-05254-0 (accessed on 19 January 2023). [CrossRef] [PubMed]
- Zhang, J.; Ahmadi, M.; Fargas, G.; Perinka, N.; Reguera, J.; Lanceros-Méndez, S.; Llanes, L.; Jiménez-Piqué, E. Silver Nanoparticles for Conductive Inks: From Synthesis and Ink Formulation to Their Use in Printing Technologies. Metals 2022, 12, 234. [Google Scholar] [CrossRef]
- Jo, Y.-S.; Lee, H.-J.; Park, H.-M.; Na, T.-W.; Jung, J.-S.; Min, S.-H.; Kim, Y.K.; Yang, S.-M. Chemical Vapor Synthesis of Nonagglomerated Nickel Nanoparticles by In-Flight Coating. ACS Omega 2021, 6, 27842–27850. [Google Scholar] [CrossRef] [PubMed]
- Tabrizi, N.S.; Ullmann, M.; Vons, V.A.; Lafont, U.; Schmidt-Ott, A. Generation of Nanoparticles by Spark Discharge. J. Nanoparticle Res. 2009, 11, 315–332. [Google Scholar] [CrossRef]
- Han, K.; Kim, W.; Yu, J.; Lee, J.; Lee, H.; Woo, C.G.; Choi, M. A Study of Pin-to-Plate Type Spark Discharge Generator for Producing Unagglomerated Nanoaerosols. J. Aerosol Sci. 2012, 52, 80–88. [Google Scholar] [CrossRef]
- Tikhonov, S.S.; Nouraldeen, M.; Khabarov, K.M.; Efimov, A.A.; Ivanov, V.V. Investigation of Laser and Thermal Sintering Processes of Silver Nanoparticles Agglomerates Synthesized by Spark Discharge. J. Phys. Conf. Ser. 2021, 2086, 012169. [Google Scholar] [CrossRef]
- Khabarov, K.; Nouraldeen, M.; Tikhonov, S.; Lizunova, A.; Efimov, A.; Ivanov, V. Modification of Aerosol Gold Nanoparticles by Nanosecond Pulsed-Periodic Laser Radiation. Nanomaterials 2021, 11, 2701. [Google Scholar] [CrossRef] [PubMed]
- Park, K.-T.; Farid, M.M.; Hwang, J. Anti-Agglomeration of Spark Discharge-Generated Aerosols via Unipolar Air Ions. J. Aerosol Sci. 2014, 67, 144–156. [Google Scholar] [CrossRef]
- Feng, J.; Biskos, G.; Schmidt-Ott, A. Toward Industrial Scale Synthesis of Ultrapure Singlet Nanoparticles with Controllable Sizes in a Continuous Gas-Phase Process. Sci. Rep. 2015, 5, 15788. [Google Scholar] [CrossRef]
- Kohut, A. Hydrogen-Assisted Spark Generation of Silver Nanoparticles: The Effect of Hydrogen Content on the Signal Intensity in Surface-Enhanced Raman Spectroscopy. J. Aerosol Sci. 2023, 167, 106090. [Google Scholar] [CrossRef]
- Volkov, I.A.; Simonenko, N.P.; Efimov, A.A.; Simonenko, T.L.; Vlasov, I.S.; Borisov, V.I.; Arsenov, P.V.; Lebedinskii, Y.Y.; Markeev, A.M.; Lizunova, A.A.; et al. Platinum Based Nanoparticles Produced by a Pulsed Spark Discharge as a Promising Material for Gas Sensors. Appl. Sci. 2021, 11, 526. [Google Scholar] [CrossRef]
- Efimov, A.A.; Arsenov, P.V.; Borisov, V.I.; Buchnev, A.I.; Lizunova, A.A.; Kornyushin, D.V.; Tikhonov, S.S.; Musaev, A.G.; Urazov, M.N.; Shcherbakov, M.I.; et al. Synthesis of Nanoparticles by Spark Discharge as a Facile and Versatile Technique of Preparing Highly Conductive Pt Nano-Ink for Printed Electronics. Nanomaterials 2021, 11, 234. [Google Scholar] [CrossRef]
- Jones, F.L. Electrode Erosion by Spark Discharges. Br. J. Appl. Phys. 1950, 1, 60–65. [Google Scholar] [CrossRef]
- Aghajani, S.; Accardo, A.; Tichem, M. Process and Nozzle Design for High-Resolution Dry Aerosol Direct Writing (DADW) of Sub-100 Nm Nanoparticles. Addit. Manuf. 2022, 54, 102729. [Google Scholar] [CrossRef]
- Efimov, A.A.; Potapov, G.N.; Nisan, A.V.; Ivanov, V.V. Controlled Focusing of Silver Nanoparticles Beam to Form the Microstructures on Substrates. Results Phys. 2017, 7, 440–443. [Google Scholar] [CrossRef]
- Efimov, A.A.; Kornyushin, D.V.; Buchnev, A.I.; Kameneva, E.I.; Lizunova, A.A.; Arsenov, P.V.; Varfolomeev, A.E.; Pavzderin, N.B.; Nikonov, A.V.; Ivanov, V.V. Fabrication of Conductive and Gas-Sensing Microstructures Using Focused Deposition of Copper Nanoparticles Synthesized by Spark Discharge. Appl. Sci. 2021, 11, 5791. [Google Scholar] [CrossRef]
- Kornyushin, D.V.; Efimov, A.A.; Buchnev, A.I.; Kameneva, E.I.; Ivanov, V.V. Laser Sintering of Oxidized Copper Nanoparticles Deposited by Dry Aerosol Printing. J. Phys. Conf. Ser. 2021, 2086, 012019. [Google Scholar] [CrossRef]
- Khabarov, K.; Kornyushin, D.; Masnaviev, B.; Tuzhilin, D.; Saprykin, D.; Efimov, A.; Ivanov, V. The Influence of Laser Sintering Modes on the Conductivity and Microstructure of Silver Nanoparticle Arrays Formed by Dry Aerosol Printing. Appl. Sci. 2020, 10, 246. [Google Scholar] [CrossRef]
- Ivanov, V.; Lizunova, A.; Rodionova, O.; Kostrov, A.; Kornyushin, D.; Aybush, A.; Golodyayeva, A.; Efimov, A.; Nadtochenko, V. Aerosol Dry Printing for SERS and Photoluminescence-Active Gold Nanostructures Preparation for Detection of Traces in Dye Mixtures. Nanomaterials 2022, 12, 448. [Google Scholar] [CrossRef]
- Xu, C.H.; Xie, B.; Liu, Y.J.; He, L.B.; Han, M. Optimizing surface-enhanced Raman scattering by template guided assembling of closely spaced silver nanocluster arrays. Eur. Phys. J. D 2009, 52, 111–114. Available online: https://link.springer.com/article/10.1140/epjd/e2009-00057-1 (accessed on 19 January 2023). [CrossRef]
- Álvarez-Puebla, R.A. Effects of the Excitation Wavelength on the SERS Spectrum. J. Phys. Chem. Lett. 2012, 3, 857–866. [Google Scholar] [CrossRef] [PubMed]
- Colas, F.J.; Cottat, M.; Gillibert, R.; Guillot, N.; Djaker, N.; Lidgi-Guigui, N.; Toury, T.; Barchiesi, D.; Toma, A.; Di Fabrizio, E.; et al. Red-Shift Effects in Surface Enhanced Raman Spectroscopy: Spectral or Intensity Dependence of the Near-Field? J. Phys. Chem. C 2016, 120, 13675–13683. [Google Scholar] [CrossRef]
- Chong, N.S.; Smith, K.A.; Setti, S.; Ooi, B.G. Application of Gold and Silver Colloidal Nanoparticles for the Surface-Enhanced Raman Spectrometric Analysis of Melamine and 4-Aminobiphenyl. Int. J. Environ. Technol. Manag. 2013, 16, 3–20. [Google Scholar] [CrossRef]
- Wang, R.; He, Z.; Sokolov, A.V.; Kurouski, D. Gap-Mode Tip-Enhanced Raman Scattering on Au Nanoplates of Varied Thickness. J. Phys. Chem. Lett. 2020, 11, 3815–3820. [Google Scholar] [CrossRef]
- Bozhevolnyi, S.I.; Volkov, V.S.; Leosson, K. Localization and Waveguiding of Surface Plasmon Polaritons in Random Nanostructures. Phys. Rev. Lett. 2002, 89, 186801. [Google Scholar] [CrossRef] [PubMed]
- Milekhin, A.G.; Rahaman, M.; Rodyakina, E.E.; Latyshev, A.V.; Dzhagan, V.M.; Zahn, D.R.T. Giant Gap-Plasmon Tip-Enhanced Raman Scattering of MoS2 Monolayers on Au Nanocluster Arrays. Nanoscale 2018, 10, 2755–2763. [Google Scholar] [CrossRef] [PubMed]
- Le Ru, E.C.; Blackie, E.; Meyer, M.; Etchegoin, P.G. Surface Enhanced Raman Scattering Enhancement Factors: A Comprehensive Study. J. Phys. Chem. C 2007, 111, 13794–13803. [Google Scholar] [CrossRef]


| Carrier Gas | Printing Speed v, mm/s | Nozzle to Substrate Distance WD, mm | Carrier Gas Flow Qa, cm3/min | Focus Gas Flow Qsh, cm3/min |
|---|---|---|---|---|
| nitrogen | 10.5 | 3 | 1000 | 100 |
| argon + hydrogen | ||||
| helium |
| Gas temperature Tgas, °C | 24 | −111 | −183 |
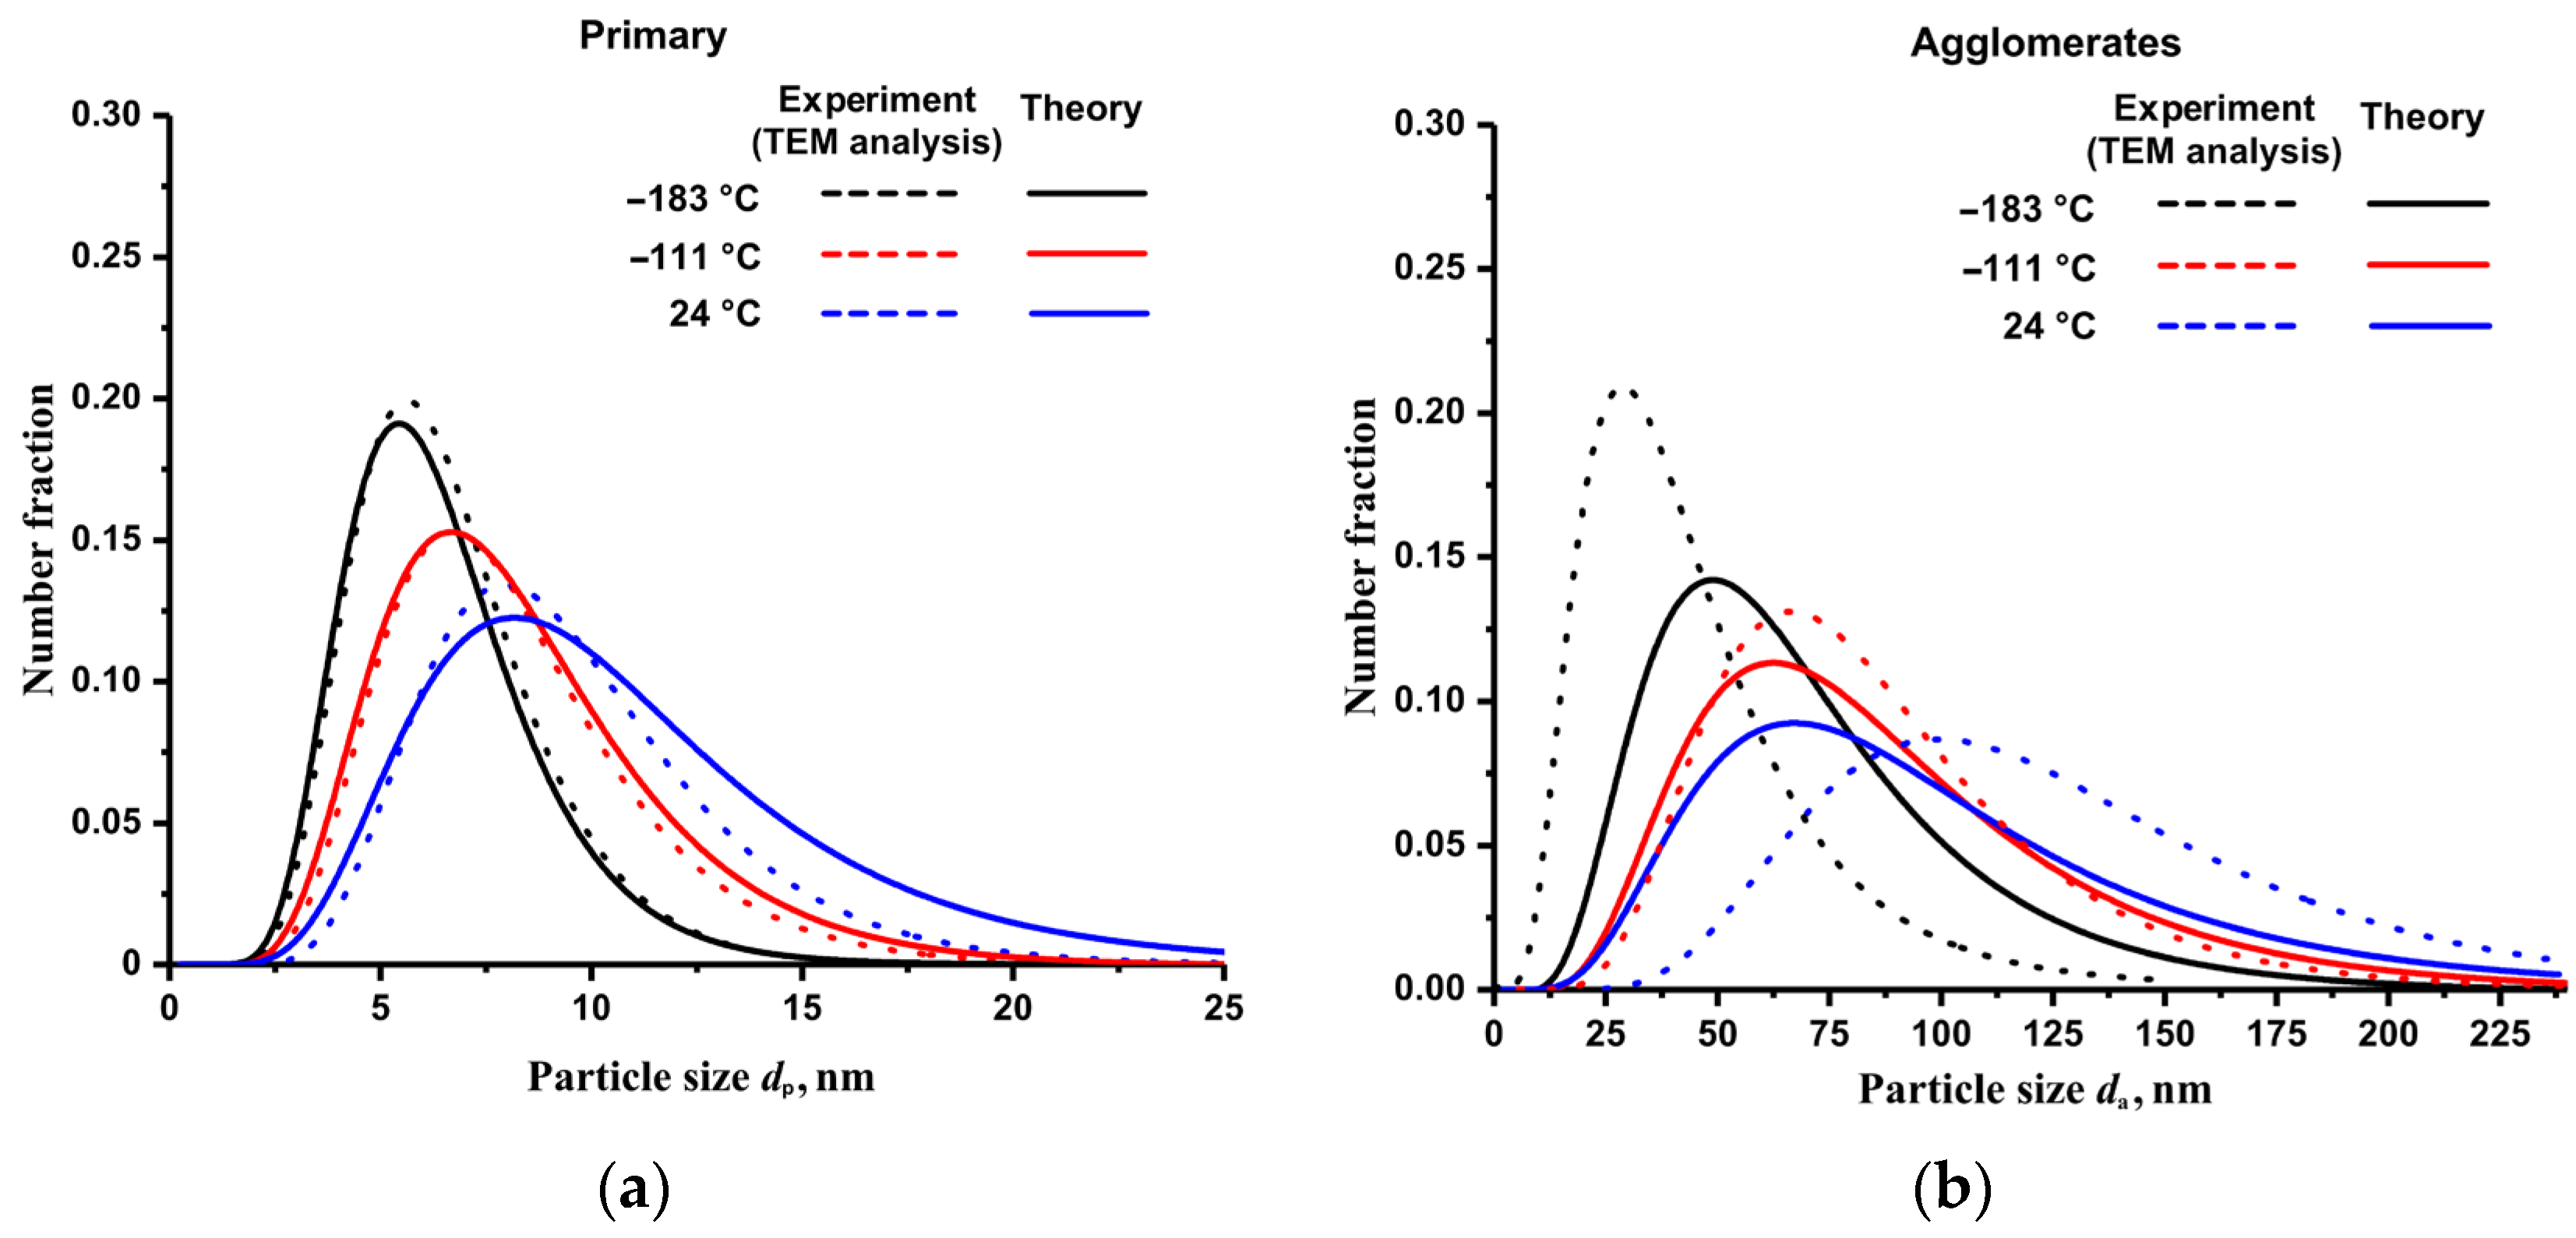
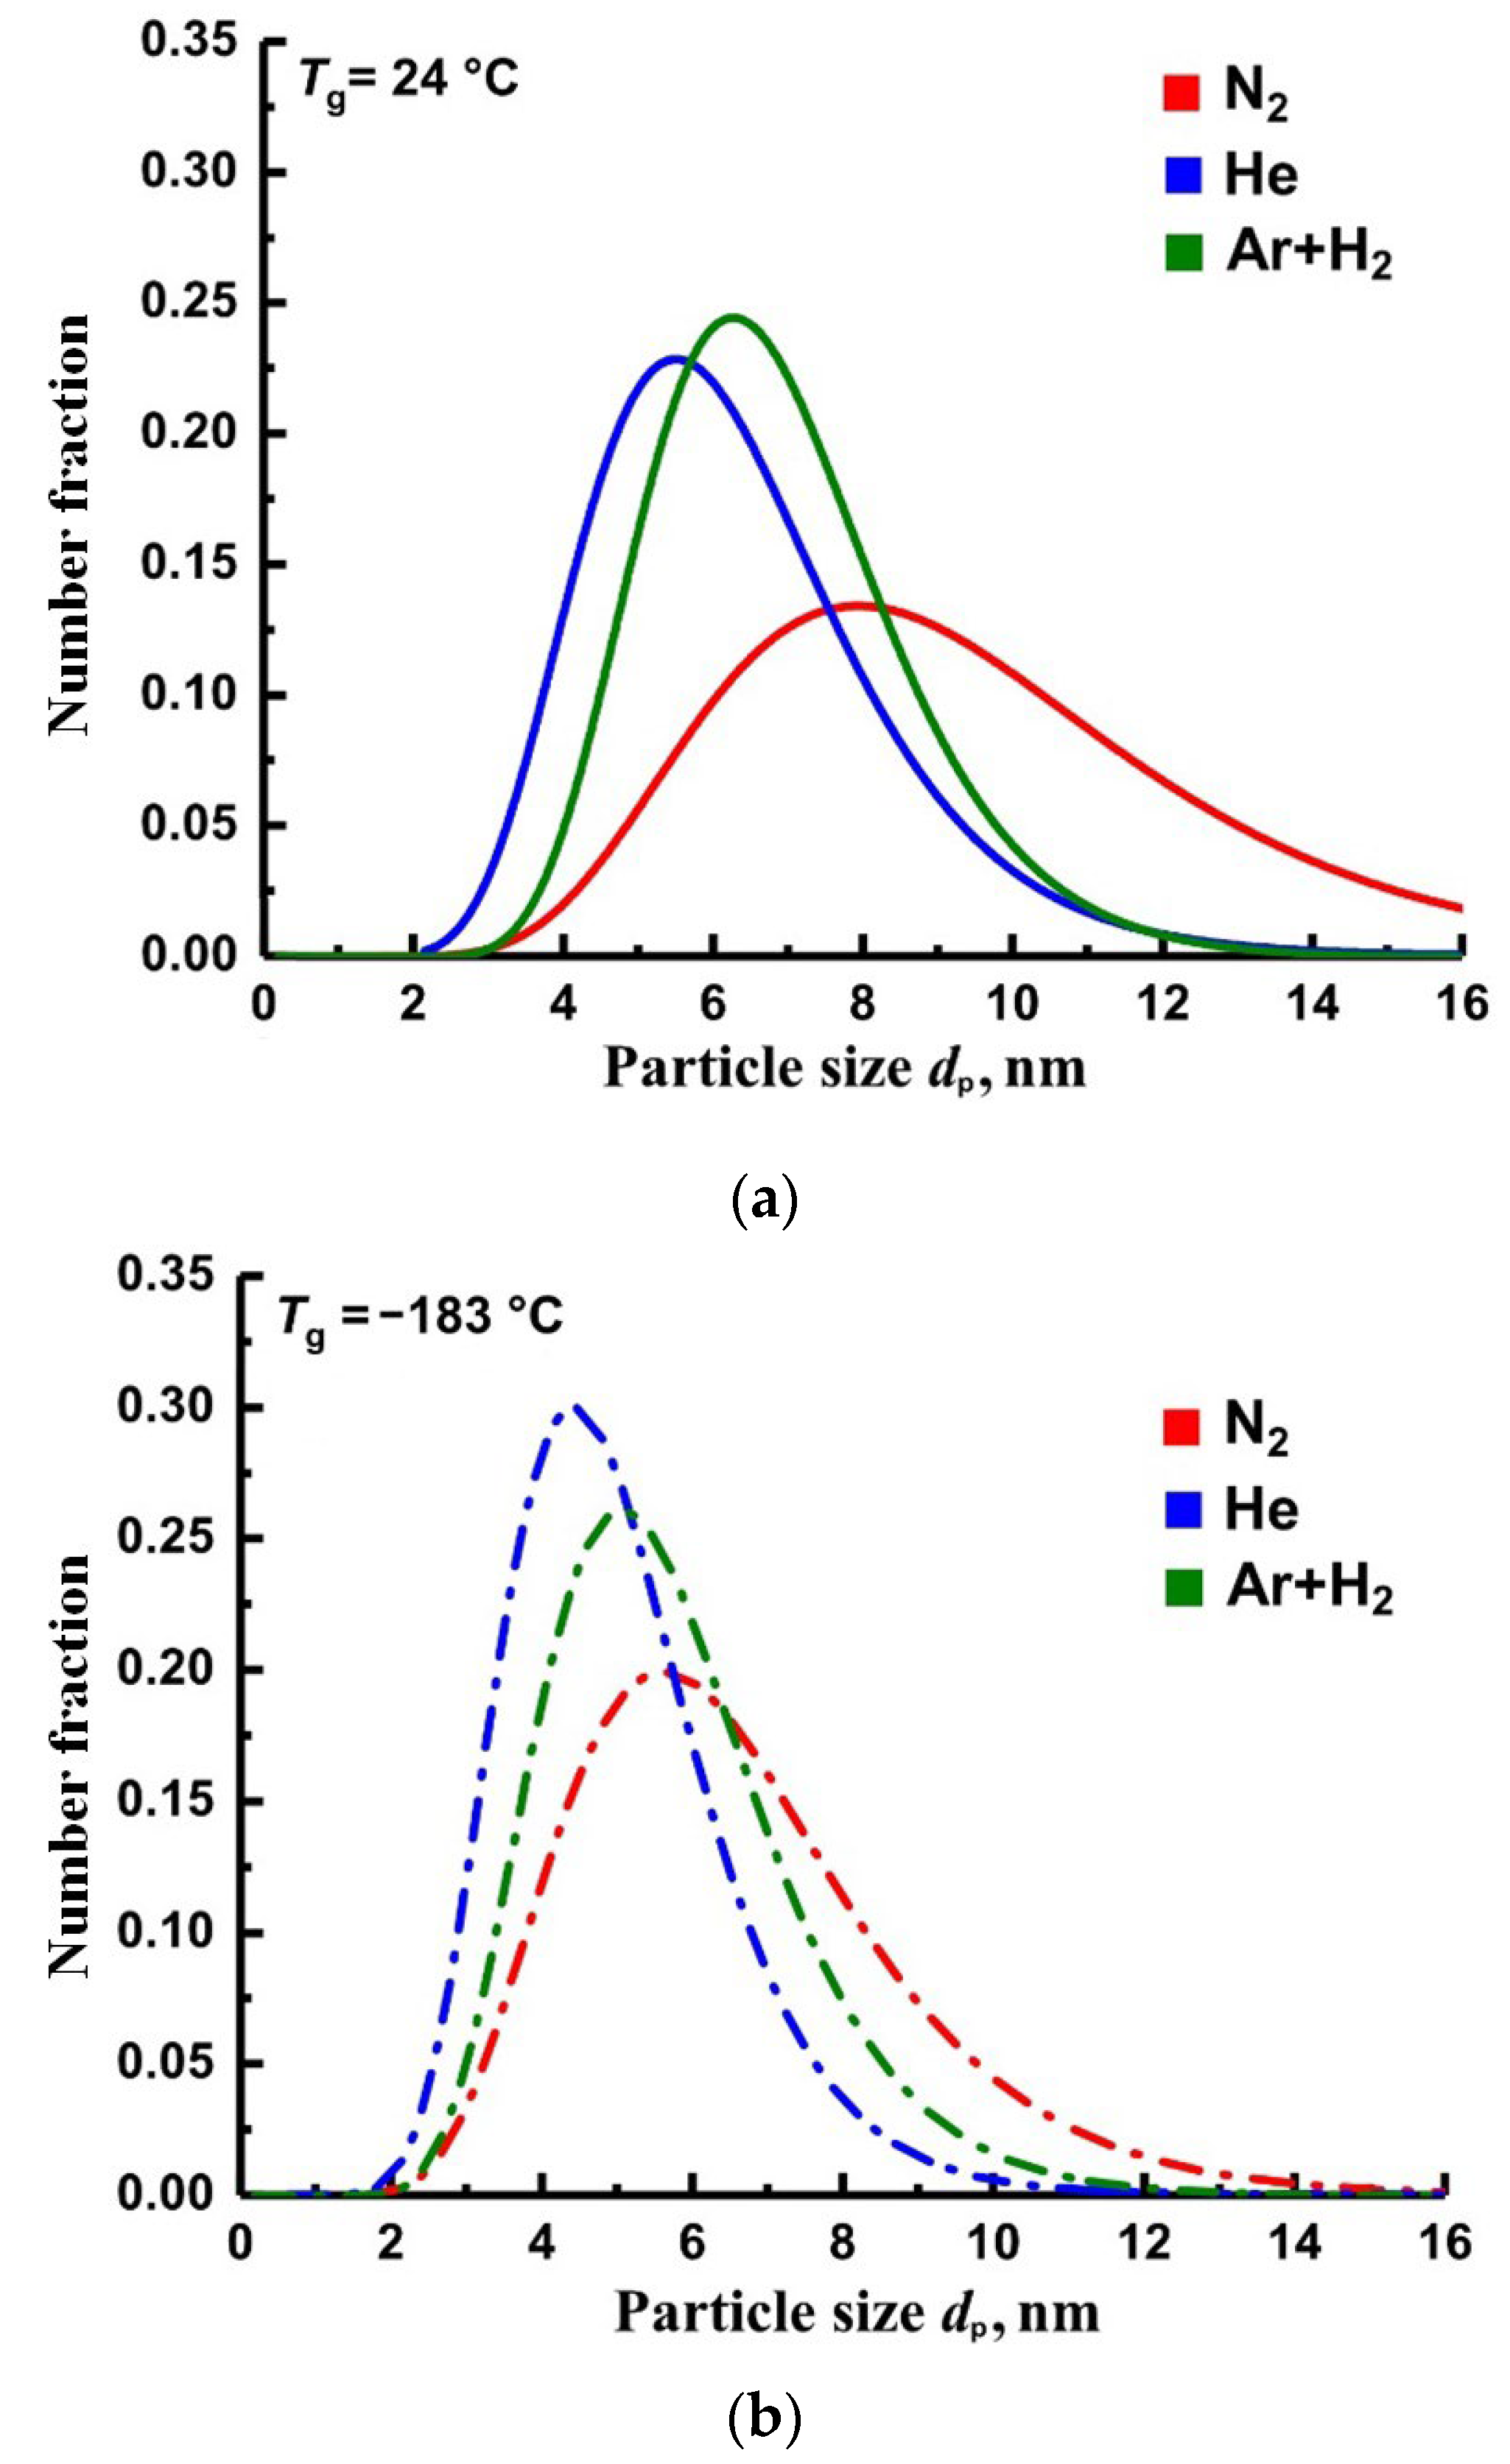
| Average size of primary nanoparticles dp, nm | 9.4 ± 3.1 | 7.7 ± 2.6 | 6.6 ± 2.5 |
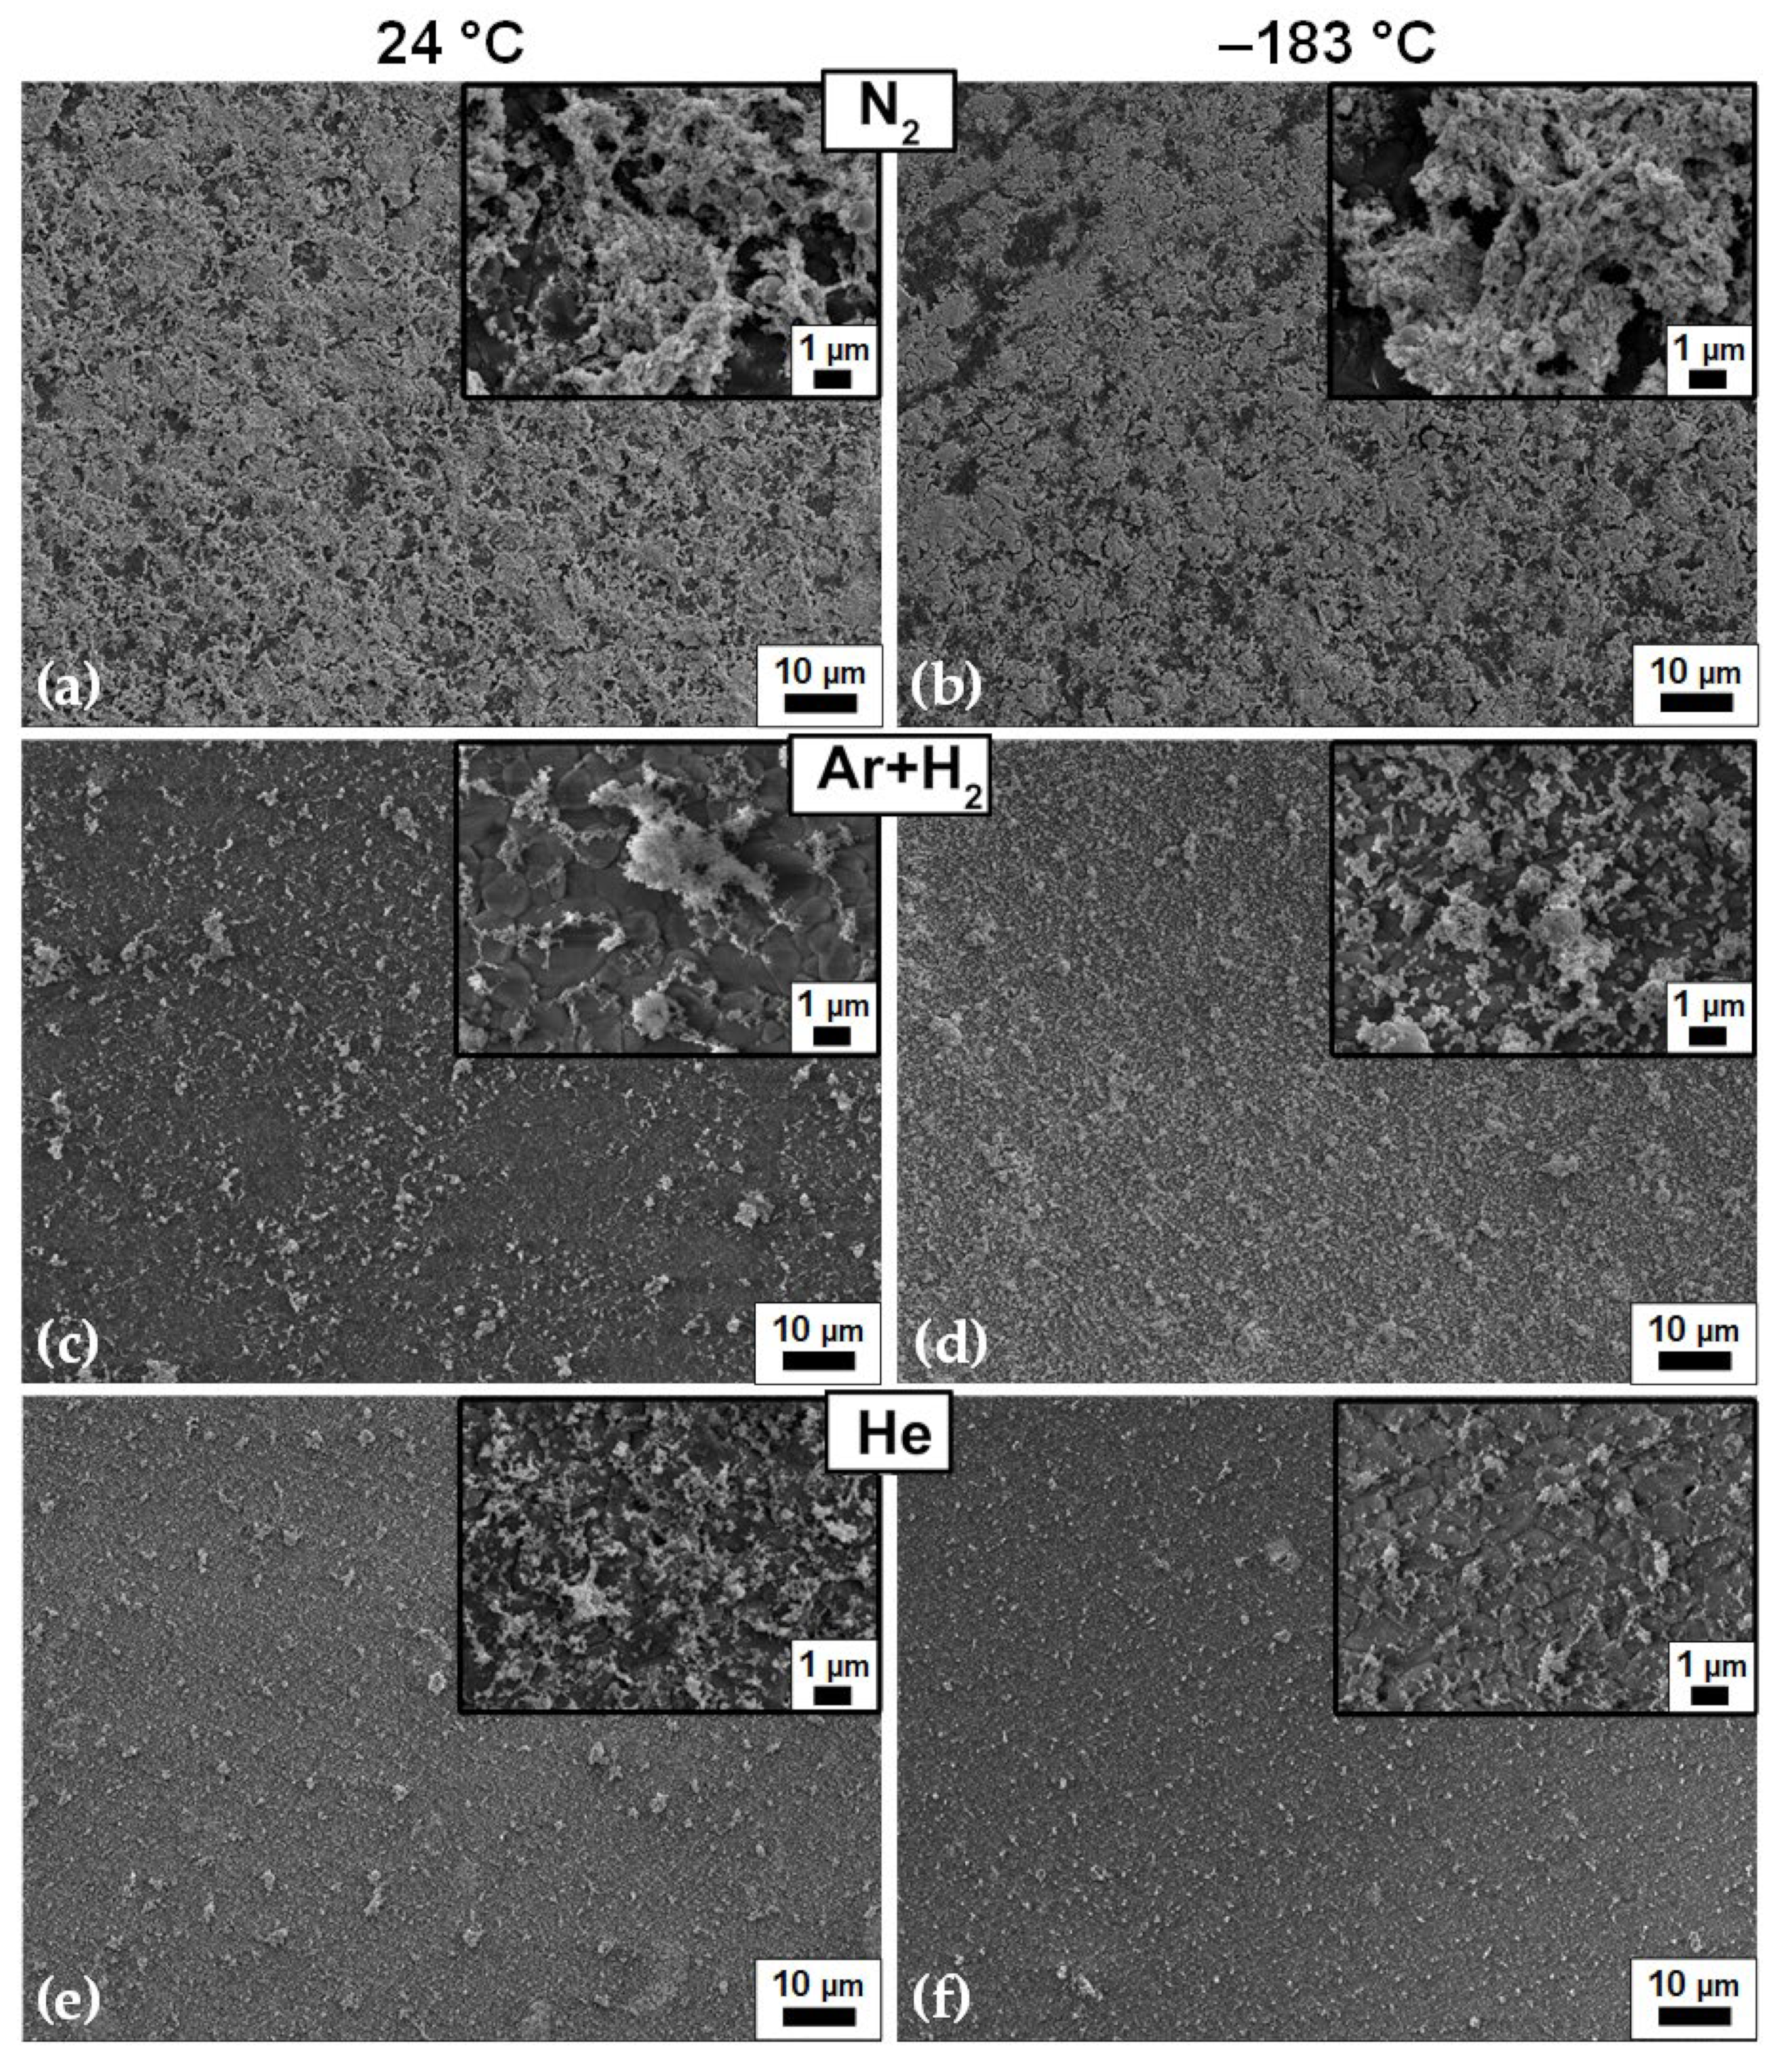
| Average size of agglomerates da, nm | 102 ± 60 | 76 ± 31 | 43 ± 26 |
| Solidity φ, % | 92 ± 2 | 86 ± 3 | 76 ± 3 |
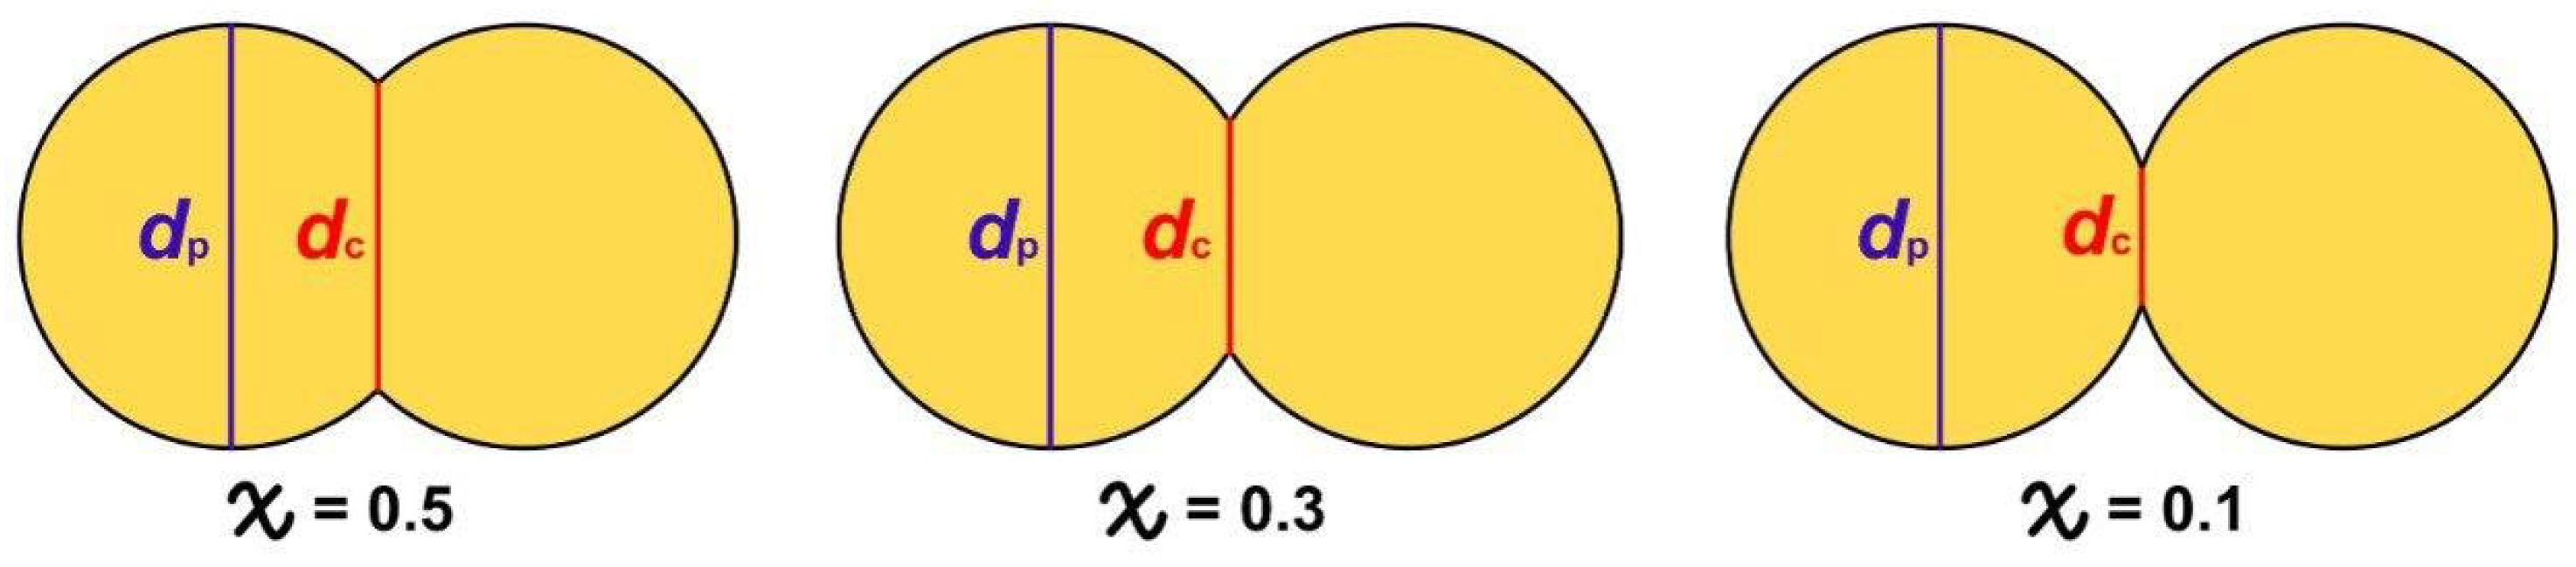
| Relative bond strength χ | 0.5 | 0.3 | 0.1 |
| Carrier Gas | Gas Temperature Tgas, °C | Mass Production m, mg/h | |
|---|---|---|---|
| Experimental | Theory | ||
| N₂ | 24 | 59 | 53 |
| −111 | 52 | 47 | |
| −183 | 42 | 44 | |
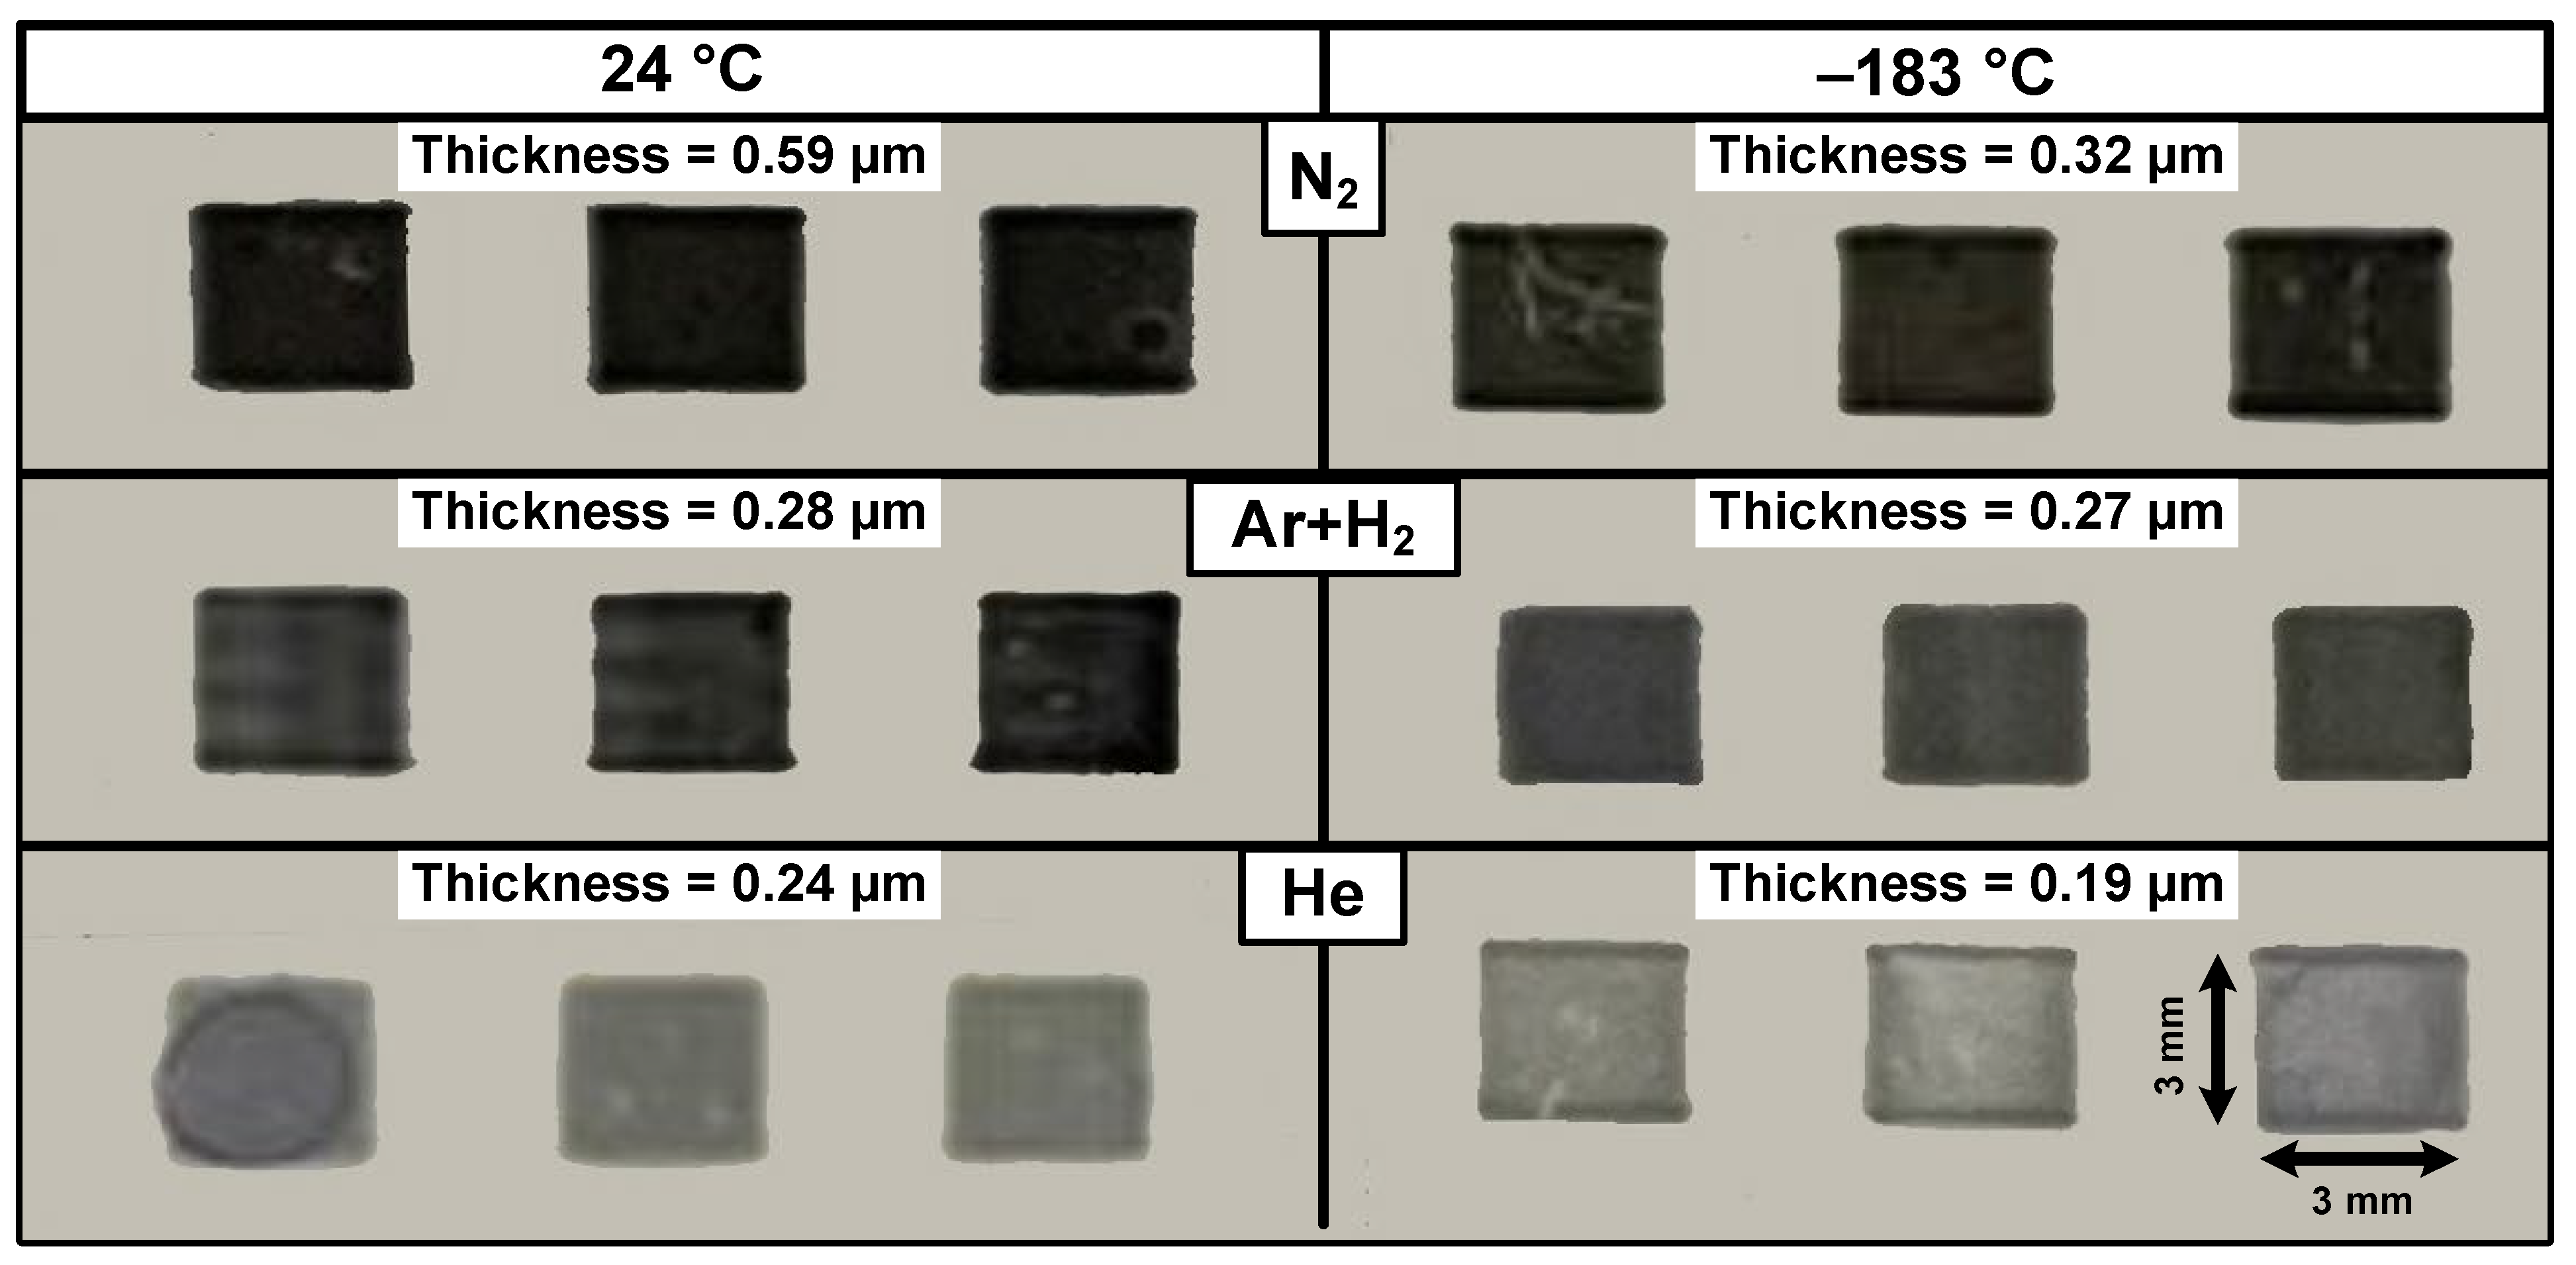
| Atmosphere of Synthesis | Mass Production of Nanoparticle Synthesis, mg/h | Thickness of SERS Structures, µm | ||
|---|---|---|---|---|
| 24 °C | −183 °C | 24 °C | −183 °C | |
| N₂ | 59 | 42 | 0.59 | 0.32 |
| Ar + H₂ | 39 | 35 | 0.28 | 0.27 |
| He | 21 | 18 | 0.24 | 0.19 |
Disclaimer/Publisher’s Note: The statements, opinions and data contained in all publications are solely those of the individual author(s) and contributor(s) and not of MDPI and/or the editor(s). MDPI and/or the editor(s) disclaim responsibility for any injury to people or property resulting from any ideas, methods, instructions or products referred to in the content. |
© 2023 by the authors. Licensee MDPI, Basel, Switzerland. This article is an open access article distributed under the terms and conditions of the Creative Commons Attribution (CC BY) license (https://creativecommons.org/licenses/by/4.0/).
Share and Cite
Kornyushin, D.; Musaev, A.; Patarashvili, A.; Buchnev, A.; Arsenov, P.; Ivanov, M.; Vershinina, O.; Kameneva, E.; Volkov, I.; Efimov, A.; et al. Effect of the Gas Temperature on Agglomeration of Au Nanoparticles Synthesized by Spark Discharge and Their Application in Surface-Enhanced Raman Spectroscopy. Metals 2023, 13, 301. https://doi.org/10.3390/met13020301
Kornyushin D, Musaev A, Patarashvili A, Buchnev A, Arsenov P, Ivanov M, Vershinina O, Kameneva E, Volkov I, Efimov A, et al. Effect of the Gas Temperature on Agglomeration of Au Nanoparticles Synthesized by Spark Discharge and Their Application in Surface-Enhanced Raman Spectroscopy. Metals. 2023; 13(2):301. https://doi.org/10.3390/met13020301
Chicago/Turabian StyleKornyushin, Denis, Andrey Musaev, Anton Patarashvili, Arseny Buchnev, Pavel Arsenov, Matthew Ivanov, Olesya Vershinina, Ekaterina Kameneva, Ivan Volkov, Alexey Efimov, and et al. 2023. "Effect of the Gas Temperature on Agglomeration of Au Nanoparticles Synthesized by Spark Discharge and Their Application in Surface-Enhanced Raman Spectroscopy" Metals 13, no. 2: 301. https://doi.org/10.3390/met13020301