Article

Thermal Decomposition Process Analysis of Jarosite Residue

1
School of Metallurgy, Northeastern University, Shenyang 110819, China
2
School of Resource and Civil Engineering, Northeastern University, Shenyang 110819, China
*
Authors to whom correspondence should be addressed.
Metals 2023, 13(2), 261; https://doi.org/10.3390/met13020261
Submission received: 5 December 2022 / Revised: 19 January 2023 / Accepted: 20 January 2023 / Published: 29 January 2023
(This article belongs to the Section Metal Casting, Forming and Heat Treatment)

Abstract

:
In this work, a mineralogical study and thermal decomposition analysis of jarosite residue sample from a zinc plant were carried out. The mineralogical analysis showed that the jarosite residue is mainly composed of four components, including jarosites, sulfates–hydroxides, sulfides and spinel. The distribution of relevant metallic elements in these components was characterized using a sequential extraction process. The X-ray diffraction results showed that AFe3(OH)6(SO4)2 and ZnFe2O4 are the main components of the jarosite residue sample. The thermal decomposition mechanisms of ammoniojarosite and sodium jarosite were studied by TG-DSC (Thermogravimetric analysis–differential scanning calorimetry). The thermal decomposition process and the corresponding mechanism of the jarosite residue were analyzed. The jarosite thermal decomposition process includes the removal of crystal water, dihydroxylation and deammoniation, desulfonation of component jarosite and desulfonation of component zinc sulfate.

1. Introduction

Jarosite precipitation presents as solid residues, which have been classified as prevailing hazardous waste in the hydrometallurgy industry [1]. Jarosite precipitation is acidic in nature and contains gangue as well as high concentrations of heavy or toxic elements (lead, zinc, sulfur, cadmium, chromium and copper) which are susceptible to leaching. Thus, its disposal has become a major environmental issue worldwide [2]. The most common process to remove iron from lixivium in the zinc hydrometallurgy industry is through the jarosite precipitation process using alkali, such as ammonia, sodium or potassium as MeFe3(SO4)2(OH)6 (Me = K+, Na, NH4+, H3O+, etc.) [1,3]. The jarosite precipitate often contains small amounts of lead, arsenic, cadmium and mercury [3,4,5], as well as some co-precipitation of divalent base metals ions, such as Cu2+, Zn2+ and Co2+ [6]. Zinc industries produced huge quantity of jarosite during the zinc extraction process as solid residues. Over 1 million tons of jarosite is released annually in China [7]. This makes the jarosite precipitate waste one of the biggest environmental problems in the zinc production industry, resulting in the recycling and reuse of jarosite precipitate being of great importance. Several methods (e.g., baked, acid-soluble, alkali-soluble and thermal decomposition) have been developed and used in recycling metals from jarosite residues.
Lots of efforts have been made in the utilization of jarosite residue for multiple purposes. Jarosite utilization has been studied by many researchers [8,9,10,11,12] aiming to use it in sulfoaluminate cement production [8], ordinary Portland cement production [9], brick production [10], glass and glass ceramic materials [11] or silver recovery [12]. Among these purposes, decomposition, especial thermal decomposition of jarosite residue, is the prerequisite step for comprehensive jarosite reuse and waste minimization. As a result, the study on thermal decomposition of jarosite residue is of great importance to understanding the reaction process in the utilization of jarosite residue with multiple purposes. Many sorts of jarosite, such as potassium and sodium jarosite [13], ammoniojarosite [14], hydronium jarosite and ammoniojarosite [15], argentojarosite [16] and Pb-jarosite [17] have been synthesized in laboratories and put to thermal decomposition study. However, to the authors’ knowledge, very few reports are available on the decomposition of commercial plant jarosite residue, which is of great importance for the industry’s utilization of jarosite residue. In this work, the thermal decomposition process of a commercial plant jarosite residue is studied.

2. Experimental

2.1. Materials

The jarosite residue sample was collected from a zinc plant in Inner Mongolia autonomous region, China. The sample was air-dried at room temperature, ground with ceramic balls and and size fraction in range of 35–75 μm, which mixed and homogenized using coning and quartering methods and stored in polyethylene containers for use.

2.2. Chemical Analysis of Elements and Constitutes

The chemical composition of the jarosite samples was determined by treating a 0.3 g sample with HCl/HF/HNO3/H3BO3 acid mixture using digestion method at about 210 °C until the digested solution was clear [18]. Digestion solutions were measured for total metal content using inductively coupled plasma optical emission spectrometry (ICP-OES) (Agilent Technologies Inc., Santa Clara, CA, USA). All reagents used in this work were of analytical grade and used without any further purification. A sequential extraction process, improved from the modified BCR (chemical successive extraction) three-step sequential extraction procedure [18], was used to determine the content of various phases in the jarosite residue. Firstly, a diluted ammonium acetate solution was used to extract easily dissolved components in the residue, such as zinc hydroxide, zinc sulfate, copper hydroxide and copper sulfate. Then, a diluted nitric acid and hydrogen peroxide solution was used to extract zinc sulfide and other metal sulfides. In the last step, 10% nitric acid solution was used to dissolve jarosite. The remained residue (spinel phase) was extracted by fused with sodium hydroxide.

2.3. Mineralogical Characterization

Mineralogical composition of the jarosite tailing waste samples was determined through powder X-ray diffraction (Cu Kα1, D8 Advance, Bruker, Bremen, Germany). The microstructure, morphology, surface texture and elemental composition of jarosite waste samples were analyzed using a scanning electron microscope (SEM) (Zeiss UltraPlus, Jena, Germany) equipped with EDS.

2.4. Thermogravimetric Analysis-Differential Scanning Calorimetry (TG-DSC) Analysis

TG-DSC was performed on an apparatus (SDT Q600, TA USA, Inc.). The carrier gas was nitrogen flowing at 100 mL·min−1. The heating rates were set at 5, 10, 15 and 20 °C·min−1, respectively. TG was used to recorded weight loss and DSC was used to determine endothermic and exothermic heat effects accompanying physical or chemical changes in the sample.

3. Results and Discussion

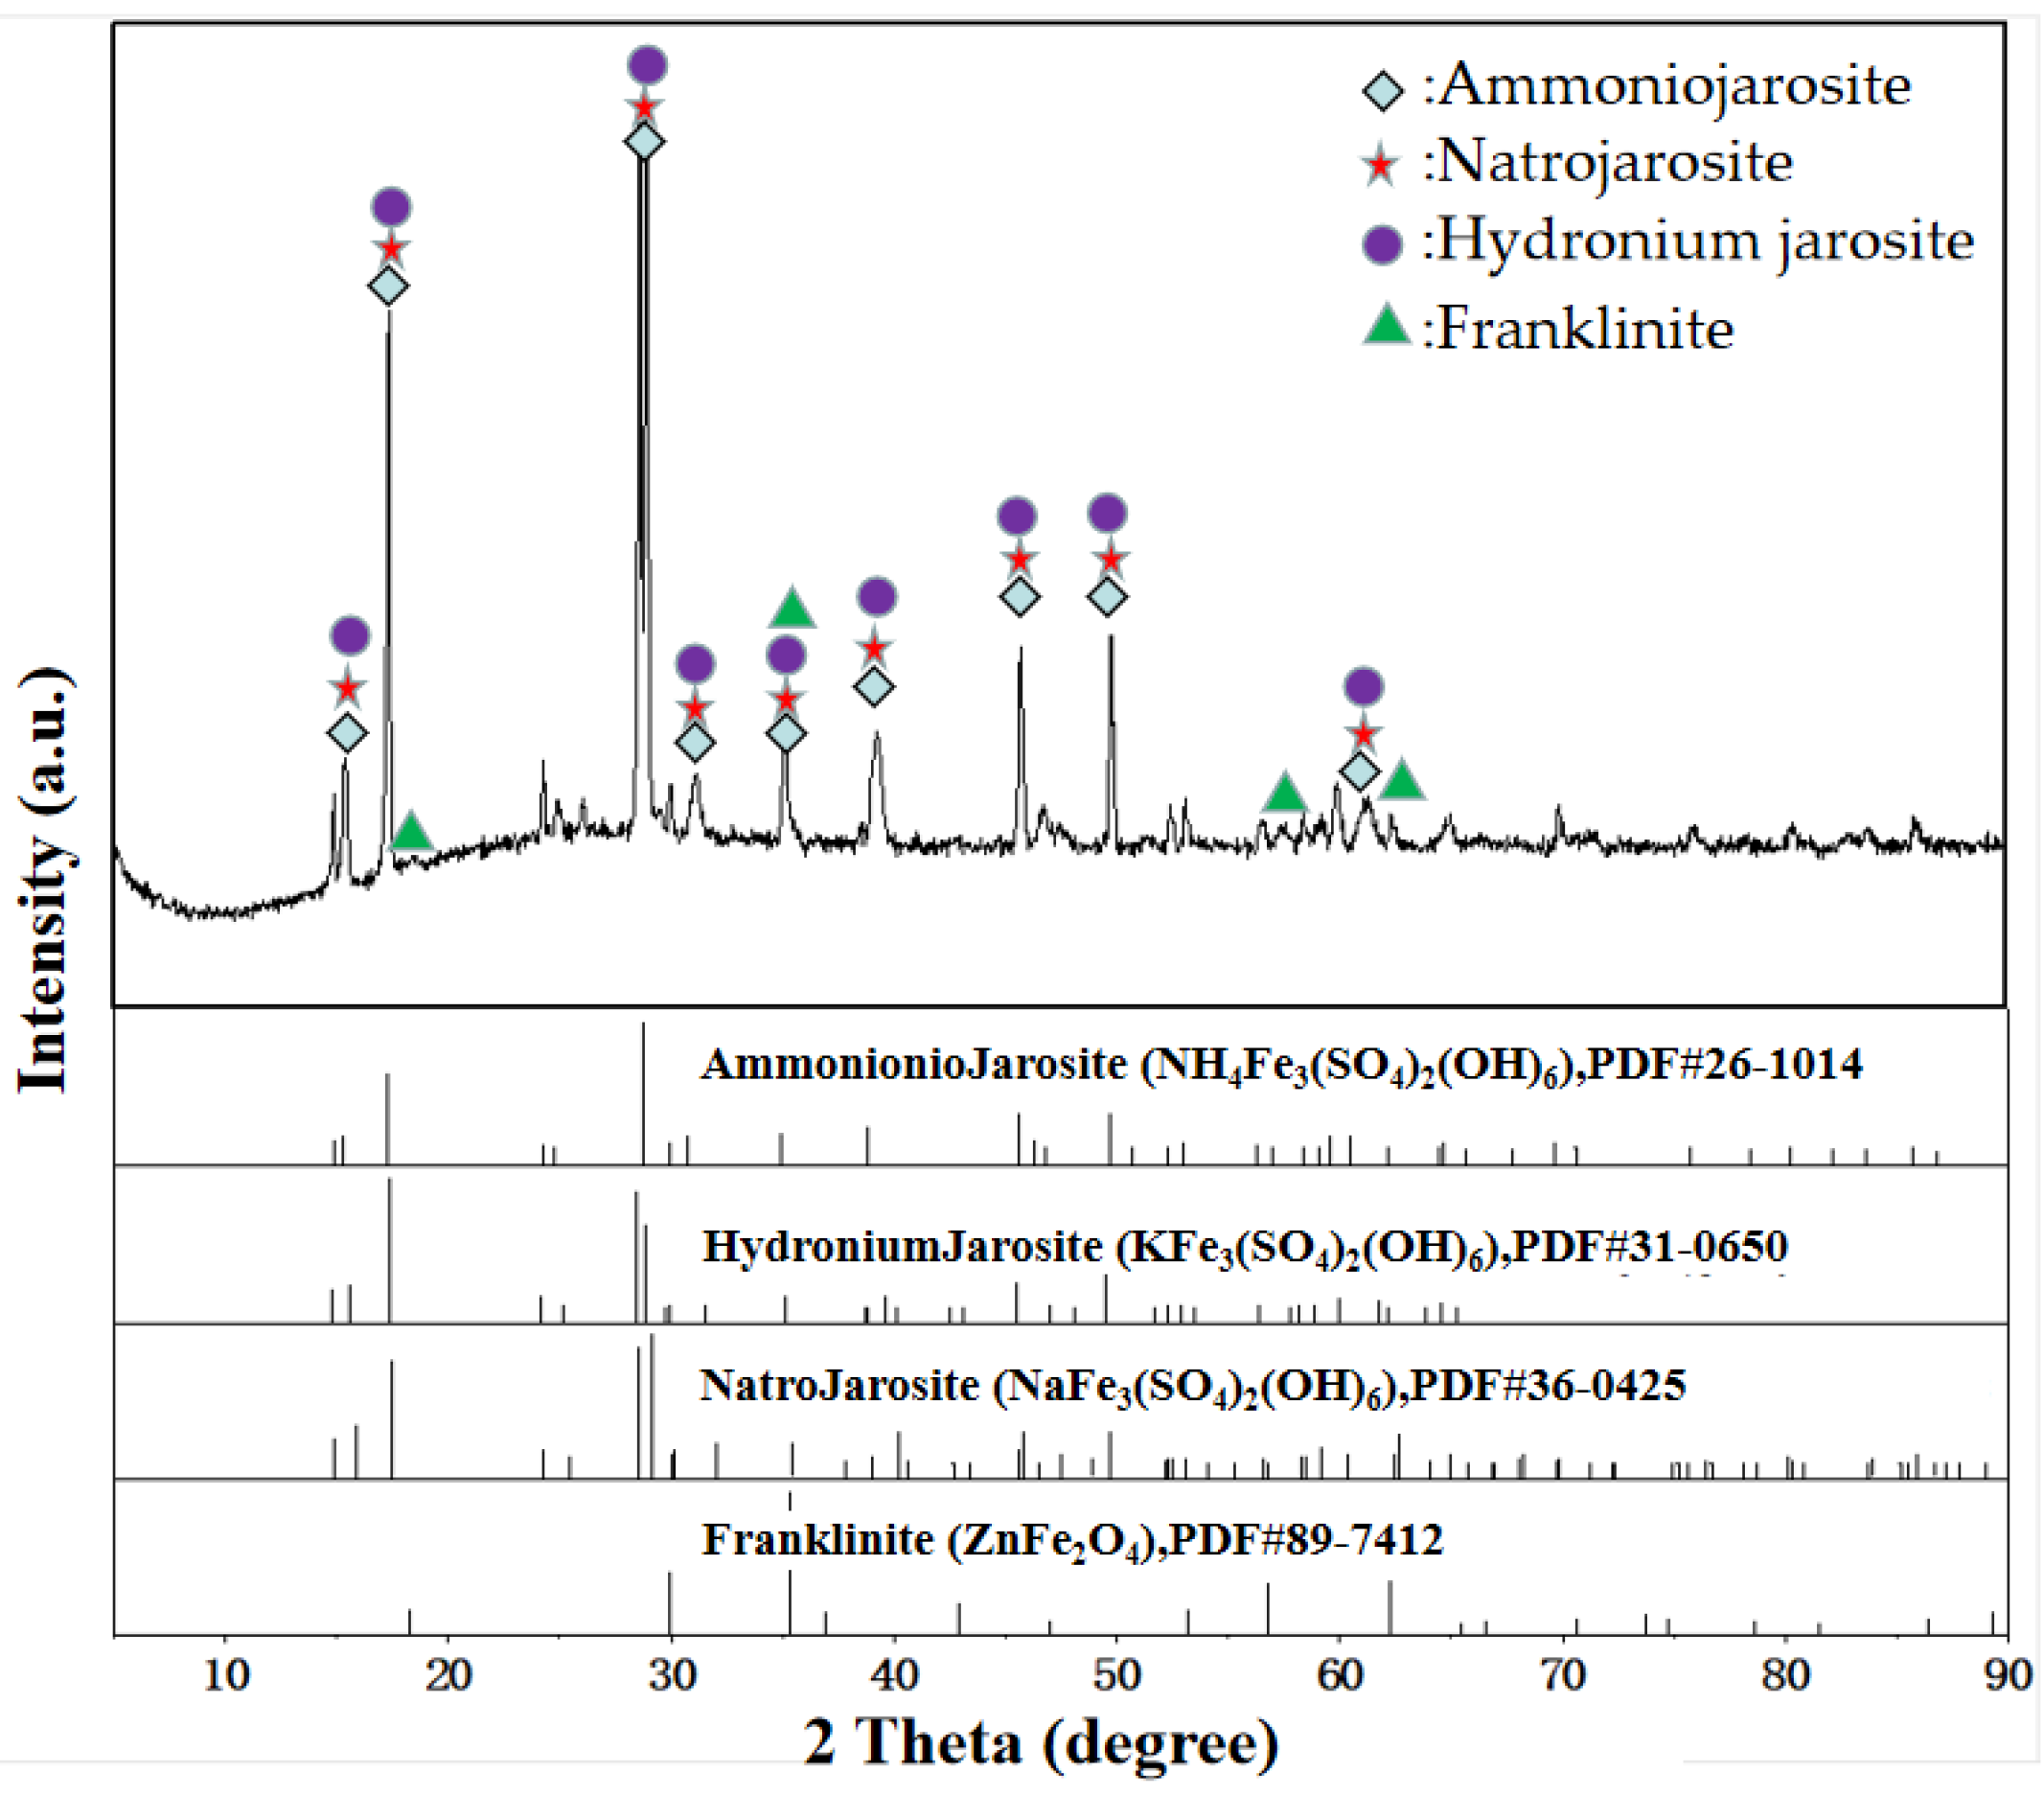
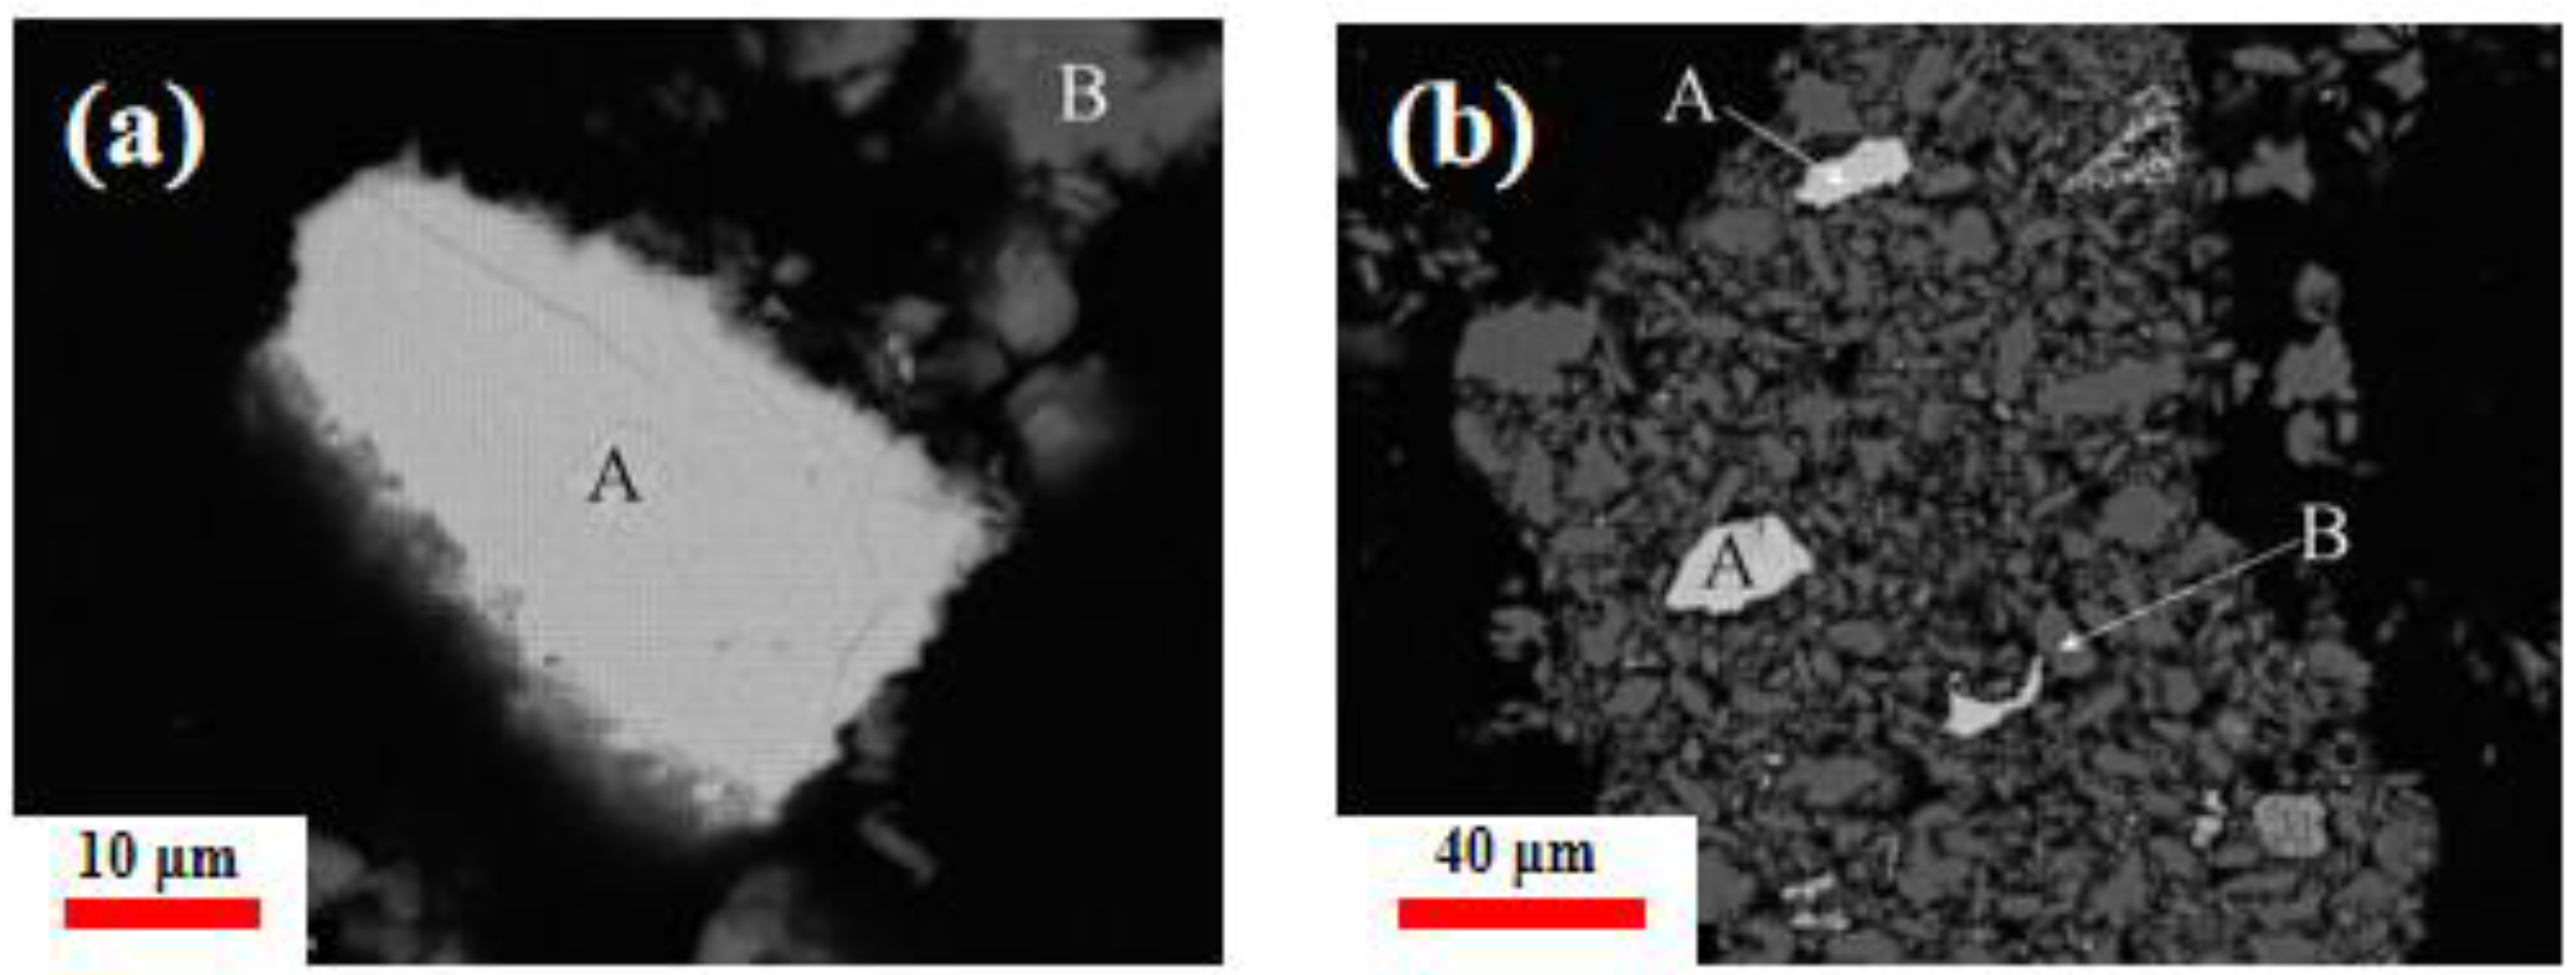
3.1. Mineralogical Characterization

It can be seen from the XRD pattern (Figure 1) that the sample is a mixture of various jarosite crystals, composed of natrojarosite, ammoniojarosite and hydronium jarosite. It agreed with the practice of the commercial jarosite precipitation process on site, in which sodium bicarbonate and ammonium bicarbonate are both used as jarosite precipitation agents. Beside these mixed jarosite phases, small amount of spinel phase was also observed, which can be reasonably viewed as the remaining residue resulting from partially consumed calcine in the pre-neutralization step.
SEM analysis was carried out on aggregated jarosite. Besides the primarily normal grey phase B in Figure 2, a small amount of white area A was also observed. Figure 3 shows the EDS analysis results of spectra A and B. The weight fraction of Zn to S in particle A is 0.92:1.06, suggesting that the particle of A is sphalerite. From the XRD results, it is clear that the main components of the sample are natrojarosite, ammoniojarosite and hydronium jarosite. Combined with the results of the elements detected by the EDS tests, it can be concluded that phase B is probably jarosite phase and a little amount of zinc-bearing compound.

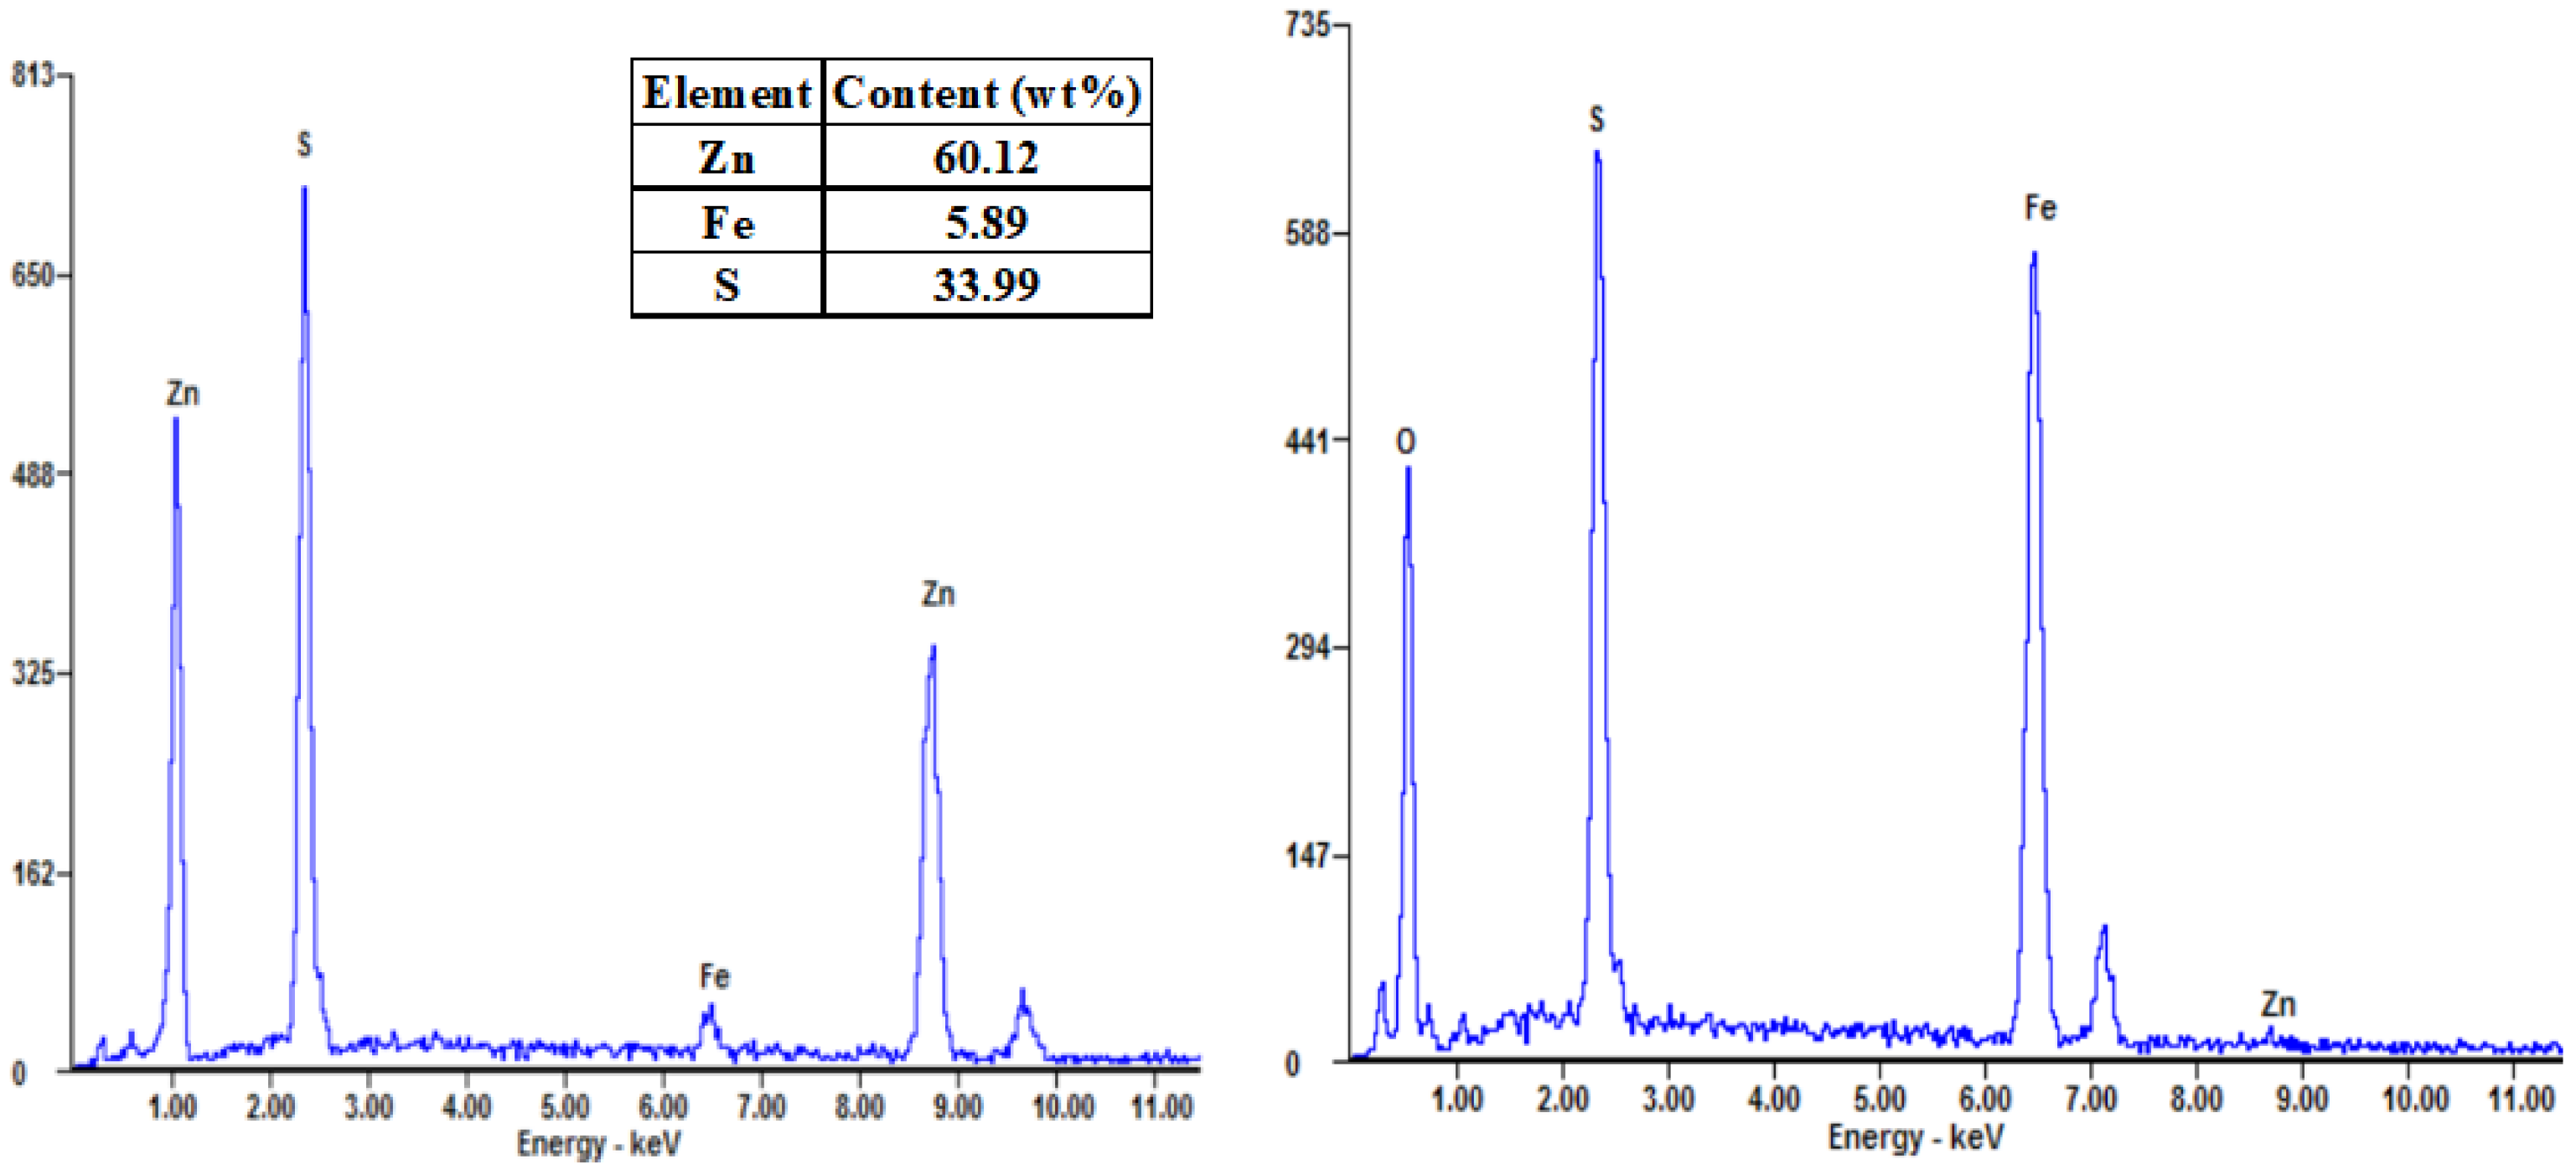
3.2. Chemical Composition

The results of the XRF spectroscopy qualitative analysis in Table 1 are in agreement with the results of the above XRD and EDS in the mineralogical characterization section. In addition, Table 1 also shows some information on the valuable elements in the jarosite sample. Quantitative assay results of the main relevant elements’ content in the residue samples are summarized in Table 2. The results of the sequential extraction process are shown in Table 3, which demonstrates more detailed information about the occurrence state of the relevant elements.
According to Table 3, iron can exist in the form of AFe3(OH)6(SO4)2, Fe2(SO4)3 and ZnFe2O4 in the jarosite residue, and the distribution ratio of iron in the above phases were set to be p, q and r, respectively. Zn2+ does not belong to the ions of jarosite formation, and the Zn2+ in jarosite’s components can be divided into two parts. The first part is the entrained ZnSO4 during jarosite precipitation. The other part includes ZnFe2O4 and ZnS and results from the incompletely consumed calcine in the pre-neutralization process before jarosite precipitation. Therefore, the distribution of total zinc can be divided into ZnSO4, ZnS and ZnFe2O4 and their distribution ratio m, n and r, respectively. Other valuable elements, such as copper, lead and silver only account for a very small proportion and can be ignored. Then, the distribution of the element sulfur can also be divided into Fe2(SO4)3, ZnSO4, ZnS and AFe3(OH)6(SO4)2, and their distribution ratio can be set as q, m, n and p, respectively. Then, the moles balance in elements Fe, Zn and S in the present sample will obey the following relationship for 100 g of jarosite residue sample based on the data in Table 2 and Table 3, as shown in Equations (1)–(5).
3   ×   p + 2   ×   q + 2   ×   r = 0 . 518  
m + n + r = 0 . 0473
2   ×   p + 3   ×   q + m + n = 0 . 403  
m   :   n   :   r = 88 . 34   :   5 . 83   :   5 . 83
p   :   q   :   r = 86 . 10   :   12 . 41   :   1 . 49  
By solving the above equations, the values of p, q, m, n and r are calculated to be 0.164, 0.0098, 0.0418, 0.00276 and 0.00276, respectively. As a result, 100 g of jarosite residue sample contain 0.164 mole of AFe3(OH)6(SO4)2, 0.0098 mole of Fe2(SO4)3, 0.0418 mole of ZnSO4, 0.00276 mole of ZnS and 0.00276 mole of ZnFe2O4. In other words, there are about 79.49 g of AFe3(OH)6(SO4)2, 3.92 g of Fe2(SO4)3, 6.75 g of ZnSO4, 0.27 g of ZnS and 0.67 g of ZnFe2O4 in 100 g of jarosite residue sample when converting moles into grams. In addition to the above components, there is about 8.90 wt.% of the sample which can be arranged into the other categories. These can be divided into combined water and other metal oxides, which are neglected in the above calculation process. As the second significant component, it is reasonable to estimate that the entrained ZnSO4 contains crystal water during jarosite precipitation and exists as ZnSO4·7H2O. Accounting for the fact that the jarosite sample has undergone drying at 100 °C for 24 h, ZnSO4·7H2O will lose about one crystal of water and exist as ZnSO4·6H2O, based on the decomposition process study of ZnSO4·7H2O [19,20]. It accounts for 4.52 wt.% of the jarosite sample. Certainly, as the third significant component, ferric sulfate can also contain some crystal water. However, the water associated with ferric sulfate can be removed at above 95 °C. Therefore, the ferric sulfate component is converted into anhydrous phases during the drying process. Then, the rest of the part, about 4.38 wt.% of the total residue, may be attributed to inert metal oxides, as shown in Table 1. ZnS and ZnFe2O4 can be viewed as inert components during the thermal decomposition of the jarosite sample under nitrogen atmosphere. As a result, all the inert components account for 5.32 wt.% of the sample. As for jarosite component AFe3(OH)6(SO4)2 (A represents Na+, NH4+ and H3O+), it can be rewritten into Naa(NH4)b(H3O)cFe3(OH)6(SO4)2. According to the sodium content in jarosite samples, the value of a is calculated to be 0.42. In the zinc plant precipitation process, the consumed amount of ammonium bicarbonate is three times that of sodium bicarbonate. Consequently, we can postulate that almost all of the rest is ammoniojarosite, and the value of equals 0.58. The jarosite component can be expressed as Na0.42(NH4)0.58Fe3(OH)6(SO4)2. Then, the constitution of the jarosite residue sample is shown in Table 4.

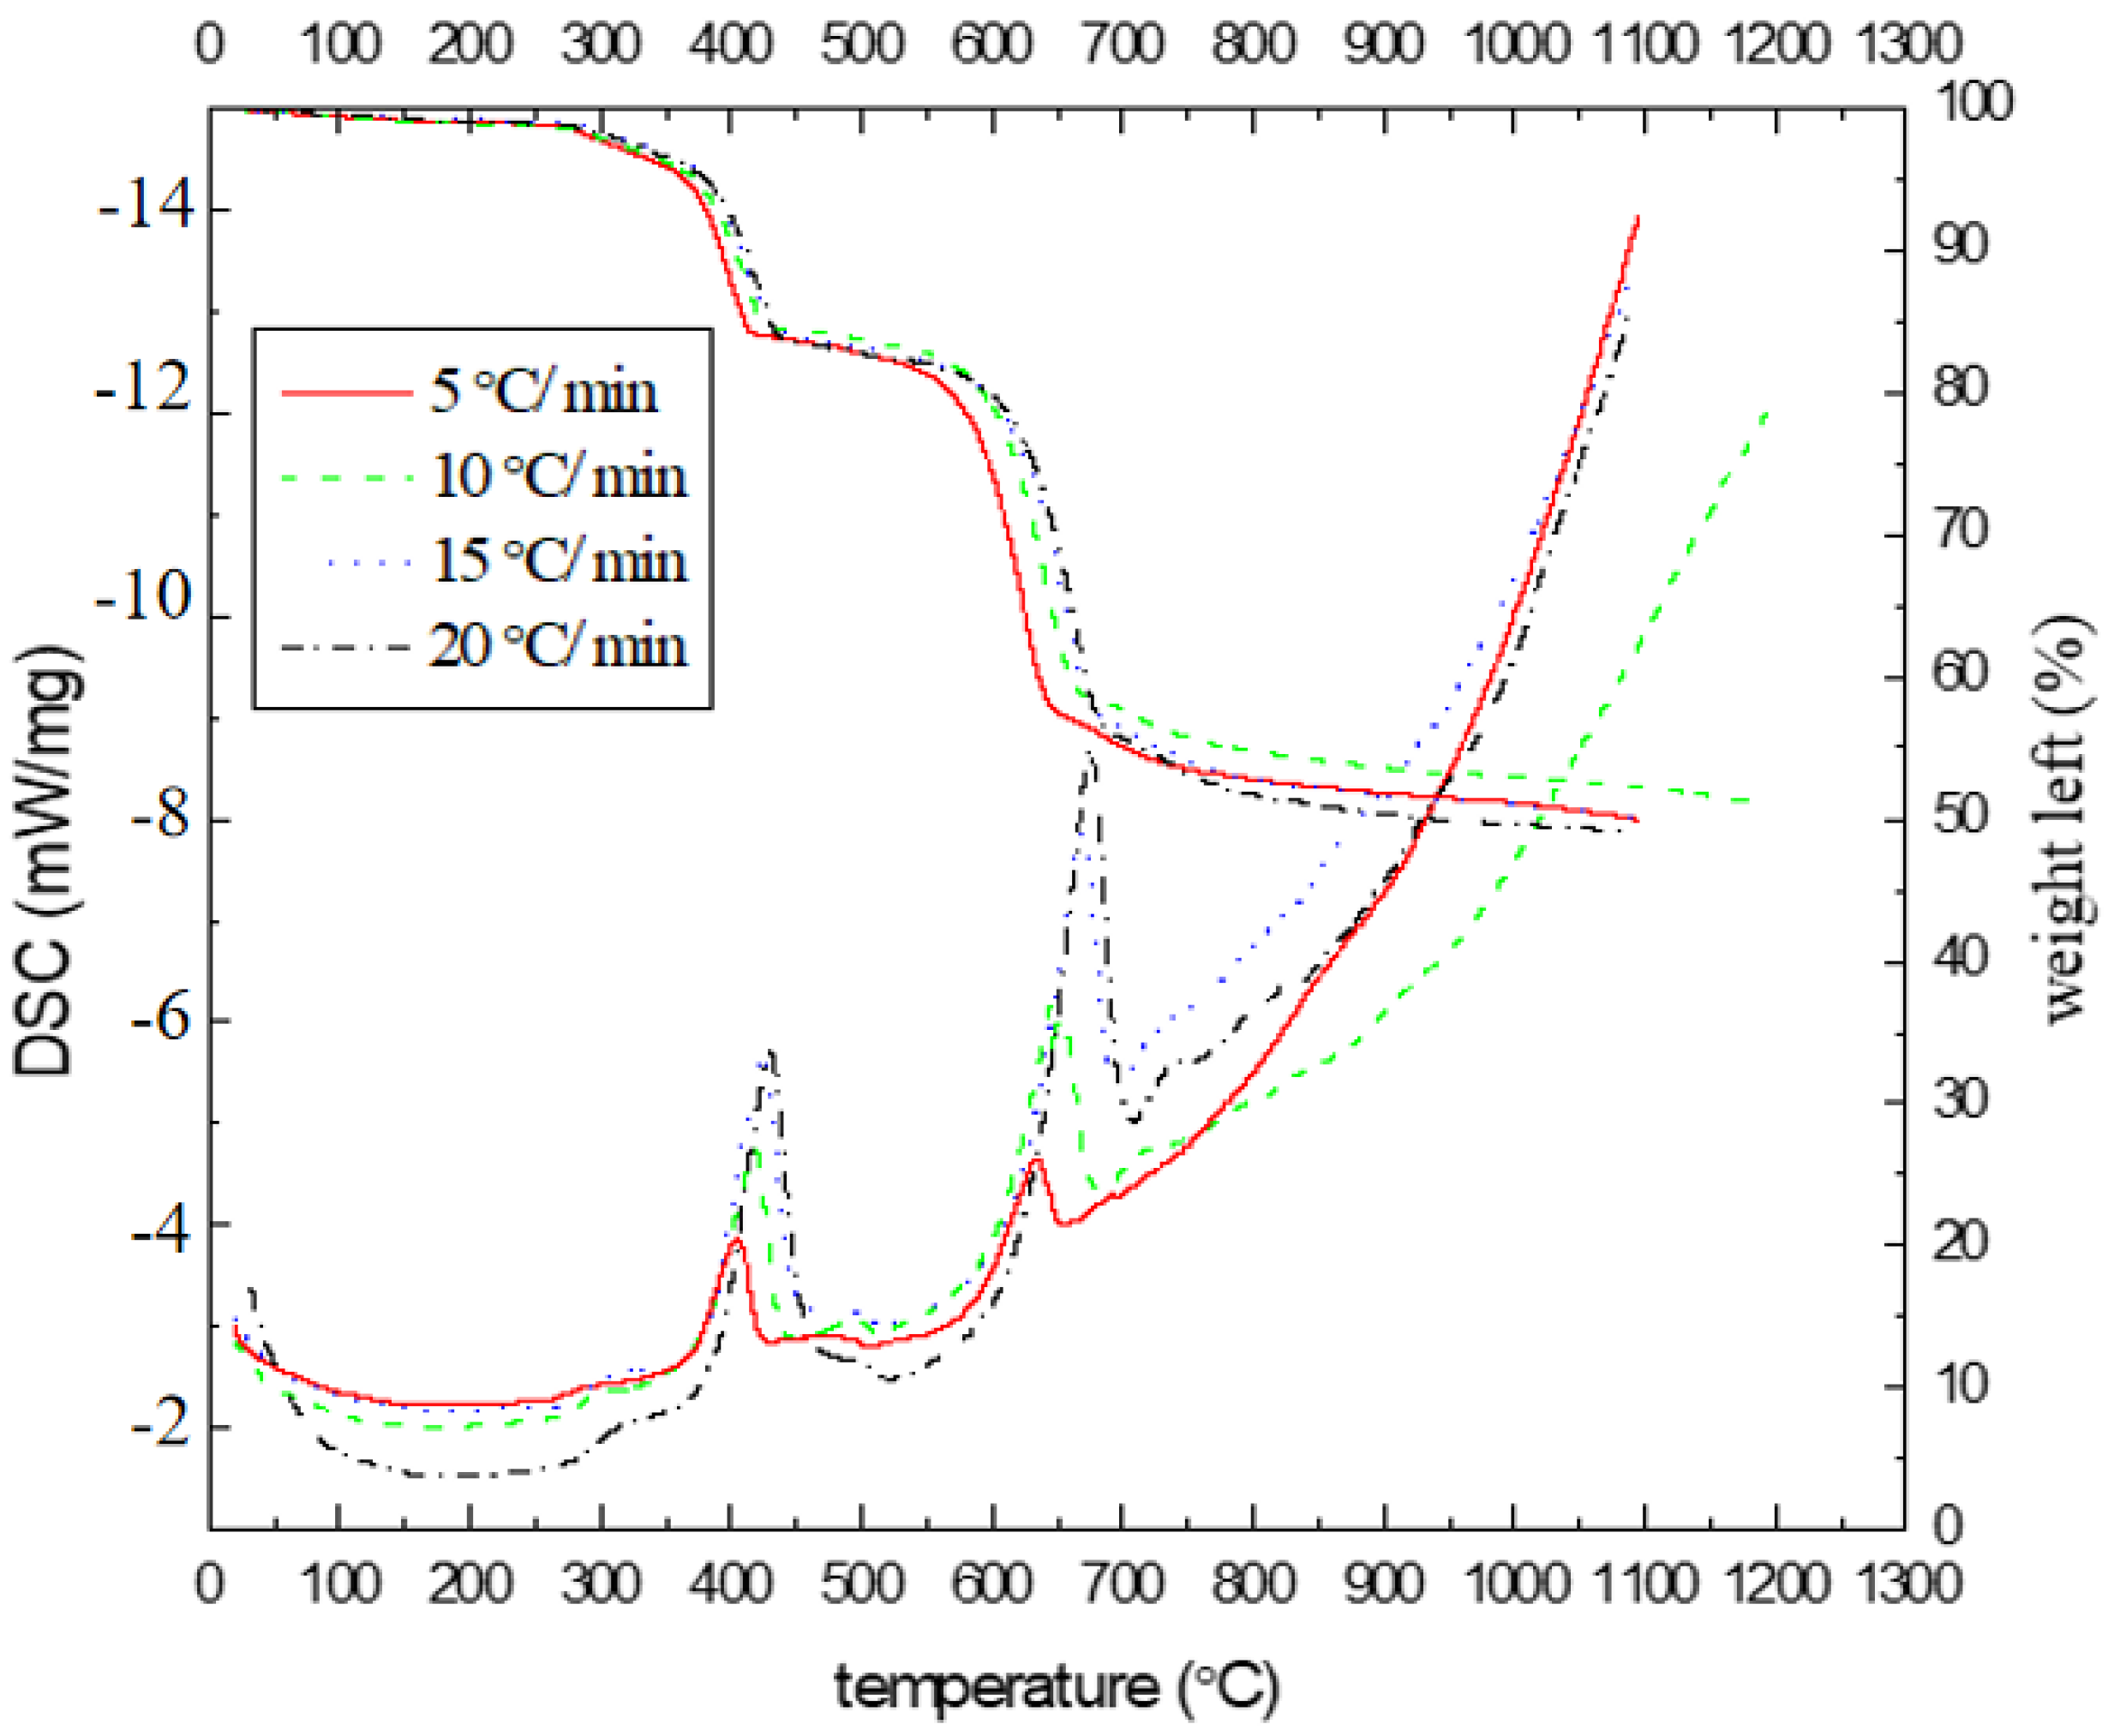
3.3. Thermal Decomposition Mechanism of Jarosite Residue

Figure 4 shows the TG-DSC curves of jarosite residue at different heating rates. Generally, all samples lost about half of their weight at 1100 °C, regardless of the heating rate. For natrojarosite, ammoniojarosite and hydronium samples, the molecules’ weight fell into the range of 479.74 to 484.70, with an average value of 482.22. Fe and Zn are the main metal components in the jarosite residue, and they are in the state of Fe2O3 and ZnO after the final jarosite decomposition. The molecule weight of Fe2O3 and ZnO were 159.69 and 81.38, respectively. When all the Fe and Zn elements were finally converted into Fe2O3 and ZnO, the remaining weight of Fe2O3 was 49.67% of the weight of Na0.42(NH4)0.58Fe3(OH)6(SO4)2, and ZnO took up 50.41% of the weight of another significant component, ZnSO4, in the jarosite sample. The final mass loss is calculated to be about half of this jarosite sample. It is in accordance with the experimental result of the thermal decomposition study.
As for the research mechanism of the present jarosite residue, although the thermal decomposition process of jarosite has been researched extensively, most of the reported works used TG-DTG (Thermogravimetric analysis–derivative thermogravimetry) or TG-DTA (Thermogravimetric analysis–differential thermal analysis) methods. The TG-DSC method was rarely reported. The reported thermal decomposition experiments and TG~DTA research works were often supplemented with infrared emission spectroscopy (IES) and Mössbauer spectroscopy methods, which provide more helpful information about both the resultant solid intermediates and evolved gases. Then, the thermal decomposition reactions in each decomposition step of jarosite can be deduced. In this study, the jarosite decomposition process can be studied by comparing the present TG-DSC results with other reported works on ammonium jarosite and sodium jarosite. Therefore, the thermal decomposition mechanisms of ammonium jarosite and sodium jarosite should be examined firstly.

3.3.1. Thermal Decomposition Mechanism of Ammonium Jarosite

Several researchers have reported in detail the thermal decomposition process of ammonium jarosite [10,14,21,22]. However, the descriptions about the decomposition mechanism often differ from each other. This divergence might come from the preparation of jarosite samples or the identification of process intermediates. For example, ammonium jarosite samples often contain small amount of contaminated water, which affects the results of mass loss in TG analysis. Previous reports show that if the jarosite samples are prepared at higher temperature, less contaminated is water retained in the jarosite precipitates [10,22], and the temperatures both for dehydroxylation and desulfonation rise. Even under the same preparation temperature, a long duration of the drying process above 100 °C also can remove most of the contaminated water in jarosite precipitates [14,21].
In general, the jarosite decomposition process includes four main steps, namely dehydration (up to 120 °C), dihydroxylation (260 °C), deammoniation (389 °C) and desulfonation (510 °C and 541 °C), in sequence when the temperature increases. A thermal decomposition process mechanism of ammonium jarosite was outlined as following by Ray L. Frost et al. based on their TG-DTA research workssupplemented with Mass spectrometry through evolved gases [14].
NH 4 Fe 3 SO 4 2 OH 6 · xH 2 O NH 4 Fe 3 SO 4 2 OH 6 + xH 2 O
NH 4 Fe 3 SO 4 2 OH 6 NH 4 FeO 3 SO 4 2   + 3 H 2 O
NH 4 FeO 3 SO 4 2 NH 3 + 3 H 2 O + 3 Fe 2 SO 4 3
2 Fe 2 SO 4 3 Fe 2 O 3 + Fe 2 SO 4 3 + 3 SO 2
However, Equation (9) is not in balance. Meanwhile, it is also apparent that Fe2(SO4)3 should not be the decomposition product of Fe2(SO4)3. The accurate equation describing the reaction process in desulfonation step can be rewritten as Equations (10) and (11), based on the likely decomposition intermediates identified by 57Fe Mössbauer spectroscopy in this temperature range [21]. This revision makes it more reasonable to explain the two endothermic peaks at 510 °C and 541 °C. The two endothermic peaks suggested that the desulfonation process takes place in two steps, as in Equations (10) and (11).
2 Fe 2 SO 4 3 Fe 2 O 3   + Fe 2 O SO 4 2   + 4 SO 2 + 2 O 2
Fe 2 O SO 4 2 Fe 2 O 3 + 2 SO 2 + O 2
Among these four steps, dehydration occurs in the initial low temperature range. No corresponding significant endothermic peaks in DTG or DTA curves were observed. It is not an important part of the decomposition of jarosite and usually can be neglected. The followed dihydroxylation and deammoniation processes are often accompanied by an obvious mass loss in the corresponding TG curve. However, the temperatures for these two processes are close, and consequently, it is often difficult to distinguish them in the TG curve. Therefore, sometimes, these two processes are treated as one step in dynamic analyses.

3.3.2. Thermal Decomposition Mechanism of Sodium Jarosite

Similar to the thermal decomposition process of ammonium jarosite, the thermal decomposition process of sodium jarosite also contains two significant mass loss steps, in which dehydroxylation and the removal of sulfate take place. However, the deammoniation step does not exist in the thermal decomposition process of sodium jarosite.
To improve the comparability of the research results, we also chose those studies in which the preparation conditions were similar to the sample in this study. J. Michelle Kotler et al. reported the thermal decomposition behavior of synthesized sodium jarosite, in which the thermal decomposition process was divided into four steps [13]. In the first step (252~371 °C), a 2.39% mass loss was observed. It can be viewed as the removal of “excess water”. A mass loss of 10.17% was obtained in the second step (371~453 °C). This huge mass loss roughly matches that of dehydroxylation, which results in a mass loss of 11.14% in theoretical study. In the third step, a mass loss of 2.95% was observed under a long range of temperature (453~590 °C). Finally, a mass loss of 24.40% was obtained in the last weight loss step (590~762 °C). It can be attributed to desulfonation, which results in a mass loss of 33.03% in theoretical study.
In another research work, R.L. Frost et al. [23] studied the thermal decomposition process of natural sodium jarosite. Electron probe analysis showed that the Na-jarosite contains 17% potassium. Thus, the formula of the Na-jarosite would be better written as (K0.17Na0.83)2Fe6(SO4)4(OH)12. The TG-DTG analysis of natural Na-jarosite shows the mass loss steps as following. Mass loss steps are observed at (a) 215 and 230 °C, (b) 316 and 352 °C and (c) 555, 575 and 595 °C. The ion current curves shows that water vapor is the evolved gas at the (a) and (b) stages, whereas SO2 is released at the stage (c). A 4% mass loss was observed due to water loss at 215 and 230 °C, and this water may be described as ‘excess water’. The theoretical mass loss of Na-jarosite, based on the formula Na2(Fe)6(SO4)4(OH)12, is 11.13%. Besides the initial 4% mass loss, the mass loss at 316 and 352 °C is 10%. This value is close to the theoretical value. The reaction may be summarized as reaction (12):
Na 2 Fe 6 SO 4 4 OH 12 2 NaFe SO 4 2 + 2 Fe 2 O 3 + 6 H 2 O
From the studies described above, both impure natural Na-jarosite and synthetic Na-jarosite have similar thermal decomposition behaviors, as indicated by the TG curves; however, many differences exist in the DTG curves. For example, there is just one endothermic peak (265 °C) appearing below 300 °C for synthetic Na-jarosite, while two endothermic peaks (215 °C, 230 °C) appeared for natural Na-jarosite. This differs from the constitution of natural Na-jarosite, which contains about 17% K. In fact, the peak at 215 °C for natural Na-jarosite shows one of the characteristic peaks of K-jarosite at 216 °C. The peak at 230 °C showing the characteristic peak of the natural Na-jarosite sample was negative moved to 35 °C from 265 °C for synthetic Na-jarosite. Secondly, there are also two endothermic peaks (316 °C, 352 °C) for natural Na-jarosite within the range of 300~500 °C. However, there is only one endothermic peak (425 °C) for synthetic Na-jarosite. This can be attributed to the front peak weakening into a shoulder at 392 °C for synthetic Na-jarosite. Then, both peaks for natural Na-jarosite were negatively moved to 76 °C and 73 °C from 392 °C and 425 °C, respectively. Finally, there are also three endothermic peaks (555 °C, 575 °C, 595 °C) for natural Na-jarosite above 500 °C. Here again, peaks at 555 °C and 595 °C showed the characteristics of K-jarosite at 556 °C and 598 °C, respectively. Only the peak at 575 °C shows characteristics of Na-jarosite. As for synthetic Na-jarosite, the only one peak above 500 °C appears at 665 °C. The last characteristic peak for natural Na-jarosite was negatively moved 90 °C from 665 °C for synthetic Na-jarosite. All the characteristic peaks of natural Na-jarosite negatively moved to a different extent from those of synthetic Na-jarosite. It means that the impure mixture of K-jarosite and Na-jarosite is easier to be thermally decomposed than synthetic Na-jarosite.

3.3.3. Thermal Decomposition Mechanism of Commercial Jarosite Sample

According to the decomposition process and the products escaped, the theoretical mass loss resulting from these escaped products can be calculated based on Table 4.
The DSC-TG curves of the commercial jarosite residue are shown in Figure 4. Four mass loss steps can be observed for the thermal decomposition of commercial jarosite residue. Take the curve with the heating rate of 5 °C /min for example, when temperature increases from ambient to 270 °C, the weight drops very slowly and a little mass loss (1.3%) is observed up to 270 °C. The mass loss within this low temperature range should be attributed to the removal of excess water in the crystal structure in the present jarosite sample. Heating it up to 373 °C, a smooth weight drop of 3.6% at a faster rate was observed. The mass loss within this low temperature range should be attributed to the removal of crystal water in the present jarosite sample. The total mass of water in the present sample was about 4.9%, which matches the water mass 4.38% in the estimation of mineralogical components mentioned before.
When temperature increased continuously from 373 °C to 420 °C, the weight dropped substantially with a mass loss of 11.1% in the range of 373 °C~420 °C. At the same time, the first significant endothermic peak in the DSC curve appears at 405 °C. It corresponds to the mass loss of the dihydroxylation and deammoniation process. The theoretical mass loss of dihydroxylation in jarosite and ammonium is about 8.91% and 1.63%, respectively. The total theoretical mass loss is 10.54%, which is basically in accordance with the actual mass loss within this temperature range. The excess mass loss can be attributed to the sequential removal of crystal water in ZnSO4·xH2O [19,24]. Above 420 °C, another slow weight loss process was observed. There is a mass loss of 2.50% between 420 °C and 550 °C.
The second significant endothermic peak in the DSC curve appeared at 635 °C. The second severe mass loss stage lasted from 550 °C to 750 °C and the total mass loss reached up to 27.77%, which corresponds with the mass loss of desulfonation in component jarosite and component ferric sulfate. All sulfur in component jarosite and component ferric sulfate accounts for 11.50% of the sample mass. If all the sulfur evolves as SO3, the mass loss is 28.74%, which is close to the actual mass loss, suggesting that the decomposition process is almost completed. In the last stage of 750 °C~1096 °C, the desulfonation of component zinc sulfate takes place [19,24] with a mass loss of 3.34%, which matches the actual mass loss of 3.62% well. As shown in Table 5, when the temperature increased from ambient to 1096 °C, the liberated gases in the jarosite residue sample was NH3, H2O and SO3, and the valorization of NH3 and SO3 was 33.75%.

4. Conclusions

The mineralogical and TG-DSC study was carried out on commercial jarosite residue. The results showed that there were about 79.49 wt.% of AFe3(OH)6(SO4)2, 3.92 wt.% of Fe2(SO4)3, 6.75 wt.% of ZnSO4, 0.27 wt.% of ZnS and 0.67 wt.% of ZnFe2O4 in the present jarosite residue sample. Beside these compounds, there was also about 4.52 wt.% of crystal water and 4.38 wt.% of other oxides.
According to the TG-DSC results, the thermal decomposition process of present commercial jarosite residue samples includes five important steps, namely the removal of excess water and crystal water (up to 373 °C, with a 4.9% mass loss), dihydroxylation and deammoniation (from 373 °C to 420 °C, with an 11.1% mass loss), desulfonation of component jarosite and desulfonation of component zinc sulfate. The TG-DSC results match with the mineralogical analysis well. The liberated gases in the jarosite residue sample were NH3, H2O and SO3, and the valorization of NH3 and SO3 was 33.75%.

Author Contributions

Conceptualization, Methodology, Validation, Formal analysis, Investigation, Data curation, Writing—original draft, D.L.; Investigation and Data curation, Y.F. and Y.C.; Conceptualization, Methodology, Writing—review and editing, Supervision, Project administration, Funding acquisition, Y.B. and F.X.; Formal analysis, Investigation, Funding acquisition, Y.B. and W.W.; Formal analysis and Investigation, Y.H. All authors have read and agreed to the published version of the manuscript.

Funding

The project was financially supported by Fundamental Research Funds for Central Universities of China (N140108001).

Institutional Review Board Statement

Not applicable.

Informed Consent Statement

Not applicable.

Data Availability Statement

The data that support the findings of this study are available from the corresponding author, Yunlong Bai and Wei Wang, upon reasonable request.

Acknowledgments

This research was funded by Yunlog Bai and Wei Wang, grant number N140108001. And the APC was funded by Yunlong Bai.

Conflicts of Interest

The authors declared that they have no known competing financial interests or personal relationships that could have appeared to influence the work reported in this paper.

References

  1. Vu, H.; Jandava, J.; Hron, T. Recovery of pigment-quality magnetite from jarosite precipitates. Hydrometallurgy 2010, 101, 1–6. [Google Scholar] [CrossRef]
  2. Rathore, E.N.; Patil, M.P.; Devendradohare, E.; Publication, I. Utilization of jarosite generated from lead-zinc smelter for various applications: A Review. Int. J. Civ. Eng. Technol. 2014, 5, 192–200. [Google Scholar]
  3. Ismael, M.R.C.; Carvalho, J.M.R. Iron recovery from sulfate leach liquors in zinc hydrometallurgy. Miner. Eng. 2003, 16, 31–39. [Google Scholar] [CrossRef]
  4. Moors, E.H.M. Metal Making in Motion (Technology Choices for Sustainable Metals Production); Delft University Press: Delft, The Netherlands, 2000. [Google Scholar]
  5. Dutrizac, J.E.; Jambor, J.L. Jarosites and their application in hydrometallurgy. Rev. Mineral. Geochem. 2000, 40, 404–452. [Google Scholar] [CrossRef]
  6. Dutrizac, J.E. Jarosite-Type Compounds and Their Application in the Metallurgical Industry; Hydrometallurgy Research, Development and Plant Practice; The Metallurgical Society of AIME: Warrendale, PA, USA, 1982; pp. 531–551. [Google Scholar]
  7. Li, X.-L.; Liu, S.-P.; Yan, L.; Wang, H.-B. Study on the Leaching Process of Jarosite and Zinc Concentrate. China Resour. Compr. Util. 2012, 30, 25–27. (In Chinese) [Google Scholar]
  8. Katsioti, M.; Tsakiridis, P.E.; Leonardou-agatzini, S.; Oustadakis, P. Examination of the jarosite-alunite precipitate addition in the raw meal for the production of sulfoaluminate cement clinker. J. Hazard. Mater. 2006, 131, 187–194. [Google Scholar] [CrossRef] [PubMed]
  9. Pappu, A.; Saxena, M.; Asolekar, R. Jarosite characteristics and its utilization potentials. Sci. Total Environ. 2006, 359, 232–243. [Google Scholar] [CrossRef] [PubMed]
  10. Das, G.K.; Anand, S.; Acharya, S.; Das, R.P. Preparation and decomposition of ammoniojarosite at elevated temperatures in H2O-(NH4)2SO4-H2SO4 media. Hydrometallurgy 1995, 38, 263–276. [Google Scholar] [CrossRef]
  11. Pelino, M. Recycling of zinc-hydrometallurgy wastes in glass and glass ceramic materials. Waste Manag. 2000, 20, 561–568. [Google Scholar] [CrossRef]
  12. Pappu, A.; Mohini, S.; Shyam, A. Hazardous jarosite use in developing non-hazardous product for engineering application. J. Hazard. Mater. 2006, 137, 1589–1599. [Google Scholar]
  13. Kotler, J.M.; Hinman, N.W.; Richardson, C.D.; Scott, J.R. Thermal decomposition behavior of potassium and sodium jarosite synthesized in the presence of methylamine and alanine. J. Therm. Anal. Calorim. 2010, 102, 23–29. [Google Scholar] [CrossRef]
  14. Frost, R.L.; Wills, R.A.; Kloprogge, J.T.; Martens, W. Thermal decomposition of ammonium jarosite (NH4)Fe3(SO4)2(OH)6. J. Therm. Anal. Calorim. 2006, 84, 489–496. [Google Scholar] [CrossRef] [Green Version]
  15. Spratt, H.; Rintoul, L.; Avdeev, M.; Martens, W. The thermal decomposition of hydronium jarosite and ammoniojarosite. J. Therm. Anal. Calorim. 2014, 115, 101–109. [Google Scholar] [CrossRef]
  16. Frost, R.L.; Wills, R.A.; Weier, M.L.; Martens, W. Thermal decomposition of synthetic argentojarosite-Implicationsfor silver production in medieval times. Thermochim. Acta 2005, 437, 30–33. [Google Scholar] [CrossRef] [Green Version]
  17. Forray, F.L.; Smith, A.M.L.; Drouet, C.; Navrotsky, A.; Wright, K.; Hudson-Edwards, K.; Dubbin, W. Synthesis, characterization and thermochemistry of a Pb-jarosite. Geochim. Et Cosmochim. Acta 2010, 74, 215–224. [Google Scholar] [CrossRef] [Green Version]
  18. Kerolli-mustafa, M.; Ćurković, L.; Fajković, H.; Rončević, S. Ecological Risk Assessment of Jarosite Waste Disposal. Croat. Chem. Acta 2015, 88, 189–196. [Google Scholar] [CrossRef]
  19. Pai, S.; Singh, J. Kinetics of thermal decomposition of ZnSO4·7H2O. Thermochim. Acta 1997, 292, 145–150. [Google Scholar]
  20. Liu, Y.; Wang, A.-L. Dehydration of Na-jarosite, ferricopiapite, and rhomboclase at temperatures of 50 and 95 °C: Implications for Martian ferric sulfates. J. Raman Spectrosc. 2015, 46, 493–500. [Google Scholar] [CrossRef]
  21. Ristić, M.; Musić, S.; Orehovec, Z. Thermal decomposition of synthetic ammonium jarosite. J. Mol. Struct. 2005, 744–747, 295–300. [Google Scholar] [CrossRef]
  22. Alonso, M.; López-delgado, A.; López, F.A. A kinetic study of the thermal decomposition of ammoniojarosite. J. Mater. Sci. 1998, 33, 5821–5825. [Google Scholar] [CrossRef]
  23. Frost, R.L.; Weier, M.L.; Martens, W. Thermal decomposition of jarosites of potassium, sodium and lead. J. Therm. Anal. Calorim. 2005, 82, 115–118. [Google Scholar] [CrossRef] [Green Version]
  24. Staminirova, T.; Petrova, N.; Kirov, G. Thermal decomposition of zinc hydroxy-sulfate-hydrate minerals. J. Therm. Anal. Calorim. 2016, 125, 85–96. [Google Scholar] [CrossRef]
Figure 1. XRD of jarosite residue.
Metals 13 00261 g001
Figure 2. SEM of polished piece of aggregated jarosite residue (a) and enlarged area (b) (A: Spectrum 1, B: Spectrum 2).
Metals 13 00261 g002
Figure 3. EDS results of micro area A (sphalerite) and B (right) in Figure 2.
Metals 13 00261 g003
Figure 4. TG and DSC curves of jarosite.
Metals 13 00261 g004
Table 1. XRF spectroscopy qualitative analysis.
ComponentContent(%)Detection LimitIntensityw/o Normal
Fe2O354.1288wt.%0.0198863.373344.5560
SO337.2005wt.%0.0477287.527730.6215
ZnO3.9986wt.%0.001984.09463.2915
SiO21.8368wt.%0.01597.06981.5120
Al2O30.9447wt.%0.01234.16040.7776
CuO0.2183wt.%0.00363.52250.1797
PbO0.4570wt.%0.00678.84990.3762
Table 2. Main relevant elements’ content in residue samples (%).
ElementFeSZnCuPbAg(g/t)Na
Content/% 28.9212.943.090.150.34461.6
Table 3. Distribution of main relevant elements in various components of jarosite residue (mass%).
ElementSulfates-HydroxidesSulfidesJarositesSpinelTotal
ContentRatioContentRatioContentRatioContentRatioContent
Zn2.4980.580.185.830.247.760.185.833.09
Cu0.0853.330.0213.330.0426.670.016.670.15
Pb0.0411.770.1235.290.1750.000.012.940.34
Ag *--4.08.7038.0082.614.08.7046
Fe3.5912.41--24.9086.100.431.4928.92
*: the unit of Ag content is in g/t.
Table 4. Estimated constitution of jarosite residue sample (mass%).
ComponentsNa0.42(NH4)0.58Fe3(OH)6(SO4)2Fe2(SO4)3ZnSO4H2O in ZnSO4Inert Part
Content (%)79.493.926.754.525.32
Table 5. Estimated mass loss (mass%) of escaped constitutes from jarosite residue sample.
Stage and Mass LossTemperature RangeStageJarositeFe2(SO4)3ZnSO4H2O in ZnSO4Estimated Mass Loss
79.493.926.754.52
(I): 4.90~373 °CRemove H2O---4.524.52
(II): 11.00373 °C~420 °CDeammoniation1.63---10.54
Dihydroxylation8.91---
(III): 27.77420 °C~550 °CDesulfonation26.42---28.77
--2.35---
(IV): 3.62750 °C~1096 °CDesulfonation--3.35-3.35
Disclaimer/Publisher’s Note: The statements, opinions and data contained in all publications are solely those of the individual author(s) and contributor(s) and not of MDPI and/or the editor(s). MDPI and/or the editor(s) disclaim responsibility for any injury to people or property resulting from any ideas, methods, instructions or products referred to in the content.

