Article

Effect of Boron Addition on the Oxide Scales Formed on 254SMO Super Austenitic Stainless Steels in High-Temperature Air

1
College of Materials Science and Engineering, Taiyuan University of Technology, Taiyuan 030024, China
2
Instrumental Analysis Center, Taiyuan University of Technology, Taiyuan 030024, China
3
Taiyuan Iron and Steel (Group) Company Ltd., Taiyuan 030024, China
4
School of metallurgy, Northeastern University, Shenyang 110167, China
*
Author to whom correspondence should be addressed.
Metals 2023, 13(2), 258; https://doi.org/10.3390/met13020258
Submission received: 20 December 2022 / Revised: 21 January 2023 / Accepted: 26 January 2023 / Published: 28 January 2023
(This article belongs to the Special Issue Corrosion and Protection of Stainless Steels)

Abstract

:
Focusing on the serious volatilization of MoO3 in super austenitic stainless steel with a high Mo content, the influence of B on the formation of oxide film and the distribution of Cr and Mo was investigated at 900 °C and 1000 °C. Without the addition of B, Mo tends to diffuse to the surface, forming porous Cr/Mo-rich oxides, causing the volatilization of Mo. The addition of B can inhibit the diffusion of Mo to the surface, facilitate the diffusion of Cr to the surface and combines with O, providing conditions for the nucleation of Cr2O3. A large amount of Cr2O3 accumulated on the surface to form a dense passive film, which inhibited the diffusion of Mo to the surface, reduced the loss of Mo, and formed Mo/Cr-rich precipitates at grain boundaries that are close to the surface. However, it was difficult to form Mo-rich precipitates at the grain boundaries of a sample without B, which aggravated the volatilization of Mo from grain boundary to surface. Therefore, the addition of B can improve the oxidation resistance of 254SMO and inhibit the volatilization of Mo.

1. Introduction

Super austenitic stainless steels (SASSs) have excellent corrosion resistance and mechanical properties due to their high Cr and Mo content, and are widely used in flue gas desulfurization, petrochemicals, and other corrosive fields [1,2,3]. However, SASSs with high Mo contents are prone to segregation and promote precipitation during hot working [4,5,6], which will reduce the hot workability of steel. In addition, in the previous production practice, alloys with a high Mo content suffered from serious oxidation during high–temperature heat treatment, with severe segregation and precipitation leading to more serious catastrophic oxidation due to the formation of volatile MoO3 when the temperature exceeds 800 °C [7,8]. There are three types of SASSs: 904L, 254SMO and 654SMO.
In order to improve the oxidation resistance of 254SMO, it is important to optimize the composition of SASSs. Based on the well-known “reactive element effect”, some rare earth elements (such as Ce, La and Y) are generally regarded as elements that can improve the oxidation resistance of stainless steel [9,10]. Zhang et al. [11] investigated the Y-containing 654SMO at 1200 °C in air, noting that the presence of Y can promote the selective oxidation of Cr and inhibit the outward diffusion of Mo. It has been studied that a small amount of boron (B) is beneficial to improving the mechanical properties and oxidation resistance of the alloys [12]. This improvement in oxidation resistance is attributed to the influence of B on the composition of oxide scales [13,14]. The addition of B in 254SMO has been proven to improve corrosion resistance and prevent precipitation of sigma phase [15,16].
For 254SMO, with its high Cr/Mo content, the sigma phase is the main precipitate after long-term high temperature treatment (650–1100 °C) [17]. The nucleation and growth of the sigma phase will affect the diffusion of the Cr and Mo elements, thus changing the growth and destruction mechanism of the oxide scales [18]. However, while research on the influence of B on the formation of oxide scales in the oxidation process of 254SMO is still limited, it is likely to show some beneficial antioxidant properties. Therefore, it is important to study the effect of B addition on the oxidation behavior of 254SMO.
In this work, the effect of B addition on the oxide scales formed on 254SMO at 900 °C and 1000 °C in air was systematically studied. Combining characterization of microstructure with first-principles calculations, the influence mechanism of B elements on oxide morphology, oxide layer thickness and composition in the oxide and Cr, Mo distribution were deeply clarified. Some interesting oxidation phenomena were observed, and the corresponding mechanisms were proposed.

2. Experimental Procedure

2.1. Material Preparation

The SASSs with 0.004% B, according to the ASTM A312 standard, were smelted in a vacuum induction furnace by Taiyuan Iron and Steel Group Co., Ltd. (TISCO, Taiyuan, China). The main chemical composition is shown in Table 1. The sample without B was labeled 254SMO–0B, and the sample with 0.004% B content was labeled 254SMO–40B. Hot rolling of the ingots was conducted at 1250 °C until a thickness of 12 mm was obtained. Then, from those plates, samples were cut to 15 × 15 × 3 mm using a wire-cutting machine. Samples were quenched after homogenization at 1220 °C for 2 h. The solution-annealed sample was wet-ground and polished with metallographic sand paper, then cleaned with alcohol and blow-dried. The oxidation treatment process was performed at 900 °C for 3 min/6 min/9 min /30 min and at 1000 °C for 1.5 min/3 min.
Scanning electron microscopy (SEM JEOL SM-7900F) (JEOL, Tokyo, Japan) was used to analyze the microstructure and surface morphology of the oxide layer. Energy dispersive spectroscopy (EDS, JEOL SM-7900F) (JEOL, Tokyo, Japan) was used to analyze the distribution of elements in the oxide layers. The crystalline phases developed during oxidation processes of the samples were identified by X-ray diffraction (XRD, Malvern Panalytical Aeris) (Malvern Panalytical, Malvern, UK) using a Cu Kα radiation (λ = 0.15418 nm),with Bragg–Brentano geometry (θ–2θ) at 40 kV and 30 mA, with an angular 2θ range from 20° to 80° and a step size of 0.002°.

2.2. Calculation Method

According to the experimental phenomenon, the micro-mechanism of surface oxidation of 254SMO was analyzed. The first-principles calculations were performed by employing the Vienna Ab–initio Simulation Package (VASP) software (version 5.4.1, University of Vienna, Vienna, Austria) [19,20,21]. The exchange correlation effects were described, employing the generalized gradient approximation of Perdew–Burke–Ernzerhof functional (GGA–PBE) [22,23,24]. All calculations were carried out spin-polarized with a plane wave cutoff energy of 400 eV.
Two types of face–centered cubic (FCC) Fe surfaces were considered. The first type of surface was Fe (111), with a Σ3(112) grain boundary (GB) representing the austenitic surface [25]. The slabs contained 80 Fe atoms, 16 Cr atoms, 16 Mo atoms and 1 B atom, arranged in seven layers and a 10 Å-thick vacuum region stacked. The second type of surface was Fe (100), with a Σ5(210) GB representing the austenitic surface. The slabs contained 72 Fe atoms, 8 Cr atoms, 8 Mo atoms and 1 B atom, arranged in eleven layers and a 10 Å-thick vacuum region stacked. During geometry optimization, a 4 × 1 × 1 Monkhorst–Pack mesh was used for the Brillouin zone integration. The atomic force and total energy tolerance were 0.02 eV/Å and 1.0 × 10⁻⁵ eV [26], respectively.

3. Results and Discussion

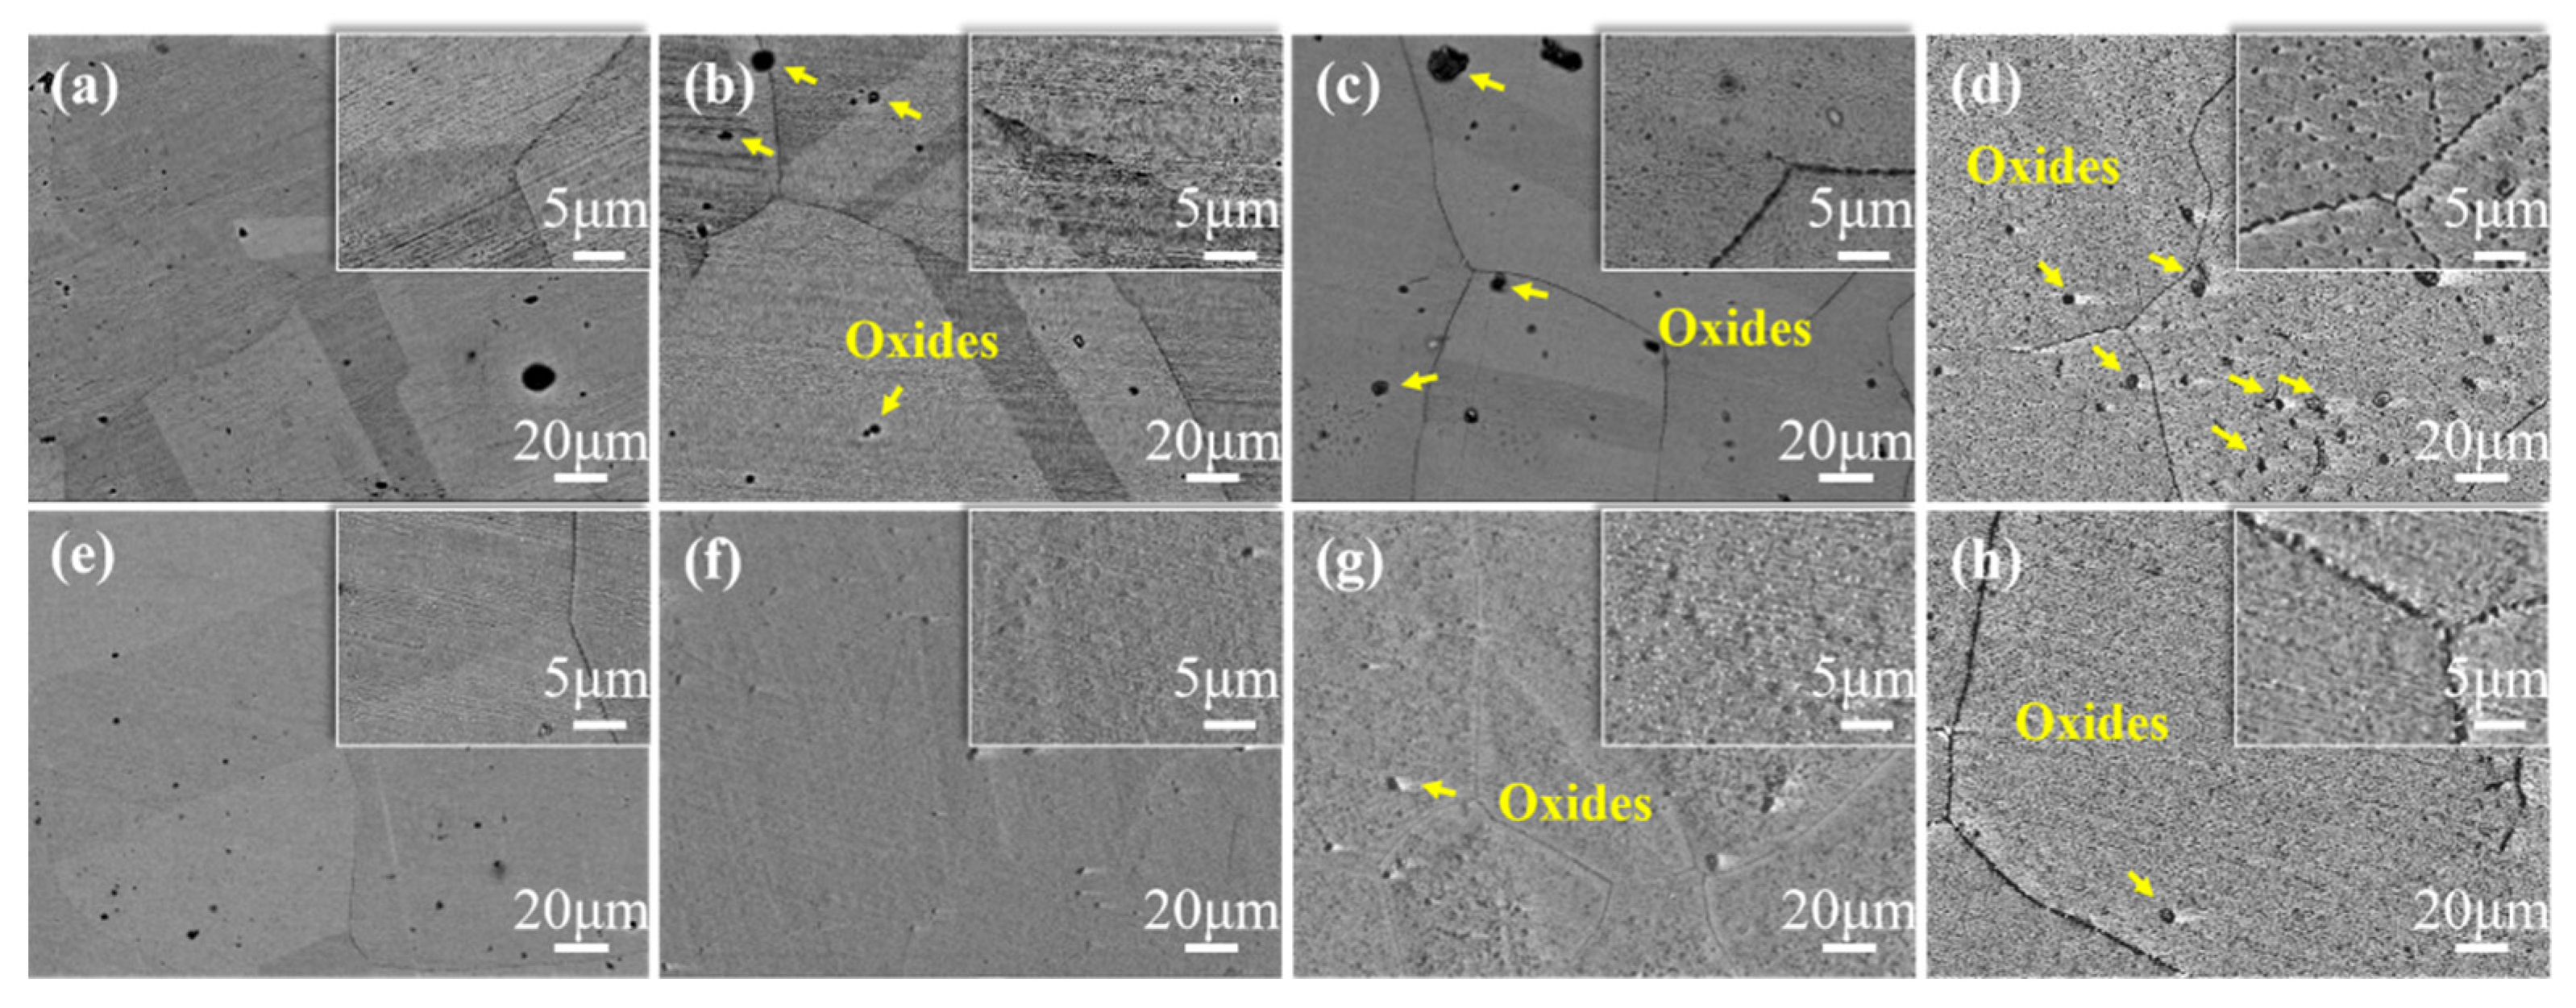
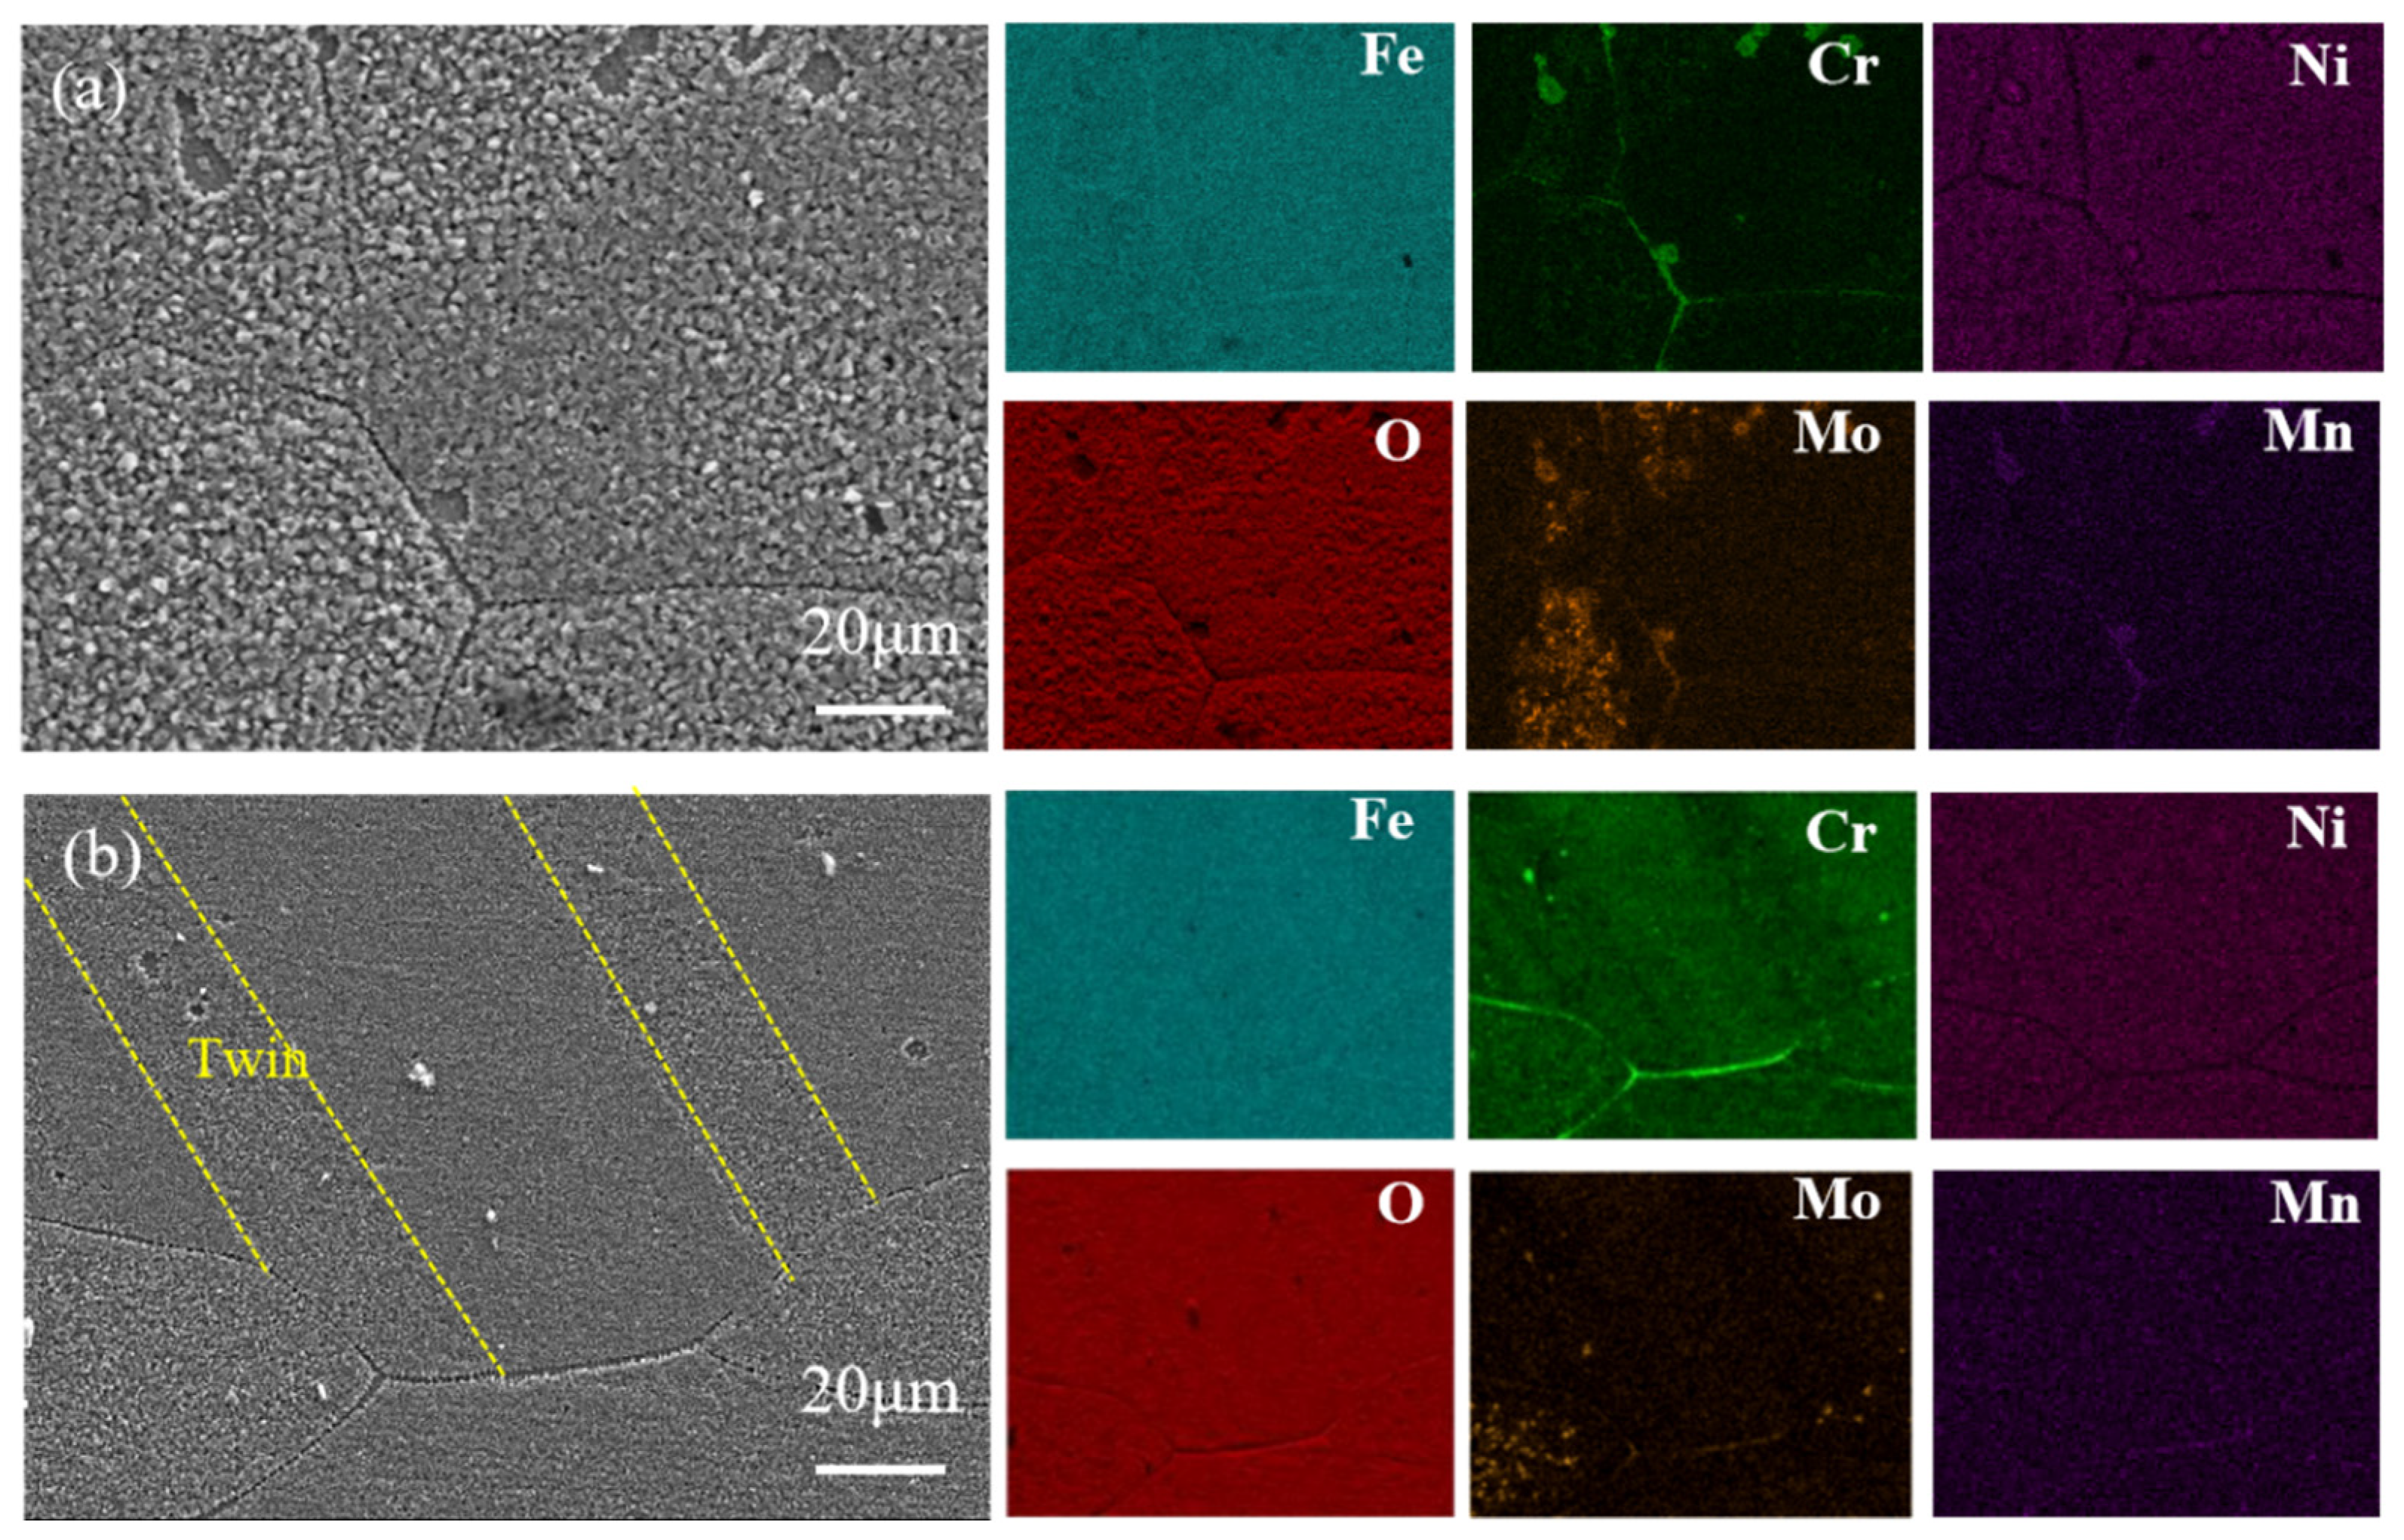
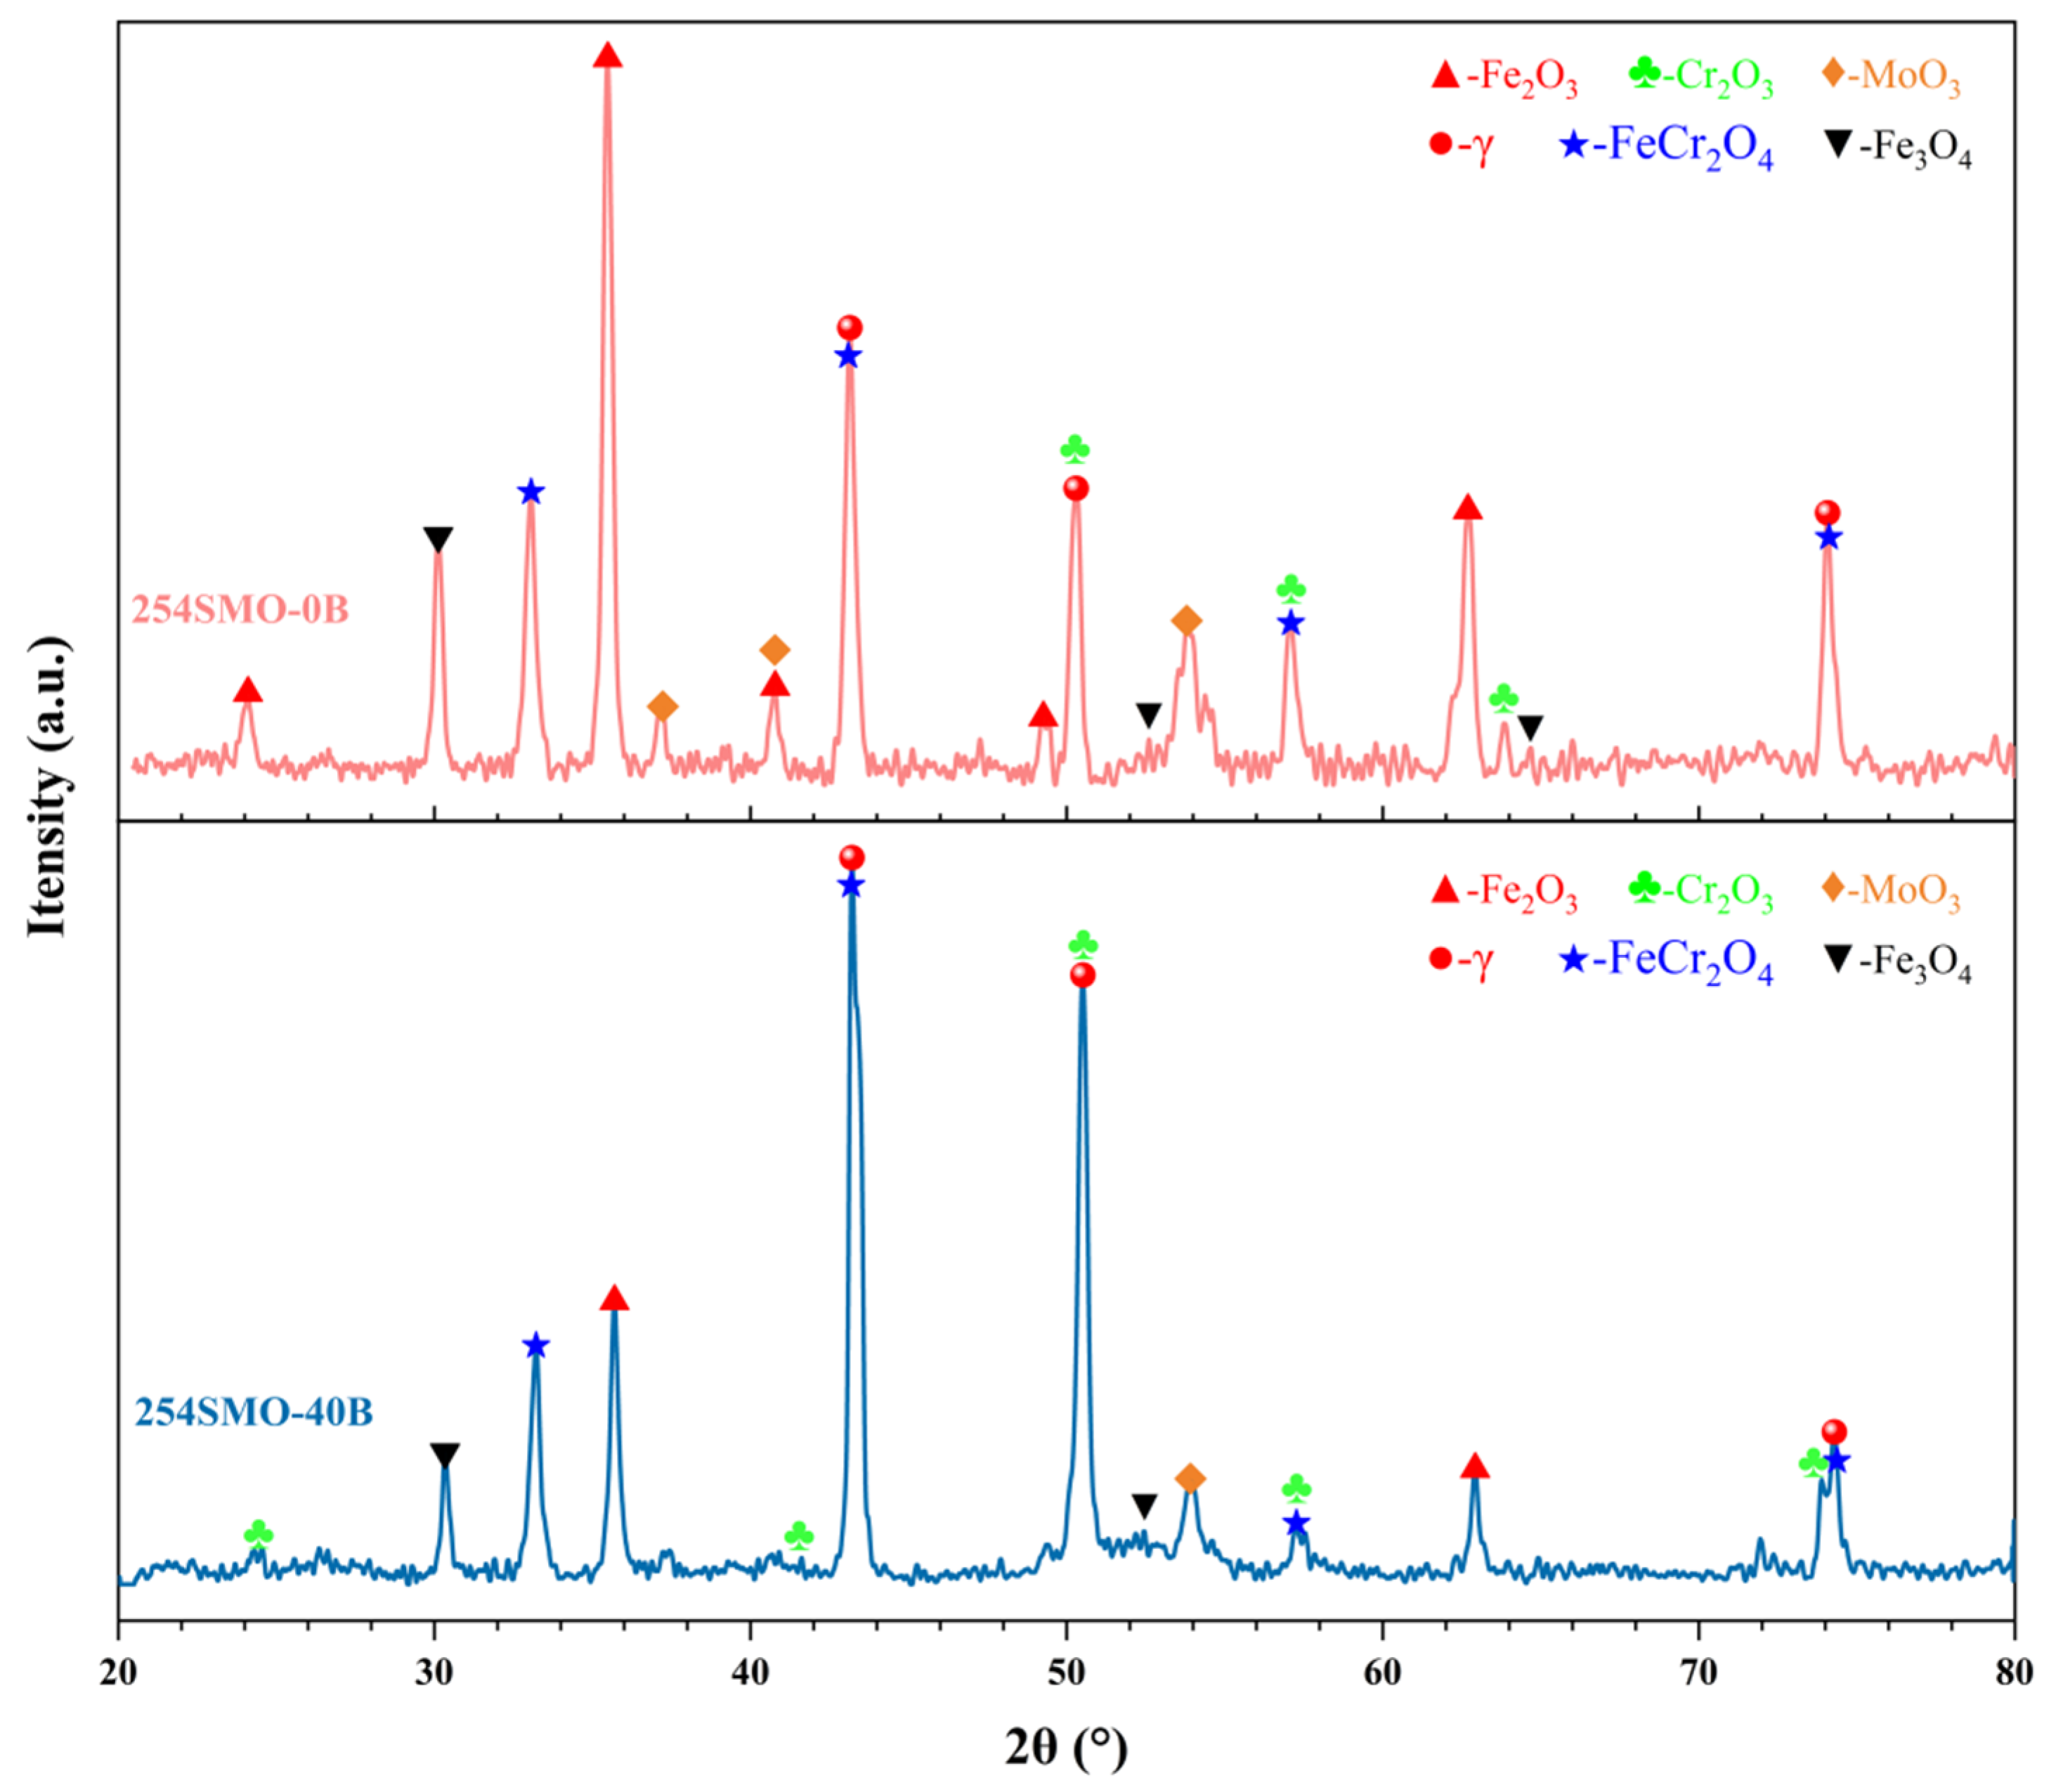
3.1. Analysis of Initial Oxidation Process

Figure 1 shows the SEM morphologies of 254SMO–0B and 254SMO–40B samples aged at 1000 °C for 30 min. The SEM micrograph indicates that the sample consisted of austenitic phase and precipitates. It can be seen that there are a large number of precipitates (sigma phase) at the GBs of the 254SMO–0B sample (Figure 1a). There are many sigma phases at the GBs, and some of them are connected into a network, there is also a distribution of sigma phases in the grain interior. However, in the 254SMO–40B sample (Figure 1b), the sigma phases at the GBs were significantly reduced compared to the 254SMO–0B, and there were no obvious sigma phases in the grain interior. In addition, the sigma phases at the GBs were significantly reduced, and the sigma phase particles were less and intermittent. This conclusion is consistent with our previous research results [27].
Figure 2 shows the surface morphology of the 254SMO–0B and 254SMO–40B samples after oxidation at 900 °C for different times. The oxidation degree on the surface of the 254SMO–0B sample is inhomogeneous, while the overall oxidation degree on the surface of the 254SMO–40B sample is relatively uniform. In 254SMO–0B, tiny spot-like particles appeared in the local area from 3 min. With the extension of time, the size and quantity of particles increased. By 30 min, a large number of oxide particles formed on the entire surface, indicating that the surface oxidation rate is faster. However, the oxidation degree of the twinning plane in the 254SMO–0B sample is obviously different from that of other areas, even after 30 min of oxidation. It can also be seen that the twinning plane is obviously smoother than other surfaces, and there is almost no distribution of oxide particles. For the 254SMO–40B sample, the oxidation degrees of the twinning plane and general plane are consistent, and the surface is still smooth at 30 min of oxidation; that is, the addition of B can provide more uniform oxidation on the surface of the sample and slow down the oxidation rate of the sample surface.
In order to further analyze the composition of oxide particles on the surface in Figure 2, Figure 3 shows the EDS element maps on the surfaces of the 254SMO–0B and 254SMO–40B samples after oxidation at 900 °C for 30 min. According to the EDS, the granular oxides in Figure 2 are Cr-rich oxides, and the small-sized oxides are Cr-rich oxides and Mo-rich oxides. The 254SMO–40B sample showed only a few small-sized Mo-rich oxide particles at the GBs. The small granular material in the 254SMO–0B sample for 3 min should be oxides-rich in Cr or Mo. The number of granular oxides increased over time, while the number of oxide particles in the 254SMO–40B sample was small and barely grew. The addition of B can improve the oxidation resistance and provide more uniform surface oxidation.
Figure 4 shows the surface morphologies of the 254SMO–0B and 254SMO–40B samples after oxidation at 1000 °C for 1.5 min and 3 min, respectively. As can be seen from the figure, the oxidation degree of the two samples at 1000 °C is higher than that at 900 °C, and the oxidation degree of 254SMO–0B sample is higher than that of the 254SMO–40B sample. The surface oxidation degree of the 254SMO–0B sample at 1000 °C for 3 min is higher than that at 900 °C for 30 min, which indicates that temperature has a greater influence on the surface oxidation process of the sample. The oxidation degree of the 254SMO–40B sample at 1000 °C for 3 min is similar to that at 900 °C for 30 min, and the oxide layers on both surfaces are denser oxides rich in Cr. The surface of the 254SMO–0B sample had some large granular oxides when it was oxidized for 3 min, while the surface of the 254SMO–40B sample had better oxidation resistance than that of the 254SMO–0B sample, and the oxidation occurred uniformly after 3 min. In addition, there are many Mo-rich strip oxides (indicated by the white arrow in Figure 4b) and some large, granular Fe-rich oxides (indicated by the yellow arrow in Figure 4b) on the surface and GBs of the 254SMO–0B sample, while the surface of the 254SMO–40B sample is more uniform, without clear evidence of granular oxides, which is similar to the results in Figure 2. For the 254SMO–0B sample, the content of Mo on the surface is high, and its distribution is uneven in Figure 3, without clear evidence of Mo enrichment even at 900 °C for 30 min, indicating that Mo is more easily distributed on the surface at 1000 °C for 3 min. The GBs of the 254SMO–40B sample sag downward (indicated by the white arrow in Figure 4d), indicating that the oxidation at the GBs is slower than the surface. The oxidation resistance of the GBs is higher than that of the surface. Compared with the 254SMO–0B sample, the two samples were highly oxidized at 1000 °C for 3 min (Figure 4b,d), but the surface of the 254SMO–0B sample showed a large number of oxide particles, and the degree of oxidation on the surface of the 254SMO–40B sample was more uniform and complete, and no obvious oxide particles were produced. The addition of B can affect the distribution of Mo on the surface, thus improving the overall oxidation resistance of the 254SMO surface.
In order to further analyze the composition of oxide films on the surface in Figure 4, Figure 5 shows the surface morphology and element distribution of the 254SMO–0B and 254SMO–40B samples oxidized for 1.5 min at 1000 °C. As can be seen from the figure, the oxidation rate of the two samples at 1000 °C is faster than that at 900 °C (Figure 2 and Figure 3) and the elemental enrichment was even more pronounced on the surface. For the 254SMO–0B sample, the content of Cr at the GBs in 254SMO–0B is obviously higher than that in other areas, and Mo has a tendency of enrichment at the GBs and the local surface in the 254SMO–0B sample; in other words, the distribution of Mo is obviously uneven. For the 254SMO–40B sample, the whole surface is rich in Cr, and the content of Cr at the GBs is higher than in other areas. However, the content of Mo on the surface is obviously lower than the 254SMO–0B sample, and only a small amount of dispersed Mo is distributed on the surface. The addition of B can effectively promote the segregation of Cr towards the surface and inhibit the segregation of Mo towards the surface, thus forming a dense Cr-rich oxide layer on the surface of 254SMO–40B.
Figure 6 shows the X-ray analysis results of 254SMO–0B and 254SMO–40B after oxidation at 900 °C for 30 min. It can be seen that there are diffraction peaks in the matrix γ phase and various oxides phases in the 254SMO with and without B. The strongest peak of 254SMO–0B is Fe2O3, and the peak of the matrix γ phase is weak, while the strongest peak of 254SMO–40B is the matrix γ phase, indicating that the oxidation degree of 254SMO–0B is higher than 254SMO–40B. In terms of oxide layer composition, the oxide layer of 254SMO–0B is rich in Fe2O3, followed by Cr2O3 and FeCr2O4, Fe3O4 and MoO3. The obvious peak of MoO3 indicates that there are many Mo-rich oxides. For the 254SMO–40B sample, the peak of the matrix γ phase is the strongest, being rich in Cr2O3 and FeCr2O4 oxides, while the peak of MoO3 is obviously weakened. Combined with the results of Figure 3, there are many Mo-rich oxide particles in the 254SMO–0B sample, so there are many oxide peaks in diffraction peaks, but the Mo oxide-rich particles in the 254SMO–40B sample are few and small in size, so the oxide diffraction peaks are few. In order to further analyze the structure of the oxide layer, the element distributions of the cross-section of 254SMO–0B and 254SMO–40B after oxidation at 900 °C for 30 min were analyzed.

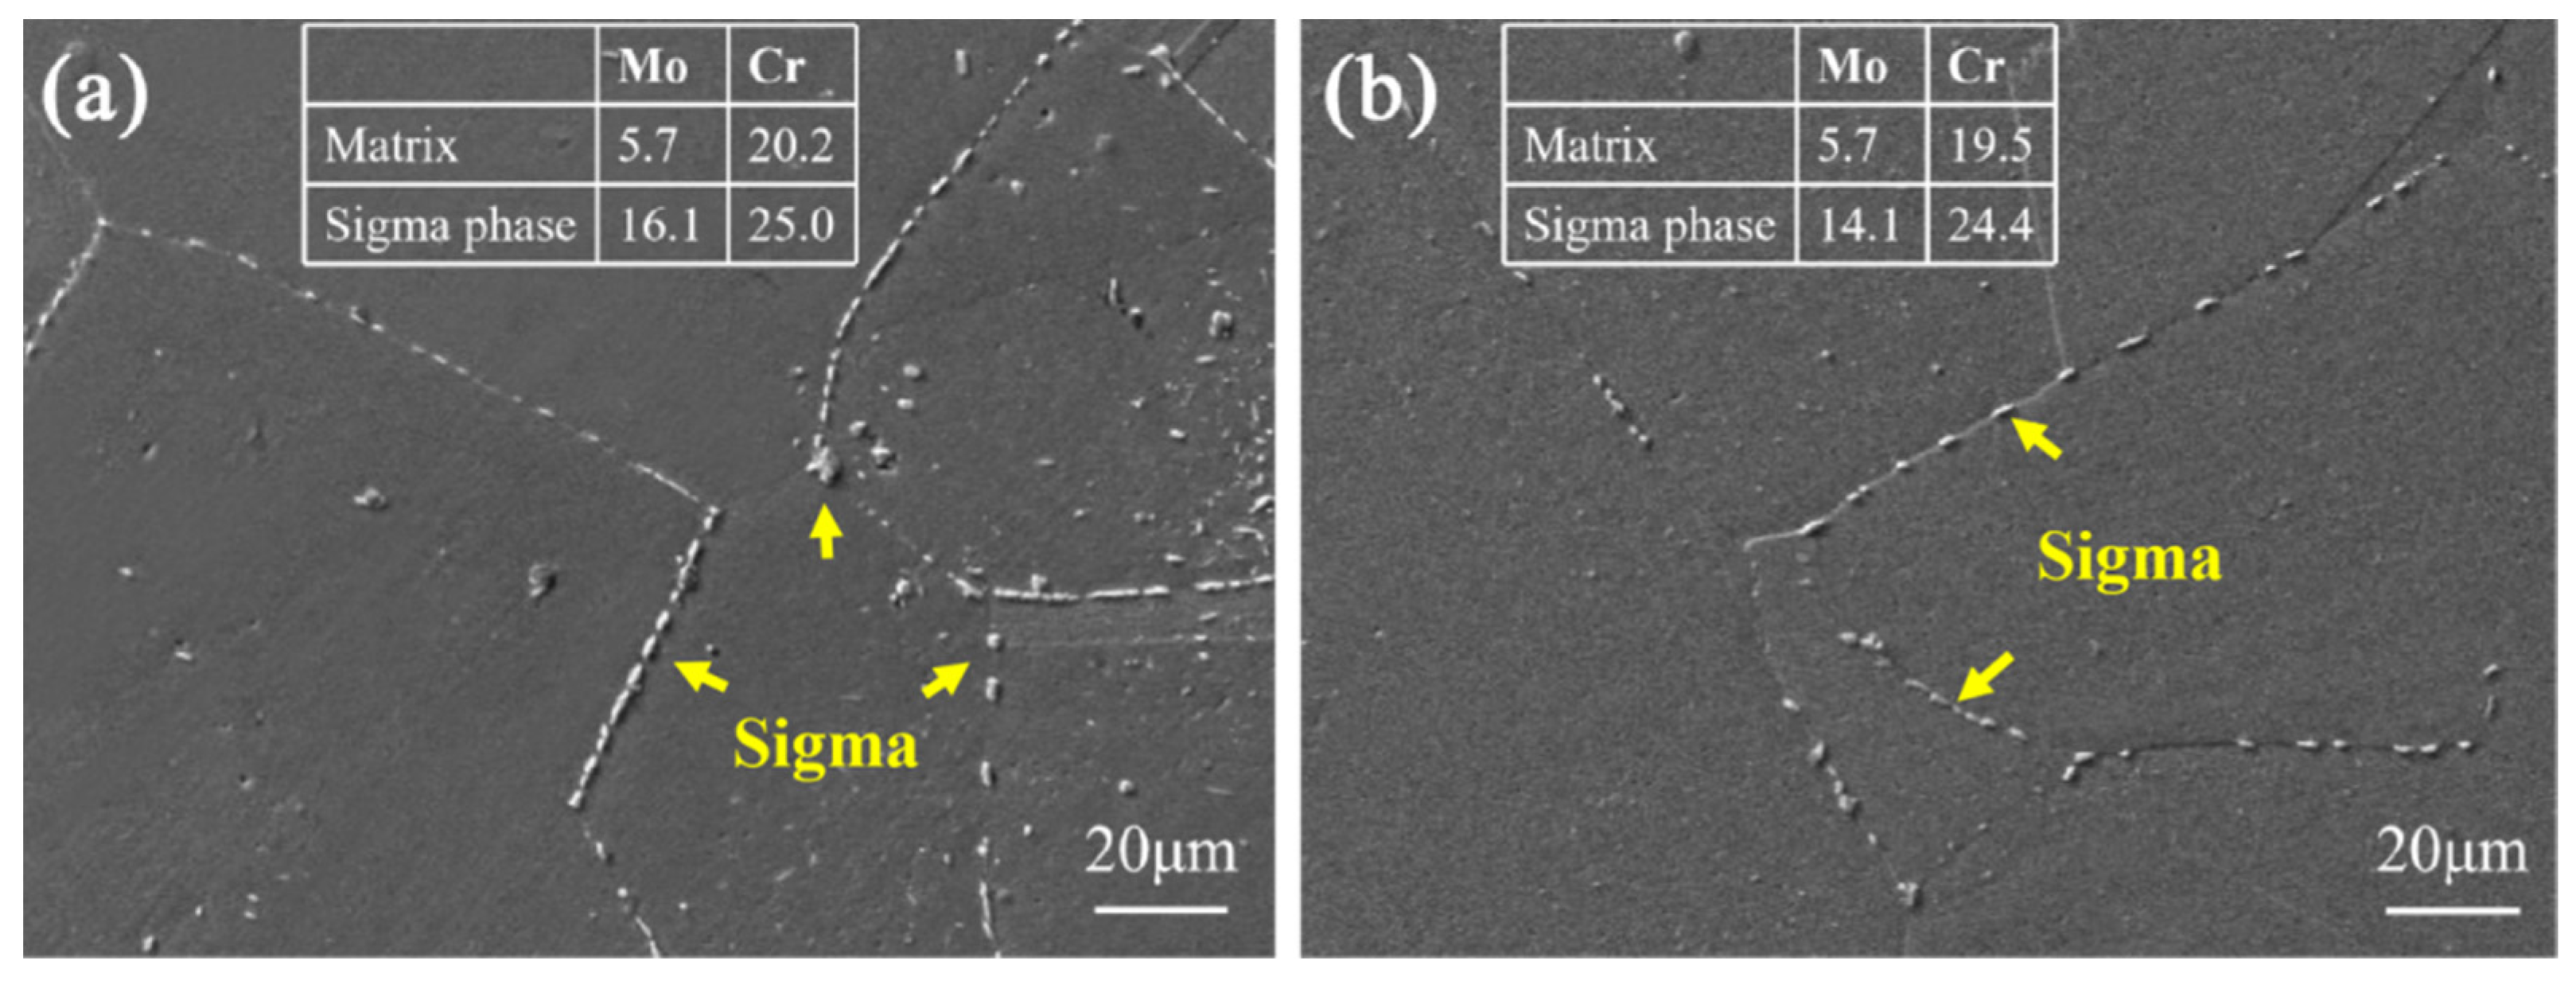
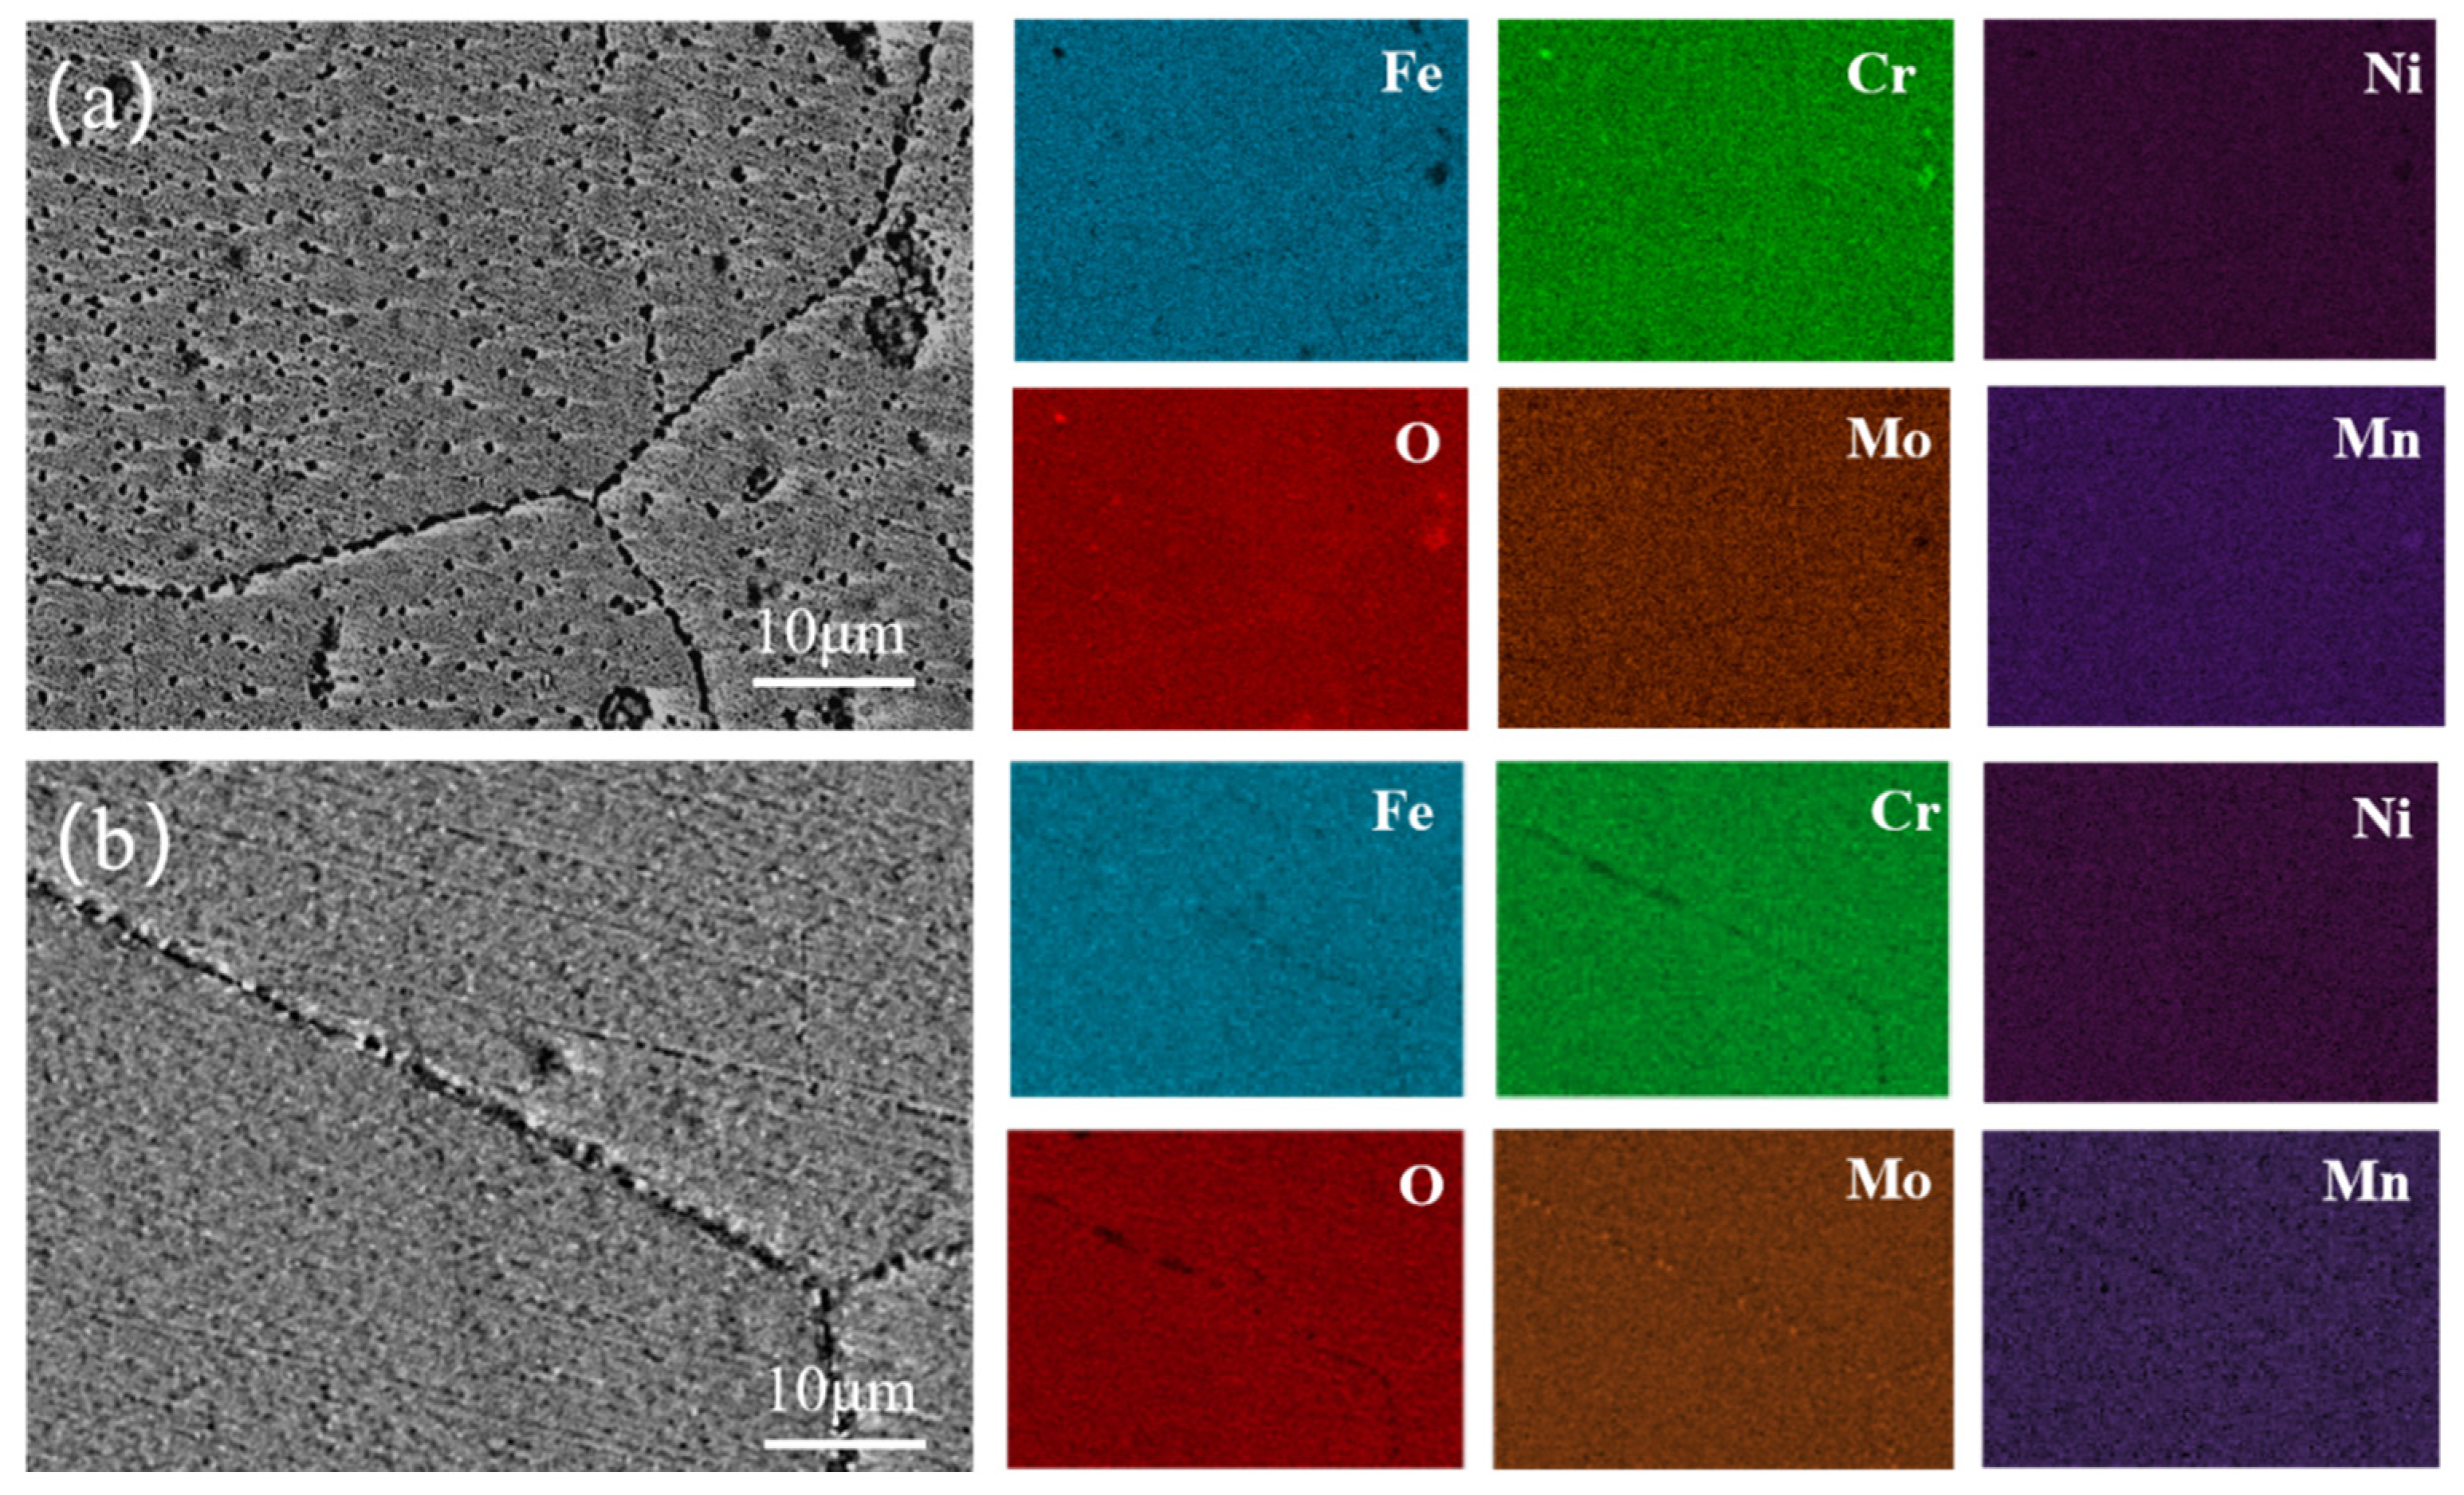
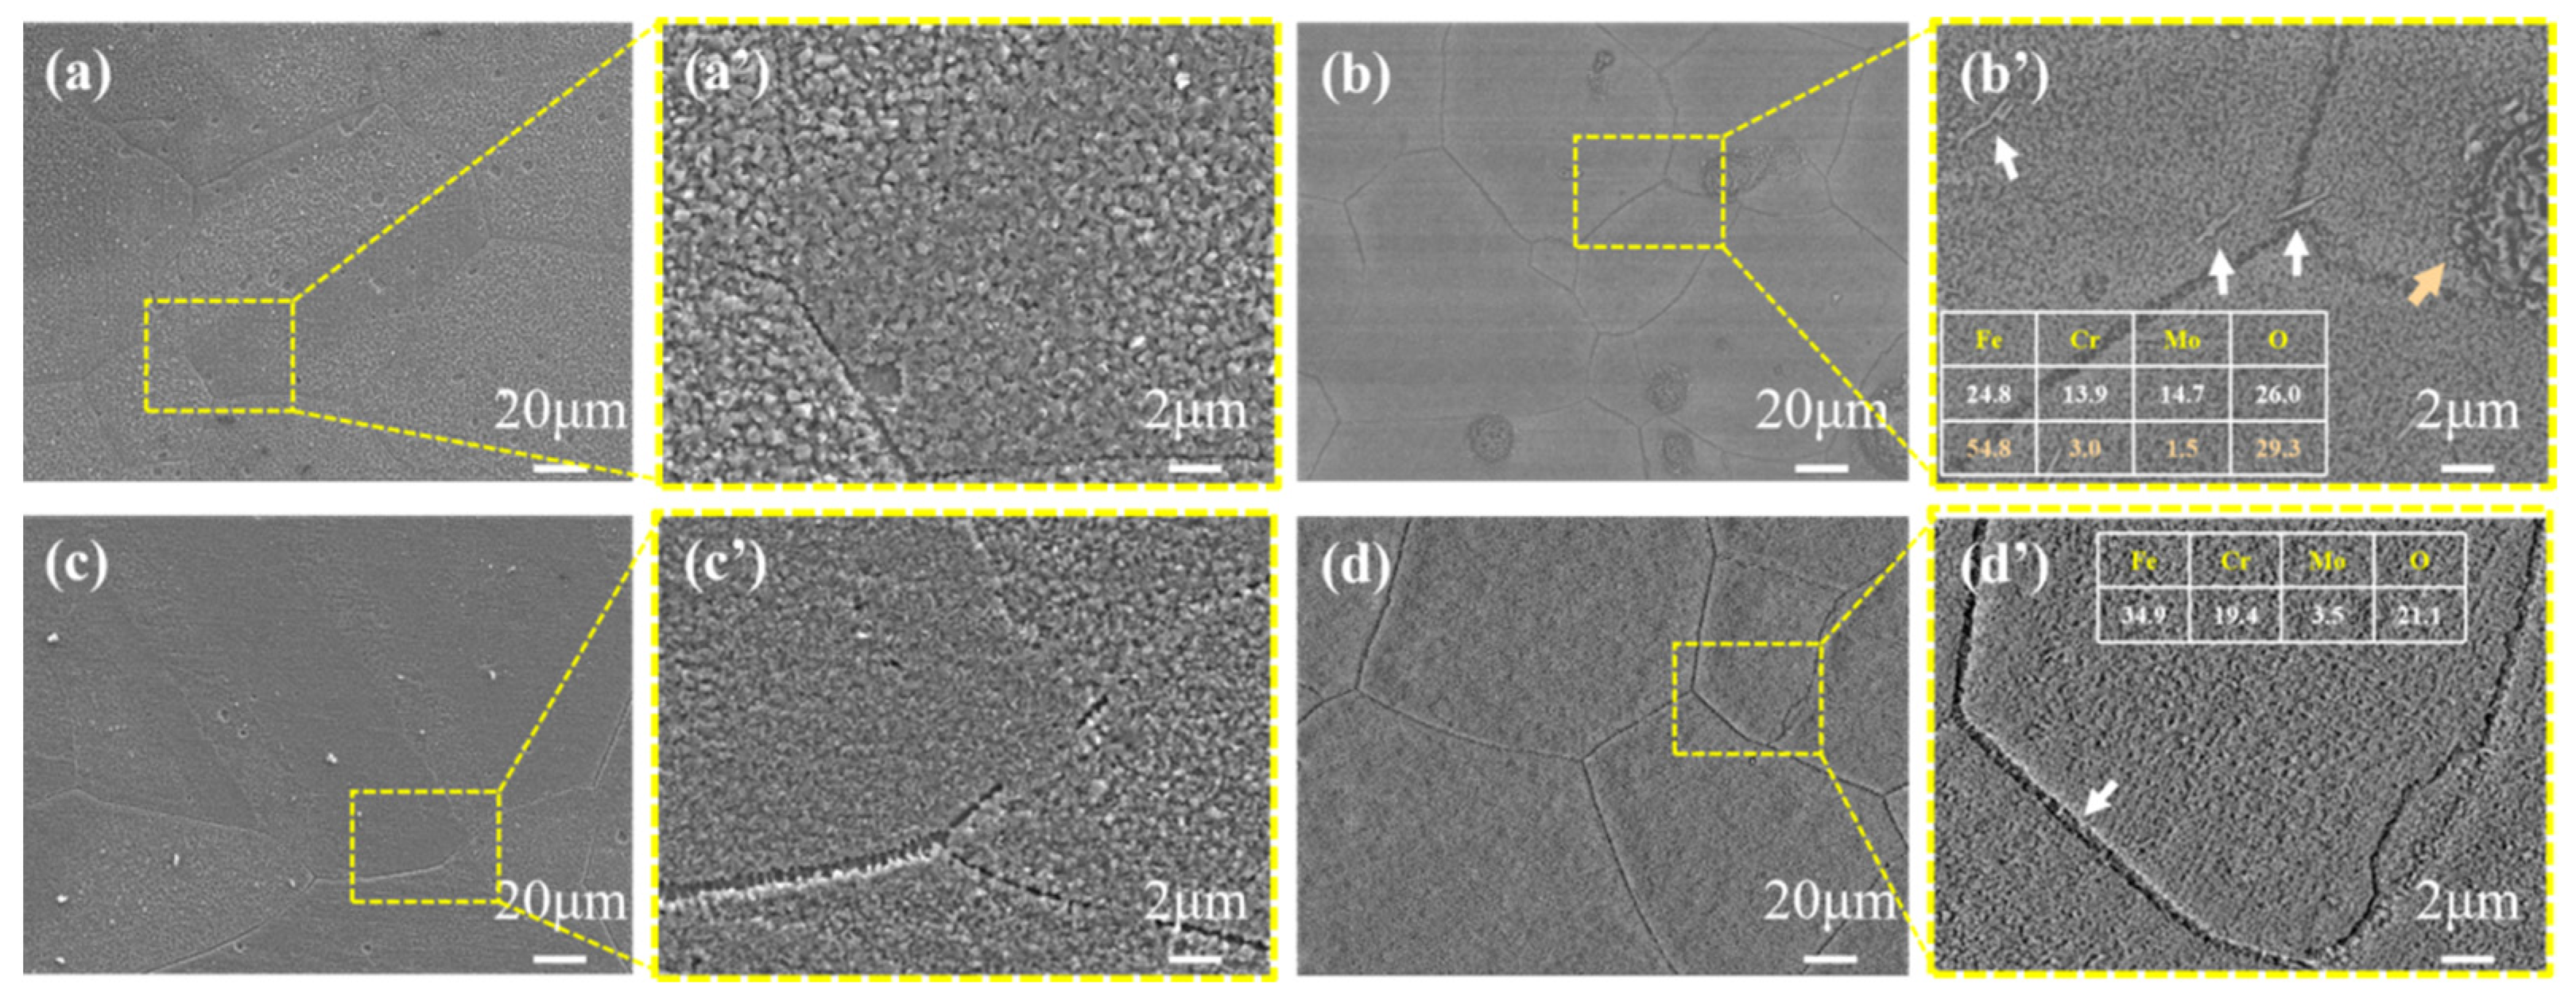
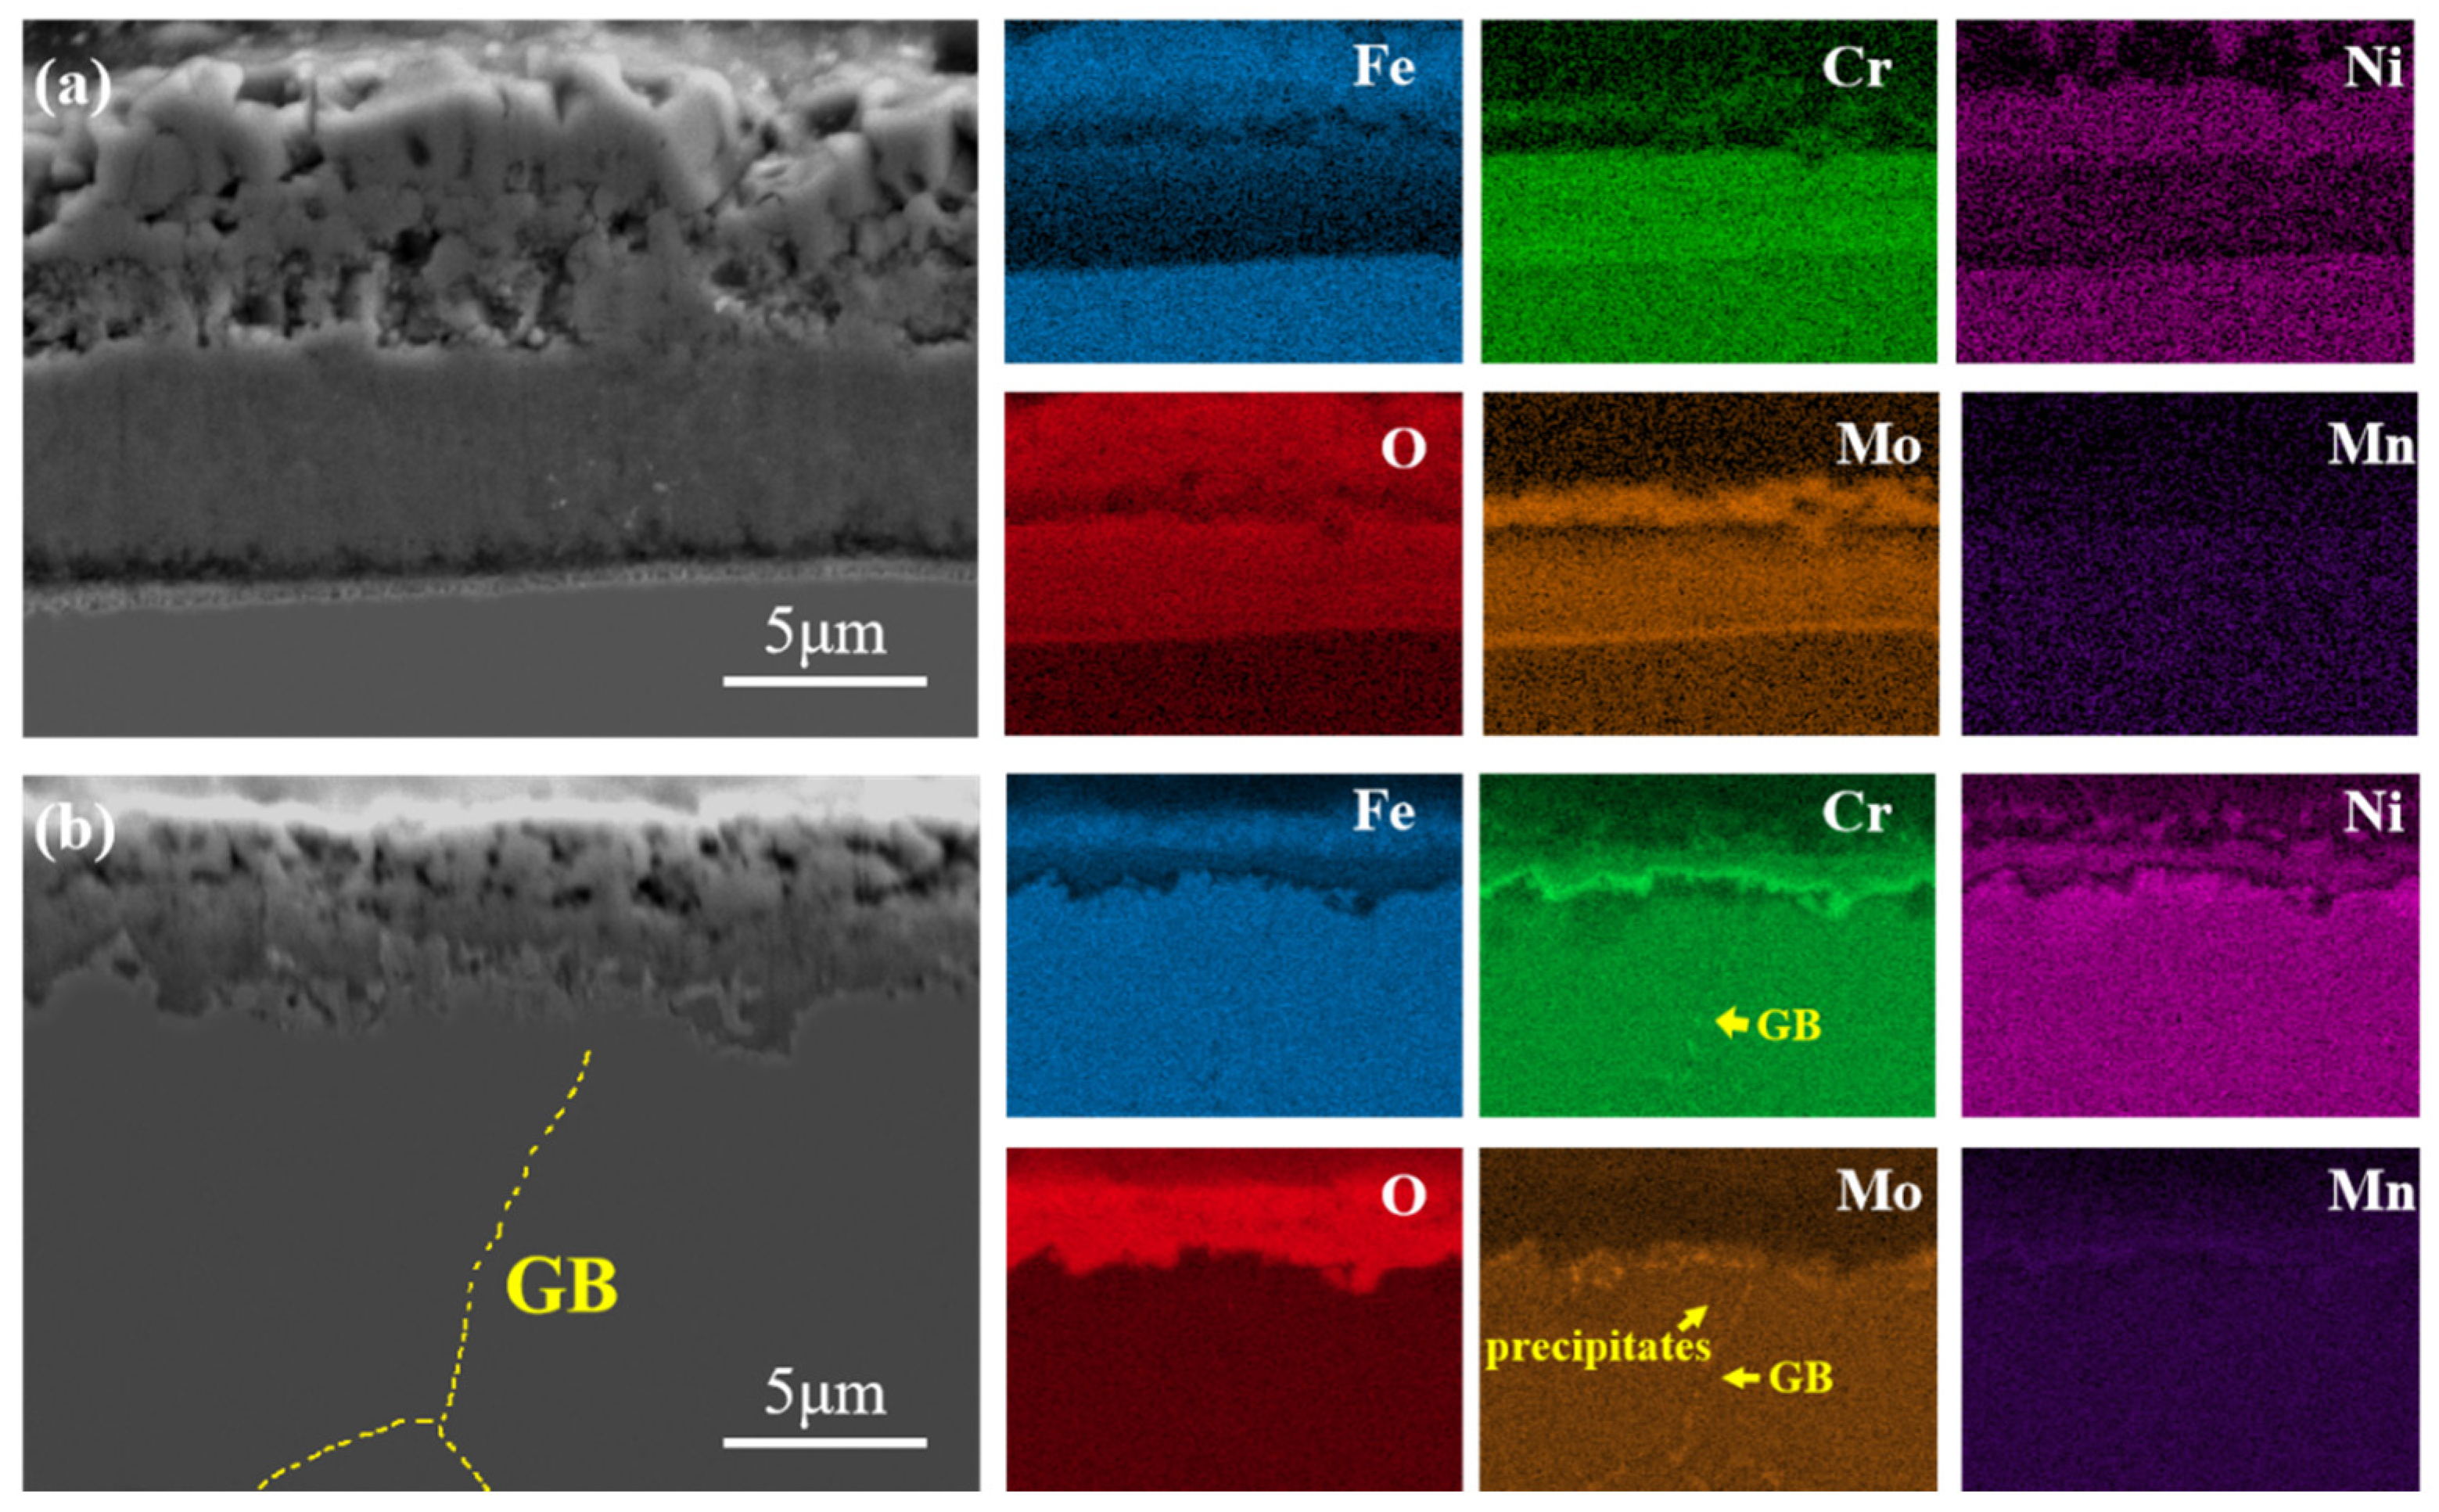
3.2. Analysis of Oxidation Cross-Section

As shown in Figure 7, the oxide layer thickness of the 254SMO–0B sample (14 μm) was significantly larger than the 254SMO–40B sample (6 μm). The oxide layer of the 254SMO–0B sample was porous, while the 254SMO–40B sample was mainly composed of dense Cr-rich oxides. According to the distribution of elements in the cross-section, the oxide layer of 254SMO–0B was divided into four layers from top to bottom: an Fe-rich oxide layer (about 5 μm, which is relatively porous), Mo-rich oxide layer (about 2 μm) on the subsurface, a Cr/Mo-rich oxide layer (about 6 μm) and a Mo-rich oxide layer (about 1 μm) adjacent substrate. Mo is enriched under the porous Fe-rich oxide layer on the surface, which is likely to cause the volatilization of the Mo. It can be seen in Figure 4 that after oxidation at 1000 °C for 3 min, Mo-rich compounds appear on the surface, and Zhang et al. proposed that the composition of the high-temperature oxide layer under the Fe-rich oxides of 654SMO also comprises Mo-rich oxides on the outer layer and Cr-rich oxides on the inner layer [11,28], which is consistent with our results. For 254SMO–40B sample, it is divided into three layers: an outer layer, a subsurface layer and an adjacent substrate. The outer layer is about 2 μm, and the main oxide layer is made of Fe-rich oxides. The oxides enriched by Fe, Cr and Ni were distributed in the subsurface layer, about 2 μm. On the adjacent substrate, forming a dense oxide dominated by Cr, about 1 μm, while the distribution of Mo-rich oxides almost disappears in the oxide layer. Compared with the 254SMO–0B sample, the Fe-rich oxide layer is thinner and the Cr-rich oxide layer is denser. The volatilization of Mo is inhibited because of the barrier of the dense Cr oxide, indicating that the addition of B is conducive to the diffusion of Cr towards the surface to form a dense oxide layer, which is similar to the effect of Y on Cr and Mo in 654SMO–0B SASSs [11]. According to the microstructure of 254SMO–0B and 254SMO–40B aged at 1000 °C for 30 min in Figure 1, the sigma phases are distributed at the GBs. In Figure 7b, the Cr and Mo in the substrate of 254SMO–40B sample are enriched at the GBs, indicating that Mo does not volatilize to the surface along the GB during the oxidation process. In contrast, after aging the 254SMO–0B sample for 30 min, there are more sigma phases at the GBs in Figure 1. From Figure 7a, it is difficult to observe the enrichment of Cr and Mo at the GBs at the substrate side of 254SMO–0B oxide/substrate interface. However, Mo is enriched in the oxide layer, forming three Mo-rich oxide layers. In Figure 3 and Figure 5, according to the EDS of oxidation surface at 900 °C and 1000 °C, there is an aggregation of Mo on the oxidation surface of 254SMO–0B and Mo volatilization occurs during the oxidation process, so it is difficult to observe the enrichment of Cr and Mo at the GBs at the substrate side of the oxide/substrate interface. The addition of B changes the structure of the oxide layer, and the formation of dense Cr-rich oxide layer hinders the migration and diffusion of Mo to the surface. The results of Figure 4b show that Mo-rich oxides appear on the surface of the 254SMO–0B sample, while the GBs of the 254SMO–40B sample are rich in Cr (Figure 4d). The addition of B is beneficial to inhibit the volatilization of Mo. However, the effect of B on the diffusion mechanism of Cr and Mo at the atomic level is unclear. In the present study, first-principle calculations were performed to investigate the influence of B on the diffusion behavior of Cr and Mo.

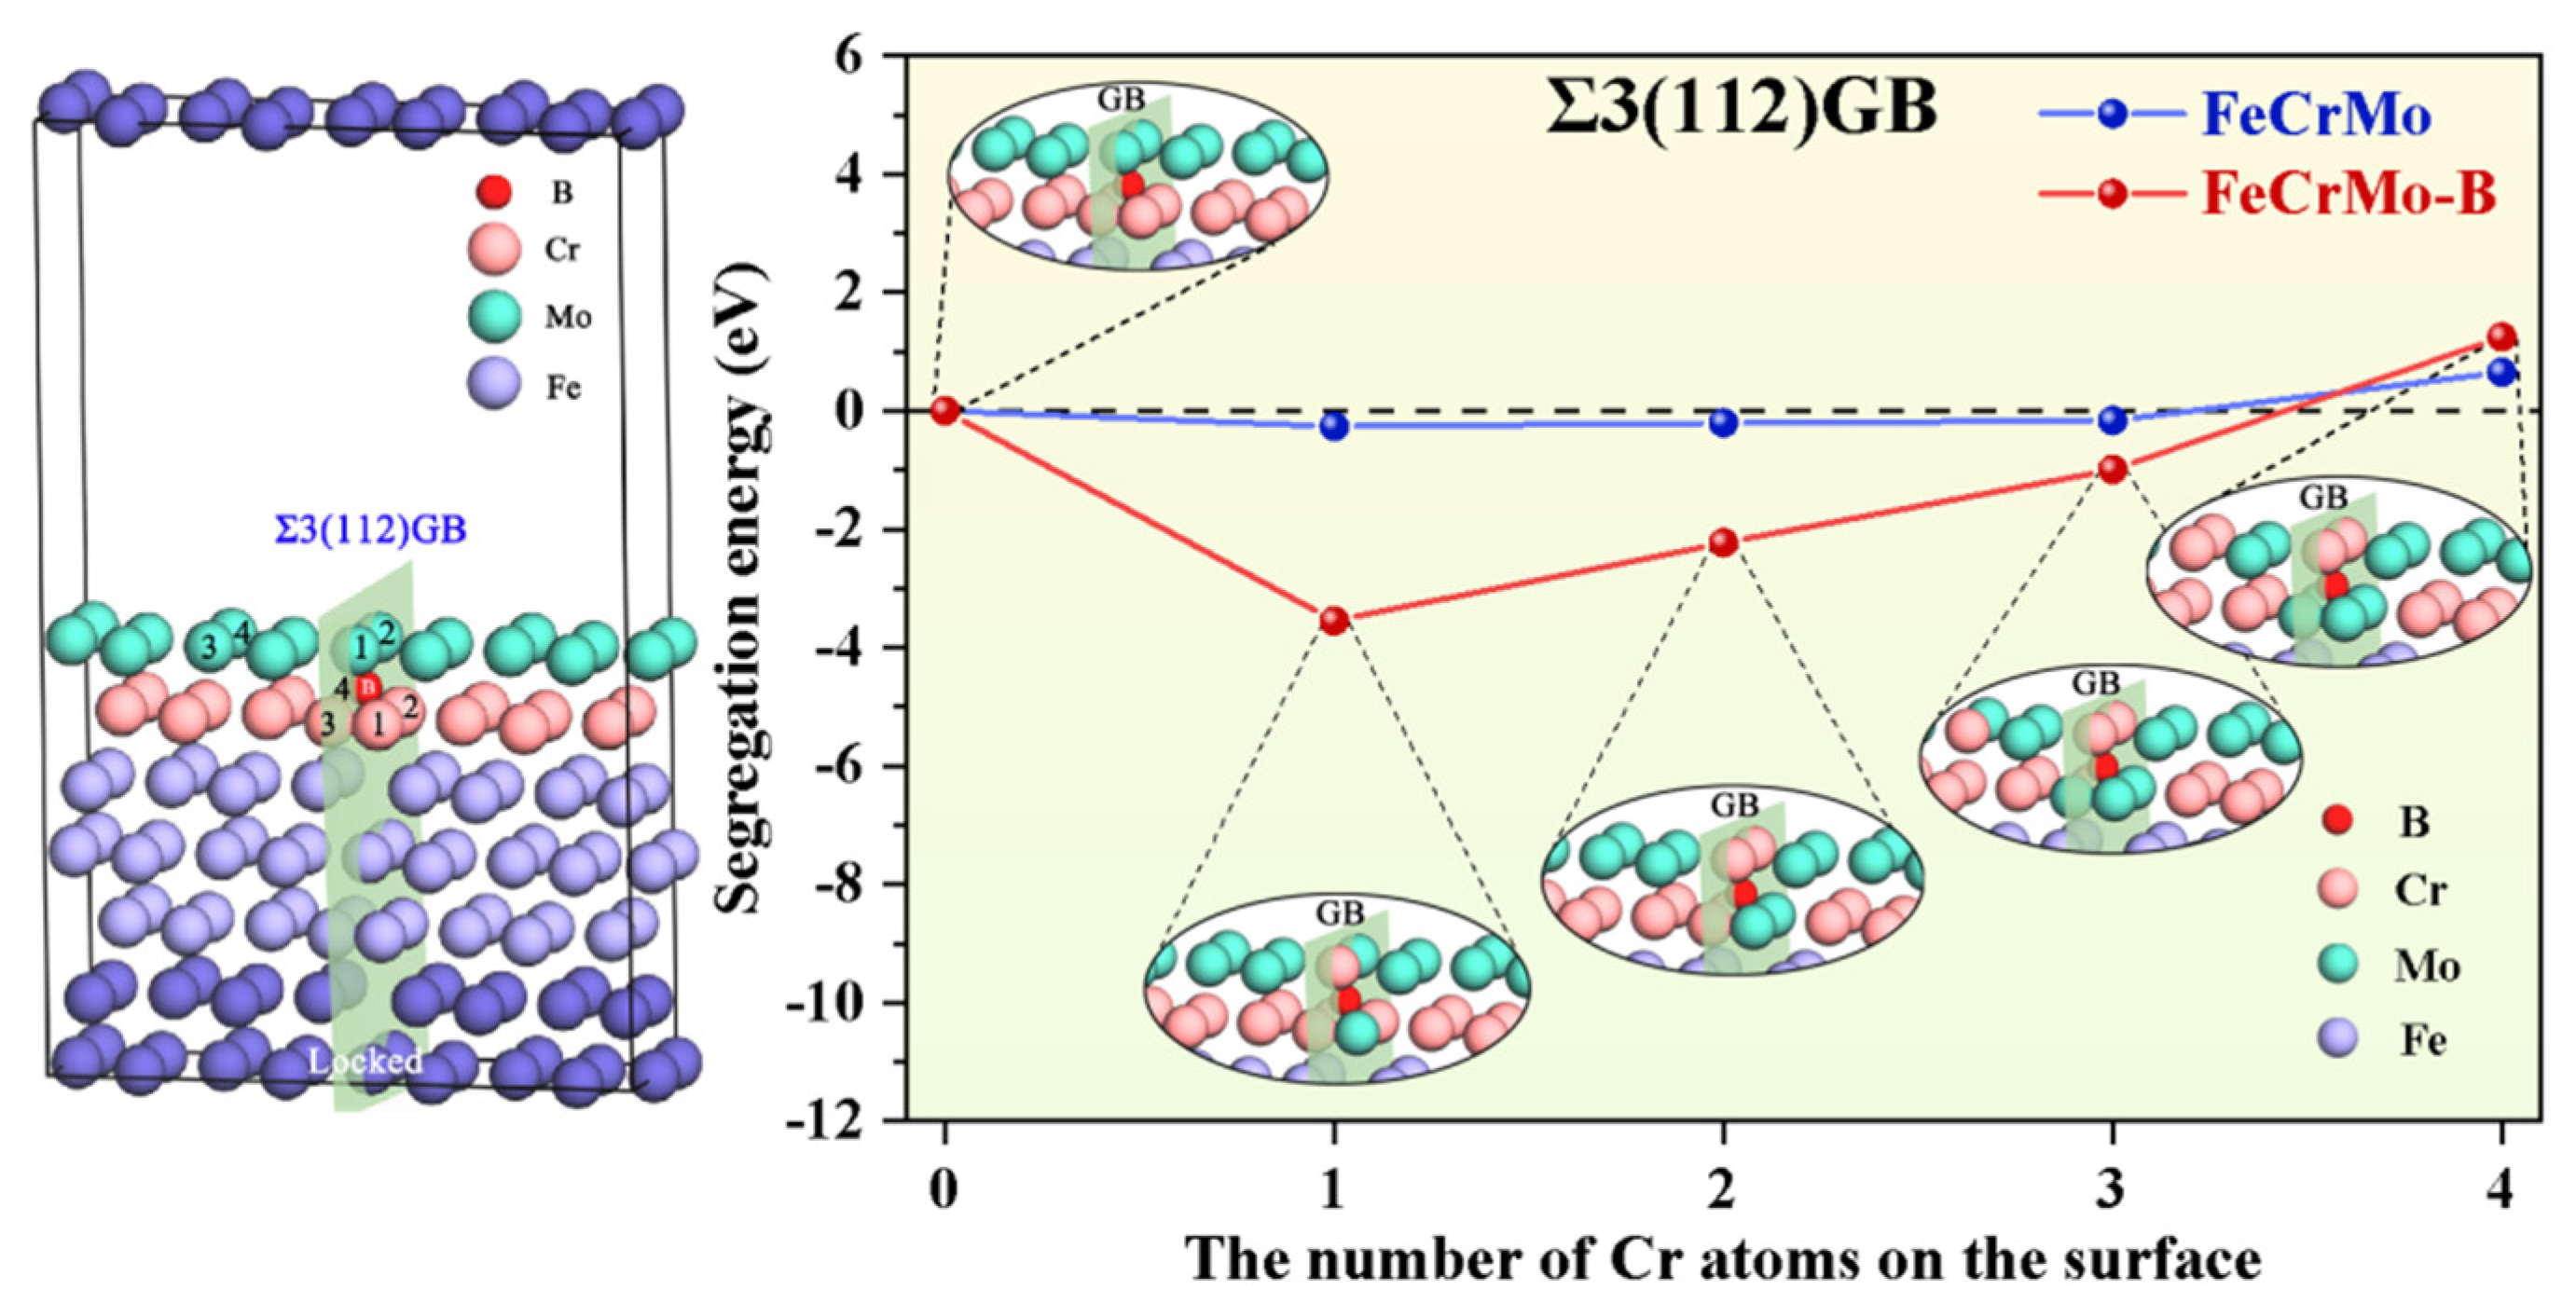
3.3. Diffusion Mechanism Analysis

The above results show that B has a significant inhibitory effect on Mo volatilization, the GB and surface are the most important diffusion channels. As is well known, austenitic stainless steel is a face-centered cubic crystal structure with Σ3, Σ5, Σ7, Σ9, Σ11 and other GBs [29]. Among them, Σ3 and Σ5 GBs are symmetrically inclined GBs with a unique interface structure, which are considered as representative structures of twins and general GBs. Therefore, in this work, FCC–FeCrMo(–B)(111) with a Σ3(112) GBs and FCC–FeCrMo(–B)(100) with a Σ5(210) GBs, which are not only the most representative but also account for a large proportion in austenitic steels, were selected [30,31,32], the influence of single B atom doping in two GBs on the occupancy and segregation behavior of Cr and Mo in the microstructure model were analyzed.
According to the distribution of Cr and Mo on the surface and oxide layers in Figure 5 and Figure 7, the addition of B has an obvious influence on the distribution of Cr and Mo in the surface layer and can promote the enrichment of Cr on the surface. In order to analyze the effect of B on the distribution of Cr and Mo on the twinning surface, FCC–FeCrMo(–B)(111) with a Σ3(112) GB was constructed, as shown in Figure 8. After replacing the Fe atoms on the surface and sub-surface with 16 Mo and 16 Cr atoms, the figure shows the analysis of the segregation tendency of Cr towards the surface with or without B doping. The results show that in this model, without B doping, there is a slight segregation tendency of Cr towards the surface. However, when B is inserted at the GB, B will promote the enrichment of Cr towards the surface of the GB firstly, and then towards the adjacent surface. The above calculation results show that the addition of B is indeed beneficial to the enrichment of Cr towards the surface, so the surface layer is more likely to form a dense Cr-rich oxide layer during the oxidation process of 254SMO with B doping.
Similar to Figure 8, in order to analyze the effect of B on the distribution of Cr and Mo on the general surface, FCC–FeCrMo(–B)(100) with a Σ5(210) GB was constructed, as shown in Figure 9. For this model, without B doping, Cr has no tendency to segregate towards the surface, while Mo tends to segregate towards the surface. However, when B is inserted at the GB, B promotes the enrichment of Cr to the surface, preferentially enriching towards the surface of the GB, and then enriching towards its adjacent surface. The effect of B on the Cr segregation tendency in Σ5(210) GB is greater than Σ3(112) GB. The above calculation results show that the addition of B is indeed beneficial to the enrichment of Cr towards the surface, so the surface layer is more likely to form a dense, Cr-rich oxide layer during the oxidation process of 254SMO with B doping. The results in Figure 8 and Figure 9 show that the addition of B can promote the diffusion of Cr from most GBs to the surface and enrich on the surface to form a uniform, Cr-rich oxide layer, which is also consistent with the above experimental results.
In Figure 10, further combined with the oxidation process, a layer of oxygen atoms is adsorbed on the surface of the two original structural models, analyzing the diffusion trend of Cr or Mo from the interior of the matrix to the GB, the surface of the GB and the surface with or without B doping. Similarly, B is inserted at the GB. Differently, a single Mo or Cr atom occupies 1 to 6 sites, respectively. The segregation energy at each position was calculated. The results show that, without B doping, the segregation energy of Cr to the surface is negative, indicating that it is more likely to segregate to the surface and combine with O to form Cr-rich oxides. The segregation energy of Mo to the surface is positive, indicating that Mo is not easy to segregate to the surface. In addition, with B doping, the segregation energy of Cr near B will be more negative, indicating that the addition of B will promote the segregation of Cr to the surface, while the segregation energy of Mo near B will be more positive, indicating that the addition of B will further inhibit the segregation of Mo to the surface. The above calculation results show that the addition of B can promote the enrichment of Cr on the surface, while inhibiting the enrichment of Mo to the surface, so the surface layer is more likely to form a dense, Cr-rich oxide layer during the oxidation process of 254SMO with B doping, which can inhibit the volatilization of Mo.

4. Conclusions

The present study, based on the combinations of first–principles calculations, as well as microstructural characterization, investigated the initial stages of oxidation tests of 254SMO with and without B. The main conclusions are stated in the following paragraphs.
For the 254SMO–0B sample, the oxidation of the surface is uneven, with the Mo-rich oxides on the surface causing the serious volatilization of Mo. The oxide layer is divided into four layers from top to bottom: an Fe-rich oxide layer (which is relatively porous), a Mo-rich oxide layer, a Cr/Mo-rich oxide layer and a Mo-rich oxide layer. Porous Cr/Mo-rich oxide layer can hardly prevent Mo volatilization. The Mo-rich precipitates are difficult to form at the grain boundaries of the surface, and the Mo enriched at the grain boundaries aggravates the volatilization of Mo from the surface through the Cr/Mo-rich oxide layer.
For the 254SMO–40B sample, the oxidation of the surface is uniform. The oxide layer is divided into three layers: Fe-rich oxides, Fe/Cr-rich oxides and Cr-rich oxides (which is dense). Mo is distributed at the substrate side of the oxide/substrate interface. The addition of B facilitates the diffusion of Cr to the surface and combines with O, providing conditions for the nucleation of Cr2O3. A large amount of Cr2O3 accumulates on the surface to form a dense passive film, which inhibits the diffusion of the Mo to the surface. Although Cr/Mo-rich precipitates formed at grain boundaries that are close to the surface, there is no clear evidence of distribution of Mo-rich oxides in the oxide layer. The addition of B is conducive to improving the oxidation resistance and inhibiting the volatilization of Mo.

Author Contributions

J.R.: Methodology, Software, Formal analysis, Investigation, Visualization, Writing—Original Draft; Y.Z.: Software; S.Y.: Visualization, Resources; J.M.: Resources; C.Z.: Resources; Z.J.: Funding acquisition; H.L.: Resources; P.H.: Conceptualization, Writing—Review & Editing, Funding acquisition. All authors have read and agreed to the published version of the manuscript.

Funding

The present work was financially supported by National Natural Science Foundation of China (Grant Nos. U1860204 and 51871159).

Data Availability Statement

Not applicable.

Conflicts of Interest

The authors declare no conflict of interest.

References

  1. Zhang, S.C.; Li, H.B.; Jiang, Z.H.; Li, Z.X.; Wu, J.X.; Zhang, B.B.; Duan, F.; Feng, H.; Zhu, H.C. Influence of N on precipitation behavior, associated corrosion and mechanical properties of super austenitic stainless steel S32654. J. Mater. Sci. Technol. 2020, 42, 143–155. [Google Scholar] [CrossRef]
  2. Muller, C.; Chumbley, L.S. Fracture toughness of heat–treated super austenitic stainless steels. J. Mater. Eng. Perform. 2010, 19, 714–720. [Google Scholar] [CrossRef] [Green Version]
  3. Han, Y.; Qiao, G.J.; Sun, Y.; Zou, D.N. Modeling the constitutive relationship of Cr20Ni25Mo4Cu super austenitic stainless steel during elevated temperature. Mater. Sci. Eng. A 2012, 539, 61–67. [Google Scholar] [CrossRef]
  4. Xing, J.; Liu, C.Z.; Li, A.M.; Wang, S.M.; Zhang, X.J.; Shi, Y.X. Microstructural evolution and stability of coarse–grained S31254 super austenitic stainless steel during hot deformation. Metals 2022, 12, 1319. [Google Scholar] [CrossRef]
  5. Li, S.; Ma, J.Y.; Wang, J.; Fan, G.W.; Li, H.B.; Jiang, Z.H.; Han, P.D.; Liang, W. Impact of boron addition on the hot deformation behavior and microstructure evolution of S31254. Mater. Lett. 2022, 315, 131971. [Google Scholar] [CrossRef]
  6. Zhang, S.C.; Yu, J.T.; Li, H.B.; Jiang, Z.H.; Geng, Y.F.; Feng, H.; Zhang, B.B.; Zhu, H.C. Refinement mechanism of cerium addition on solidification structure and sigma phase of super austenitic stainless steel S32654. J. Mater. Sci. Technol. 2022, 102, 105–114. [Google Scholar] [CrossRef]
  7. Peters, K.R.; Whittle, D.P.; Stringer, J. Oxidation and hot corrosion of nickel–based alloys containing molybdenum. Corros Sci. 1976, 16, 791–804. [Google Scholar] [CrossRef]
  8. Qin, L.; Pei, Y.L.; Li, S.S.; Zhao, X.B.; Gong, S.K.; Xu, H.B. Role of volatilization of molybdenum oxides during the cyclic oxidation of high–Mo containing Ni–based single crystal superalloys. Corros Sci. 2017, 129, 192–204. [Google Scholar] [CrossRef]
  9. Stringer, J. The reactive element effect in high–temperature corrosion. Mater. Sci. Eng. A 1989, 120, 129–137. [Google Scholar] [CrossRef]
  10. Babic, V.; Geers, C.; Panas, I. Reactive element effects in high–temperature alloys disentangled. Oxid. Met. 2020, 93, 229–245. [Google Scholar] [CrossRef]
  11. Zhang, S.C.; Li, H.B.; Jiang, Z.H.; Feng, H.; Wen, Z.J.; Ren, J.Y.; Han, P.D. Unveiling the mechanism of yttrium signifificantly improving high–temperature oxidation resistance of super austenitic stainless steel S32654. J. Mater. Sci. Technol. 2022, 115, 103–114. [Google Scholar] [CrossRef]
  12. Suwattananont, N.; Petrova, R.S. Oxidation kinetics of boronized low carbon steel AISI 1018. Oxid. Met. 2008, 70, 307–315. [Google Scholar] [CrossRef]
  13. Binder, W.O.; Weisert, E.D. Some notes on the oxidation resistance of boron–containing alloys. Corros.–Natl. Assoc. Corros. Eng. 1953, 9, 329–332. [Google Scholar]
  14. Barrett, C.A.; Miner, R.V.; Hull, D.R. The effects of Cr, Al, Ti, Mo, W, Ta, and Cb on the cyclic oxidation behavior of cast Ni–base superalloys at 1100 and 1150 °C. Oxid. Met. 1983, 20, 255–278. [Google Scholar] [CrossRef]
  15. Xu, P.P.; Ma, J.Y.; Jiang, Z.H.; Zhang, Y.; Liang, C.X.; Dong, N.; Han, P.D. Effects of B segregation on Mo–rich phase precipitation in S31254 super austenitic stainless steels: Experimental and first–principles study. Chin. Phys. B 2022, 31, 116402. [Google Scholar] [CrossRef]
  16. Yu, J.T.; Zhang, S.C.; Li, H.B.; Jiang, Z.H.; Feng, H.; Xu, P.P.; Han, P.D. Influence mechanism of boron segregation on the microstructure evolution and hot ductility of super austenitic stainless steel S32654. J. Mater. Sci. Technol. 2022, 112, 184–194. [Google Scholar] [CrossRef]
  17. Wang, Q.; Wang, L.J.; Sun, Y.H.; Zhao, A.M.; Zhang, W.; Li, J.M.; Dong, H.B.; Chou, K. The influence of Ce micro–alloying on the precipitation of intermetallic sigma phase during solidification of super austenitic stainless steels. J. Alloys Compd. 2020, 815, 152418. [Google Scholar] [CrossRef]
  18. Zhang, Y.; Zhang, W.; Zeng, L.; Liang, J.H.; Xiao, J.; Zhao, A.M. Segregation behavior and precipitated phases of super austenitic stainless steel influenced by electromagnetic stirring. Mater. Today Commun. 2022, 31, 103675. [Google Scholar] [CrossRef]
  19. Hu, X.L.; Zhao, R.X.; Deng, J.G.; Hu, Y.M.; Song, Q.G. Effect of P impurity on mechanical properties of NiAl Σ5 grain boundary: From perspectives of stress and energy. Chin. Phys. B 2018, 27, 037105. [Google Scholar] [CrossRef]
  20. Kresse, G.; Hafner, J. Ab initio molecular dynamics for open–shell transition metals. Phys. Rev. B 1993, 48, 13115–13118. [Google Scholar] [CrossRef]
  21. Kresse, G.; Hafner, J. Ab initio molecular dynamics simulation of the liquid–metal amorphous semiconductor transition in germanium. Phys. Rev. B 1994, 49, 14251–14269. [Google Scholar] [CrossRef] [PubMed]
  22. Chen, L.; Peng, P.; Zhuang, H.L.; Zhou, D.W. First–principle investigation of bismuth segregation at Σ5(012) grain boundaries in nickel. Trans. Nonferrous Met. Soc. China 2006, 16, 813–819. [Google Scholar] [CrossRef]
  23. Perdew, J.P.; Burke, K.; Ernzerhof, M. Generalized gradient approximation made simple. Phys. Rev. Lett. 1996, 77, 3865–3868. [Google Scholar] [CrossRef] [PubMed] [Green Version]
  24. Blöchl, P.E. Projector augmented–wave method. Phys. Rev. B 1994, 50, 17953–17979. [Google Scholar] [CrossRef] [PubMed] [Green Version]
  25. Ivan, L.J.; Yoshinori, S.; Yoshitaka, U.; Yoshikazu, T. Adsorption enhancement of a fatty acid on iron surface with Σ3(111) grain boundary. Appl. Surf. Sci. 2021, 543, 148604. [Google Scholar]
  26. Liu, X.Y.; Zhang, H.; Cheng, X.L. Effect of nickel segregation on CuΣ9 grain boundary undergone shear deformations. Chin. Phys. B 2018, 27, 063103. [Google Scholar] [CrossRef]
  27. Qurashi, M.S.; Cui, Y.S.; Wang, J.; Dong, N.; Bai, J.G.; Wu, Y.C.; Han, P.D. Corrosion resistance and passivation behavior of B–containing S31254 stainless steel in a low pH medium. Int. J. Electrochem. Sci. 2019, 14, 10642–10656. [Google Scholar] [CrossRef]
  28. Li, H.B.; Zhang, B.B.; Jiang, Z.H.; Zhang, S.C.; Feng, H.; Han, P.D.; Dong, N.; Zhang, W.; Li, G.P.; Fan, G.W.; et al. A new insight into high–temperature oxidation mechanism of super austenitic stainless steel S32654 in air. J. Alloys Compd. 2016, 686, 326–338. [Google Scholar] [CrossRef]
  29. Jackson, B.; Nave, S. The dissociative chemisorption of methane on Ni(100): Reaction path description of mode–selective chemistry. J. Chem. Phys. 2011, 135, 114701. [Google Scholar] [CrossRef]
  30. Wang, J.; Misra, A.; Hirth, J.P. Shear response of Σ3{112} twin boundaries in face–centered–cubic metals. Phys. Rev. B 2011, 83, 064106. [Google Scholar] [CrossRef]
  31. Bentria, E.T.; Lefkaier, I.K.; Bentria, B. The effect of vanadium impurity on Nickel Σ5(012) grain boundary. Mater. Sci. Eng. A 2013, 577, 197–201. [Google Scholar] [CrossRef]
  32. Yang, J.; Huang, J.h.; Ye, Z.; Fan, D.Y.; Chen, S.H.; Zhao, Y. First–principles investigation on the interaction of Boron atom with nickel part II: Absorption and diffusion at grain boundary. J. Alloys Compd. 2017, 708, 1089–1095. [Google Scholar] [CrossRef]
Figure 1. SEM morphologies of 254SMO–0B (a) and 254SMO–40B (b) samples aged at 1000 °C for 30 min.
Metals 13 00258 g001
Figure 2. The SEM surface morphologies of the 254SMO–0B (ad) and 254SMO–40B (eh) samples after oxidation at 900 °C for 3 min, 6 min, 9 min, 30 min.
Metals 13 00258 g002
Figure 3. The SEM surface morphologies and EDS analysis results of the 254SMO–0B (a) and 254SMO–40B (b) samples after oxidation at 900 °C for 30 min.
Metals 13 00258 g003
Figure 4. SEM surface morphologies of the 254SMO–0B (a,b) and 254SMO–40B (c,d) samples after oxidation at 1000 °C for 1.5 min, 3 min. (a′d′ is the local amplification plot of the ad).
Metals 13 00258 g004
Figure 5. SEM surface morphologies and EDS analysis results of 254SMO–0B (a) and 254SMO–40B (b) samples after oxidation at 1000 °C for 1.5 min.
Metals 13 00258 g005
Figure 6. The XRD patterns of the 254SMO–0B and 254SMO–40B samples after oxidation at 900 °C for 30 min.
Metals 13 00258 g006
Figure 7. SEM cross-section morphologies and EDS analysis results of 254SMO–0B (a) and 254SMO–40B (b) after oxidation at 900 °C for 30 min.
Metals 13 00258 g007
Figure 8. Microstructural models of FCC–FeCrMo(–B)(111) with a Σ3(112) GB and the segregation energy of Cr diffusion to the surface.
Metals 13 00258 g008
Figure 9. Microstructural models of FCC–FeCrMo(–B)(100) with a Σ5(210) GB and the segregation energy of Cr diffusion to the surface.
Metals 13 00258 g009
Figure 10. Microstructural models: the segregation energy of Cr and Mo diffusion to the surface in FCC–FeCrMo(–O–B)(111) with a Σ3(112) GB and FCC–FeCrMo(–O–B)(100) with a Σ5(210) GB.
Metals 13 00258 g010
Table 1. Chemical composition of 254SMO SASSs (wt.%).
SampleCSiMnPSCrNiMoCuNBFe
254SMO–0B0.0100.610.430.0240.00120.1818.006.000.690.193Bal.
254SMO–40B0.0140.620.940.0140.00620.1518.116.120.720.2000.004Bal.
Disclaimer/Publisher’s Note: The statements, opinions and data contained in all publications are solely those of the individual author(s) and contributor(s) and not of MDPI and/or the editor(s). MDPI and/or the editor(s) disclaim responsibility for any injury to people or property resulting from any ideas, methods, instructions or products referred to in the content.

