Article

Effects of Sintering Temperature on the Microstructure and Properties of a W-Cu Pseudo-Alloy

1
Scientific and Educational Center “Additive Technologies”, National Research Tomsk State University, Lenin Avenue, 36, 634050 Tomsk, Russia
2
Research Laboratory of the Theoretical and Applied Chemistry Department, Belgorod State Technological University Named after V.G. Shukhov, Kostykov Street, 46, 308012 Belgorod, Russia
*
Author to whom correspondence should be addressed.
Metals 2023, 13(10), 1741; https://doi.org/10.3390/met13101741
Submission received: 18 September 2023 / Revised: 9 October 2023 / Accepted: 11 October 2023 / Published: 13 October 2023
(This article belongs to the Special Issue Advances in Copper, Copper Alloys and Their Processing)

Abstract

:
This paper studies the feasibility of fabricating pseudo-alloys based on a W-Cu system through vacuum sintering of spherical bimetallic particles synthesized using the electric explosion of copper–tungsten wires in argon. The effects of the sintering temperature on the structure and hardness of the fabricated composites was studied. In terms of the structure of the samples, tungsten particles of predominantly spherical shapes with sizes ranging from submicrons to 80–90 µm were uniformly distributed throughout the copper matrix. Based on the analysis, the volume fractions of tungsten and copper were approximately equal. The calculated average phase compositions for all the samples were 58.9 wt% for W, 27.3 wt% for Cu, and 13.8 wt% WO2. When the annealing temperature increased from 1100 °C to 1250 °C, the wetting of tungsten by molten copper improved, which resulted in the porosity of the copper matrix being at the minimum, as observed in the contact zone. Due to good wetting and a decrease in the viscosity of copper, rearrangement of the solid phase of the tungsten in the bulk of the composites improved, and the density and hardness of the pseudo-alloy increased. The formation of coarse tungsten grains is caused by the fact that submicron and micron particles are growing in size and merging into agglomerates during the course of liquid-phase sintering, and this happens because of the high surface activity of ultrafine particles. Further research will be devoted to solving the discovered problems.

1. Introduction

A major challenge facing materials science today is the creation of composites with pre-defined properties by combining dissimilar components with their own set of characteristics. Pseudo-alloys are considered among such composites, wherein a strong and rigid hard-melting filler or structure is distributed in a low-melting and highly ductile matrix. Some of the most demanded composites are tungsten–copper, and they are used for materials in the manufacturing of microwave ovens, heavy-duty electronic contacts, radiators in high-power microelectronic devices, deflecting plates for thermonuclear reactors, welding electrodes, etc. [1,2] Such a wide variety of applications is possible due to a combination of the high temperature strength of W and the high thermal and electrical conductivity of Cu. Conventional processes for fabricating W-Cu composites are infiltration, i.e., impregnation of the tungsten framework with copper and liquid-phase sintering of mixed powders [1,2,3,4]. A key problem in all the processes is that high relative density can rarely be achieved, since copper and tungsten are mutually insoluble or slightly soluble, while tungsten is also poorly wetted by copper [5]. To improve wetting, activators such as Ni, Fe, and Co have been used as auxiliary substances for sintering; however, these worsen the electrical and thermal conductivity of composites [6,7]. In liquid-phase sintering, temperature is a key factor. Fabrication of high-density composites at relatively low sintering temperatures above the melting point of copper can be achieved by using ultrafine powders with high surface activities, including nanopowders [8,9,10,11]. However, some technological process issues related to the production of powders are detrimental for the quality of the precursor and the final product. For example, the mixture becomes contaminated with foreign elements during high-energy ball grinding [12,13].
However, even the use of nanosized powders does not guarantee a positive outcome. During liquid-phase sintering, ultrafine tungsten grains merge, forming agglomerates up to several micrometers in size [14,15]. In an earlier article, magnetic pulse compaction of spherical bimetallic W/Cu particles was proposed to prevent the growth of powder grains at the preparation stage. The nanopowder was obtained through the electric explosion of tungsten and copper wires that were intertwined to form a conductor [16]. As a result, the particles consisted of two parts: W and Cu. The purpose of this work is to study the structural-phase state of pseudo-alloys based on a W-Cu system fabricated under different sintering conditions. The sintering conditions are characterized by different angles of tungsten wetting with molten copper, ranging from 1100 °C, which corresponds to a contact angle of 50° in a vacuum, to 1250 °C, where the contact angle is decreased to 29 °C [17]. Also, the effects of the sintering temperature on the structure and hardness of the fabricated composites are discussed.

2. Materials and Methods

2.1. Materials

The initial powders of the pseudo-alloy were fabricated through an electric explosion of intertwined copper–tungsten wires in an argon atmosphere [16]. The bimetallic W/Cu particles had a bimodal particle size distribution in the submicron region in accordance with the phase state specifics of the explosion products. The particles had a spherical shape and consisted of Cu, α-W, and β-W phases. The samples were compacted by isostatic pressing (pressure was 200 MPa) and were subsequently subjected to annealing in a vacuum furnace at 1100 °C, 1200 °C, and 1250 °C. As a result, cylindrical samples were produced (Figure 1a). Longitudinal and cross sections of these samples were prepared for further research by sawing, grinding, and polishing (Figure 1b).

2.2. Equipment

The phase composition of the annealed samples was determined using a DRON-3 X-ray diffractometer (St. Petersburg, Russia). The filming was carried out for the Cu anode in the range of 2θ angles from 4° to 90°. The qualitative analysis of the diffraction pattern with mineral identifications was performed using the PDF-2 database from the International Center for Diffraction Data (ICDD) and the Crystallographica Search-Match software, version 2 (Oxford Cryosystems).
The microstructural features of the samples were investigated using a MIRA 3 LMU scanning electron microscope (TESCAN, Brno, Czech Republic). The elemental composition of specific regions and the mapping of the SEM images were performed using an X-MAX 50 energy-dispersive spectrometer (Oxford Instruments NanoAnalysis, High Wycombe, UK) used together with the electron microscope. Phase-contrast SEM images obtained in the BSE mode (reflected electrons) were analyzed in order to extract the quantitative data. The reflected electron signal intensity distributions were recorded as grayscale values (from 0 (black) to 255 (white)) and analyzed using the ImageJ, software version 1.52.
The density of the pseudo-alloy samples was determined using hydrostatic weighing based on the Archimedes principle. The Vickers hardness test (diamond pyramid indenter with a top angle of 136°) was conducted using a NEXUS 4504-IMP hardness tester (Innovatest, Maastricht, The Netherlands) with a load of 1 kg, and a holding time of 10 s was used for the test force. The hardness values were calculated as an average of ten measurements.

3. Result and Discussion

3.1. Phase Composition of Annealed W-Cu Samples

The analysis of the phase composition of the W-Cu pseudo-alloy samples using X-ray diffraction revealed the following phases: α-W with a body-centered cubic lattice (ICDD Card № 04-0806), Cu with a face-centered cubic lattice (ICDD Card № 04-0836), and tungsten oxide WO2 with a monoclinic crystal lattice (ICDD Card № 010-086-0134) (Figure 2). The unit cell parameters of all the phases were close to their typical values. The α-W and Cu phases are characteristic of the initial nanopowder produced through the electrical explosion of a wire [16]. Also, the metastable β-W phase in the nanopowder was not found in the bulk annealed samples. This can be attributed to the β→α transformation caused by heating above 520 °C [18,19]. Tungsten oxide could be formed as a result of the oxidation of tungsten in bimetallic powder particles during composite pressing in air.
According to the existing data, oxygen has a stabilizing effect on the β-phase of tungsten [18]. However, there were no reflections of this metastable phase in the obtained X-ray patterns. Thus, we can conclude that the tungsten oxide present in the composition was formed at the stage of sample preparation and remained unaltered during sintering. A reverse transition, WO2→W, is usually achieved through reduction by heating the sample in a hydrogen atmosphere. However, as established in [20], the reduction temperature has a significant effect on the sintering of tungsten powder nanoparticles. Specifically, particle size increases at temperatures of up to 700 °C; however, 750 °C is sufficient to obtain the W and Cu phases only [21].
When the longitudinal and cross sections are compared, it can be concluded based on the intensity of the main reflections that the ratio of the amounts of α-W and Cu remains approximately the same (Figure 2). Also, it can be seen that there is much more tungsten oxide in the cross section. The change in the intensity of peaks and the corresponding concentration of copper in the longitudinal section can be explained by the inhomogeneity of the phase distribution not only on the flat surface, but also throughout the volume. This can be observed using XRD (with a spot size ≈ 3 × 10 mm, which is significantly smaller than the section size).

3.2. Microstructure of the W-Cu Pseudo Alloy Depending on the Annealing Temperature

According to the scanning electron microscopy results, the W-Cu pseudo-alloy is a typical composite with two heterogeneous phases that can be clearly observed (Figure 3). This is especially clearly seen in the BSE images formed by reflected electrons. The microstructures of the samples are comprised of a copper matrix that is highly filled with tungsten particles of various sizes and predominantly spherical shapes (Figure 3a,b). The sample’s matrix is formed by copper melting at temperatures above 1083 °C (its melting point) during annealing.
The elemental composition analysis using EDS confirmed the presence of the phases identified using XRD: W, Cu, and WO2 (Figure 3b–d). It should be noted that the oxygen in the structure is distributed fairly evenly. There are brighter areas that correspond to rather large particles of tungsten oxide, both on the large particles of tungsten and in the copper matrix, while they are only present in small amounts elsewhere. This oxidation of large tungsten particles is localized in surface defects and cleavages, and the presence of oxygen in the copper matrix can be attributed to the very small WO2 particles within it.
As established earlier [16], in samples that were not subjected to high-temperature annealing, the copper matrix was formed as a result of solid-phase sintering of copper particles without complete alloying. Also, the tungsten particles were not completely wetted by the copper, which resulted in pores and voids being formed within the structure, especially around larger particles. After annealing at 1100 °C, numerous pores were also observed in the copper matrix, and those were localized mainly near the tungsten particles (Figure 4a). Despite the transition of copper to the liquid state at this temperature, it did not wet tungsten particles very well (the wetting angle was 50°). When the annealing temperature is increased to 1200 °C, the wetting of tungsten by molten copper improves. As a result, the minimum porosity of the copper matrix was observed in the contact zone (Figure 4b). At 1250 °C, the contact angle of tungsten wetting with liquid copper is 29° [17]. Here, the contact zone looks similar to the sample annealed at 1200 °C (Figure 4c).
Evenly distributed particles of hard-melting tungsten form a sort of pseudo-alloy framework, and its entire pore space is occupied by the copper matrix (Figure 5). Meanwhile, the size of the tungsten particles varies within a wide range, from submicrons to 80–90 µm. Large, dark-colored formations were observed to have a similar size (tens of microns) and corresponded to the volume of the copper matrix. The formation of all the large fragments is associated with the increased size of the submicron and micron particles and their merger into agglomerates due to the high surface activity of ultrafine particles [14,15,20]. This was observed in all the samples. Overall, all the samples (regardless of their annealing temperature) had a similar microstructure (Figure 5).
As seen in Figure 4 and Figure 5, the structure of the sintered samples included micron and submicron tungsten particles. The emergence of micron grains when obtaining the powder through the electric explosion of wires is explained by insufficient energy for the sublimation of the tungsten wire, as highlighted in [22]. Pseudo-alloys with high hardness and thermal conductivity can be obtained through sintering of such powders based on particles of different sizes. Changing the ratio of micron and submicron particles is a promising process for improving the mechanical properties of composites obtained using powder metallurgy [23]. Specifically, with regard to the process of metal powder synthesis through the electric explosion of wires used herein, the energy input into the wire can be reduced to increase the ratio of micron particles [24,25]. The presence of large particles in the present work can be similarly explained, as noted above.
The elemental composition the data collected from a small section (Figure 3 and Figure 4) does not provide a complete representation of the actual composition of the composite material due to the inhomogeneous distribution of particles throughout the volume. Increasing the sample surface will improve the reliability of the results, although in this case, only a local investigation in a single plane will take place. In the present article, elemental analysis was collected from a maximum area of 1 × 1 mm (Figure 5, Table 1). As seen from Table 1, the pseudo-alloy samples had similar compositions after annealing at three different temperatures, with only small fluctuations that did not exceed 2–3%. If we compare these data with the XRD results (Figure 2a), then there is no significant increase in the copper content as the annealing temperature is increased from 1100 °C to 1250 °C. The average ratio of the weight of tungsten to copper while excluding oxygen is 72:28 (Table 1). Based on the elemental composition of the longitudinal sections, the phase composition was calculated, and its average values for all three samples were as follows: W 58.9 wt%, Cu 27.3 wt%, and WO2 13.8 wt%.
Mapping and collection for elemental analysis from large cross sections is difficult and inefficient. Therefore, in this case, a different analysis method was used. Filming using an electron microscope in the reflected electrons mode (BSE) allows for phase-contrast images to be obtained (Figure 6). SEM images are grayscale maps of the distribution of reflected electron signal intensities. Based on this, the quantitative content of each phase was calculated from the analysis of micrographs of longitudinal and cross sections of the pseudo-alloy samples with a large visible field of 5 × 5 mm (Table 2 and Table 3). This method is sometimes used to analyze the composition and microstructural features of various composites, including alloys, based on the results of electron microscopy or X-ray computed tomography [26,27,28,29]. No examples of using this technique for studying W-Cu composites were found in the literature.
As seen in Table 2, averaging over a larger area gives significantly different results. After calculating the phase composition from the EDS data from an area of 1 × 1 mm, the material obtained after annealing at a temperature of 1100 °C was found to be the closest match to the calculated phase composition. Also, it was characterized by approximately equal volume fractions of W and Cu (while excluding WO2). After annealing at the other two temperatures, 1200 °C and 1250 °C, the ratio of tungsten to copper was shifted first to one component, and then to the other (Table 2). This once again indicates the relative inhomogeneity of the distribution of material particles within the volume of the composite, as well as the limited and localized nature of the analysis. The revealed differences in the composition confirmed the XRD results (Figure 2a).
In a similar study of pseudo-alloy cross sections (with a visible field of 5 × 5 mm) using image analysis, it was found that there was no distinct peak characterizing tungsten oxide in the grayscale distribution diagram (Figure 7). There were two local maxima corresponding to copper and tungsten. The inflection point between these extrema was taken as the boundary separating the two phases. From this, the average volume fractions of W and Cu in the cross sections of the pseudo-alloys were determined (Table 3).
As seen in Table 3, all the samples were generally characterized by more or less equal volume ratios of tungsten and copper. There were small deviations from 50%, but their absolute values did not exceed 3.3%.
Cross sections of the pseudo-alloy samples revealed structural inhomogeneities, which were visible to the naked eye (Figure 1b). The central area in the form of a circle was darker, while the edges were lighter. There were apparent differences in composition and structure between these zones. This was confirmed by the SEM results (Figure 8, Table 4 and Table 5). The cause of the occurrence of these inhomogeneities was most likely related to the process of obtaining and processing the pseudo-alloy composite materials.
The SEM image clearly shows a transition boundary between the zones (Figure 8a). Visually, in the central zone, the darker copper matrix is somewhat larger than in the edge zone. This was confirmed by the results of elemental analysis (Table 4). In addition, the intensity of the W and Cu signals showed that in the central zone, the periodicity of the phase change was greater (area up to ≈500–600 µm) (Figure 8b–d). This is also explained by the presence of rather large tungsten particles. In the edge zone, the occurrence frequency of the W and Cu phases was much higher (the region after ≈500–600 μm). Most likely, the size of the tungsten particles was also somewhat smaller.
The EDS results show that in the cross sections, even in the central zone, there was a shift in the W:Cu ratio towards tungsten (Table 4) compared to the data for the longitudinal sections (Table 1). Also, if we exclude WO2, the central region was characteristic of an approximately equal volume content of W and Cu for all the samples, and the absolute deviation was no more than 3% from the average 33% (Table 5). This confirms the previously described results of the analysis of other cross sections (Table 2 and Table 3). Most likely, during the annealing of the samples, unbound and finely dispersed particles and tungsten agglomerates were displaced by the movement of liquid copper through the porous framework of the pseudo-alloy and were then deposited in narrower and more closed pores located in the edge zones of the composites. In this case, the tungsten phase is redistributed, and the edge regions of the samples are somewhat enriched with it. Larger unmoved aggregates of tungsten particles that make up the framework were located in the central region of the composites, and a significant part of micro- and nanoparticles of tungsten was concentrated in the edge zones. This version is supported by protrusions of pure copper on the outer side surface of the composites (Figure 1). Attention is drawn to the large percentage of oxygen and tungsten oxide phases in the central region of the cross sections, which was approximately two times higher than that discovered in the longitudinal sections. This confirms the XRD results demonstrating that the WO2 reflections also had higher intensities (Figure 2b).
However, in the edge zones of the cross sections, the content of oxygen decreases significantly, and it becomes close to the values obtained for the longitudinal sections (Table 4 and Table 5).
Whereas the elemental composition in the central regions of the cross sections was approximately the same for all the samples, it differed for the edge zones depending on the temperature (Table 4 and Table 5). For the sample annealed at 1200 °C, there were no large differences between the center and the edge. In pseudo-alloys annealed at 1100 °C, and especially at 1250 °C, there was a significant increase in the percentage of tungsten in the edge region. Thus, there was some heterogeneity in the composition of the composite.

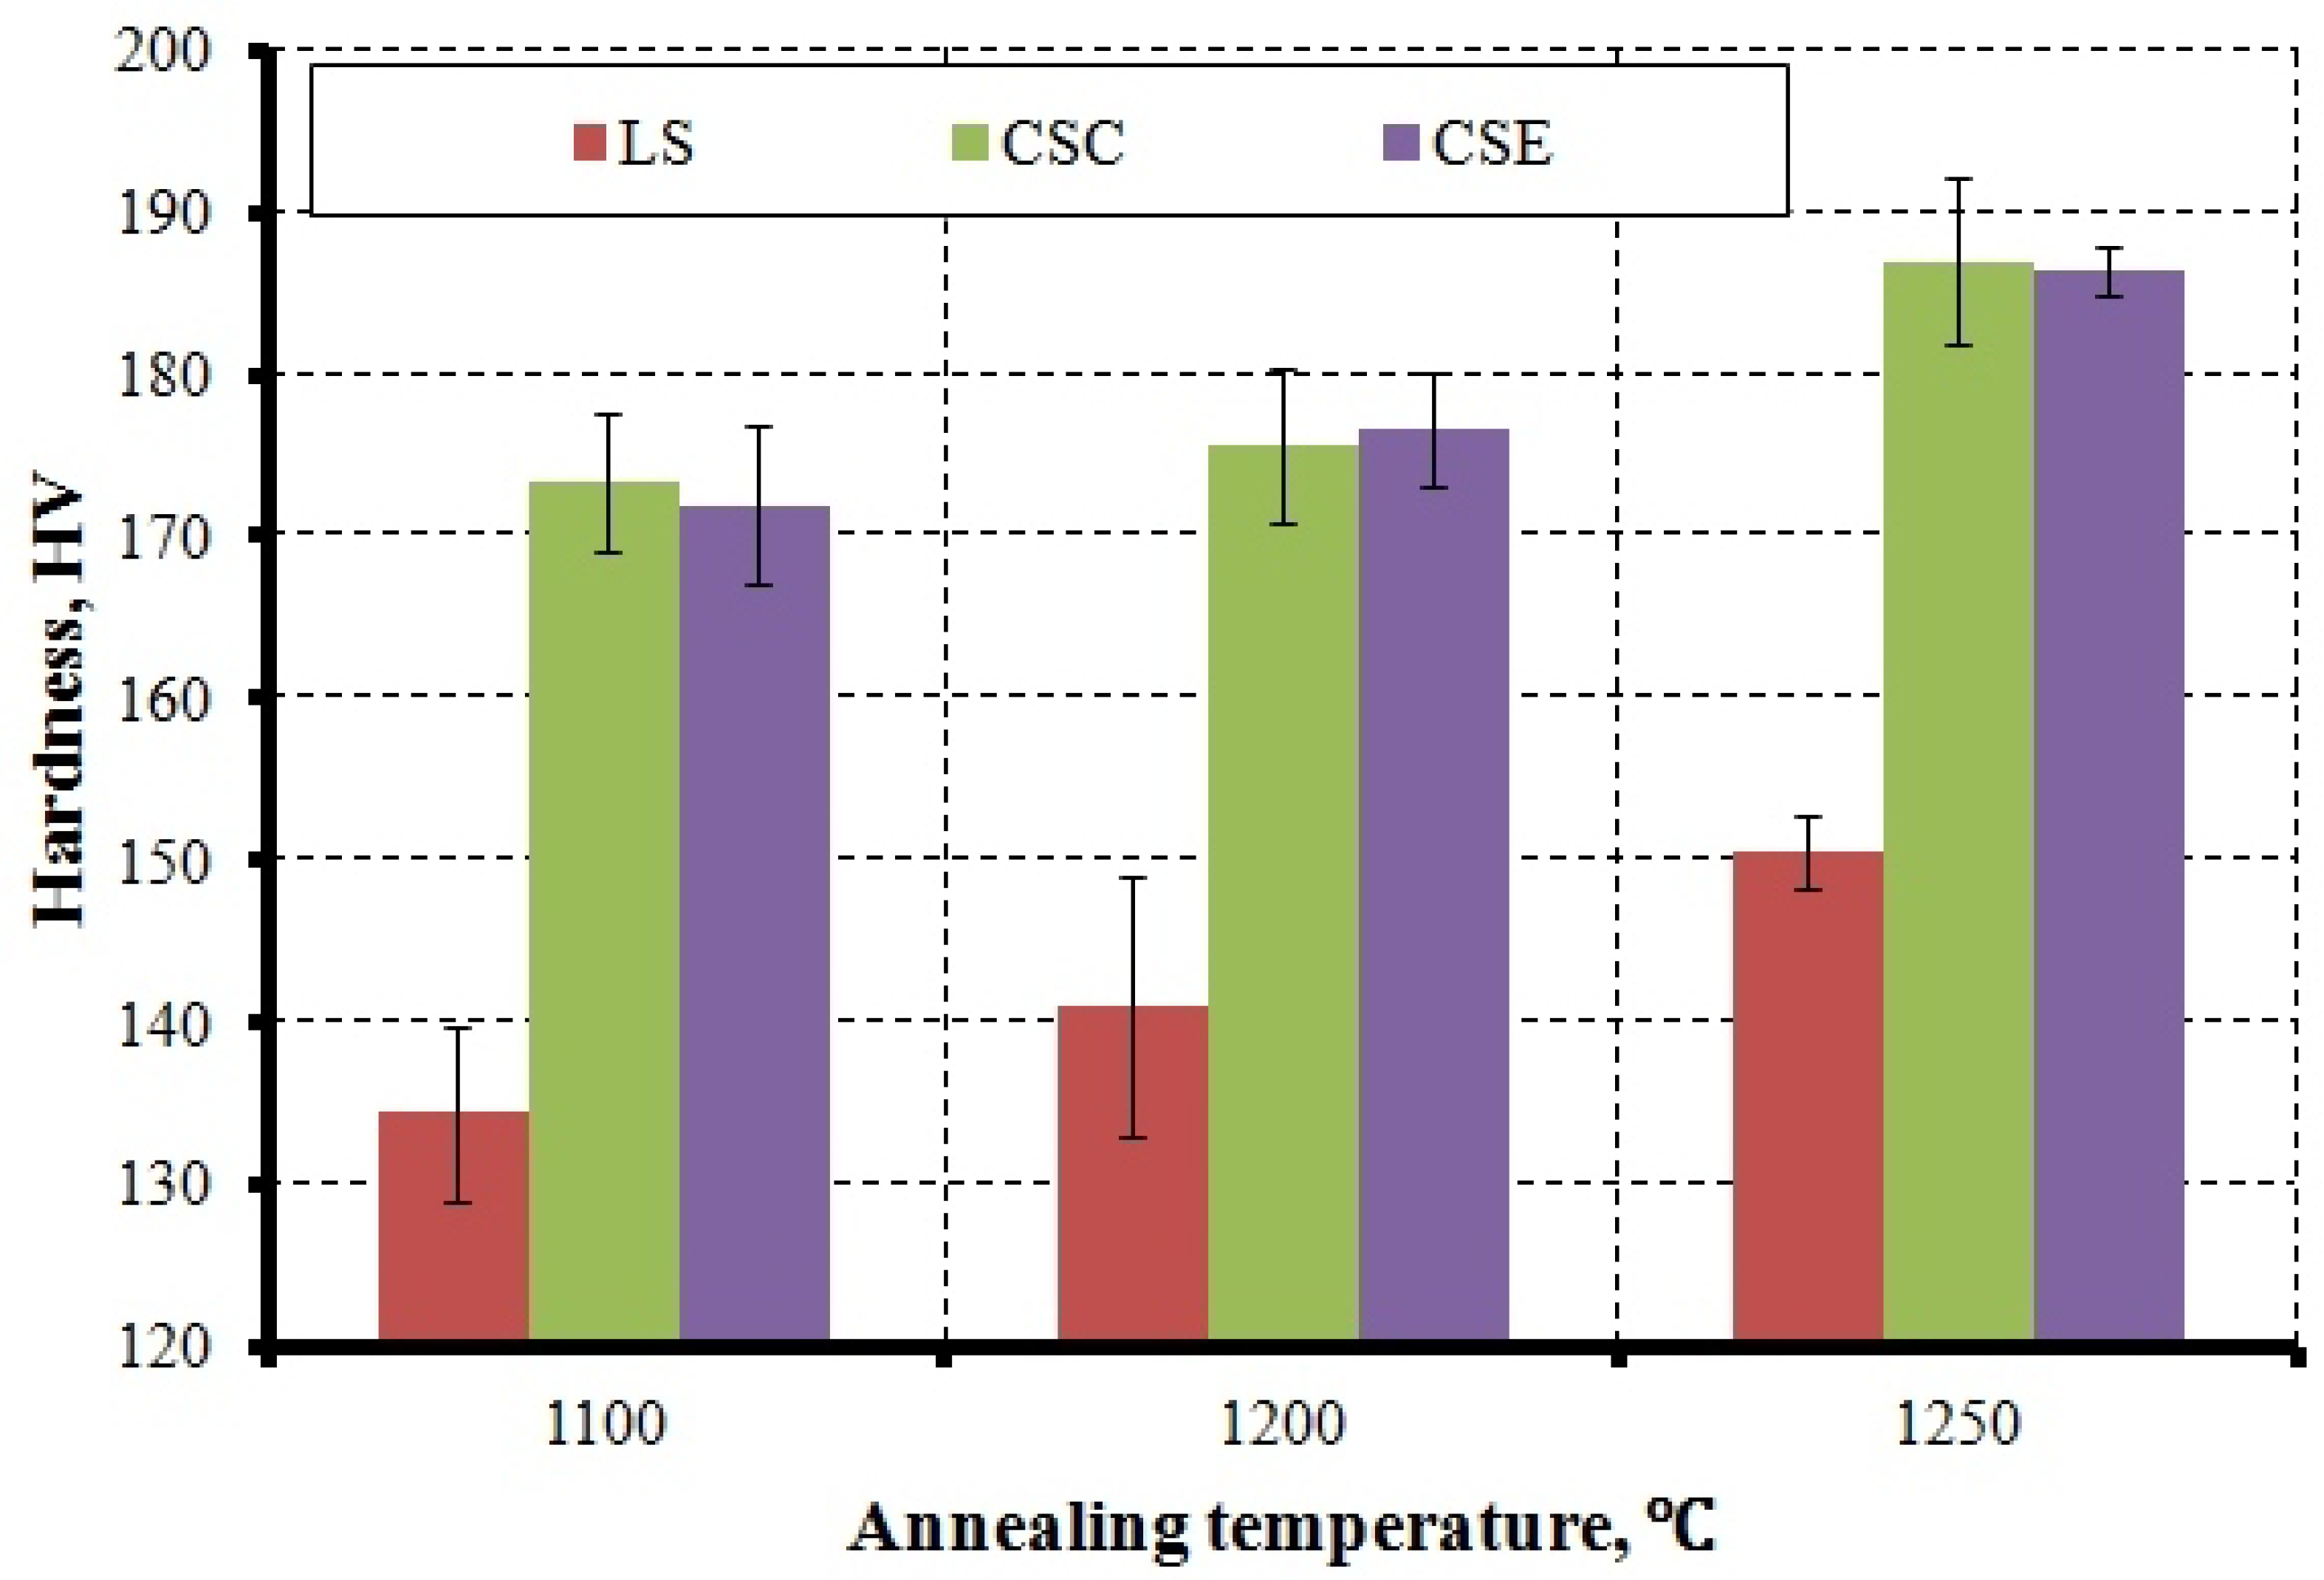
3.3. Density and Hardness of Pseudo-Alloy Samples Depending on the Annealing Temperature

The process for obtaining the pseudo-alloy used herein, including the initial compaction of the powder mixture of metals followed by annealing at temperatures above the melting point of copper, directly affects the formation of the structure of the composites. With high pressure pressing, it is possible to rearrange the particles, reduce the pore size, and increase the contact area between the particles [10,30,31]. However, the material’s density must allow for liquid-phase sintering of copper in the open pore space of the tungsten framework, as copper melting has a strong effect on the consolidation of W-Cu composites. In general, densification during liquid-phase sintering occurs due to the cumulative effects of particle rearrangement resulting from the action of capillary forces, adjustment to grain shape through solution re-precipitation, and sintering of tungsten through solid state diffusion [32]. In the case of W-Cu composites, the main densification mechanism will be the rearrangement of solid tungsten particles by the liquid copper solution.
Excessive compaction above 400 MPa in a similar study [33] led to a decrease in the density of the sintered composite due to the condensation of tungsten particles in the framework. This occurs despite the fact that there are more contacts between the particles and the pore sizes have decreased.
The effect of the sintering temperature on the density of the synthesized composites is shown in Figure 9. As seen in the figure, for two series of samples, increasing the annealing temperature leads to an increase in the composite samples’ densities. This is due to a decrease in the viscosity of the liquid phase of copper and better wetting of tungsten particles by it, which facilitates the rearrangement of the solid W phase in the bulk of the composite [30].
The investigated samples were characterized by fine-grained microstructures with a clear predominance of micron particles and agglomerates within the volume (Figure 3, Figure 4 and Figure 5). In research works devoted to this topic, synthesizing composites with a similar structure has made it possible to obtain relative density values in the range of 70–90% [32,34]. The density values measured in the present research were ≈84% of the theoretically possible value (14.16 g/cm3, calculated from equal volume fractions of W and Cu) for the longitudinal sections and 85–88%, for the cross sections. This does not exceed the described range. By using a powder with particle sizes in the submicron range, it is possible to synthesize pseudo-alloys with similar compositions with a relative density of up to 98–99%, which has already been repeatedly demonstrated [9,10,30,32,35].
Vickers hardness measurements have shown that an increase in the annealing temperature causes the hardness values to consistently increase, regardless of the sample cross section taken (Figure 9 and Figure 10). At the same time, the values obtained from the longitudinal section were significantly lower than those measured in the cross section (Figure 10). Whereas in the longitudinal sections, the hardness increased from 134.44 ± 5.46 HV to 150.55 ± 2.32 HV, in the cross sections, the changes ranged from 173.47 ± 4.23 HV to 187.01 ± 5.20 HV. In general, the increases in the two different planes were approximately the same, and they ranged from 13.5 to 16.1 HV. The differences in the hardness and density characterized different series of samples.
The increases in the hardness of the composites were primarily related to the structure density; the higher the density, the higher the hardness (Figure 10). Thus, composite microhardness values are a peculiar indicator characterizing the homogeneity of the microstructure [36].
The hardness values in the longitudinal section increased uniformly (Figure 9a). In the cross section, the main increase in the hardness occurred with an increase in the annealing temperature from 1200 °C to 1250 °C (Figure 9b). The difference between 1100 °C and 1200 °C was very small. The microhardness values obtained were consistent with the results of other studies of W-Cu pseudo-alloys [33,37].
The measured hardness values turned out to be higher than the theoretically calculated 127.5 HV (based on the equality of the volume fractions of W (220 HV) and Cu (35 HV)), which was confirmed experimentally. In [22], this phenomenon is explained by the fine-grained structure of the W-Cu composite. Here, in a copper matrix highly filled with tungsten, the tungsten frame of the pseudo-alloy assumes the main load.
The obtained microhardness values are in good agreement with the results of similar studies on the synthesis of composites with micron tungsten particles, where the values also did not exceed 200 HV [3,31,38].
The density and hardness of the W-Cu composites studied in the present article were lower than those in many other studies in which the nanosized material structure was obtained [10,30,37,38]. The main cause of this is the agglomeration of nanoparticles and microparticles of tungsten, which makes the structure of the material coarser.
The results presented in this article on the possibility of obtaining pseudo-alloys of W-Cu through liquid-phase sintering of spherical bimetallic particles are of interest from the point of view of using the powder-producing technology through electric explosion of copper–tungsten wires. The discovered problems are associated with the formation of large tungsten grains in the process of liquid-phase sintering, resulting in inferior density and hardness indicators compared to those of composites which have a more finely dispersed structure. Further work will be devoted to solving this problem.

4. Conclusions

This article examined W-Cu pseudo-alloy samples obtained through the liquid-phase sintering of spherical bimetallic particles, which were synthesized via an electric explosion of intertwined wires and pre-compacted using magnetic pulse pressing. The following results were obtained:
  • The phase composition of the sintered composites was represented by α-W, Cu, and WO2, which were formed as a result of oxidation during compaction.
  • The microstructure of the samples was made up of a copper matrix, which was highly filled with tungsten particles of predominantly spherical shapes with sizes ranging from submicrons to 80–90 µm. The formation of coarse grains was caused by submicron and micron particles growing in size and merging into agglomerates during the course of liquid-phase sintering due to the high surface activity of ultrafine particles.
  • As the annealing temperature increased from 1100 °C to 1250 °C, the wetting of tungsten by molten copper improved, which resulted in the porosity of the copper matrix decreasing to a minimum, as observed in the contact zone.
  • Elemental analysis performed on a small area and an analysis of phase-contrast SEM images of a large area showed an approximate equality in the volume fractions of tungsten and copper in the structure of the composites. The average phase composition calculated based on the EDS analysis of all samples was as follows: W 58.9 wt%, Cu 27.3 wt%, and WO2 13.8 wt%.
  • Cross sections of W-Cu pseudo-alloys show structural inhomogeneities. The central zone of the samples was enriched in copper, while the edge zones were enriched in tungsten. Most likely, during the annealing process, fine particles and tungsten agglomerates were redistributed by the driving force of the molten copper.
  • Increasing the annealing temperature caused the density of the composite samples to increase as well. This was due to a decrease in the viscosity of the liquid phase of copper and better wetting of tungsten particles by it, which facilitated a rearrangement of the solid W phase in the bulk of the composite.
  • As the annealing temperature increased, the hardness values consistently increased, regardless of the cross section of the sample, which was determined primarily by the density of the structure.
  • The W-Cu composites studied in this article had density and hardness values lower than those reported in many other studies. The main cause of this was the agglomeration of nanoparticles and microparticles of tungsten, which made the structure of the material coarser.

Author Contributions

Conceptualization, M.L. (Mikhail Lebedev) and V.P.; methodology, A.V.; analysis, M.L. (Mikhail Lebedev); investigation, N.S.; writing—original draft preparation, M.L. (Mikhail Lebedev); writing—review and editing, V.P.; visualization, A.V.; supervision, M.L. (Marat Lerner); project administration, M.L. (Marat Lerner). All authors have read and agreed to the published version of the manuscript.

Funding

This research was funded by Russian Science Foundation, grant number 21-79-30006.

Data Availability Statement

Not applicable.

Acknowledgments

This research was carried out using the equipment of the Tomsk Regional Core Shared Research Facilities Center of National Research Tomsk State University. The Center was supported by the Ministry of Science and Higher Education of the Russian Federation, Grant no. 075-15-2021-693 (no. 13.RFC.21.0012).

Conflicts of Interest

The authors declare no conflict of interest.

References

  1. Dong, L.L.; Ahangarkani, M.; Chen, W.G.; Zhang, Y.S. Recent progress in development of tungsten-copper composites: Fabrication, modification and applications. Int. J. Refract. Met. Hard Mater. 2018, 75, 30–42. [Google Scholar] [CrossRef]
  2. Wang, Y.; Zhuo, L.; Yin, E. Progress, Challenges and Potentials/Trends of Tungsten-Copper (W-Cu) Composites/Pseudo-Alloys: Fabrication, Regulation and Application. Int. J. Refract. Met. Hard Mater. 2021, 100, 105648. [Google Scholar] [CrossRef]
  3. Zhuo, L.; Zhang, J.; Zhang, Q.; Wang, H.; Zhao, Z.; Chen, Q.; Liang, S.; Xu, J.; Xi, A. Achieving both high conductivity and reliable high strength for W–Cu composite alloys using spherical initial powders. Vacuum 2020, 181, 109620. [Google Scholar] [CrossRef]
  4. Tian, Y.; Sun, J.; Xu, Z.; Meng, X.; Chen, Z.; Tang, J.; Luo, L.; Wu, Y. Shape Retention of W-30Cu Composites Prepared by 20 Wt% Cu Melt Infiltration into W-10Cu Green Parts Made via BJ3DP. Int. J. Refract. Met. Hard Mater. 2023, 115, 106319. [Google Scholar] [CrossRef]
  5. Petrunin, I.E.; Grzhimal’skii, L.L. Interaction of tungsten with copper, manganese, silver, and tin. Met. Sci. Heat Treat. 1969, 11, 24–26. [Google Scholar] [CrossRef]
  6. Zhang, H.; Liu, J.R.; Zhang, G.H. Preparation and Properties of W-30 Wt% Cu Alloy with the Additions of Ni and Fe Elements. J. Alloys Compd. 2022, 928, 167040. [Google Scholar] [CrossRef]
  7. Zhang, H.; Deng, X.C.; Zhang, G.H. Preparation and Properties of Multiphase Solid-Solution Strengthened High-Performance W–Cu Alloys through Alloying with Mo, Fe and Ni. Mater. Sci. Eng. A 2023, 871, 144909. [Google Scholar] [CrossRef]
  8. Li, X.; Hu, P.; Wang, J.; Chen, S.; Zhou, W. In Situ Synthesis of Core-Shell W-Cu Nanopowders for Fabricating Full-Densified and Fine-Grained Alloys with Dramatically Improved Performance. J. Alloys Compd. 2021, 853, 156958. [Google Scholar] [CrossRef]
  9. Qiu, W.T.; Qiu, W.T.; Pang, Y.; Xiao, Z.; Li, Z. Preparation of W-Cu alloy with high density and ultrafine grains by mechanical alloying and high pressure sintering. Int. J. Refract. Met. Hard Mater. 2016, 61, 91–97. [Google Scholar] [CrossRef]
  10. Fan, J.; Liu, T.; Zhu, S.; Han, Y. Synthesis of ultrafine/nanocrystalline W–(30–50) Cu composite powders and microstructure characteristics of the sintered alloys. Int. J. Refract. Met. Hard Mater. 2012, 30, 33–37. [Google Scholar] [CrossRef]
  11. Alam, S.N. Synthesis and characterization of W–Cu nanocomposites developed by mechanical alloying. Mater. Sci. Eng. A 2006, 433, 161–168. [Google Scholar] [CrossRef]
  12. Mikó, T.; Kristály, F.; Pethő, D.; Svéda, M.; Karacs, G.; Gergely, G.; Gácsi, Z.; Roósz, A. Investigation of Nanocrystalline Sintered W-25 wt% Cu Composite. Int. J. Refract. Met. Hard Mater. 2021, 95, 105438. [Google Scholar] [CrossRef]
  13. Pillari, L.K.; Bakshi, S.R.; Chaudhuri, P.; Murty, B.S. Fabrication of W-Cu Functionally Graded Composites Using High Energy Ball Milling and Spark Plasma Sintering for Plasma Facing Components. Adv. Powder Technol. 2020, 31, 3657–3666. [Google Scholar] [CrossRef]
  14. Kim, J.C.; Moon, I.H. Sintering of nanostructured W-Cu alloys prepared by mechanical alloying. Nanostruct. Mater. 1998, 10, 283–290. [Google Scholar] [CrossRef]
  15. Yu, J.H.; Kim, T.H.; Lee, J.S. Particle growth during liquid phase sintering of nanocomposite W-Cu powder. Nanostruct. Mater. 1997, 9, 229–232. [Google Scholar] [CrossRef]
  16. Pervikov, A.; Filippov, A.; Mironov, Y.; Kalashnikov, M.; Krinitcyn, M.; Eskin, D.; Lerner, M.; Tarasov, S. Microstructure and properties of a nanostructured W-31 wt% Cu composite produced by magnetic pulse compaction of bimetallic nanoparticles. Int. J. Refract. Met. Hard Mater. 2022, 103, 105735. [Google Scholar] [CrossRef]
  17. Clyne, T.W.; Hull, D. An Introduction to Composite Materials, 3rd ed.; Cambridge University Press: Cambridge, UK, 2018. [Google Scholar]
  18. Shen, Y.G.; Mai, Y.W. Influences of oxygen on the formation and stability of A15 β-W thin films. Mater. Sci. Eng. A 2000, 284, 176–183. [Google Scholar] [CrossRef]
  19. Morcom, W.R.; Worrell, W.L.; Sell, H.G.; Kaplan, H.I. The preparation and characterization of beta-tungsten, a metastable tungsten phase. Metall. Mater. Trans. B 1974, 5, 155–161. [Google Scholar] [CrossRef]
  20. Ren, C.; Fang, Z.Z.; Zhang, H.; Koopman, M. The study on low temperature sintering of nano-tungsten powders. Int. J. Refract. Met. Hard Mater. 2016, 61, 273–278. [Google Scholar] [CrossRef]
  21. Zhou, Y.; Sun, Q.X.; Liu, R.; Wang, X.P.; Liu, C.S.; Fang, Q.F. Microstructure and properties of fine grained W–15 wt.% Cu composite sintered by microwave from the sol–gel prepared powders. J. Alloys Compd. 2013, 547, 18–22. [Google Scholar] [CrossRef]
  22. Pervikov, A.V.; Lozhkomoev, A.S.; Dvilis, E.S.; Kalashnikov, M.P.; Paygin, V.D.; Khasanov, O.L.; Lerner, M.I. Synthesis of W-Cu composite nanoparticles by the electrical explosion of two wires and their consolidation by spark plasma sintering. Mater. Res. Express 2020, 6, 1265i9. [Google Scholar] [CrossRef]
  23. Sabirov, I.; Enikeev, N.A.; Murashkin, M.Y.; Valiev, R.Z. Bulk Nanostructured Materials with Multifunctional Properties; Springer International Publishing: Berlin/Heidelberg, Germany, 2015. [Google Scholar]
  24. Kotov, Y.A. The electrical explosion of wire: A method for the synthesis of weakly aggregated nanopowders. Nanotechnologies Russ. 2009, 4, 415–424. [Google Scholar] [CrossRef]
  25. Sarkisov, G.S.; Sasorov, P.V.; Struve, K.W.; McDaniel, D.H. State of the metal core in nanosecond exploding wires and related phenomena. J. Appl. Phys. 2004, 96, 1674–1686. [Google Scholar] [CrossRef]
  26. Sun, J.; Song, H. Feature extraction and reconstruction of particles reinforced metal matrix composite microstructure. In Proceedings of the 2nd International Conference on Interaction Sciences: Information Technology, Culture and Human, Seoul, Republic of Korea, 24–26 November 2009; pp. 1393–1397. [Google Scholar]
  27. Huang, M.; Li, Y. X-ray tomography image-based reconstruction of microstructural finite element mesh models for heterogeneous materials. Comput. Mater. Sci. 2013, 67, 63–72. [Google Scholar] [CrossRef]
  28. Xu, Z.; Joshi, V.; Hu, S.; Paxton, D.; Lavender, C.; Burkes, D. Modeling the homogenization kinetics of as-cast U-10wt% Mo alloys. J. Nucl. Mater. 2016, 471, 154–164. [Google Scholar] [CrossRef]
  29. Chen, Y.S.; Liu, N.; Liu, K. A standardized methodology for Al-Cu wire bonded intermetallic compound measurement. In Proceedings of the 2017 IEEE 24th International Symposium on the Physical and Failure Analysis of Integrated Circuits (IPFA), Chengdu, China, 4–7 July 2017; pp. 1–7. [Google Scholar]
  30. Ardestani, M.; Rezaie, H.R.; Arabi, H.; Razavizadeh, H. The effect of sintering temperature on densification of nanoscale dispersed W–20–40% wt Cu composite powders. Int. J. Refract. Met. Hard Mater. 2009, 27, 862–867. [Google Scholar] [CrossRef]
  31. Li, Y.; Zhang, J.; Luo, G.; Sun, Y.; Shen, Q.; Zhang, L. Low-Temperature Densification and Microstructure of W-Cu Composites with Sn Additives. J. Mater. Res. Technol. 2021, 10, 121–131. [Google Scholar] [CrossRef]
  32. Johnson, J.L.; Brezovsky, J.J.; German, R.M. Effects of tungsten particle size and copper content on densification of liquid-phase-sintered W-Cu. Metall. Mater. Trans. A 2005, 36, 2807–2814. [Google Scholar] [CrossRef]
  33. Luo, L.M.; Tan, X.Y.; Lu, Z.L.; Zhu, X.Y.; Zan, X.; Luo, G.N.; Wu, Y.C. Sintering behavior of W–30Cu composite powder prepared by electroless plating. Int. J. Refract. Met. Hard Mater. 2014, 42, 51–56. [Google Scholar] [CrossRef]
  34. Elsayed, A.; Li, W.; El, O.A.; Daoush, W.M.; Olevsky, E.A.; German, R.M. Experimental investigations on the synthesis of W–Cu nanocomposite through spark plasma sintering. J. Alloys Compd. 2015, 639, 373–380. [Google Scholar] [CrossRef]
  35. Ding, X.P.; Xu, W.N.; Luo, L.M.; Qin, Y.Q.; Wu, Y.C. Microstructure and Properties of W-Cu Composites with Low Copper Content at Different Sintering Temperatures. Int. J. Refract. Met. Hard Mater. 2023, 113, 106219. [Google Scholar] [CrossRef]
  36. Kim, D.G.; Kim, G.S.; Suk, M.J.; Oh, S.T.; Kim, Y.D. Effect of heating rate on microstructural homogeneity of sintered W–15wt% Cu nanocomposite fabricated from W–CuO powder mixture. Scr. Mater. 2004, 51, 677–681. [Google Scholar] [CrossRef]
  37. Han, T.; Hou, C.; Zhao, Z.; Huang, X.; Tang, F.; Li, Y.; Song, X. W–Cu composites with excellent comprehensive properties. Compos. Part B Eng. 2022, 233, 109664. [Google Scholar] [CrossRef]
  38. Zhang, Q.; Liang, S.; Zhuo, L. Ultrafine-grained W–25 wt-% Cu composite with superior high-temperature characteristics. Mater. Sci. Technol. 2017, 33, 2071–2077. [Google Scholar] [CrossRef]
Figure 1. Photographs showing W-Cu pseudo-alloy samples annealed at 1100 °C, 1200 °C, and 1250 °C (a), as well as the longitudinal and cross sections prepared for this research (b).
Metals 13 01741 g001
Figure 2. X-ray patterns of longitudinal (a) and cross (b) sections of W-Cu pseudo-alloy samples annealed at 1100 °C, 1200 °C, and 1250 °C.
Metals 13 01741 g002
Figure 3. SEM image of a W-Cu pseudo-alloy sample annealed at 1100 °C (a) and its EDS mapping (b), copper distribution (c), tungsten distribution (d), and oxygen distribution (e).
Metals 13 01741 g003
Figure 4. Microstructure of the contact zone between tungsten particles and the copper matrix in W-Cu pseudo-alloys after annealing at 1100 °C (a), 1200 °C (b), and 1250 °C (c).
Metals 13 01741 g004
Figure 5. Photographs of the microstructure of W-Cu pseudo-alloy samples after annealing at 1100 °C (a), 1200 °C (b), and 1250 °C (c).
Metals 13 01741 g005
Figure 6. Phase contrast BSE SEM image of a W-Cu pseudo-alloy sample and the investigated phases.
Metals 13 01741 g006
Figure 7. Differential and integral (blue line) distribution of pixels as an interpretation of the intensity of the reflected electrons signals, represented as shades of gray in a 5 × 5 mm cross section of a W-Cu pseudo-alloy sample.
Metals 13 01741 g007
Figure 8. SEM image of a cross section of a W-Cu pseudo-alloy sample after annealing at a temperature of 1250 °C (a). A linear fragment is shown in the analyzed line (b), and the distributions of Cu (c) and W (d) are shown along the analyzed line.
Metals 13 01741 g008
Figure 9. Correlation between the hardness of W-Cu pseudo-alloys and density of the samples in the longitudinal (a) and cross (b) sections after annealing at different temperatures.
Metals 13 01741 g009
Figure 10. Hardness values of W-Cu pseudo-alloys depending on the annealing temperature. LS denotes longitudinal sections; CSC is the cross-section center; and CSE is the cross-section edge.
Metals 13 01741 g010
Table 1. Elemental composition of 1 × 1 mm longitudinal sections and the calculated phase composition of the W-Cu pseudo-alloy samples after annealing at different temperatures.
Annealing Temperature, °CElemental Composition, wt%Phase Content, wt%
WCuOWCuWO2
110070.128.01.859.728.012.2
120072.225.72.160.125.714.2
125069.628.22.256.928.214.9
Table 2. Composition of the W-Cu pseudo-alloy samples after annealing at different temperatures, as calculated from the distribution of grayscale shades in the photographs of longitudinal sections 5 × 5 mm in size.
PhasePhase Content after Annealing at a Specific Temperature, °C
110012001250
vol%wt%vol%wt%vol%wt%
W40.858.444.061.236.954.4
Cu42.328.036.623.645.030.7
WO217.013.619.415.218.114.9
Table 3. Average volume fractions of tungsten and copper in W-Cu pseudo-alloy samples after annealing at different temperatures, as calculated from the distribution of shades of gray in photographs of 5 × 5 mm cross sections.
PhasePhase Content, vol%, after Annealing at Specific Temperatures, °C
110012001250
W48.253.349.3
Cu51.846.750.7
Table 4. Elemental composition of 1 × 1 mm W-Cu pseudo-alloy cross-sections after annealing at different temperatures.
ElementElement Content, wt%, after Annealing at Specific Temperatures, °C
110012001250
CenterEdgeCenterEdgeCenterEdge
W75.878.974.572.372.482.6
Cu20.218.921.325.323.514.7
O4.02.24.22.44.12.6
Table 5. Composition of the W-Cu pseudo-alloy samples after annealing at different temperatures, as calculated from the elemental composition data obtained from 1 × 1 mm longitudinal sections.
PhaseContent, wt%/vol%, after Annealing at Specific Temperatures, °C
110012001250
CenterEdgeCenterEdgeCenterEdge
W52.8/36.566.2/49.650.3/34.258.5/41.248.8/32.867.6/51.7
Cu20.2/30.118.9/30.521.3/31.325.3/38.523.5/34.014.7/24.3
WO227.0/33.314.9/19.928.4/34.516.2/20.327.7/33.117.6/24.0
Disclaimer/Publisher’s Note: The statements, opinions and data contained in all publications are solely those of the individual author(s) and contributor(s) and not of MDPI and/or the editor(s). MDPI and/or the editor(s) disclaim responsibility for any injury to people or property resulting from any ideas, methods, instructions or products referred to in the content.

