Article

An Experiment on Surface Fluctuation of Ga-In-Sn Alloy with a Permanent Magnet Flow Control Mold

1
Key Laboratory of Electromagnetic Processing of Materials (Ministry of Education), Northeastern University, Shenyang 110819, China
2
School of Metallurgy, Northeastern University, Shenyang 110819, China
*
Author to whom correspondence should be addressed.
Metals 2023, 13(10), 1662; https://doi.org/10.3390/met13101662
Submission received: 4 August 2023 / Revised: 21 September 2023 / Accepted: 26 September 2023 / Published: 28 September 2023
(This article belongs to the Topic Advanced Processes in Metallurgical Technologies)

Abstract

:
To control well the surface fluctuation of liquid metal in a slab mold, a new type of combined permanent magnets braking system, namely a permanent magnet flow control mold (PMFC-Mold) is proposed by our research group, of which its main feature is that the device can control the flow of molten steel in the mold without additional energy. To observe the fluctuation state of the alloy with the PMFC-Mold, instantaneous surface fluctuations were recorded by a laser level meter and camera. To study the effect of various casting speeds and permanent magnet placement on surface fluctuations, the three measurement points, which were 7, 18, and 36 mm away from the narrow surface of the mold, were selected to record the trend of level fluctuation. Three types of permanent magnet placement were designed by setting the differences between the height center of the permanent magnet and the free surface in the slab mold, which were H1 = 0 mm, H2 = −25 mm, and H3 = −75 mm. The experimental results indicated that with the acceleration of the casting speed, the average height and standard deviation of surface fluctuation at the measurement point increased, but the surface fluctuation pattern remained. When the permanent magnets were arranged at H1 = 0 mm and H2 = −25 mm, the position of the magnetic field was reasonable and the surface fluctuation could be effectively suppressed. In contrast, when the permanent magnets were arranged at H3 = −75 mm, the level fluctuation was intensified.

1. Introduction

Increasing casting speed is an effective way to improve production efficiency. However, as the casting speed increases, the upper recirculation flow rate of molten steel in the mold becomes faster, which exacerbates the level fluctuation and leads to the risk of slag inclusion [1,2,3]. Hence, to effectively control level fluctuations in the mold, an electromagnetic braking (EMBr) technique has been widely utilized during continuous casting [4]. The working principle of EMBr is that magnetic poles wound around with coils are arranged on both sides of the mold. When the excitation coil is energized, a stable magnetic field passes through the mold. Meanwhile, as the molten steel flows through the magnetic field, it generates a Lorentz force opposite to the flow direction. The flow velocity of molten steel will be slowed down by Lorentz force. Currently, there are several electromagnetic braking techniques, including Local EMBr [5,6], Ruler-EMBr [7], Double Ruler-EMBr [8], Vertical EMBr (V-EMBr) [9,10], and Vertical-combined EMBr (VC-EMBr) [11]. However, for the EMBr system, a large amount of power needs to be consumed. Hence, to reduce the consumption of power resources, a new technology for controlling the liquid metal flow in the mold, namely the permanent magnet flow control mold (PMFC-Mold), is proposed by applying permanent magnet materials to continuous casting production.
To study the inhibitory effect of the PMFC-Mold on the flow behavior of molten metal and free surface fluctuations in the mold, it is a reasonable choice to establish a narrow scale model by considering the experiment cost. Usually, water, mercury, and low melting point alloy are used to simulate liquid steel in a continuous casting mold. Among them, Ga-In-Sn alloy has the characteristics of being non-toxic, pollution-free, and having a low melting point, and good conductivity. Timmel et al. [12] study the flow structures and related transport processes in the mold affected by the constant magnetic field. Ga-In-Sn alloy is used in an experiment to obtain a reasonable spatial and temporal resolution. The results show that the effect of magnetic field affects the flow structure directly and complexly. The wall conductivity also has an important impact on the flow pattern. Schurmann et al. [13] investigated the effect of EMBr placement in the mold height direction by using low melting-point Ga-In-Sn alloy for flow modeling. The experimental results indicated that the optimal position of electromagnetic braking can effectively reduce the horizontal flow velocity of free surface, while inappropriate positions can even increase surface flow velocity. Lyu et al. [14] proposed a method for measuring the Lorentz force as initial stationary spherical particles rising in liquid metal affected by a stable magnetic field provided by a permanent magnet. Dubovikova et al. [15] proposed a method for measuring the velocity and flow rate of liquid metal by using two pairs of permanent magnets, which can estimate the volumetric flow rate without knowing the conductivity, magnetic field size, or characteristic size of the metal liquid.
In this article, a Ga-In-Sn alloy cyclic flow experimental platform is established to study the fluctuation of liquid level in a continuous casting mold. For recording the fluctuation shape of the free surface, one camera is set on the wide side of the mold and another one is set above the free surface of the mold. For collecting and processing the results of liquid level fluctuations, the laser liquid level meter is arranged above the liquid level of the mold. In previous experimental research, there have been few reports on using permanent magnets to control the flow of metal in the mold. Therefore, it is necessary and we discuss the use of permanent magnets to control the flow of molten metal and the effectiveness of liquid level fluctuations in the mold.

2. Establishment of Experiments

2.1. Establishment of Ga-In-Sn Alloy Circulation Experimental Platform

A 1/5 scale variable casting speed Ga-In-Sn alloy cycling experimental platform is shown in Figure 1. The experimental platform is based on the mold used in the actual production of the factory. Moreover, the permanent magnets are used to control the flow of Ga-In-Sn alloy in the mold. As shown in Figure 1, the experimental equipment is mainly composed of the following: pump, pump power controller, mold, fluid circulation pipeline, permanent magnet group, laser level meter (Keyence Corporation®, Laser Displacement Sensor LK501, Osaka, Japan), and cameras. Additionally, the permanent magnet (N52 grade Nd-Fe-B) is arranged according to the Halbach array method [16], as shown in Figure 2. The simplified mold for the experiment is made of glass to ensure that the surface fluctuations can be observed on side direction. The complete cycling process is that the Ga-In-Sn alloy flows out from the mold to the pump. Then the Ga-In-Sn alloy is pumped back to the mold though the inlet port. The casting speed is modified by the pump power controller. There are three points for collecting the level fluctuation data, as shown in Figure 2. Two cameras are used to record the fluctuation of liquid level: one is placed on the top of the mold and the other is placed on the wide surface of the mold. The experimental platform parameters and Ga-In-Sn Alloy parameters are presented in Table 1.

2.2. Experimental Platform Similarity Criteria

The flow behavior of Ga-In-Sn alloy is mainly affected by gravity and inertial forces. Therefore, the Froude number is taken as the similarity criterion, similarity ratio λ = 1/5, lm/lp = 1/5.
F r m = F r p
u m g m l m = u p g p l p
The similarity ratio between the model casting speed and the prototype casting speed is:
u m u p = l m l p = λ 0.5 = 1 5 0.5 = 0.4472
where subscripts m and p correspond to experiments and prototypes, respectively; u is casting speed, m/s; and l is characteristic length (width of mold), m.
Ha number indicates that electromagnetic forces predominate over the viscous forces. The magnetic interaction parameter N is the ratio of electromagnetic force to inertial force, which indicates the degree of action of the magnetic field on a conductive fluid.
H a = B L σ μ = 0.45 × 0.046 3.2 × 10 6 0.0024 = 755
N m = σ m B m 2 L m ρ m u m
N p = σ p B p 2 L p ρ p u p
B m B p = ρ m u m σ p L p ρ p u p σ m L m = λ 1 4 ρ m σ p ρ p σ m = λ 1 4 6440 × 7.14 × 10 5 7100 × 3.2 × 10 6
B m B p = 0.449 λ 1 4 = 0.672
where B is magnetic field induction intensity, T; L is characteristic length, m; σ is conductivity, S/m; μ is dynamic viscosity, Pa∙s; and ρ is fluid density, kg∙m−3.

2.3. Experimental Conditions

In this experiment, in order to investigate the effect of stable magnetic fields arranged at different positions on the flow behavior of liquid metal in the mold, three positions of the combined permanent magnet are given, as shown in Figure 3.

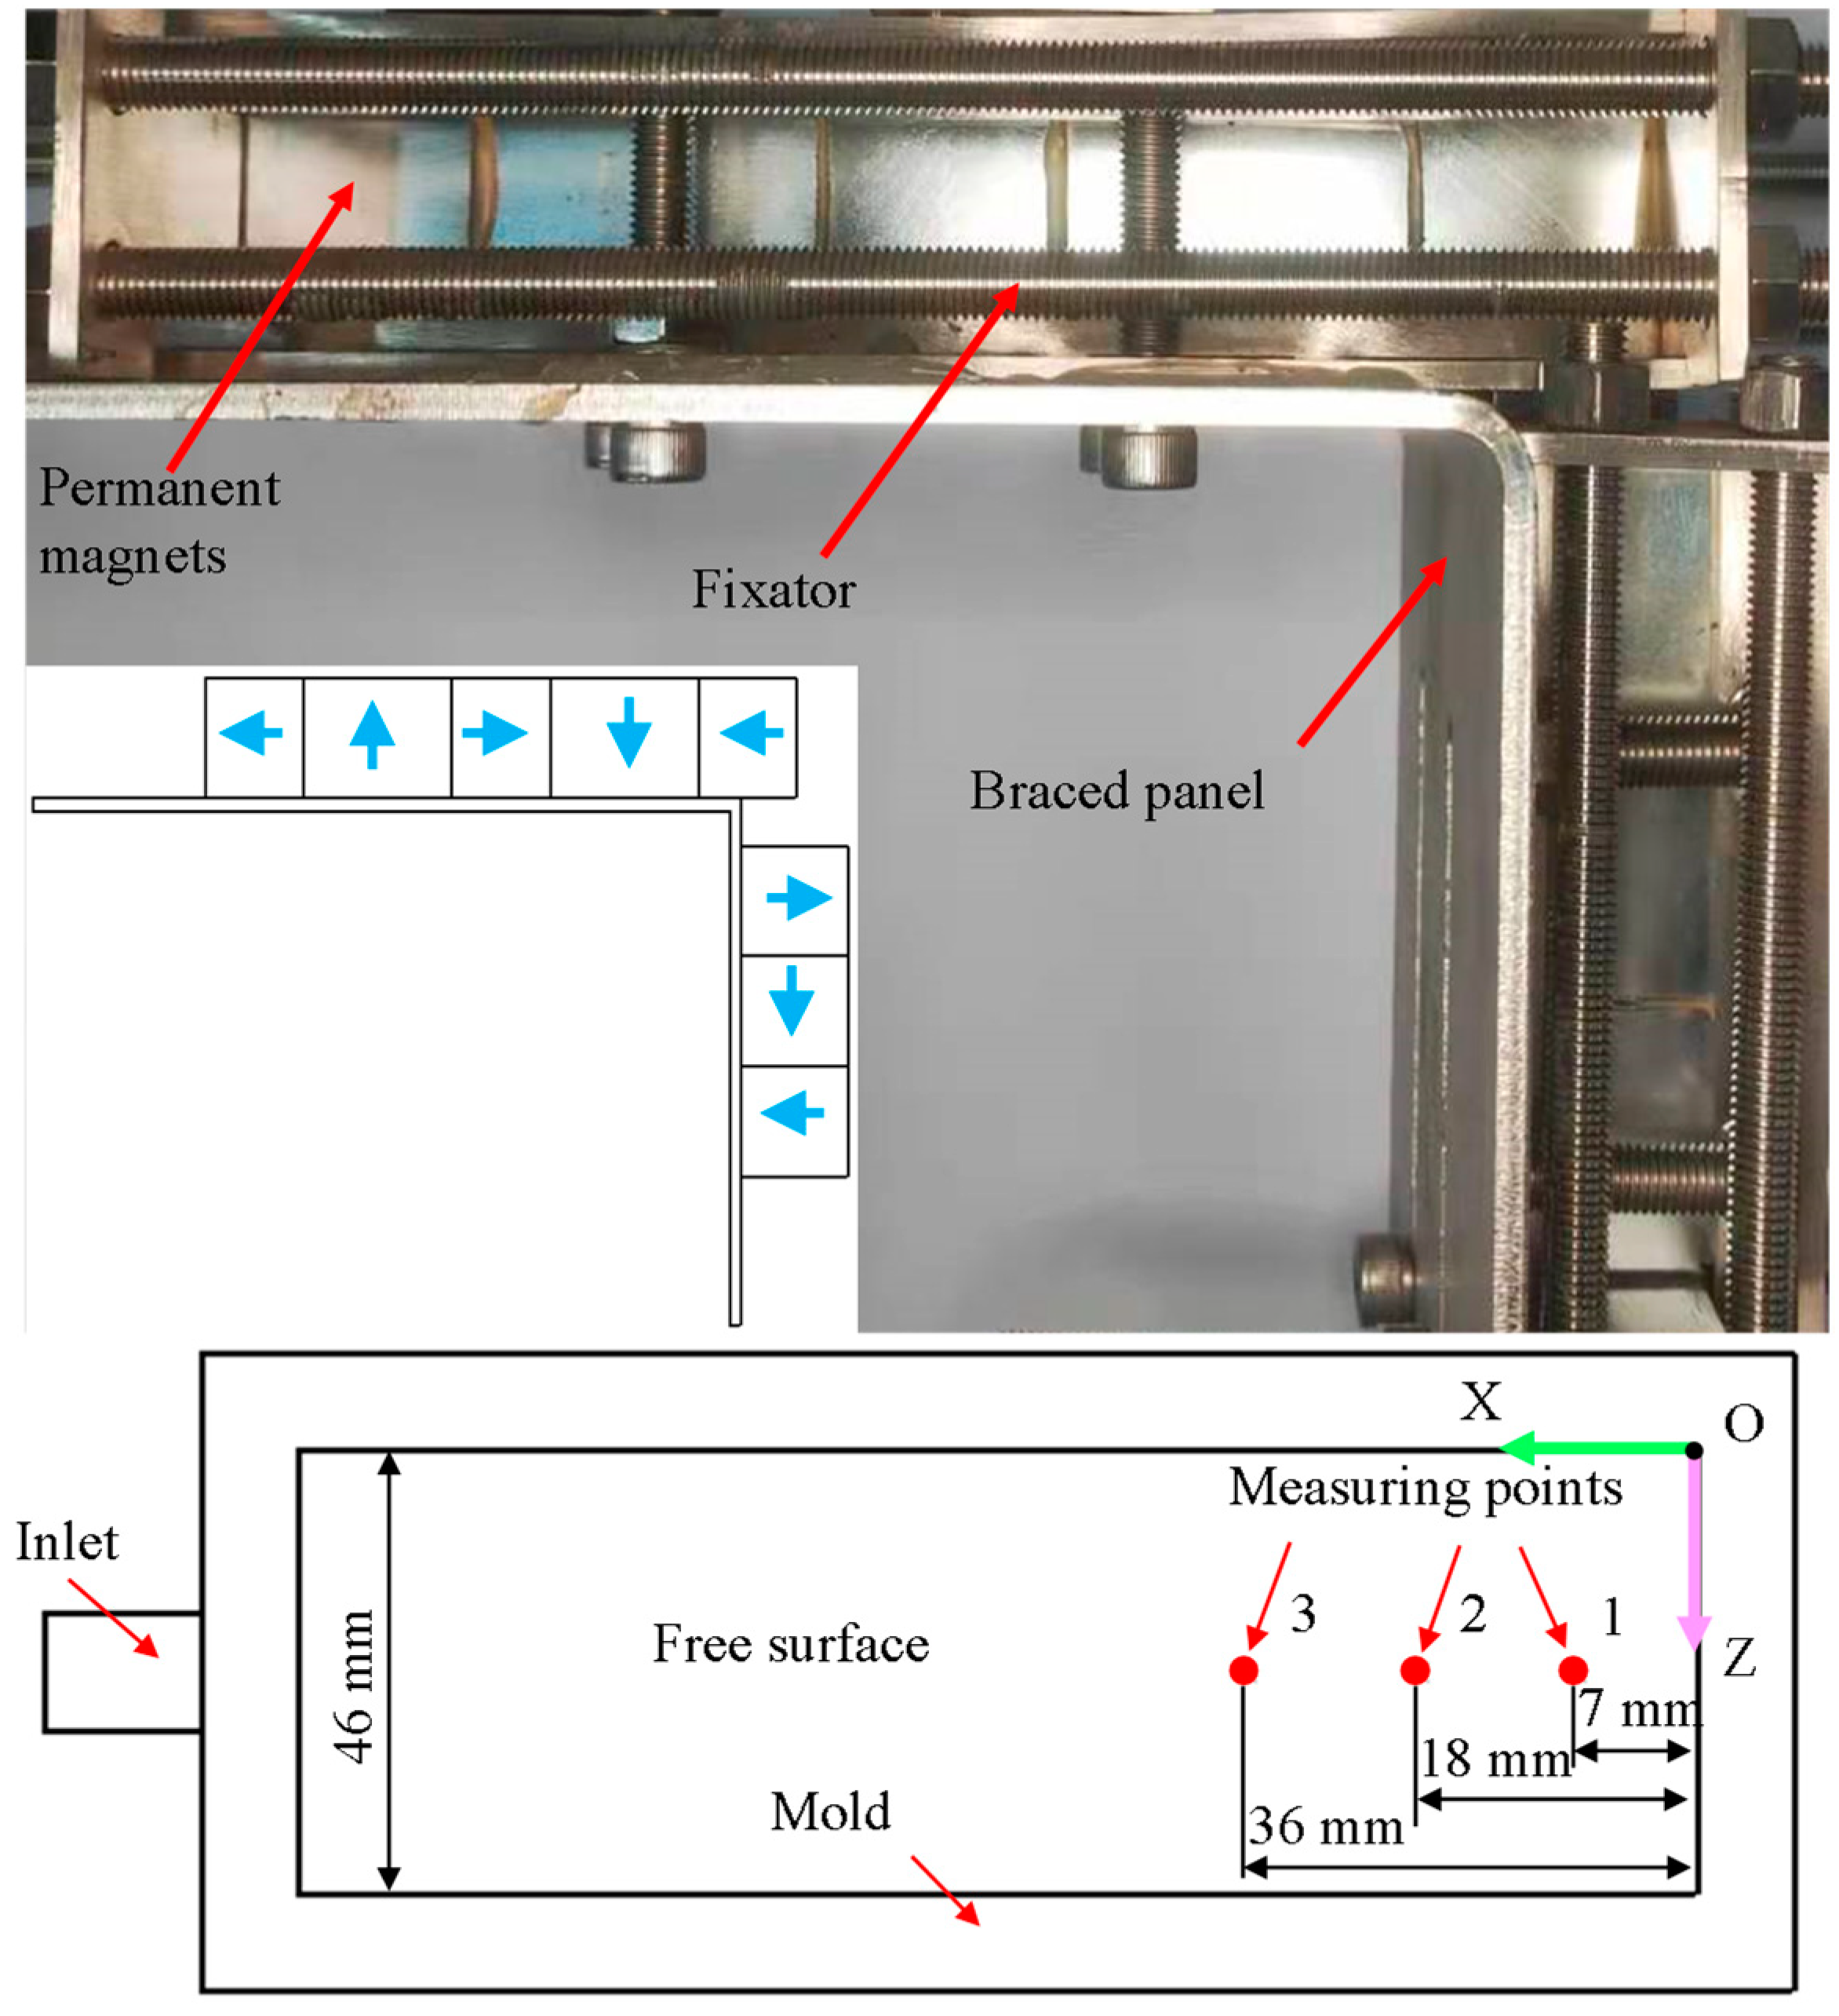
2.4. Experimental Measurement Methods

As the laser level gauge is zeroed, the pump starts to work. The Ga-In-Sn alloy liquid level in the mold gradually changes from a stationary state to a fluctuating state. When the level fluctuation continues for 60 s, the laser level meter begins to operate. The total time of data collection is 60 s, and the operating frequency of the laser level gauge is 100 Hz. The next measurement cycle does not begin until the free surface keeps its stability in the mold.

2.5. Evaluation Method for Experimental Results

In order to quantitatively evaluate the level fluctuation in the mold, the arithmetic mean value of wave height ā and the standard deviation of wave height α are used to represent the average level fluctuation.
a - = 1 n i = 1 n x i
α = i = 1 n x i a - 2 n - 1
where ā is the arithmetic average of liquid level fluctuation heights collected within 5 s, mm; α is the standard deviation of average wave height, mm; xi is the level fluctuation data at a certain time, mm; n is the amount of instantaneous wave height data collected in 5 s, dimensionless.

3. Experimental Results and Discussion

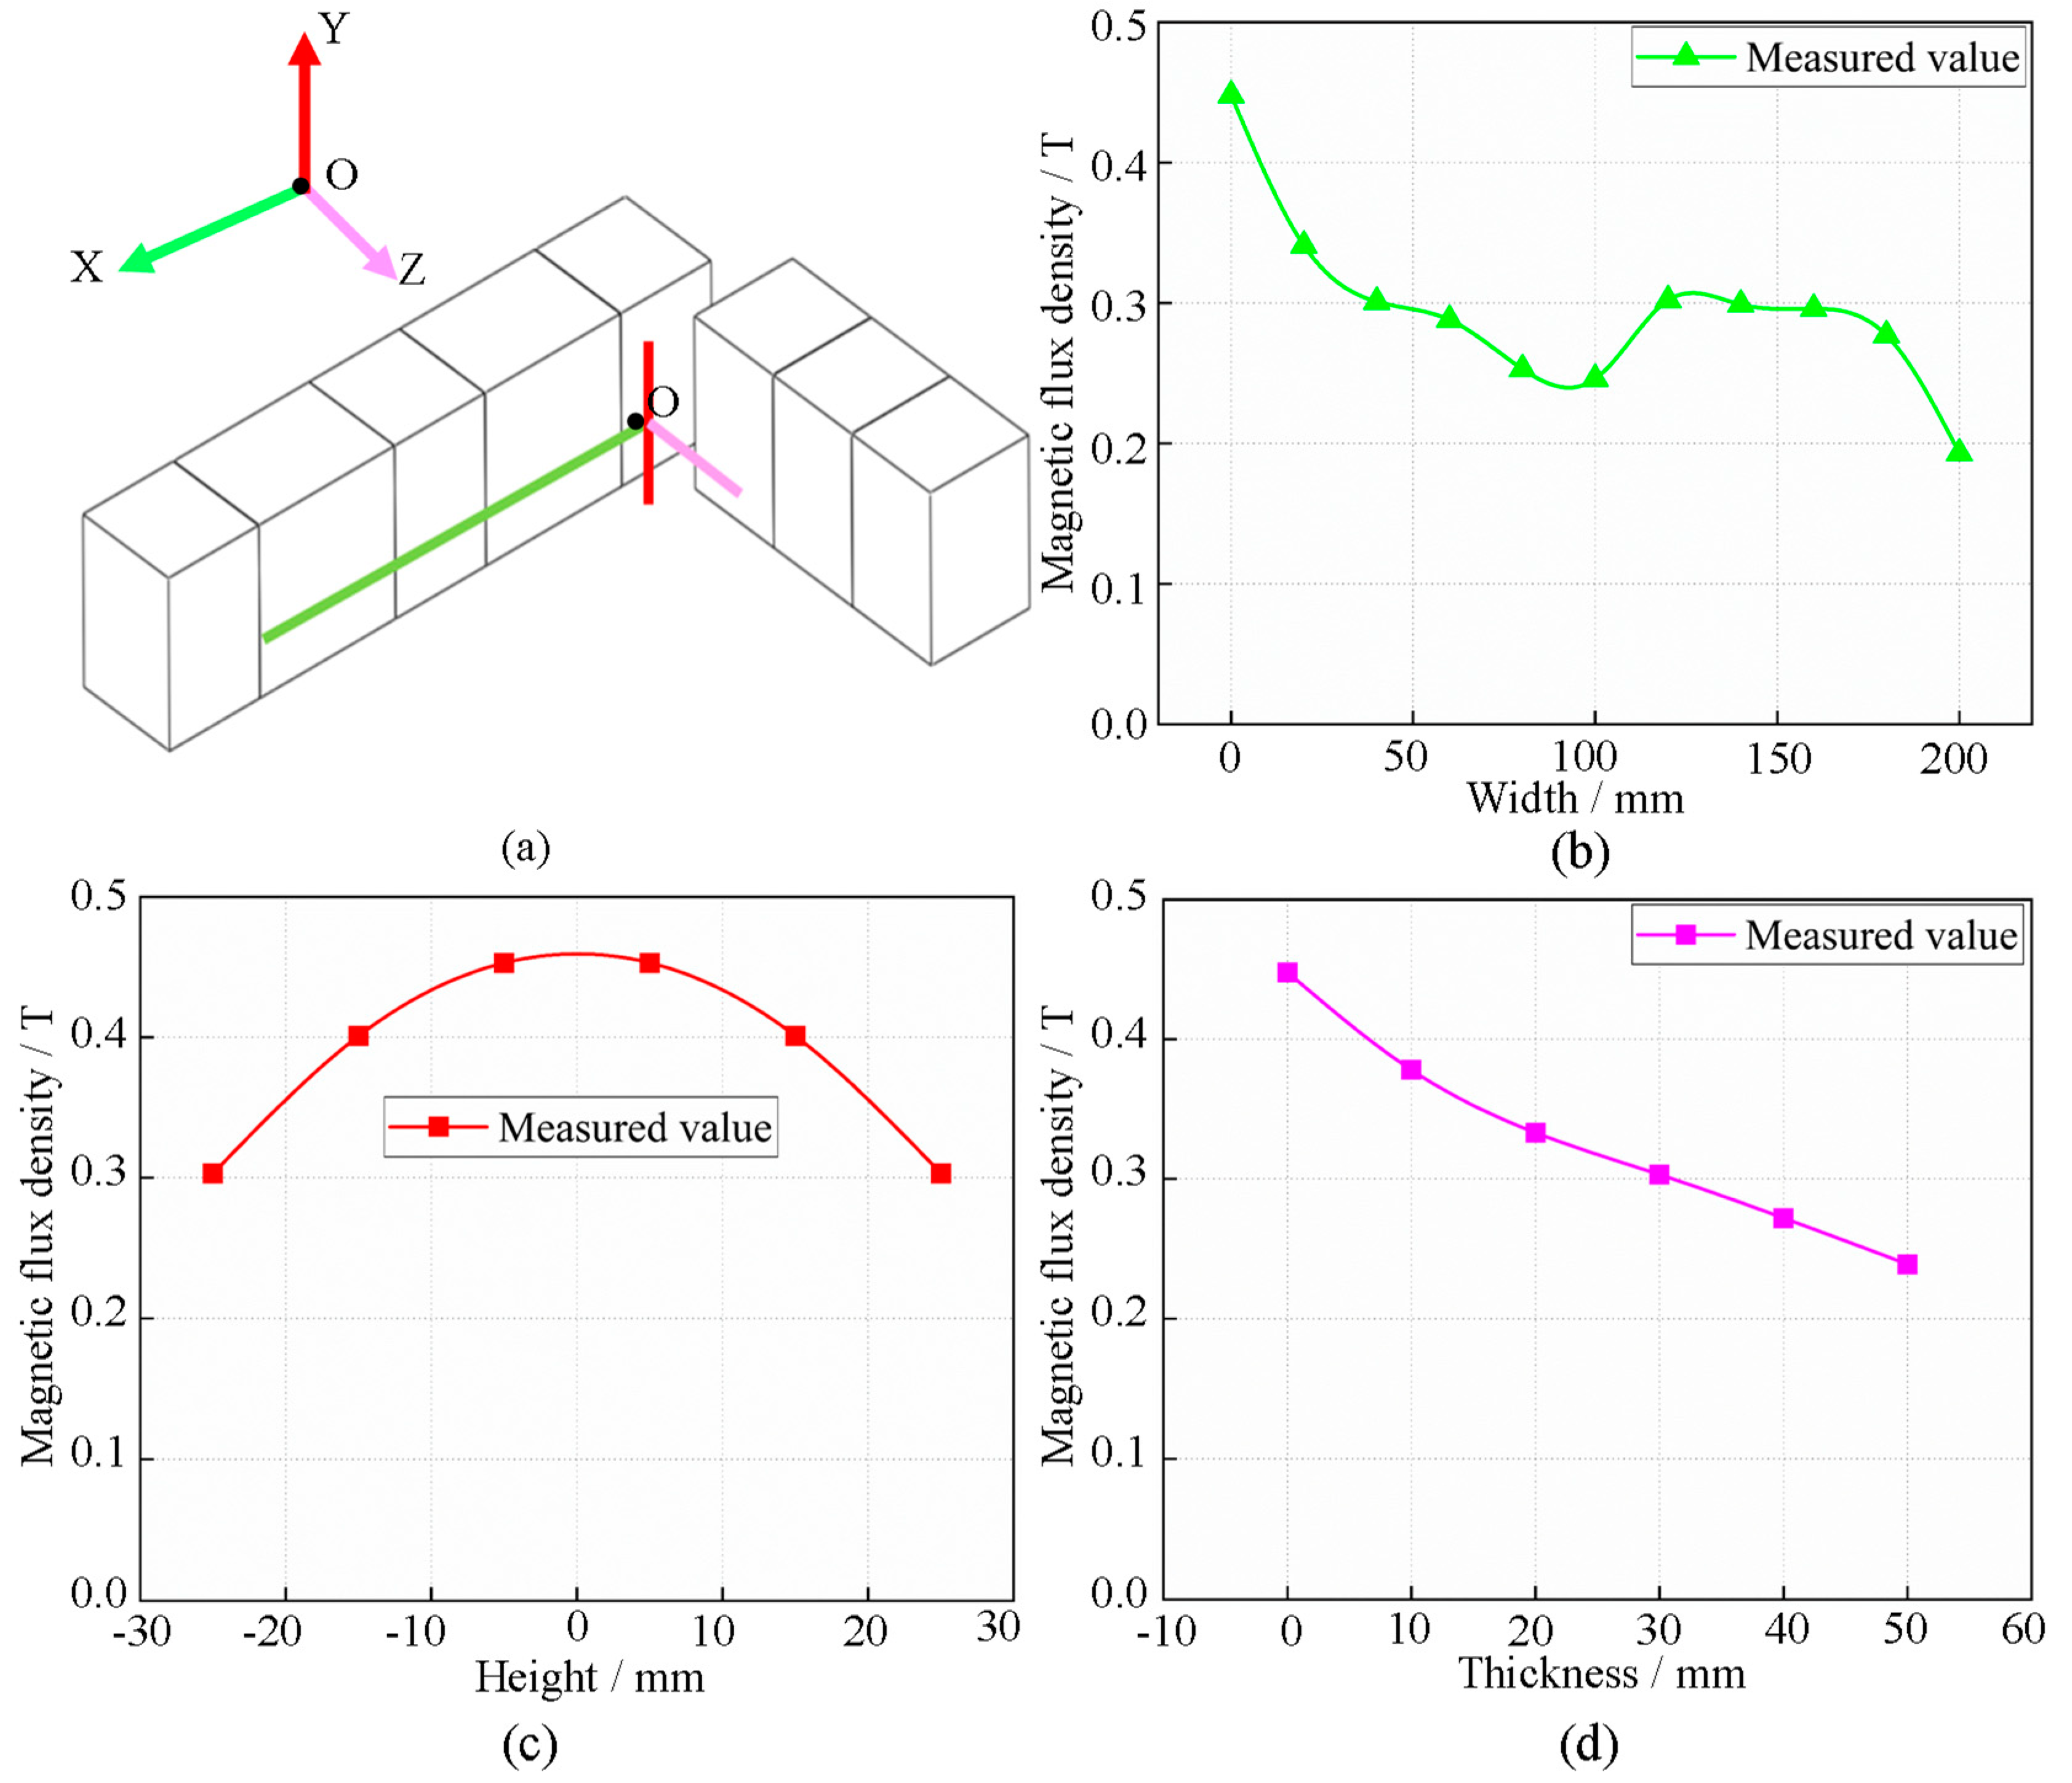
3.1. Characteristics of Magnetic Field Distribution with the PMFC-Mold

In order to study the magnetic field distribution characteristics of the PMFC-Mold, three characteristic lines are selected to measure the magnetic flux density. The characteristic lines measured along the X-axis and Y-axis directions are located at the center of the permanent magnet height and 20 mm away from the permanent magnets. The characteristic lines measured along the Z-axis direction are located at the intersection of the X-axis and Y-axis, extending up and down along the height direction of the permanent magnet. A schematic diagram of the position of characteristic lines is shown in Figure 4a. Figure 4b shows the actual measured magnetic flux density along the X-axis direction. It can be seen that the highest magnetic flux density appears at the corner of the mold, because the permanent magnet forms the shortest magnetic field line circuit in this region. Although the magnetic flux density decrease at the pole of permanent magnet is parallel to the X-axis between 60 mm and 120 mm, it still remains above 0.2 T. The main reason for the decrease in magnetic flux density in this region is that the magnetic induction line of vice permanent magnet mainly flows out through the main magnetic pole. The vice permanent magnet mainly plays a role in enhancing the adjacent main magnetic pole. Between 120 mm and 180 mm, the magnetic flux density remains at 0.3 T. The magnetic flux density in this region has significantly increased compared to the previous region, which corresponds to the region of the main permanent magnet. The magnetic flux density gradually decreases to around 0.2 T in the area of 180 mm to 200 mm. The magnetic flux density in this region has significantly decreased compared to the previous region, which corresponds to the region of the vice permanent magnet. Figure 4c shows the actual measured magnetic flux density along the Y-axis direction, which indicates that the magnetic flux density gradually decreases along the Z-axis direction. Figure 4d shows the actual measured magnetic flux density along the Z-axis direction. It can be seen that the magnetic flux density is the highest at the center of the permanent magnet, and the magnetic flux density at the upper and lower ends of the permanent magnet has decreased, which is caused by the end effect of the permanent magnet.

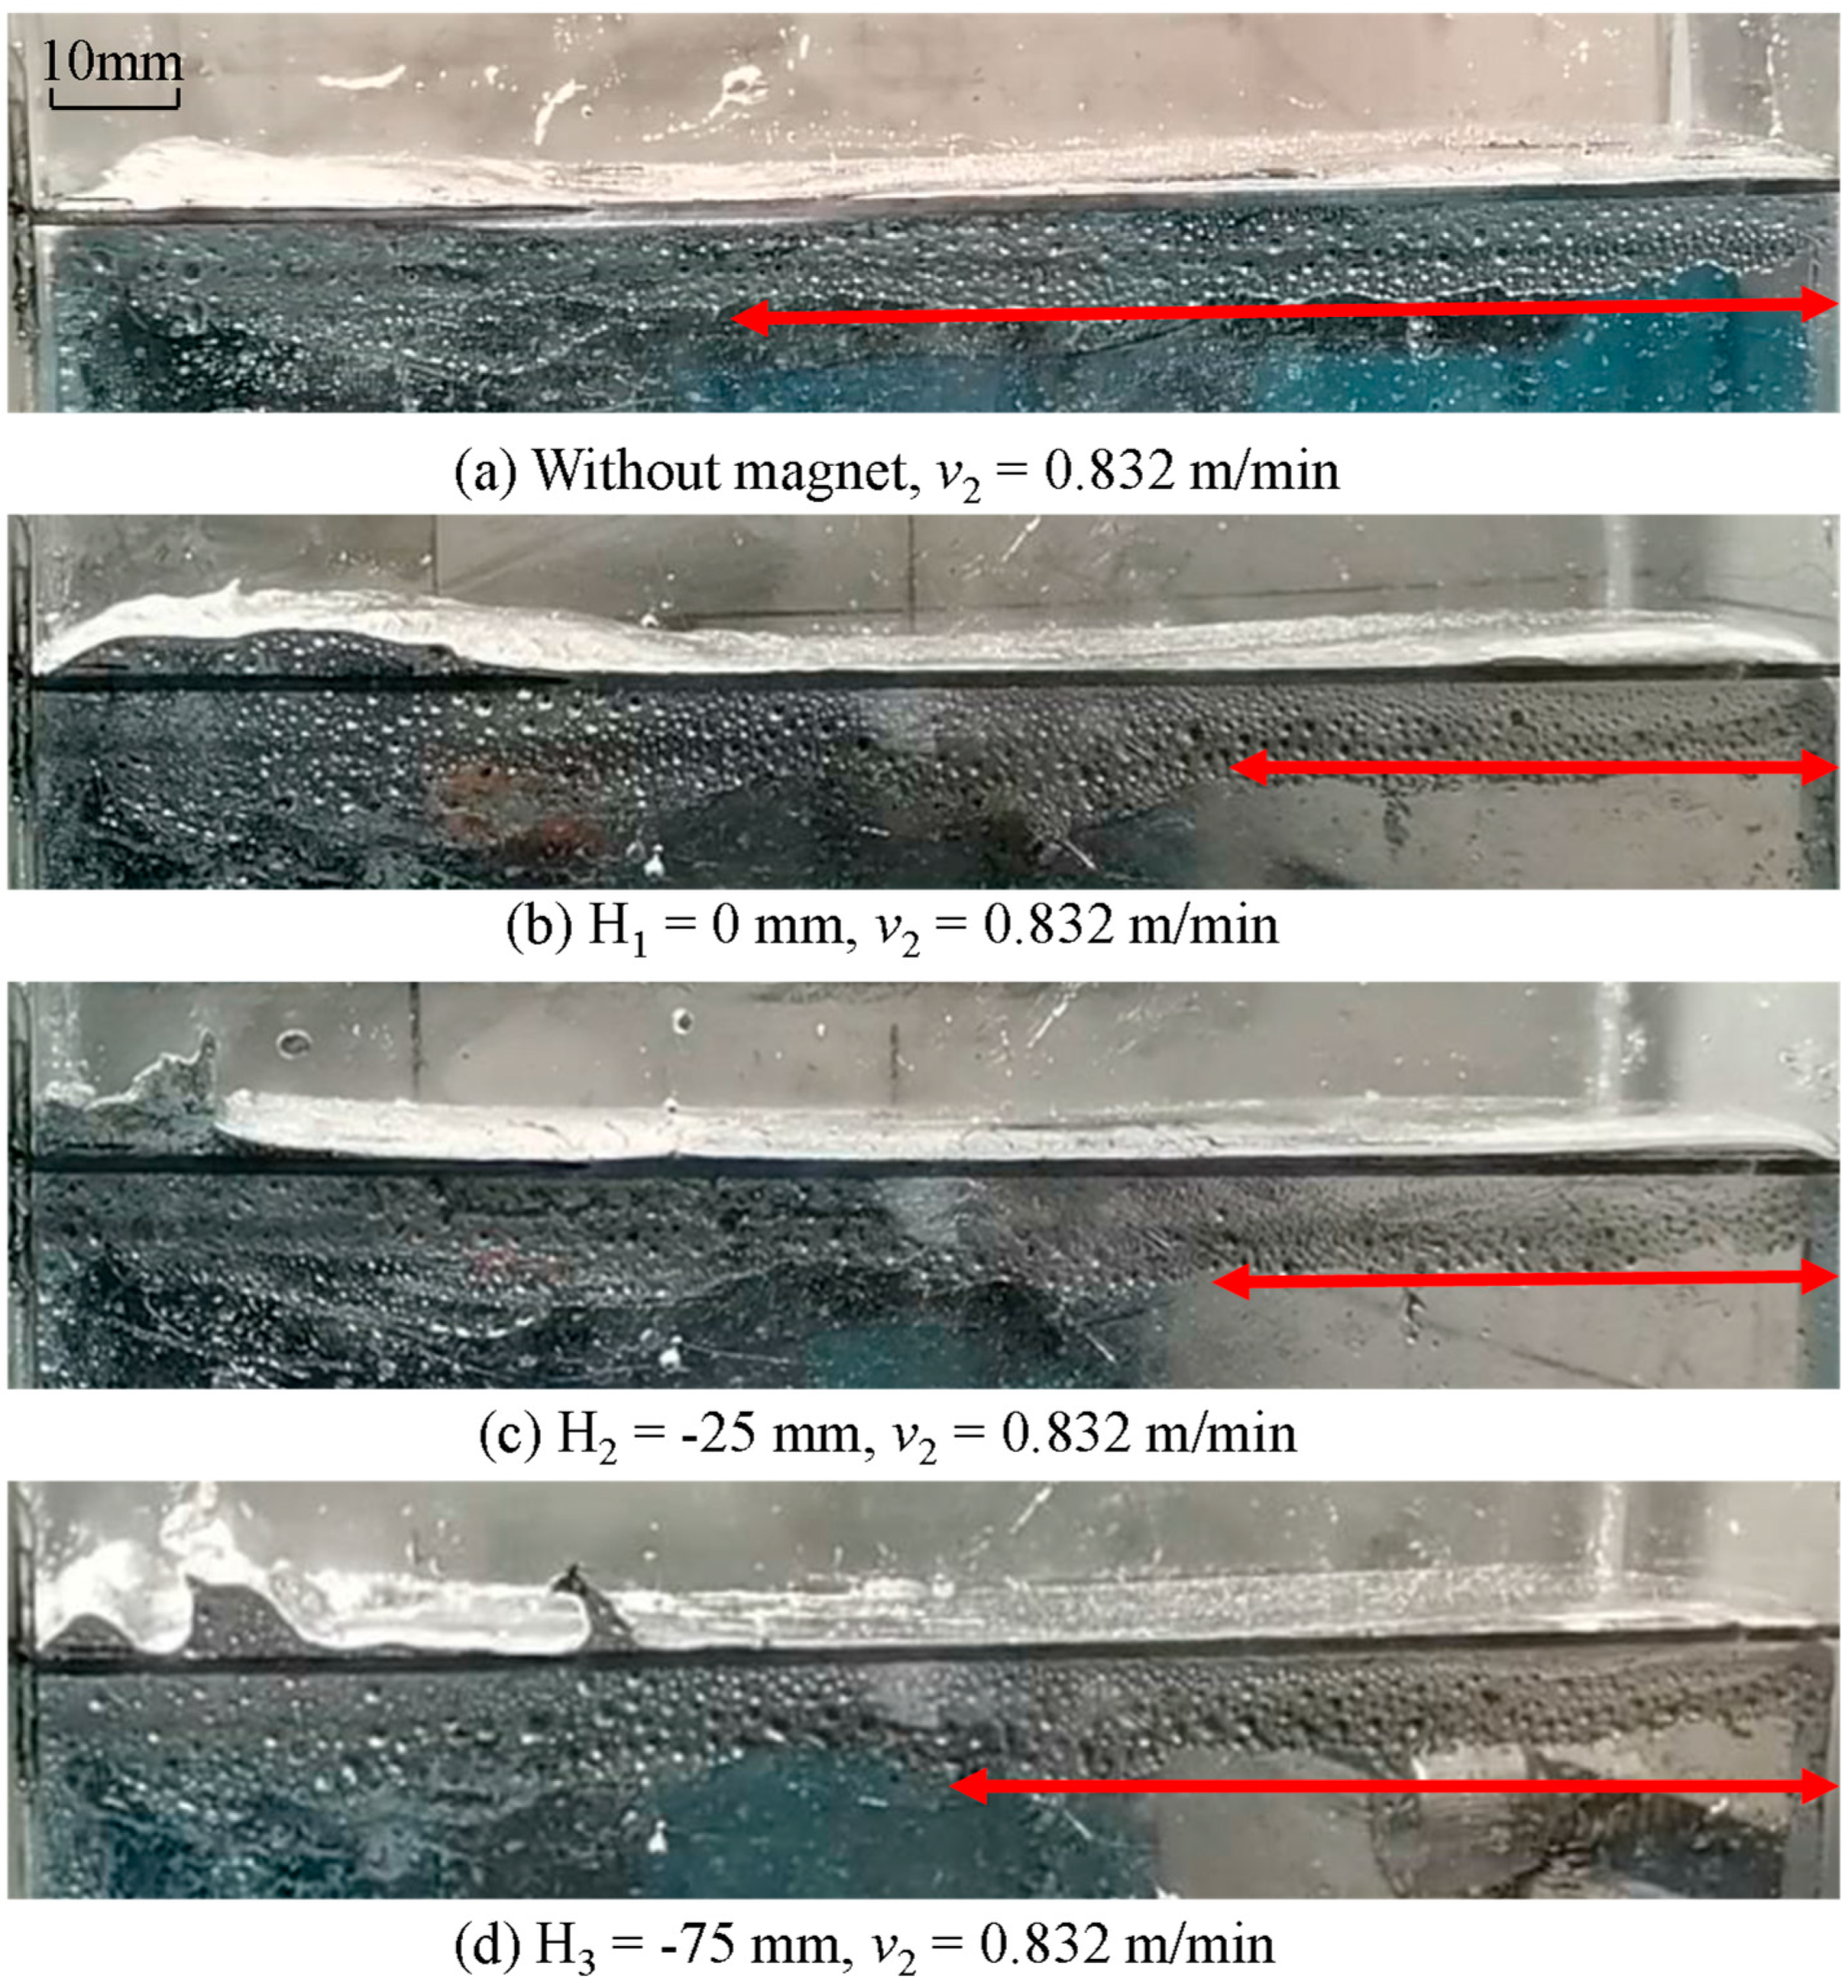
3.2. Effect of Different Casting Speeds on Level Fluctuation in the Mold

To analyze the level fluctuations under two casting speeds, the five-second data are selected randomly from experimental measurement records as samples. Figure 5 shows experimental data of instantaneous level fluctuation under different casting speeds: (a) Measuring point 1 (distance from narrow surface L = 7 mm); (b) Measuring point 2 (distance from narrow surface L = 18 mm); and (c) Measuring point 3 (distance from narrow surface L = 36 mm). Figure 6 shows the arithmetic mean ā (left) and the standard deviation α (right) of level fluctuation at the different measurement points, respectively. It can be intuitively seen that the behavior of free liquid surface fluctuation in the mold is similar to that of bow wave fluctuation. As the casting speed increases, the fluctuation of the free liquid surface becomes more severe, and the maximum height of the fluctuation is also greater. However, the level fluctuation mode of the free surface does not change as the casting speed increases, and the kinetic energy brought by the upward flow is transmitted further, which leads to an increase in eddy current velocity near the SEN, further exacerbating the risk of slag entrapment.

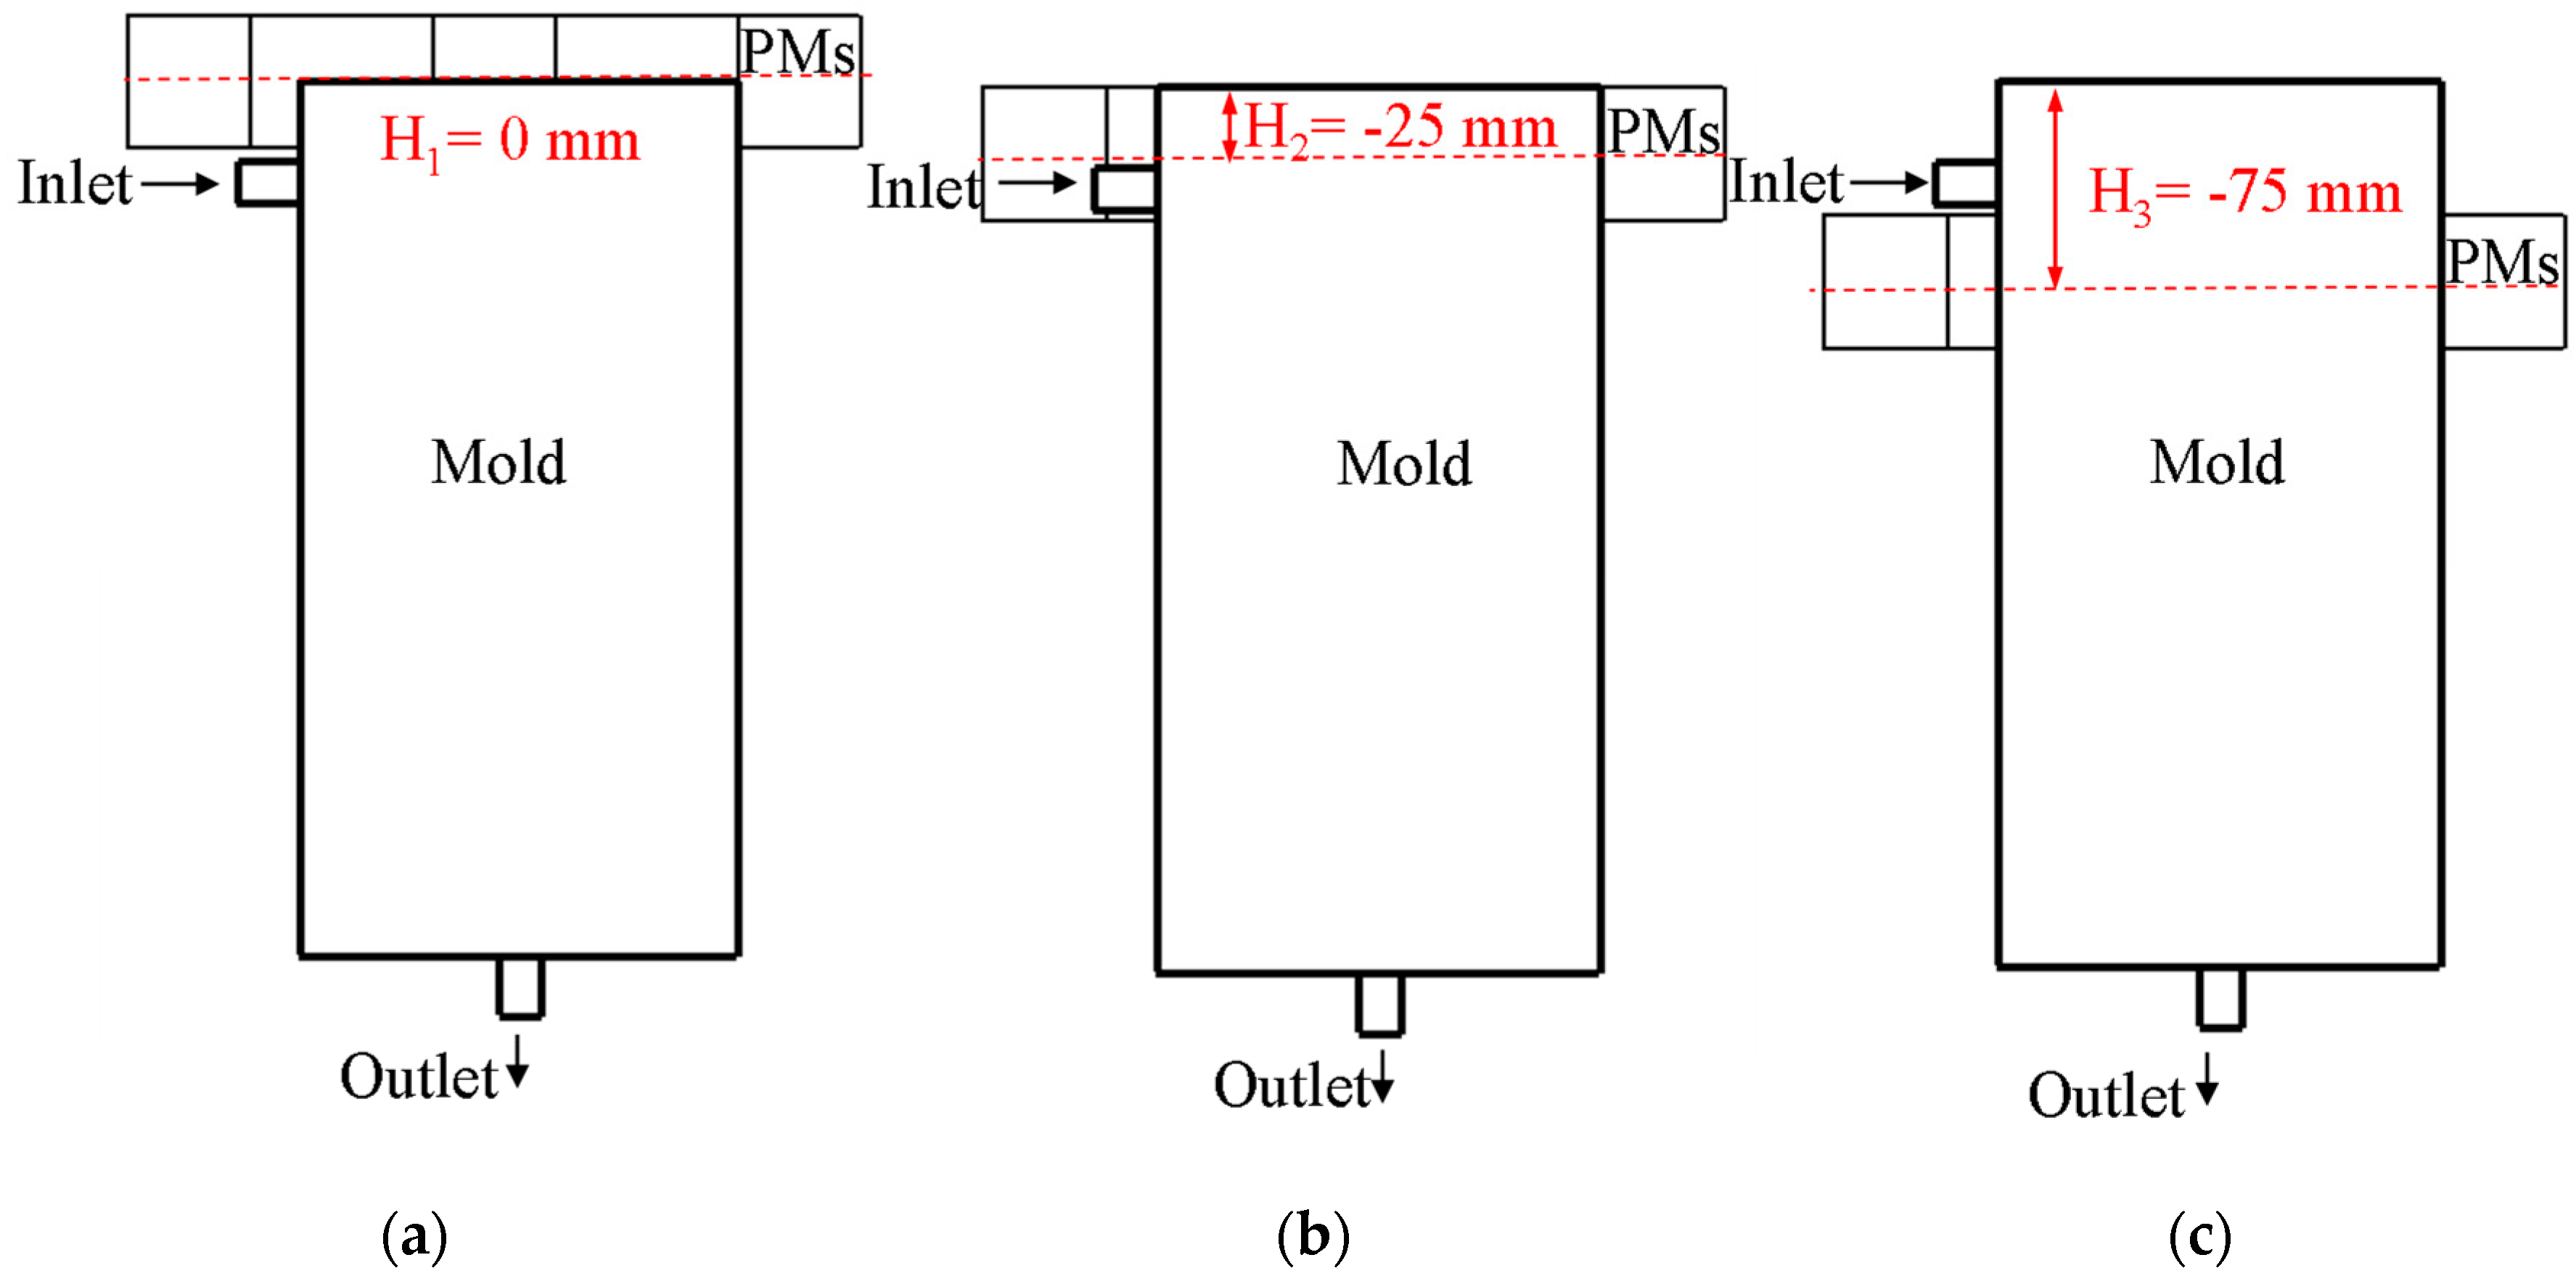
3.3. Effect of the PMFC-Mold Permanent Magnet Arranged Position on the Level Fluctuation in the Mold

Figure 7 shows the experimental records of instantaneous level fluctuations at Measurement point 1 under casting speed of 0.832 m/min as the PMFC-Mold permanent magnets are placed at different positions (Table 2 and Table 3). Figure 8 shows the arithmetic mean ā (left) and standard deviation α (right) of level fluctuation for the PMFC-Mold permanent magnets arranged at different positions. It can be seen that, from Figure 7 and Figure 8, the height of level fluctuation decreases as the PMFC-Mold permanent magnets are arranged at positions H = 0 mm and H = −25 mm. However, the level fluctuation cannot be effectively controlled when the PMFC-Mold permanent magnets are arranged at position H = −75 mm. When the PMFC-Mold permanent magnets are arranged at position H = −25 mm, the height of level fluctuation in the mold decreases and the control effect is the best. The main reason for this phenomenon is that when the PMFC-Mold permanent magnets are arranged at position H = 0 mm, the stable magnetic field mainly has an affect near the free surface. When the PMFC-Mold permanent magnets are placed at position H = −25 mm, the magnetic field can not only control the free surface of the liquid metal in the mold, but it can also control the entire up-flow region. Meanwhile, the upstream reflux flow rate decreases, and the height of liquid level fluctuation decreases accordingly. However, when the PMFC-Mold permanent magnet is arranged at position H = −75 mm, the magnetic field mainly controls the lower reflux area. The lower reflux is hindered by the magnetic field, but the level fluctuation becomes more adjective as the upper reflux is accelerated.
Figure 9 shows the Ga-In-Sn alloy morphology of surface fluctuation taken from the wide surface direction of the mold as the PMFC-Mold permanent magnets are arranged in different positions. The highest area of level fluctuation appears near the narrow face of the mold. The distance of level fluctuation in the mold exceeds two-thirds of the width of the mold, and the height of level fluctuation decreases slowly without a magnetic field applied. However, the height of level fluctuation rapidly decreases with a magnetic field applied. When the PMFC-Mold permanent magnet is placed at positions H1 = 0 mm and H2 = −25 mm, the distance of level fluctuation in the mold only exceeds a quarter of the width of the mold. When the PMFC-Mold permanent magnet is placed at the H3 = −75 mm position, the distance of level fluctuation in the mold exceeds one third of the width of the mold. The height of level fluctuation and the range of activity both decrease in the mold as the PMFC-Mold is applied.
Figure 10 shows the Ga-In-Sn alloy morphology of surface fluctuations in the mold as the PMFC-Mold permanent magnets located at different places. The level fluctuates violently in the mold, and the free surface cannot maintain a mirror-like state. The free surface becomes wavy, as shown in Figure 10a. When a magnetic field is applied and the permanent magnets are at positions H1 = 0 mm and H2 = −25 mm, the level in the mold fluctuates slowly, and the free surface remains almost in a complete mirror state, as shown in Figure 10b,c. However, when the permanent magnets are at position H3 = −75 mm, the level fluctuation in the mold becomes active again, and the free surface becomes distorted again, as shown in Figure 10d.
From Figure 9 and Figure 10, the stable magnetic field can effectively control the level fluctuation in the mold and shorten the fluctuation distance, as the permanent magnet is at positions H1 = 0 mm and H2 = −25 mm.

4. Conclusions

A 1/5-scale Ga-In-Sn half side model and a combined permanent magnets instruments are established to set up the casting speed and magnetic field in a CC mold. The sur-face fluctuation affected by casting speed and magnet field position is discussed. The conclusions are as follows:
A new PMFC-Mold aimed at traditional electromagnetic braking devices is proposed, which controls the flow behavior of molten steel in the mold by the magnetic field generated by permanent magnets.
  • With various casting speed, the surface fluctuation profile does not change. However, the height of level fluctuation and the velocity of surface flow rate will increase, which exacerbate the risk of slag entrapment.
  • When the PMFC-Mold permanent magnets are located at H2 = −25 mm, the control effect on the flow behavior of metal liquid in the mold is the best, and the height of level fluctuation decreases the most. However, when the PMFC-Mold permanent magnet is located at H3 = −75 mm, the height of level fluctuation actually increases. The reasonable arrangement of magnetic field position is an important influencing factor in controlling the fluctuation behavior of free surface in the mold.
  • The behavior of level fluctuation becomes gentle in the mold, and the surface flow distance affected by the upward flow becomes short as the magnetic field is applied (when the permanent magnets are located at H = −25 mm). Corresponding to the actual production, the severe level fluctuation in the mold increases the risk of slag involvement. If the PMFC-mold is used, the problem of slag involvement can be alleviated effectively by the reduction in the height and severity of level fluctuations.

Author Contributions

Conceptualization, Z.H. and E.W.; validation, Z.Z. and Z.W.; formal analysis, Z.H.; investigation, Z.H., Z.Z. and Z.W.; writing—original draft preparation, Z.H.; writing—review and editing, Z.H. and E.W.; project administration, E.W.; funding acquisition, E.W. All authors have read and agreed to the published version of the manuscript.

Funding

This research was funded by the National Natural Science Foundation of China (Grant No. 51574083 and Grant No. U1760206) and the 111 Project (2.0) of China (No. BP0719037).

Data Availability Statement

Not applicable.

Acknowledgments

The authors thank the referees for their work, which greatly contributed to this article.

Conflicts of Interest

The authors declare no conflict of interest.

References

  1. Thomas, B.G. Modeling of the continuous casting of steel—Past, present, and future. Metall. Mater. Trans. B 2002, 33, 795–812. [Google Scholar] [CrossRef]
  2. Thomas, B.G. Review on Modeling and Simulation of Continuous Casting. Steel Res. Int. 2018, 89, 1700312. [Google Scholar] [CrossRef]
  3. Lei, S.; Zhang, J.; Zhao, X.; Dong, Q. Study of Molten Steel Flow and Inclusions Motion Behavior in the Solidification Processes for High Speed Continuous Casting Slab by Numerical Simulation. Trans. Indian Inst. Met. 2016, 69, 1193–1207. [Google Scholar] [CrossRef]
  4. Cho, S.; Thomas, B.G. Electromagnetic Forces in Continuous Casting of Steel Slabs. Metals 2019, 9, 471. [Google Scholar] [CrossRef]
  5. Cukierski, K.; Thomas, B.G. Flow control with local electromagnetic braking in continuous casting of steel slabs. Metall. Mater. Trans. B 2008, 39, 94–107. [Google Scholar] [CrossRef]
  6. Thapa, S.; Wang, M.; Silaen, A.K.; Ferreira, M.E.; Rollings, W.; Zhou, C.Q. Application of Electromagnetic Braking to Minimize a Surface Wave in a Continuous Caster. Materials 2023, 16, 1042. [Google Scholar] [CrossRef] [PubMed]
  7. Liu, Z.; Li, L.; Li, B. Large Eddy Simulation of Transient Flow and Inclusions Transport in Continuous Casting Mold under Different Electromagnetic Brakes. JOM 2016, 68, 2180–2190. [Google Scholar] [CrossRef]
  8. Zhang, Z.; Yu, J.; Ren, Z. Study on the liquid metal flow field in FC-mold of slab continuous casting. Adv. Manuf. 2015, 3, 212–220. [Google Scholar] [CrossRef]
  9. Xu, L.; Wang, E.; Karcher, C.; Deng, A.; Xu, X. Numerical simulation of the effects of horizontal and vertical EMBr on jet flow and mold level fluctuation in continuous casting. Metall. Mater. Trans. B 2018, 49, 2779–2793. [Google Scholar] [CrossRef]
  10. Li, Z.; Wang, E.; Zhang, L.; Xu, Y.; Deng, A. Influence of Vertical Electromagnetic Brake on the Steel/Slag Interface Behavior in a Slab Mold. Metall. Mater. Trans. B 2017, 48, 389–2402. [Google Scholar] [CrossRef]
  11. Xu, L.; Wang, E.; Karcher, C. Numerical Simulation of Melt Flow, Heat Transfer and Solidification in CSP Continuous Casting Mold with Vertical-Combined Electromagnetic Braking. Metall. Mater. Trans. B 2023, 54, 1646–1664. [Google Scholar] [CrossRef]
  12. Timmel, K.; Eckert, S.; Gerbeth, G. Experimental Investigation of the Flow in a Continuous-Casting Mold under the Influence of a Transverse, Direct Current Magnetic Field. Metall. Mater. Trans. B 2011, 42, 68–80. [Google Scholar] [CrossRef]
  13. Schurmann, D.; Glavinić, I.; Willers, B. Impact of the Electromagnetic Brake Position on the Flow Structure in a Slab Continuous Casting Mold: An Experimental Parameter Study. Metall. Mater. Trans. B 2020, 51, 61–78. [Google Scholar] [CrossRef]
  14. Lyu, Z.; Tran, N.; Boeck, T.; Karcher, C. Electromagnetic Interaction between a Rising Spherical Particle in a Conducting Liquid and a Localized Magnetic Field. IOP Conf. Ser. Mater. Sci. Eng. 2017, 228, 12025. [Google Scholar] [CrossRef]
  15. Dubovikova, N.; Karcher, C.; Kolesnikov, Y. Velocity and Flow Rate Measurement of Liquid Metal by Contactless Electromagnetic Lorentz Force Technique. IOP Conf. Ser. Mater. Sci. Eng. 2016, 143, 12022. [Google Scholar] [CrossRef]
  16. Halbach, K. Permanent magnets for production and use of high energy particle beams. In Proceedings of the 8th International Workshop on Rare-Earth Magnets and Their Applications, Dayton, OH, USA, 6–8 May 1985. [Google Scholar]
Figure 1. Schematic diagram of Ga-In-Sn alloy magnetic fluid experimental platform and platform structure.
Metals 13 01662 g001
Figure 2. Schematic diagram of permanent magnets combination device, permanent magnets arrangement (arrow pointing to N pole) and measurement points location.
Metals 13 01662 g002
Figure 3. The relative position between the height center of PMFC-Mold permanent magnet and the free liquid surface, (a) H1 = 0 mm, (b) H2 = −25 mm, (c) H3 = −75 mm.
Metals 13 01662 g003
Figure 4. The characteristic lines and the magnetic field induction intensity distribution on the corresponding characteristic lines: (a) measurement position of characteristic lines; (b) magnetic flux density along the X direction; (c) magnetic flux density along the Y direction; (d) magnetic flux density along the Z direction.
Metals 13 01662 g004
Figure 5. Experimental data of instantaneous level fluctuation under different casting speeds at 3 measuring points: (a) Measuring point 1 (distance from narrow surface L = 7 mm); (b) Measuring point 2 (distance from narrow surface L = 18 mm); and (c) Measuring point 3 (distance from narrow surface L = 36 mm).
Metals 13 01662 g005
Figure 6. Arithmetic mean ā (a) and standard deviation α (b) of level fluctuation at different measurement points.
Metals 13 01662 g006
Figure 7. Real time data collection of level fluctuations for PMFC-Mold as permanent magnets arranged in different positions.
Metals 13 01662 g007
Figure 8. Arithmetic mean ā (a) and standard deviation α (b) of level fluctuation for PMFC-Mold permanent magnets arranged at different positions.
Metals 13 01662 g008
Figure 9. Diagram of level fluctuation in the wide surface direction of the mold.
Metals 13 01662 g009
Figure 10. Diagram of level fluctuation of free surface in the mold.
Metals 13 01662 g010
Table 1. Experimental platform parameters and Ga-In-Sn Alloy parameters.
ParametersValues
Immersion depth of SEN, mm38
Width × Thickness × Height (mold), mm145 × 46 × 350
Max. magnetic flux density, T0.45
Port angle of SEN, (°)0
Dimensions of magnets, mm369 × 50 × 50, 46 × 50 × 50
Casting speed, m/min0.333, 0.832
Electrical conductivity, S∙m−13.2 × 10⁶
Dynamic viscosity, Pa∙s0.0024
Fluid density, kg∙m−36440
Table 2. Arithmetic mean ā of level fluctuations at different measurement points.
Positionv1 (mm)v2 (mm)
Point 1 0.97371.3823
Point 2 0.25210.6274
Point 3 0.50620.9045
Table 3. Standard deviation α of level fluctuation at different measurement points.
Positionv1 (mm)v2 (mm)
Point 1 0.33780.4309
Point 2 0.25580.3166
Point 3 0.22660.3688
Disclaimer/Publisher’s Note: The statements, opinions and data contained in all publications are solely those of the individual author(s) and contributor(s) and not of MDPI and/or the editor(s). MDPI and/or the editor(s) disclaim responsibility for any injury to people or property resulting from any ideas, methods, instructions or products referred to in the content.

