1. Introduction
Damage of working surfaces of hydraulic turbine blades, propellers, impellers, and stator parts of pump equipment is mainly caused by cavitation impact of medium on the functional surfaces of the equipment during the course of complex physical phenomena and processes.
The study of physical causes of occurrence and development of cavitation [
1,
2,
3,
4,
5], identification of wear patterns [
6,
7,
8,
9,
10,
11,
12,
13] on the basis of experimental research, and creation of theoretical models for further evaluation of effectiveness of developed and applied protection techniques continue to be urgent tasks.
To date, a large amount of scientific work is related to the study of the emergence and behavior of cavitation bubbles [
14,
15,
16,
17], as well as the study of the dynamics of destruction of various materials [
18,
19,
20,
21,
22,
23,
24] and methods of their hardening, as well as various kinds of condensation and diffusion coatings [
25,
26,
27,
28,
29,
30]. Cobalt, nickel, aluminum and titanium alloys, composites, non-ferrous metals, alloyed and unalloyed steels receive special attention. On the other hand, casting steels such as 20 GL and 30 L, which are widely used in the production of hydraulic components, have been little studied.
The development and further effective use of a structural material or passive method of its protection under cavitation attack is based on the determination of wear patterns using computer models and conducting comprehensive experimental studies [
31,
32,
33,
34,
35]. The discovery of the patterns of cavitation wear and the determination of wear resistance criteria of materials are engaged by many scientists, using for this purpose various tools of analysis, laboratory, and field experiments [
36,
37,
38,
39].
The cavitation test rigs and facilities used in laboratory experiments can be divided into three groups: facilities simulating the occurrence of cavitation in conditions close to natural, high-frequency test rigs, and jet test rigs. This study considers the results obtained using the jet cavitation test rig created by authors. Analogues of such test rig are widely used in the world practice [
32,
35,
40,
41,
42].
Interpretation and reporting of cavitation erosion test data are made difficult by two factors. The first is that the rate of erosion (material loss) is not constant with time. This makes it impossible to represent the test result fully by a single number, or to predict long-term behavior from a short-term test. The second is that there is no independent or absolute definition of wear resistance, nor can units of measurement be ascribed to it.
Criteria of wear resistance of materials can be essentially varied depending on deformation rate, scale effects, stressed state of surface, influence of medium, etc. All this inevitably makes it difficult to compare the wear resistance according to different criteria with the properties of materials in a sufficiently wide range of changes in their structures and external loading conditions. That is why it is customary to obtain a cavitation wear curve and use it to determine the cavitation resistance of the examined material in the initial state or with a modified surface.
To determine the cavitation resistance, the authors propose a refinement to the method of estimating the volume removal of material, which is calculated using the typical dimensions (diameter and depth) of the cavitation wear spot on the surface, obtained using surface profilometry and microscopy techniques.
This study aims to determine the operating mode of the cavitation jet test rig leading to the maximum cavitation effect on the surface, determine in this mode the wear kinetics of cast steels 20 GL and 30 L with recording the change in depth and diameter of the cavitation wear spot, calculation of the volume removal and wear rate of the examined cast steels. To solve the task, a cavitation jet test rig based on ASTM G134-17 standard [
43] is used. According to [
43], cavitating liquid jet immersed in water volume, released from nozzle under high pressure, impacts the sample surface in such a way that cavities (cavitation bubbles) inside liquid collapse, causing wear of surface.
2. Materials and Methods
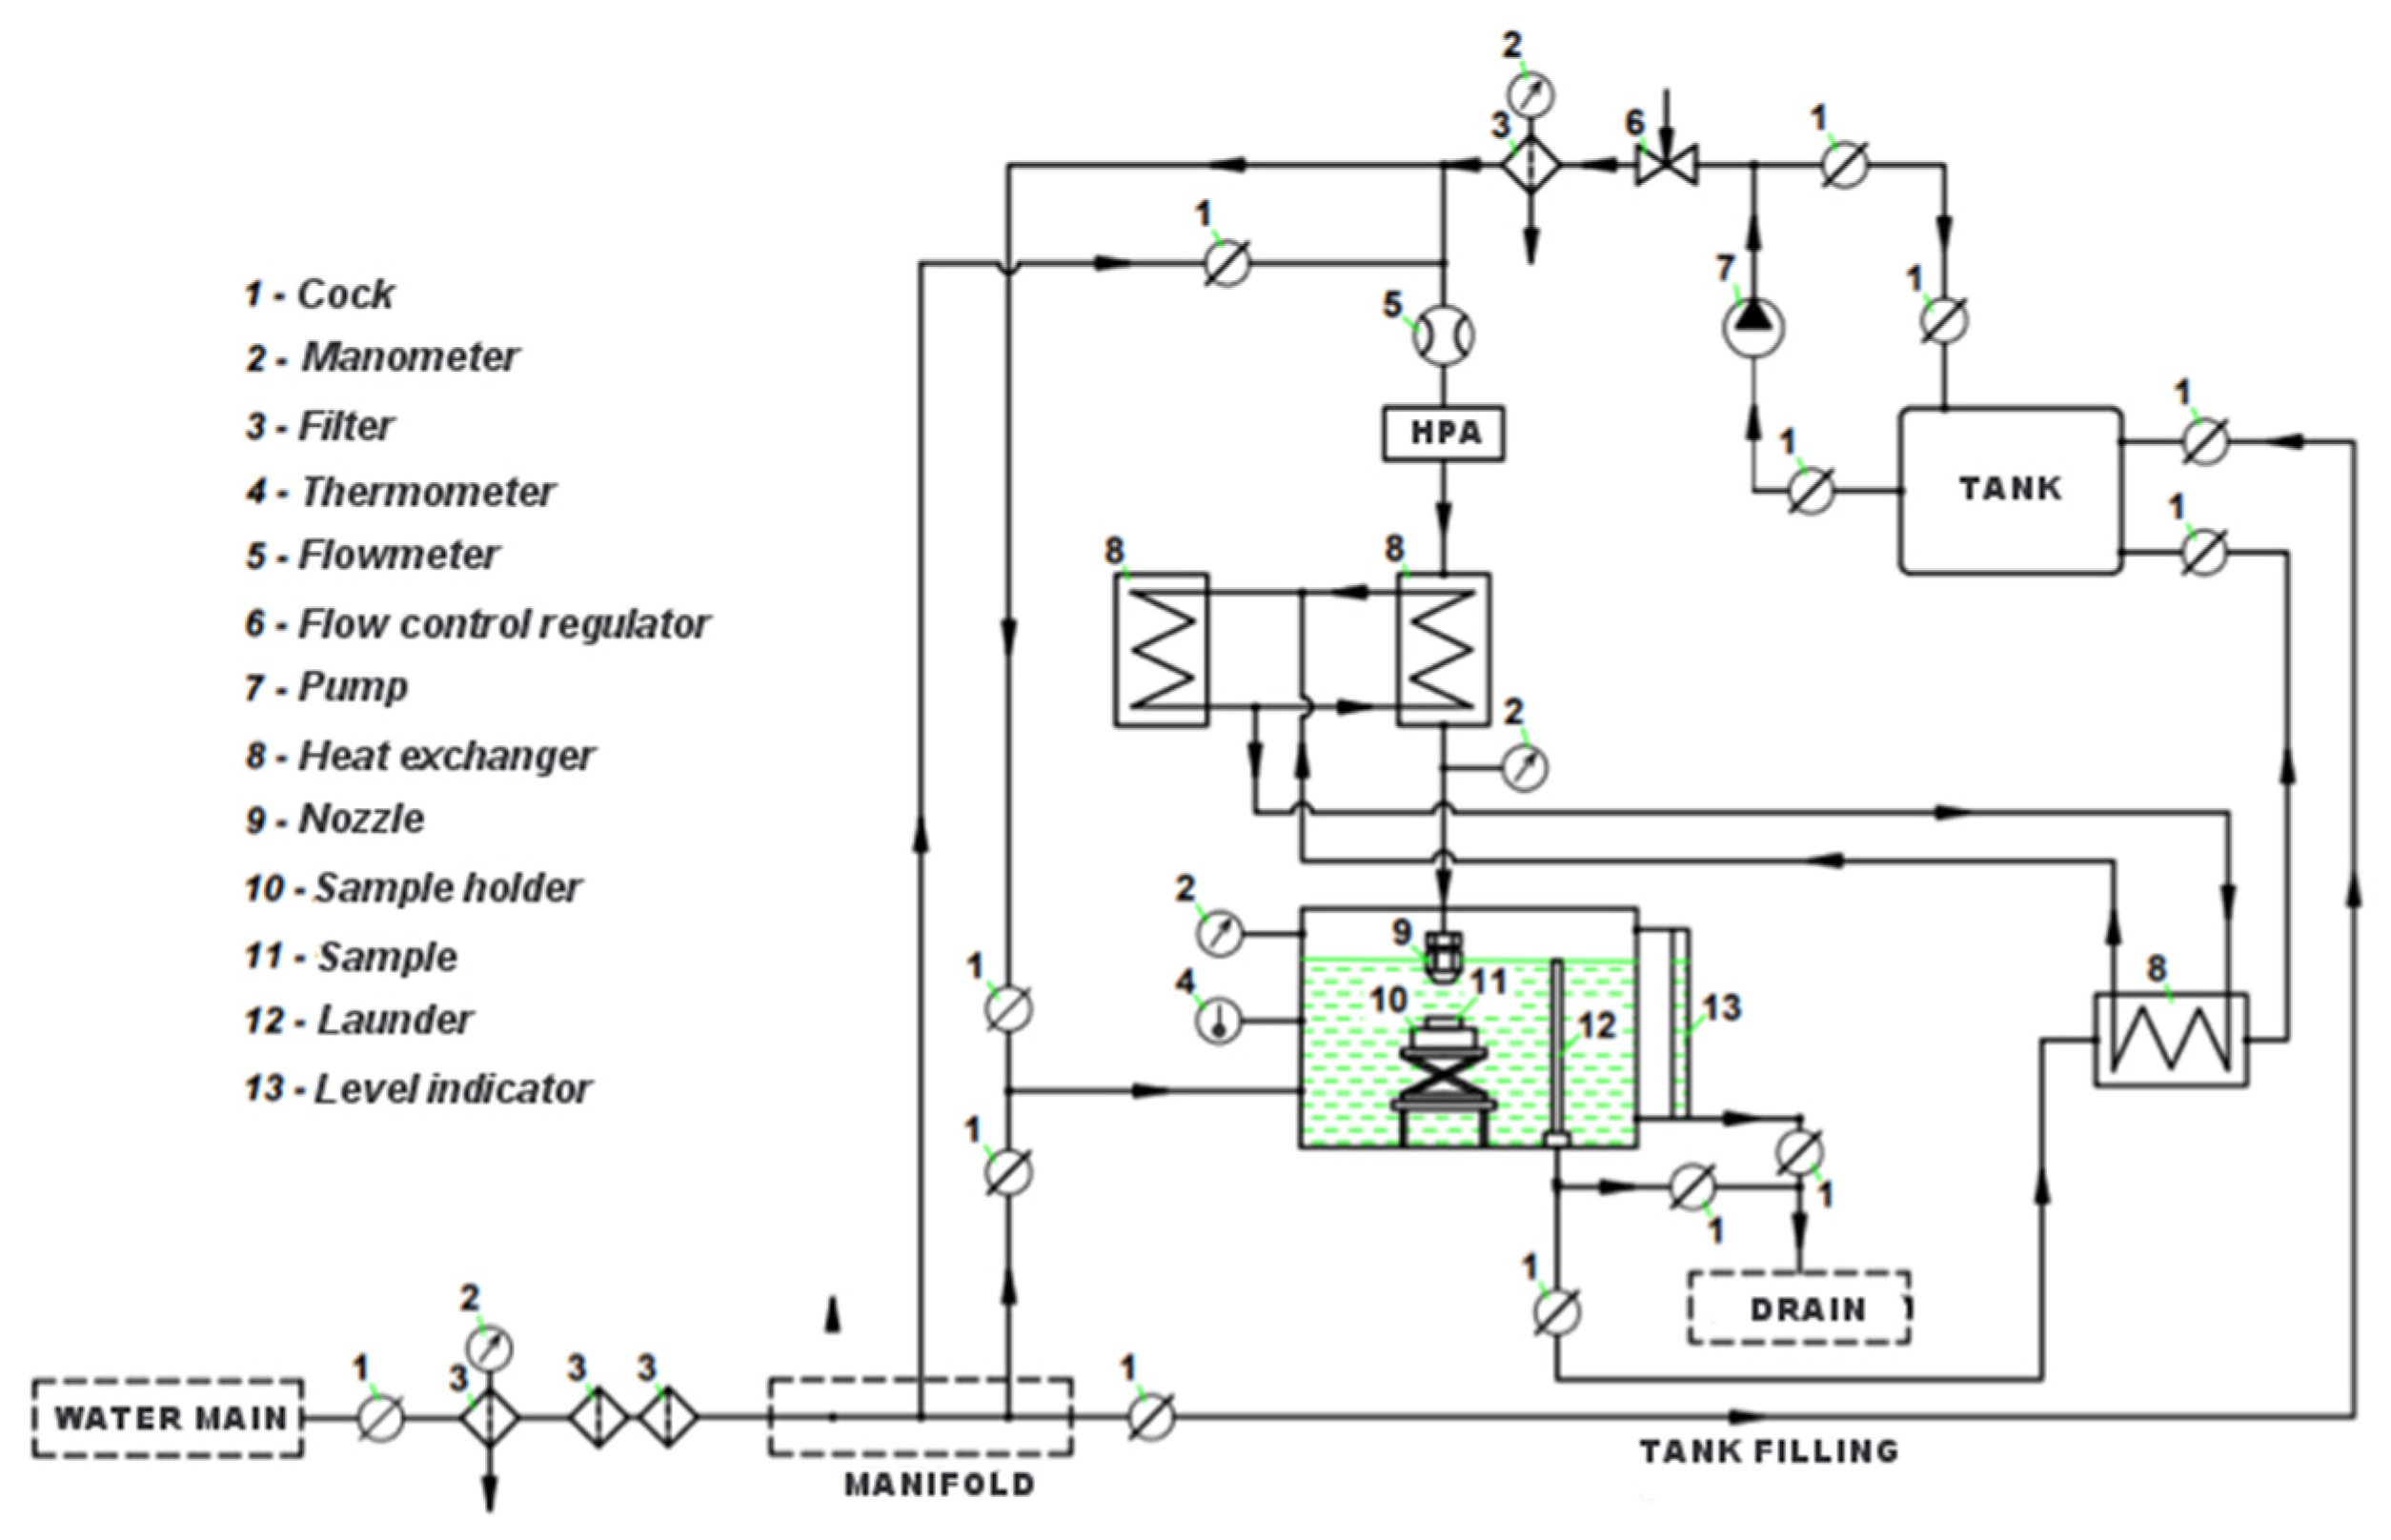
The cavitation jet test rig has the characteristics presented in
Table 1, has a closed-loop system of process liquid supply and cooling, is equipped with a sample positioning system, and allows photo- and video-filming of the cavitation cloud in the process of jet impact.
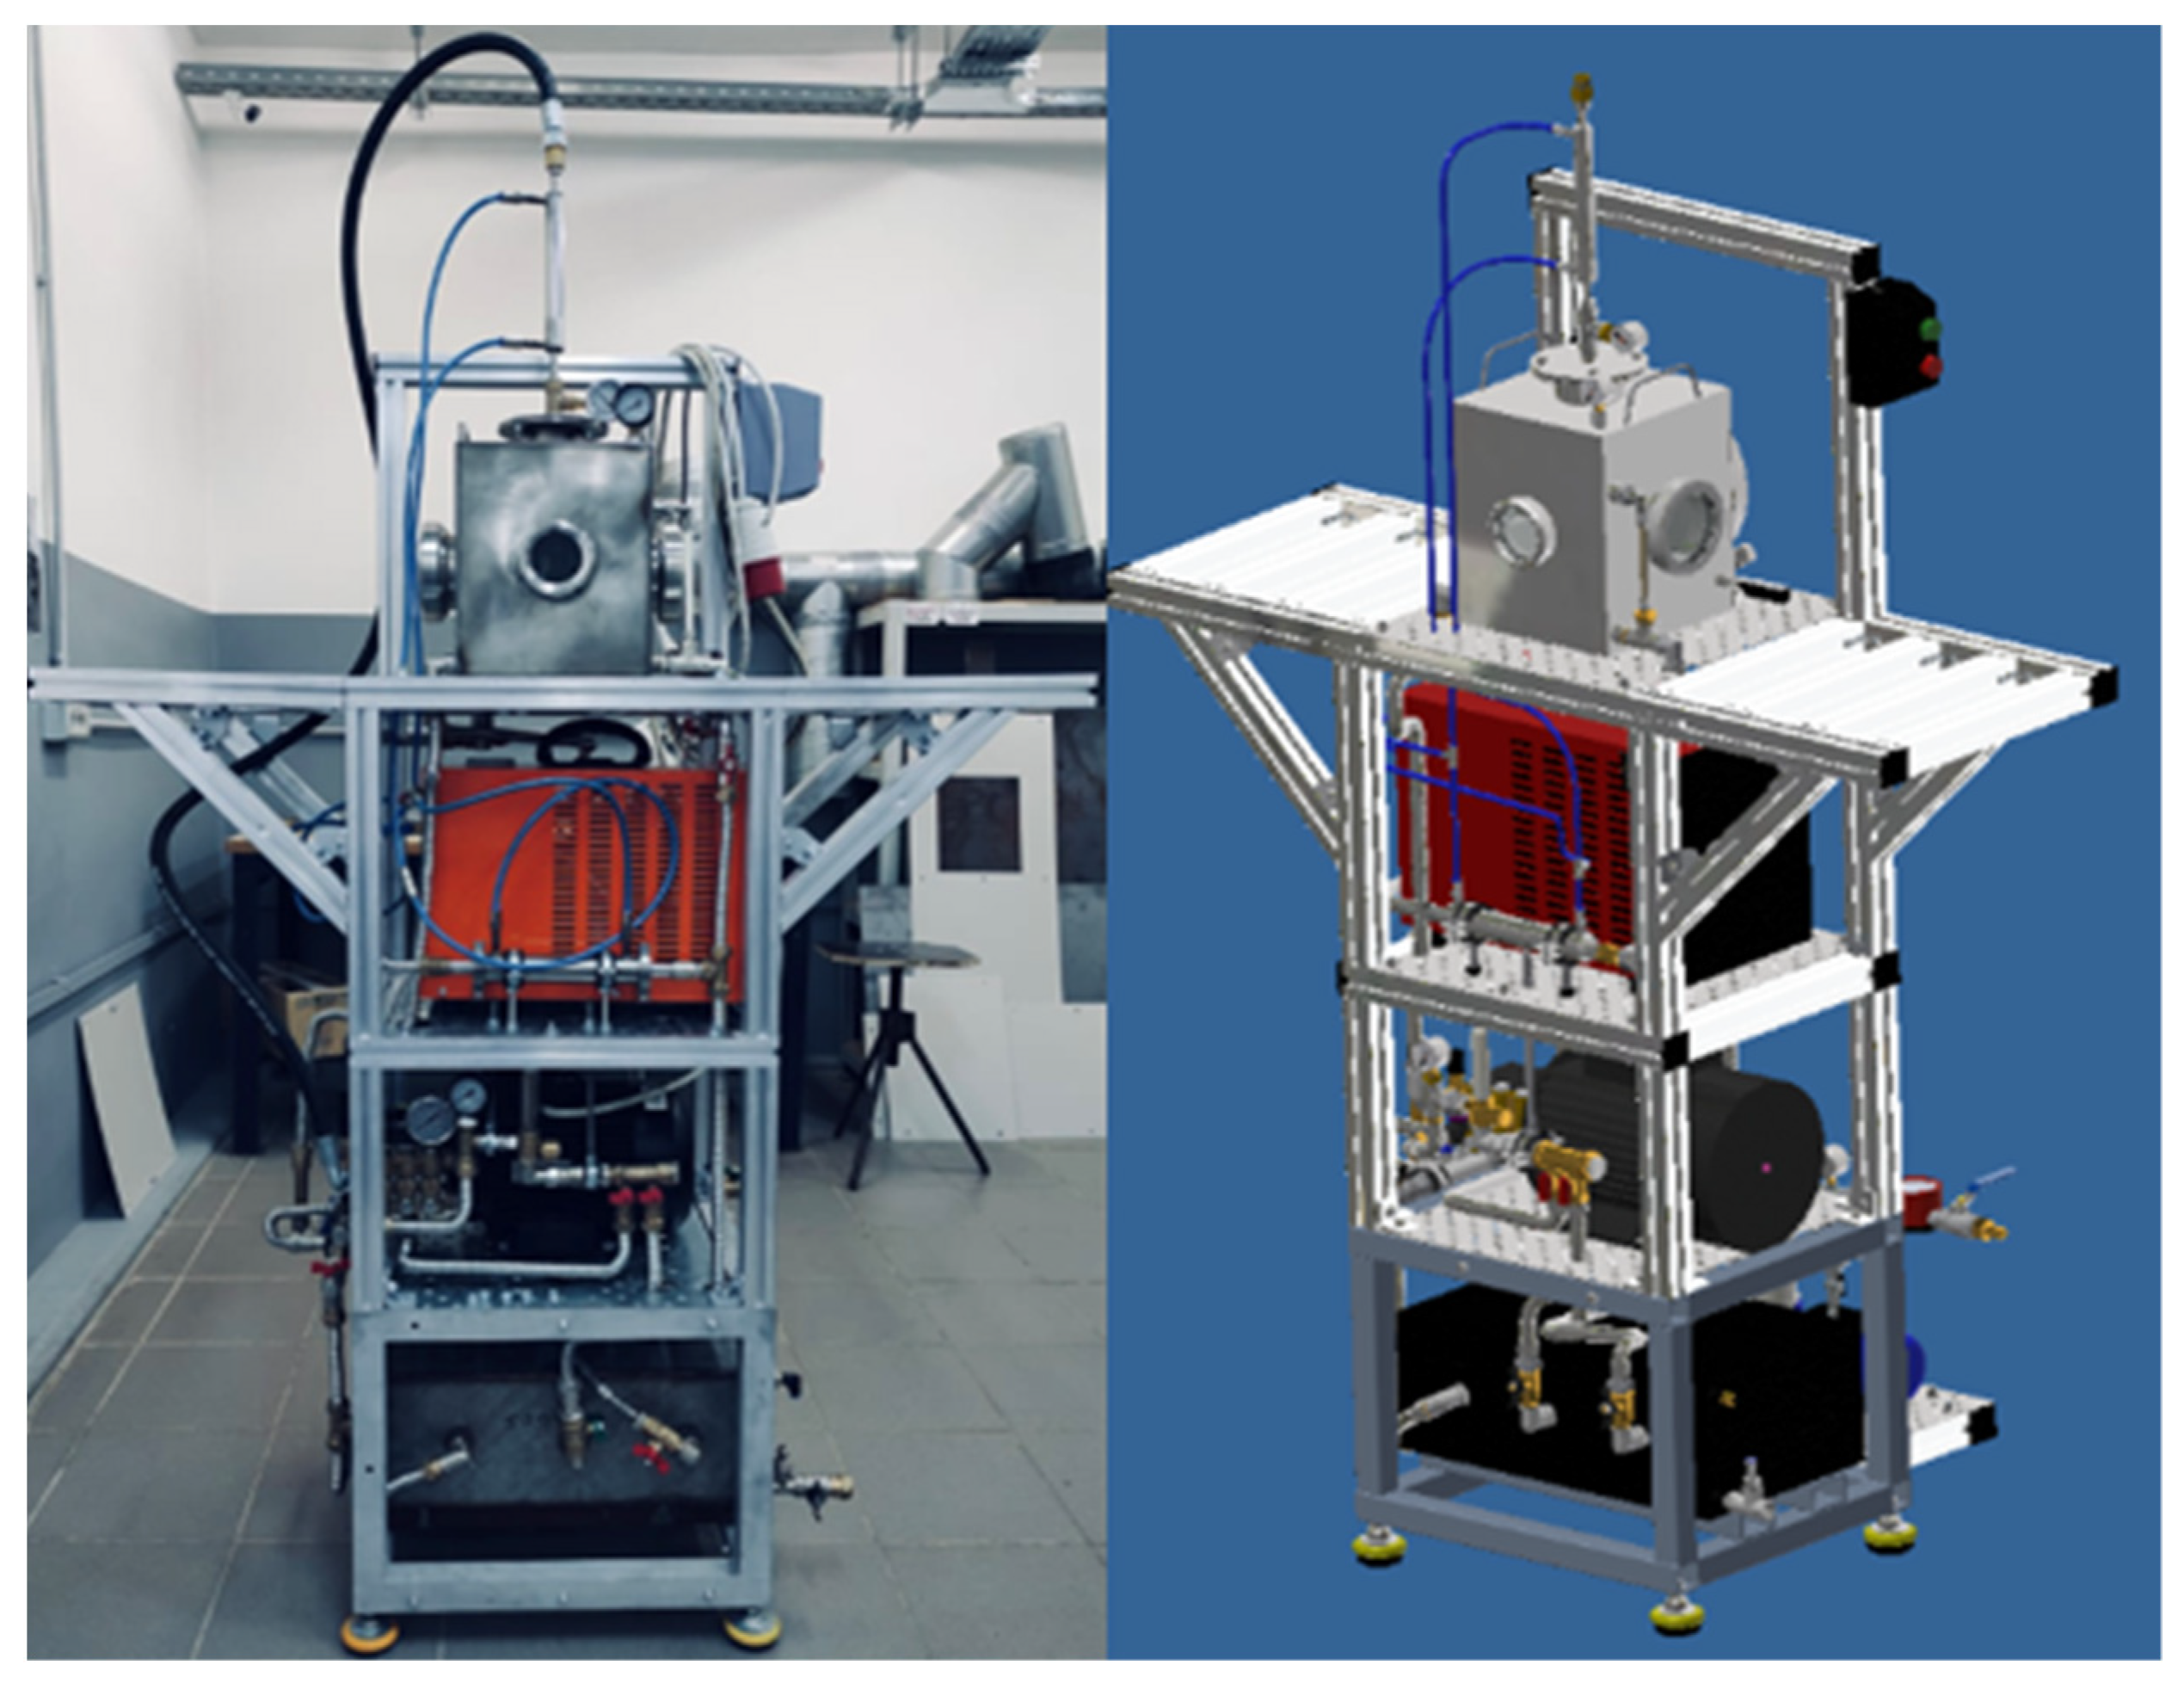
Diagram of cavitation jet test rig is shown in
Figure 1. Appearance and sketch of the cavitation jet test rig are shown in
Figure 2.
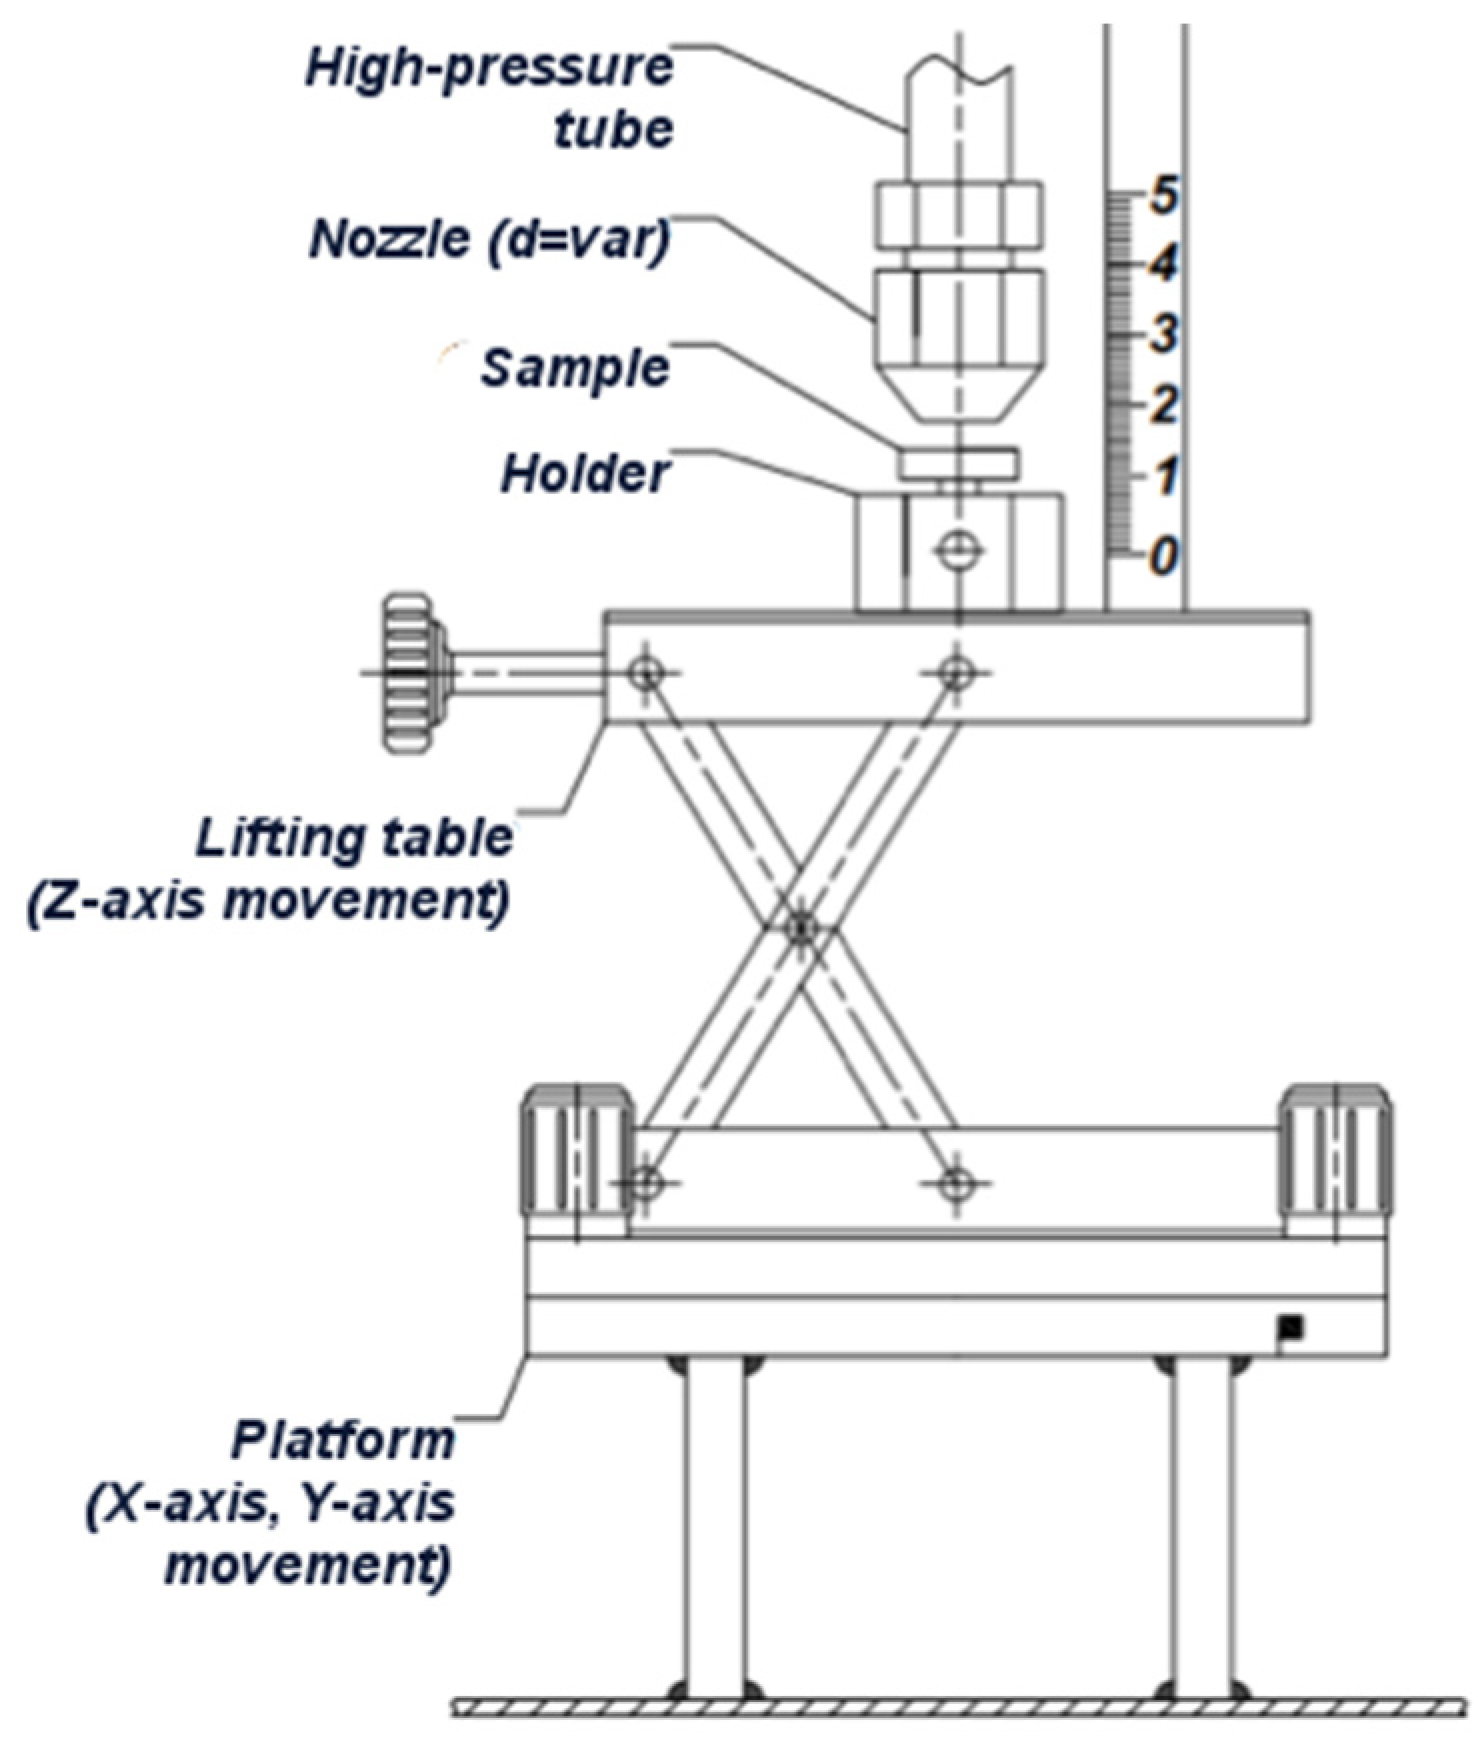
The cavitation jet test rig functions are as follows. A pre-treated operating liquid (water), cleared of mechanical impurities, enters a small nozzle of cylindrical shape through a high-pressure tube at liquid pressure up to 20 MPa developed by a plunger pump. After exiting the nozzle, the jet interacts with the experimental sample mounted in its positioning system (see
Figure 3) inside the test chamber. The sample is placed in the path of the jet and at a certain distance from the nozzle. The pressure and temperature of the liquid are monitored with manometers and thermometer. A pressure regulator makes it possible to monitor and change the pressure developed by the pump.
During cavitation tests according to [
43], in addition to the inlet pressure (
Pin), pressure in the test rig chamber (
Pout) and nozzle diameter (
dnozzle), the following parameters are measured:
- −
Distance from nozzle end to sample surface (H, mm);
- −
Mass loss of sample (Δmi, g);
- −
Testing time (t, min).
The mass loss of the sample is calculated using the formula:
where
mo is the original mass of sample [g];
mi is the mass of sample after experiment [g];
i is the test number.
We used cylindrical samples with a diameter of 20 mm with a rectangular boss for fixing in the sample holder to perform tests on the cavitation jet test rig.
To determine the optimum distance from the nozzle end to the sample surface, the pressure before the nozzle and the nozzle diameter resulting in the maximum cavitation effect, tests were carried out on coated aluminum specimens with variation of these parameters. Coating is a polymer paint with thickness at 150 µm. The testing time
t was the same for all tests. The chemical composition of aluminum is given in
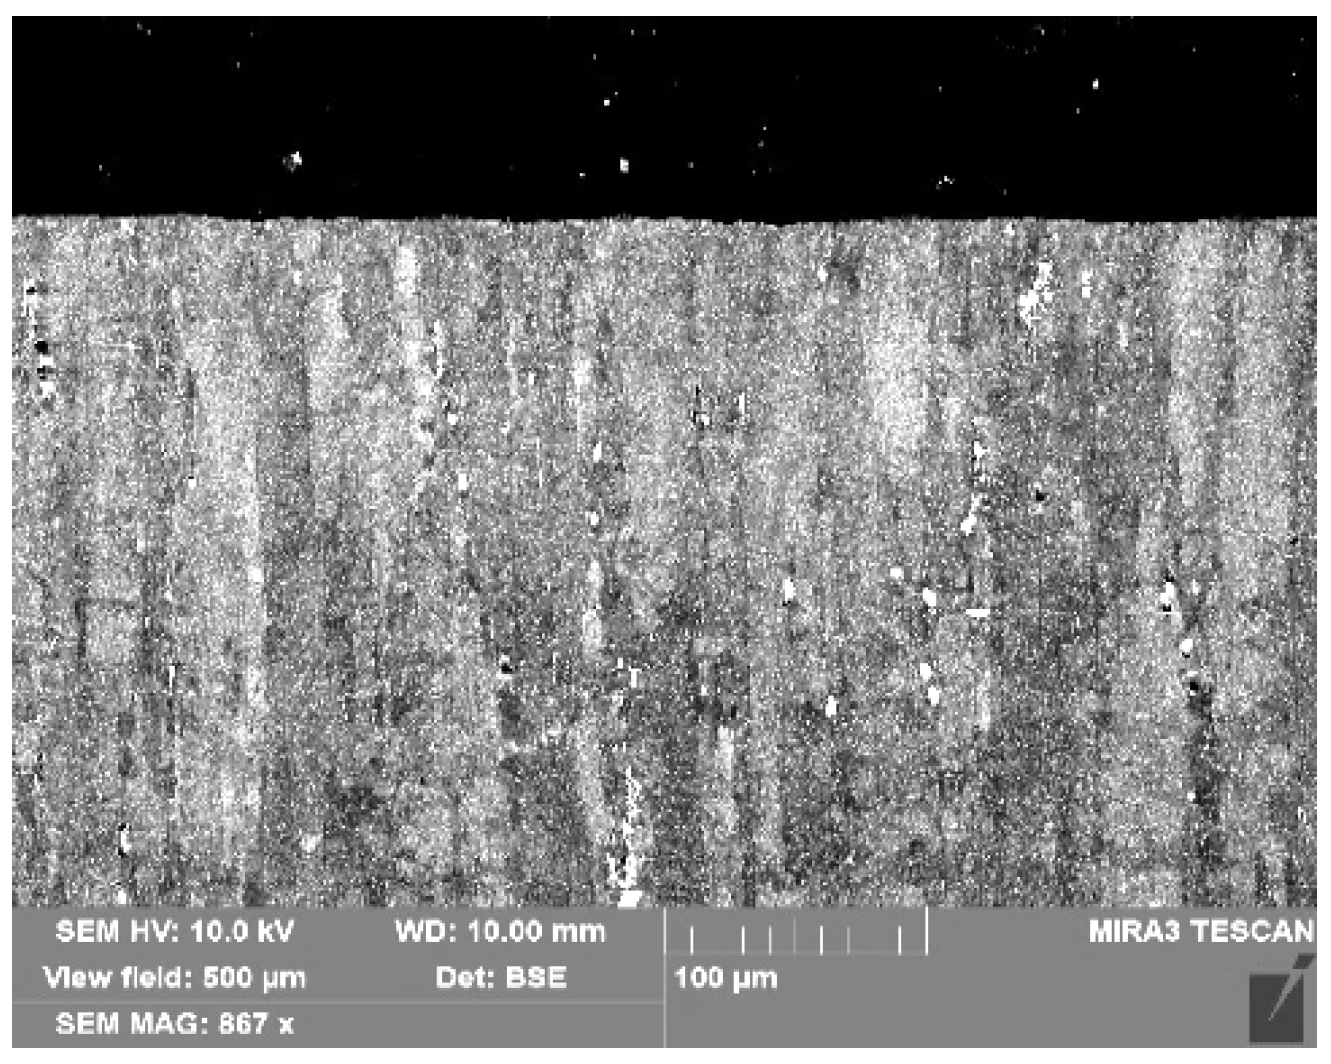
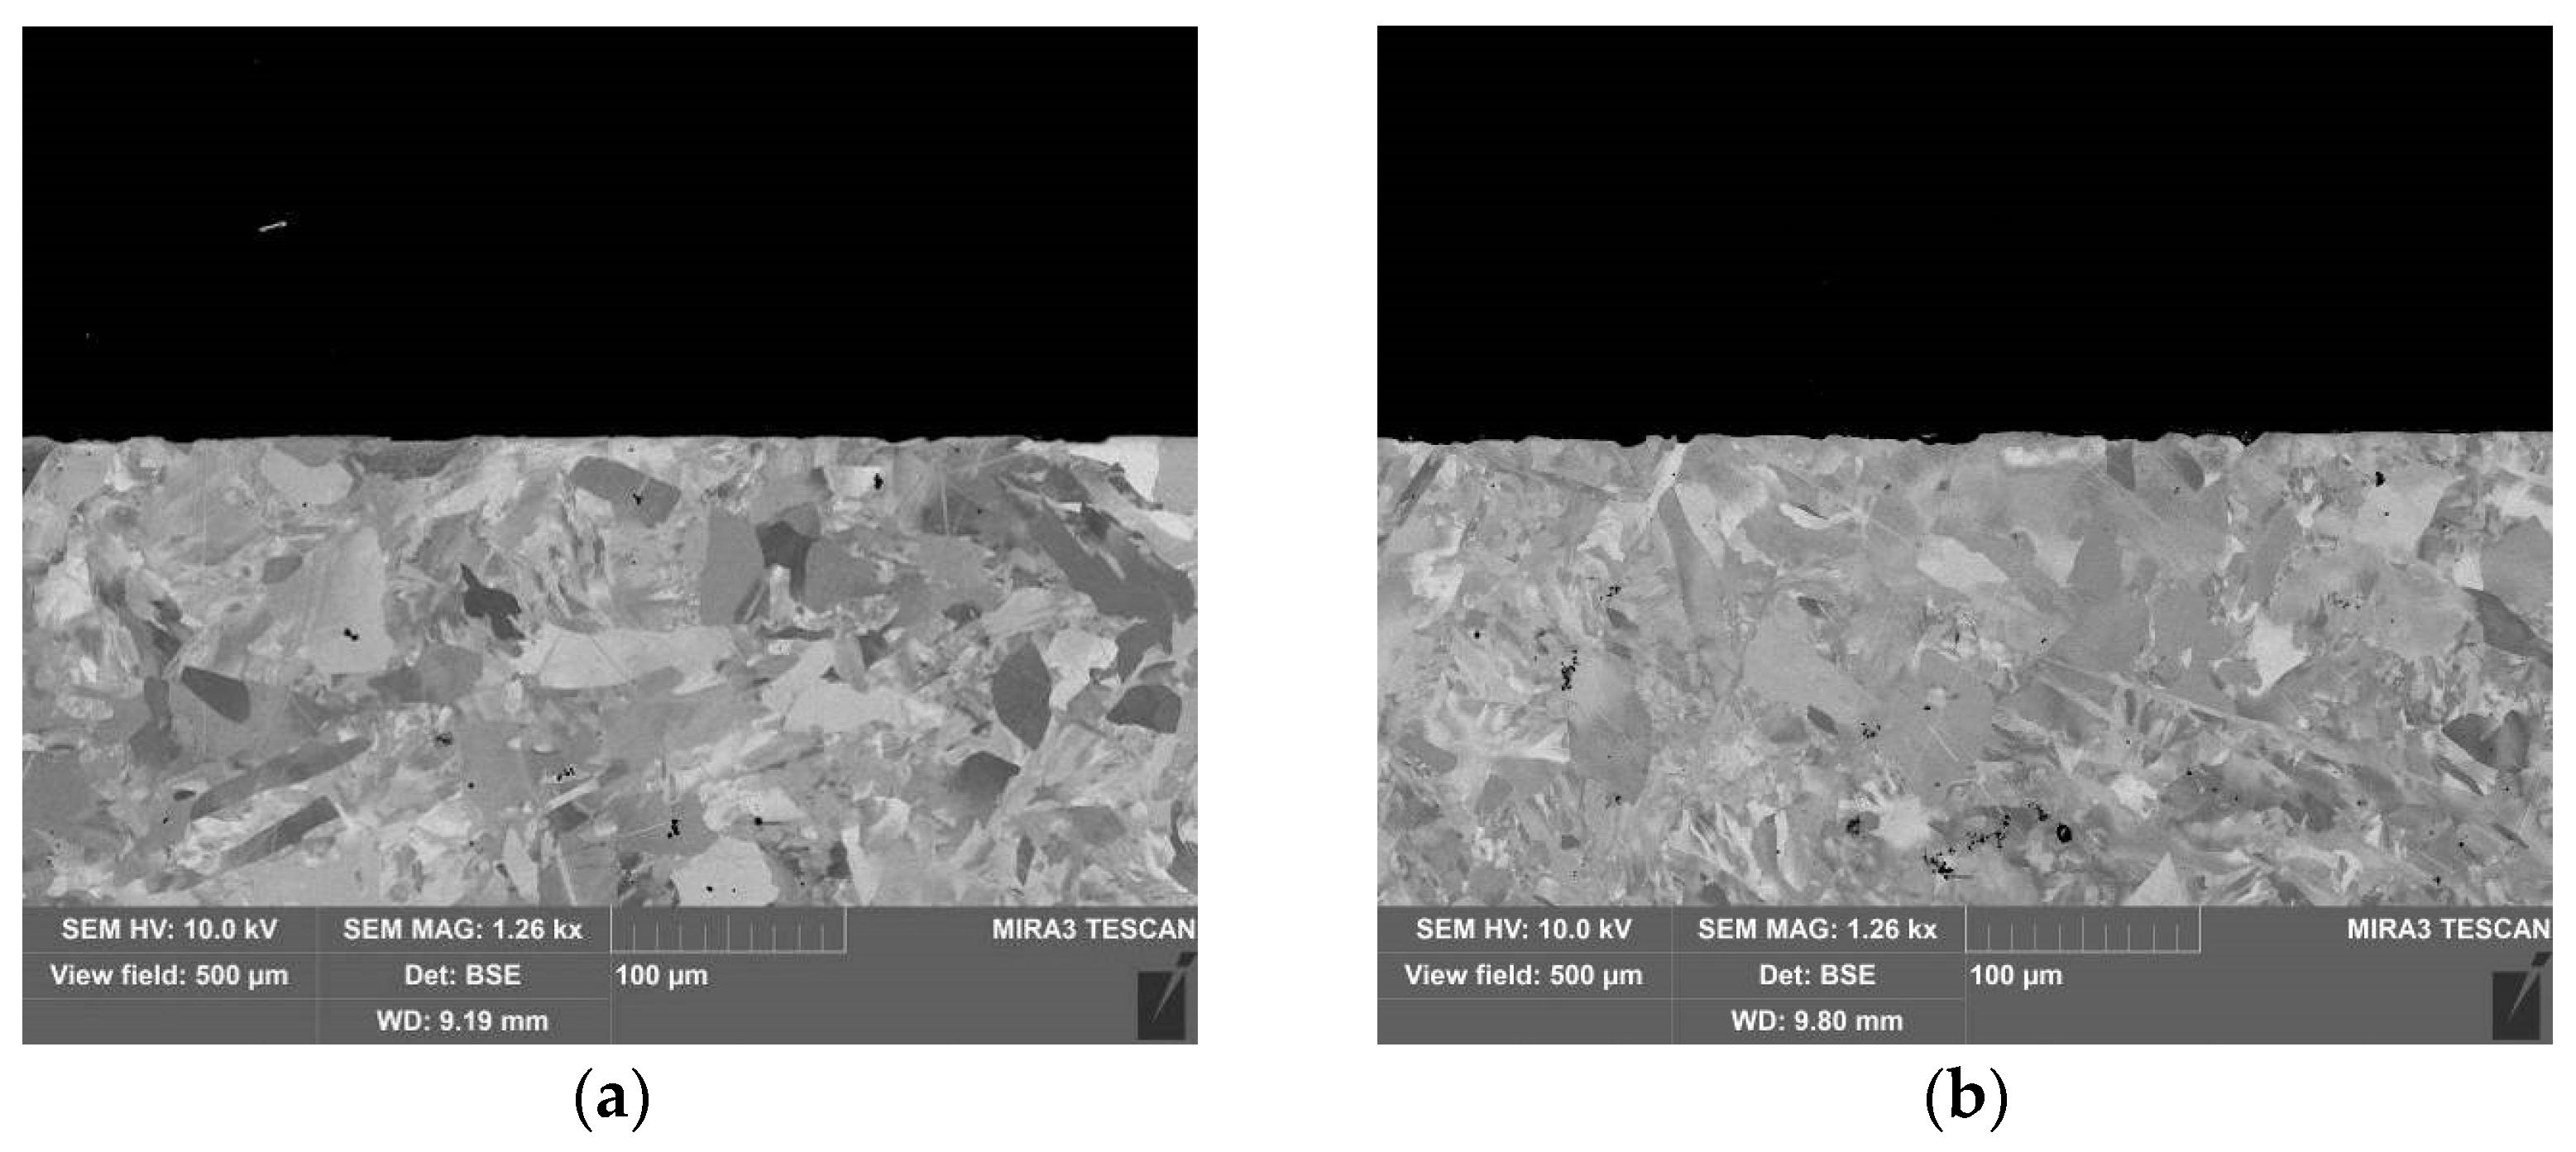
Table 2. The microstructure of uncoated aluminum sample is shown in
Figure 4.
After cavitation tests, the surface of coated aluminum samples was examined using a scanning electron microscope and a mechanical stylus profiler. Settings of the SEM microscope are given in
Table 3.
The surface condition of samples and the size (diameter—Dout) of cavitation mark were evaluated by surface images obtained using electron microscope, while the depth of cavitation mark h was determined by profiles obtained using a surface profilometer. Then, the mode that ensured and maximum wear was selected on the basis of the results obtained.
Cavitation tests were conducted on coated aluminum samples at different pressures before nozzle
Pin, distances from nozzle to the sample surface
H, and nozzle diameter
dnozzle (see
Table 4). Testing time
t was 30 min.
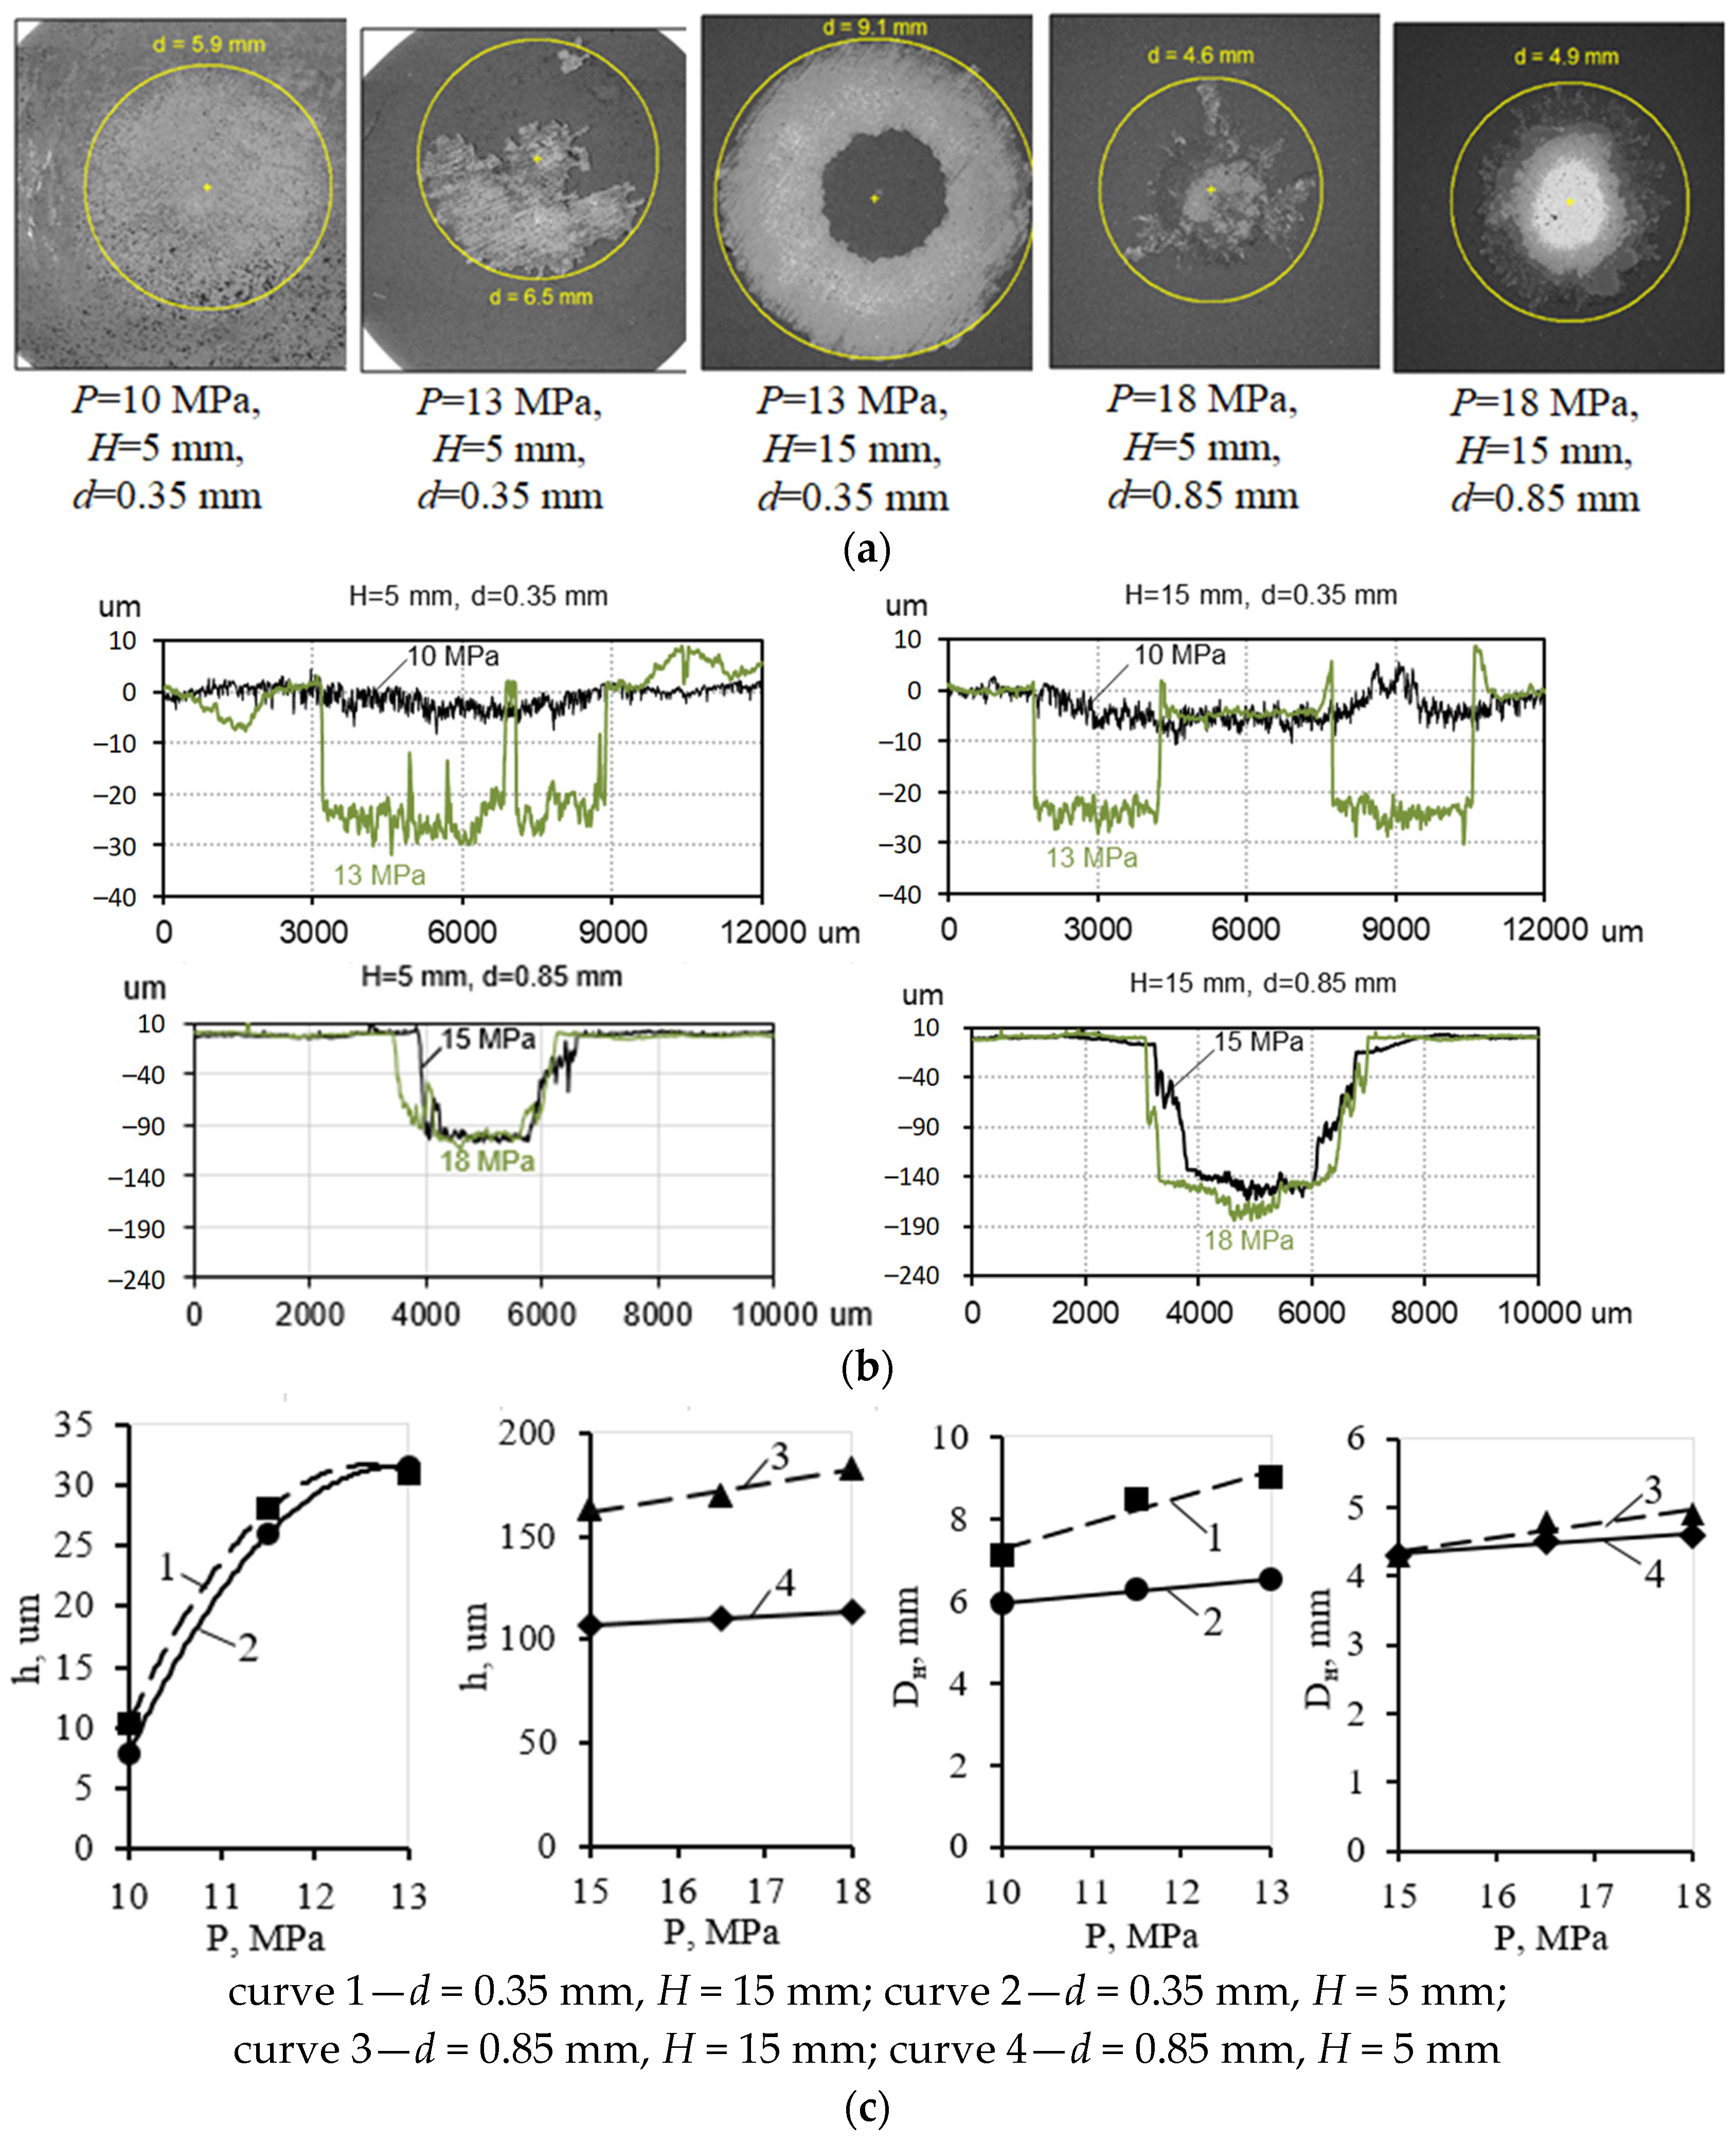
After cavitation tests, analysis of coated sample surfaces using electron microscope showed that at nozzle diameter 0.35 mm coating delamination is observed only at pressure increase from 10 to 13 MPa, with partial delamination in the area of maximum impact (under nozzle). External (total) diameter of cavitation mark
Dout for nozzle diameter of 0.35 mm determined by SEM-images is bigger at distance
H = 15 mm (see
Figure 5a,c). The increase of
Dout is recorded with an increase in pressure.
Wear depths at distance from nozzle of 5 and 15 mm with nozzle diameter of 0.35 mm are comparable (see
Figure 5c), but the greatest wear at
H = 15 mm is registered in annular area (see
Figure 5b) located at some distance from center of cavitation mark. At
H = 5 mm there is wear in both the annular and central areas.
With a nozzle diameter of 0.85 mm, coating delamination is recorded in all of the tests performed. The wear depth is greater than with a nozzle diameter of 0.35 mm (see
Figure 5c). At nozzle diameter 0.85 mm, with distance from nozzle of 5 and 15 mm external (total) diameters of cavitation mark
Dout have close values. At that, for
H = 15 mm the delamination is more even and the delamination area is larger than for
H = 5 mm (see
Figure 5a). The wear pattern with increase of pressure from 15 to 18 MPa does not change, the maximum wear is recorded in the center of cavitation mark (see
Figure 5b). Diameter of cavitation mark
Dout and wear depth h with pressure increase but insignificantly (see
Figure 5c).
With the results of all tests carried out on coated aluminum samples, it was found that the maximum wear is at H = 15 mm.
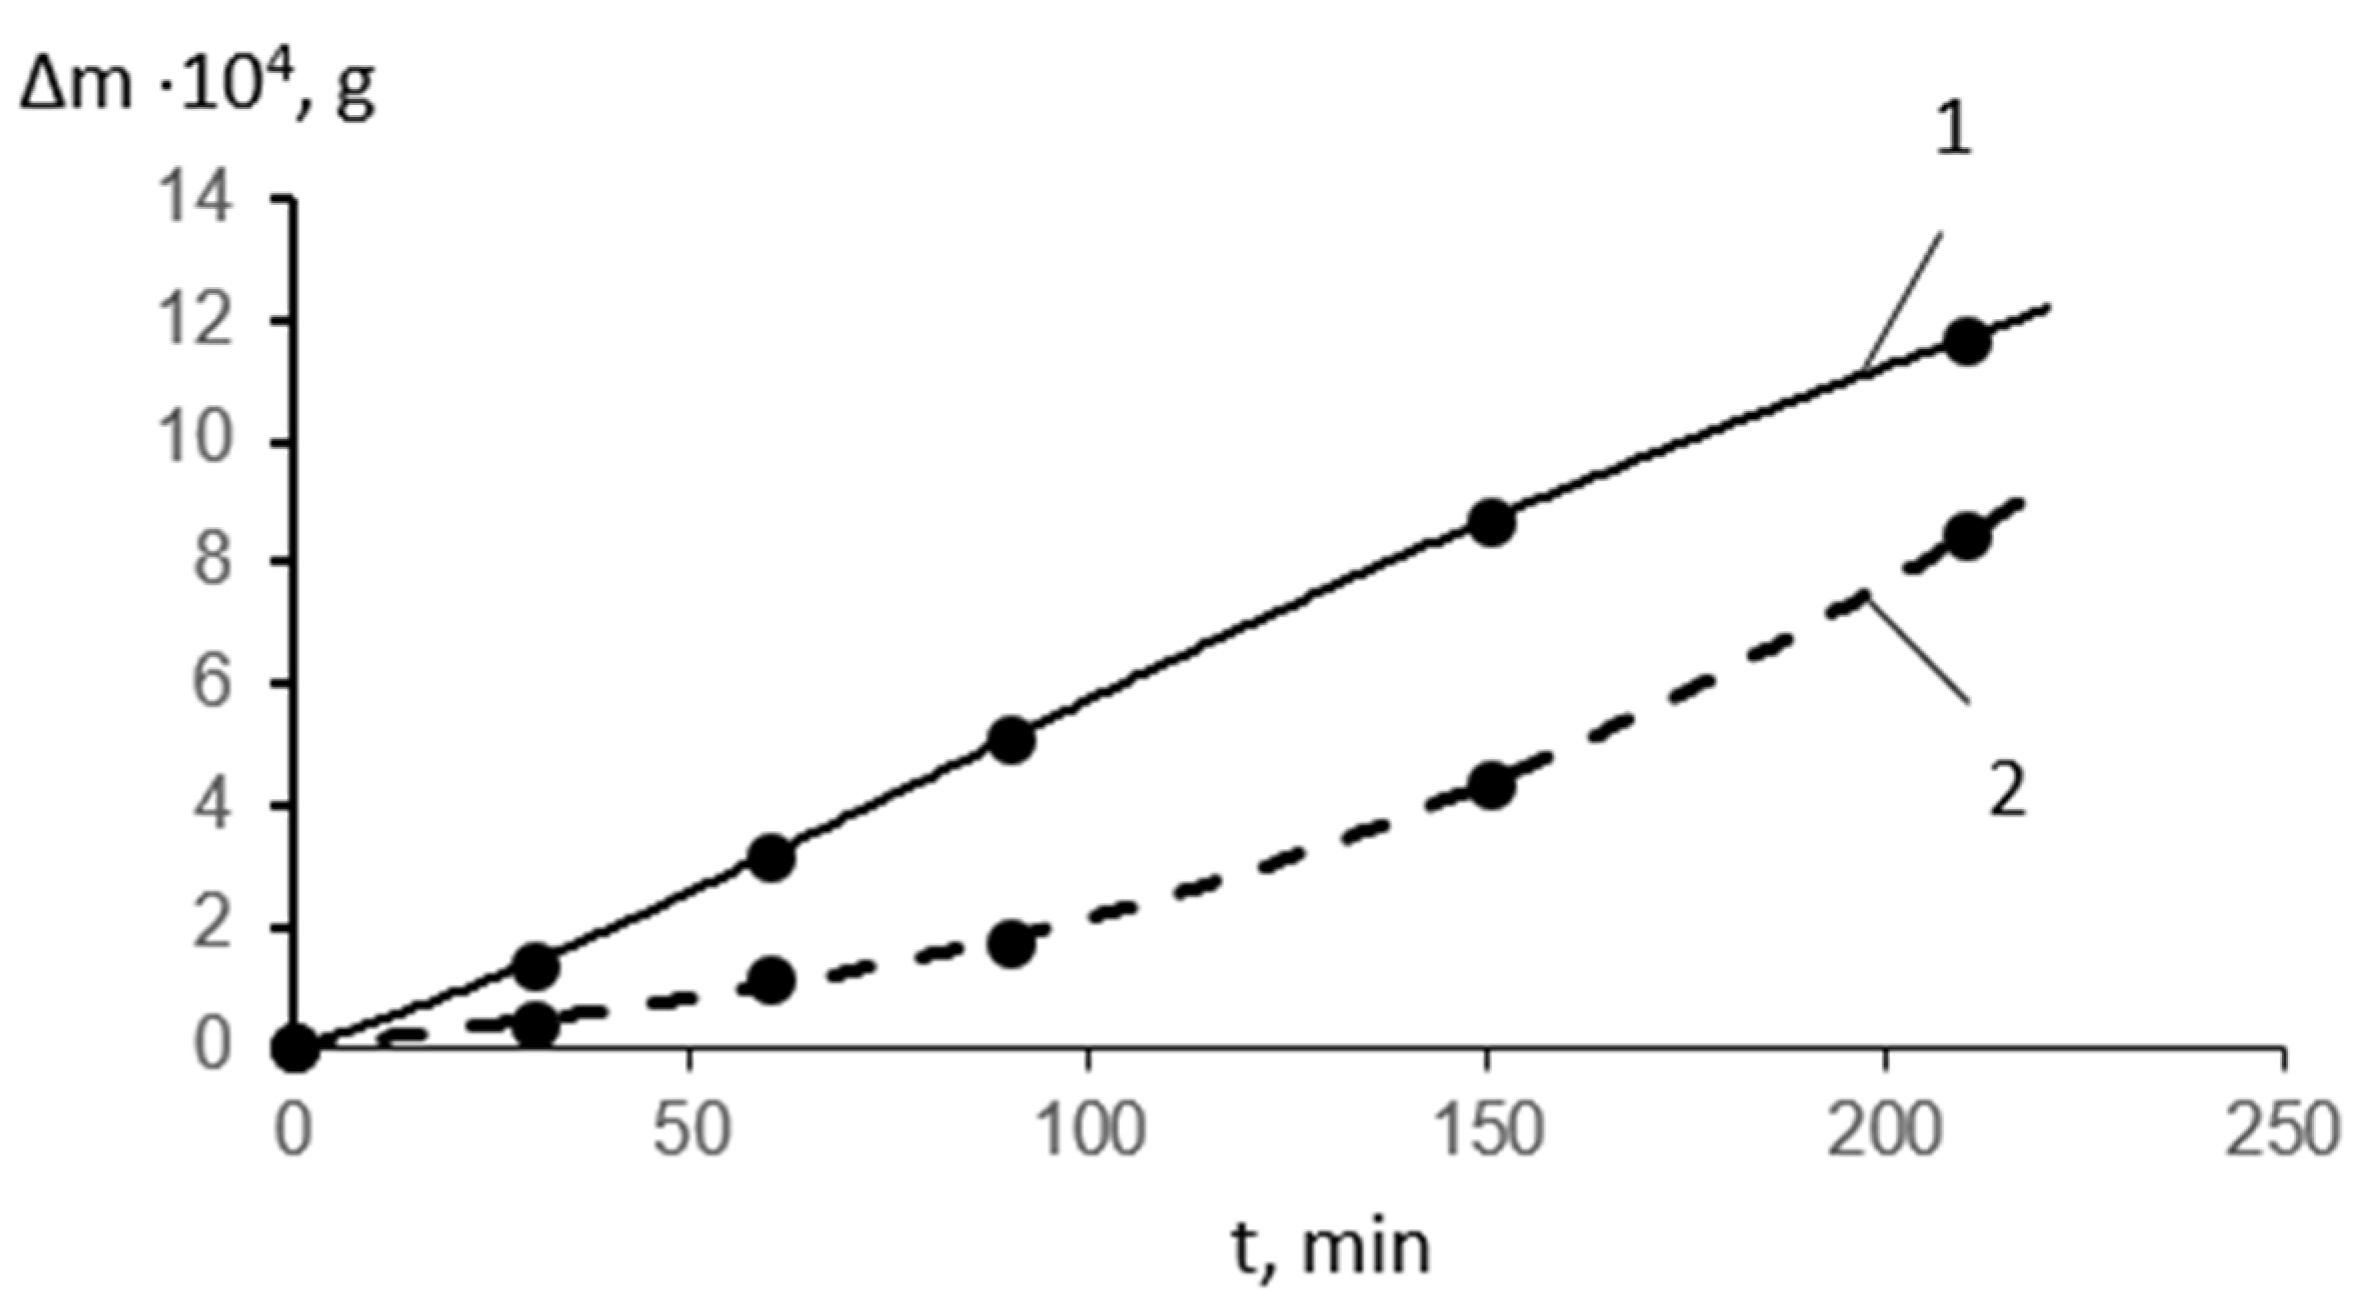
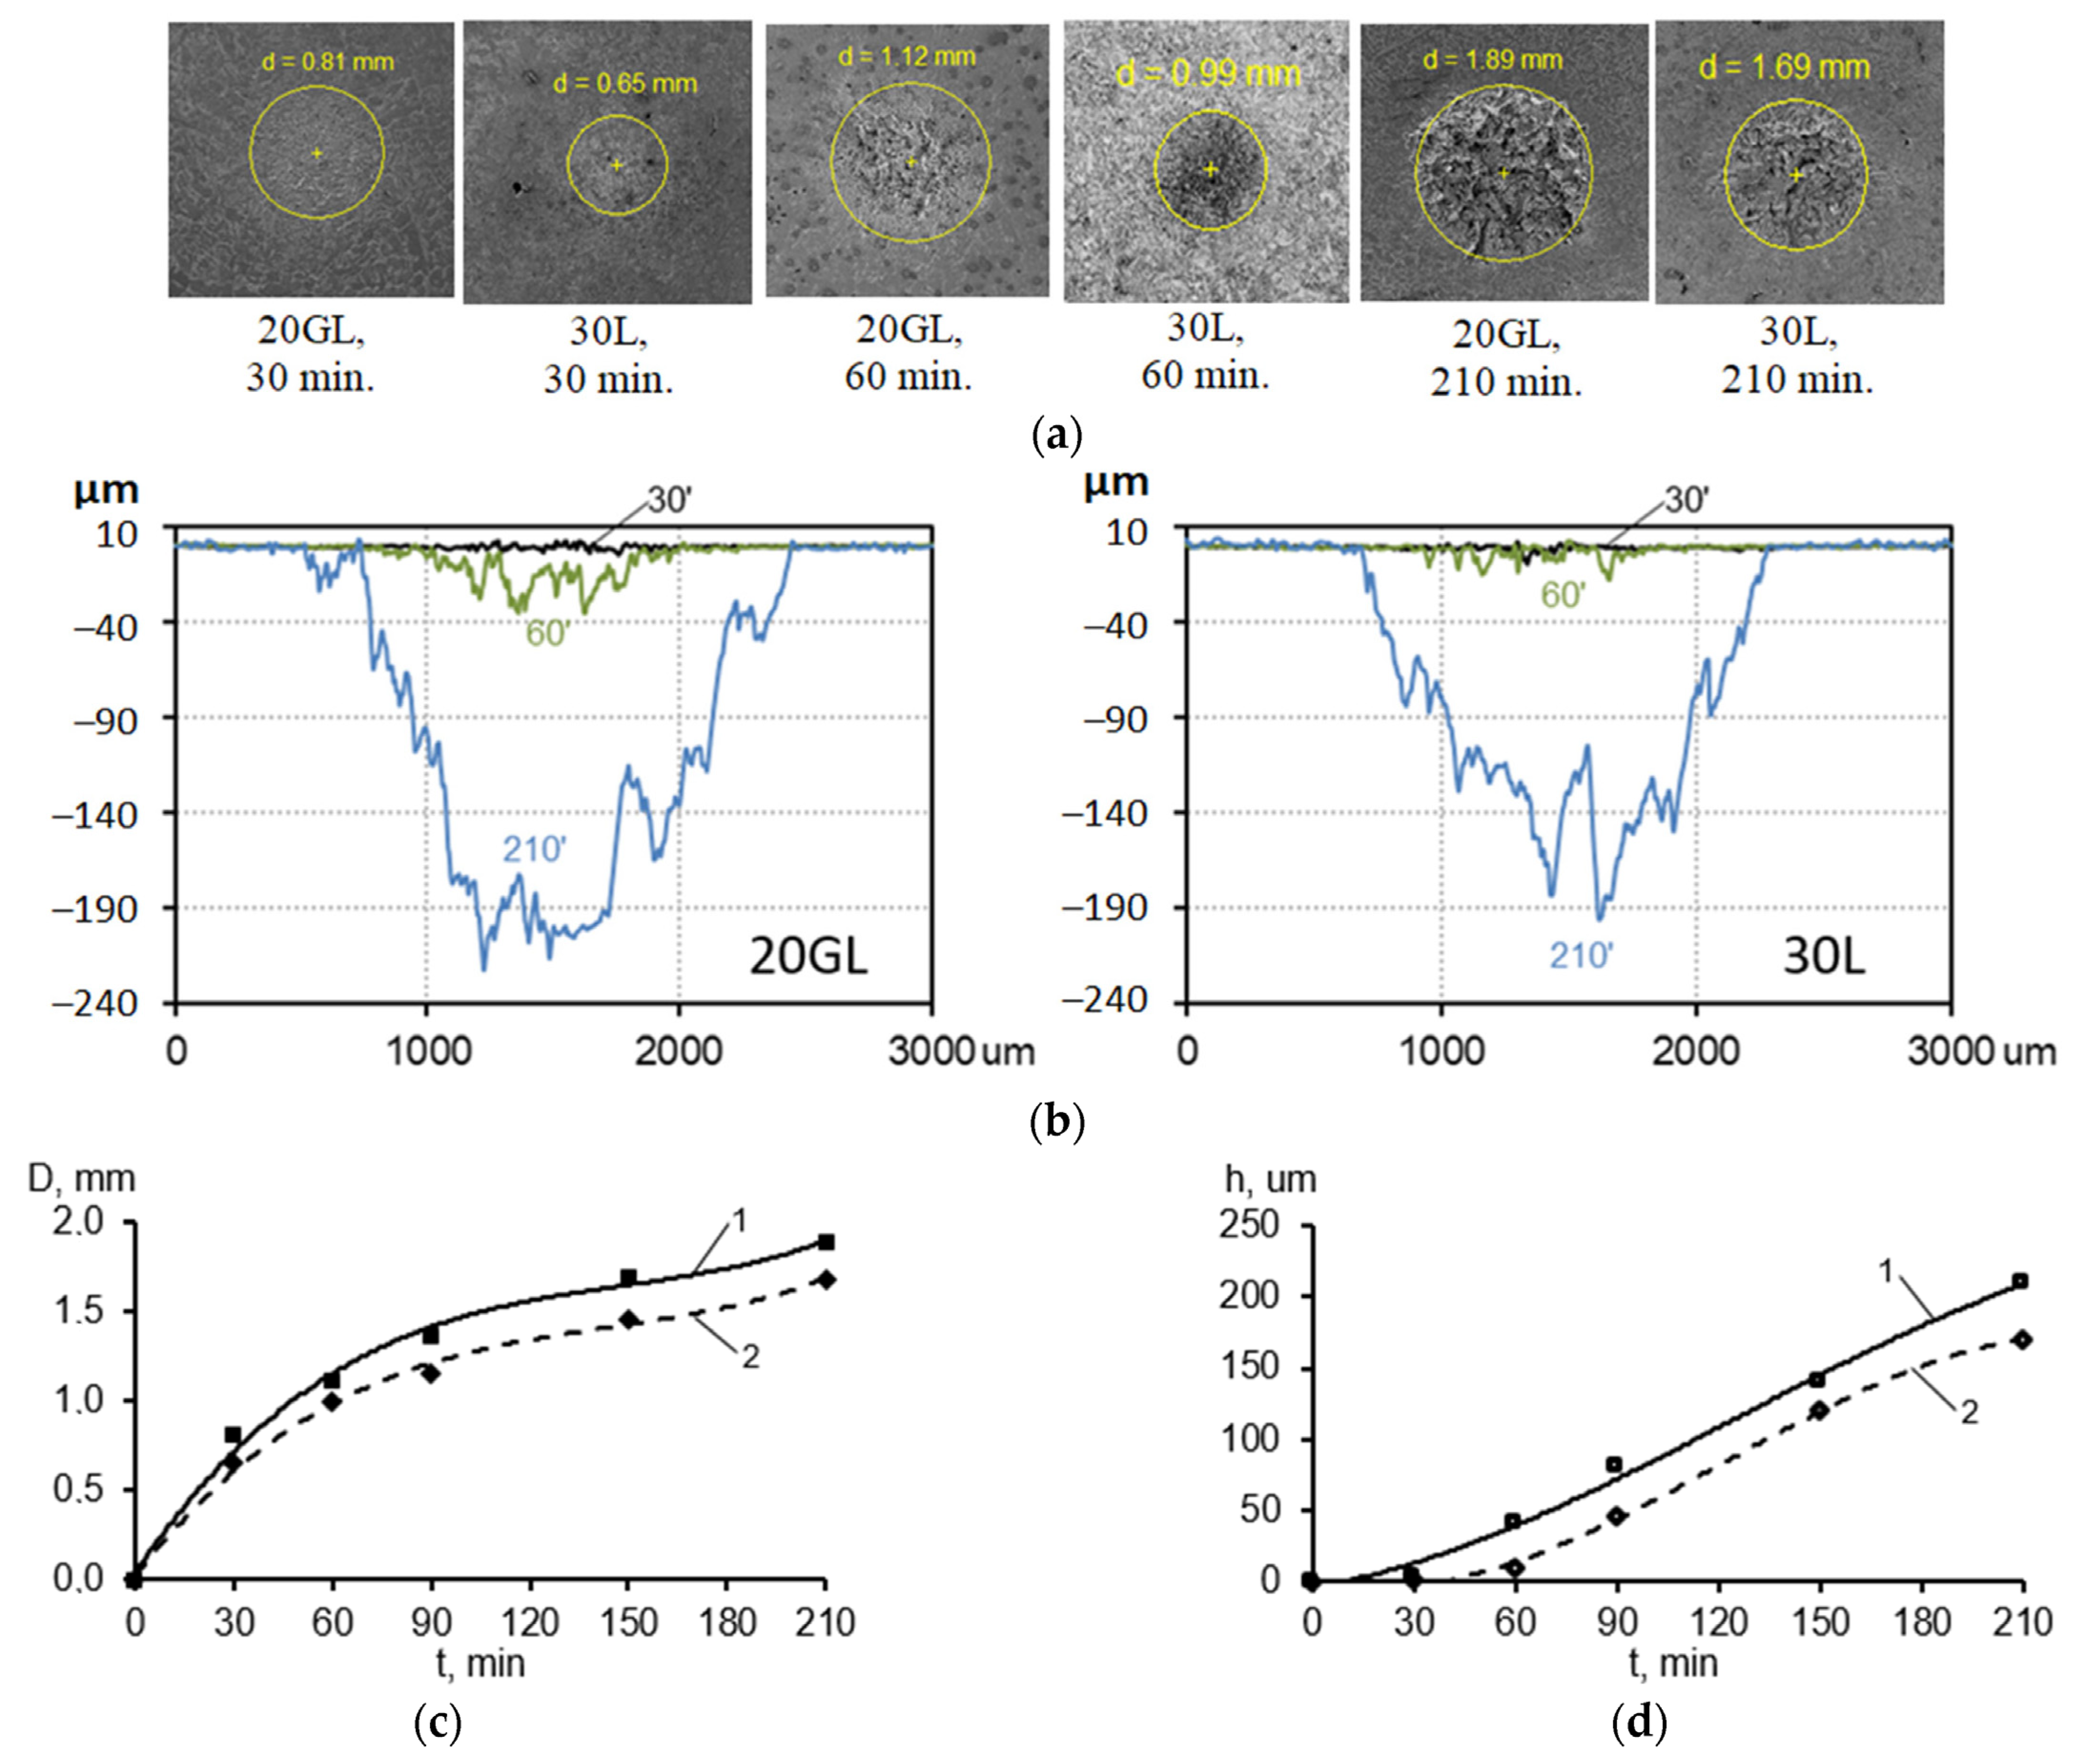
Using the mode selected on the basis of tests of coated samples, tests with blade steels 20 GL and 30 L were performed with plotting of kinetic curves of cavitation wear Δ
m = f(t). The chemical composition of steels 20 GL and 30 L and hardness are given in
Table 5. The microstructure of steels 20 GL and 30 L is shown in
Figure 6.
For each time interval the state of sample surface was investigated with evaluation of wear depth and fracture spot sizes using mechanical stylus profiler and scanning electron microscope.
4. Discussion
The predominance of changes of cavitation mark [
44,
45,
46] diameter over its depth (
Dout >>
h) was found during incubation period, the period with maximum rate, and the initial stage of the period with steady rate of wear of the examined cast steels. The profile shape and the ratio of
Dout and
h (
Dout >>
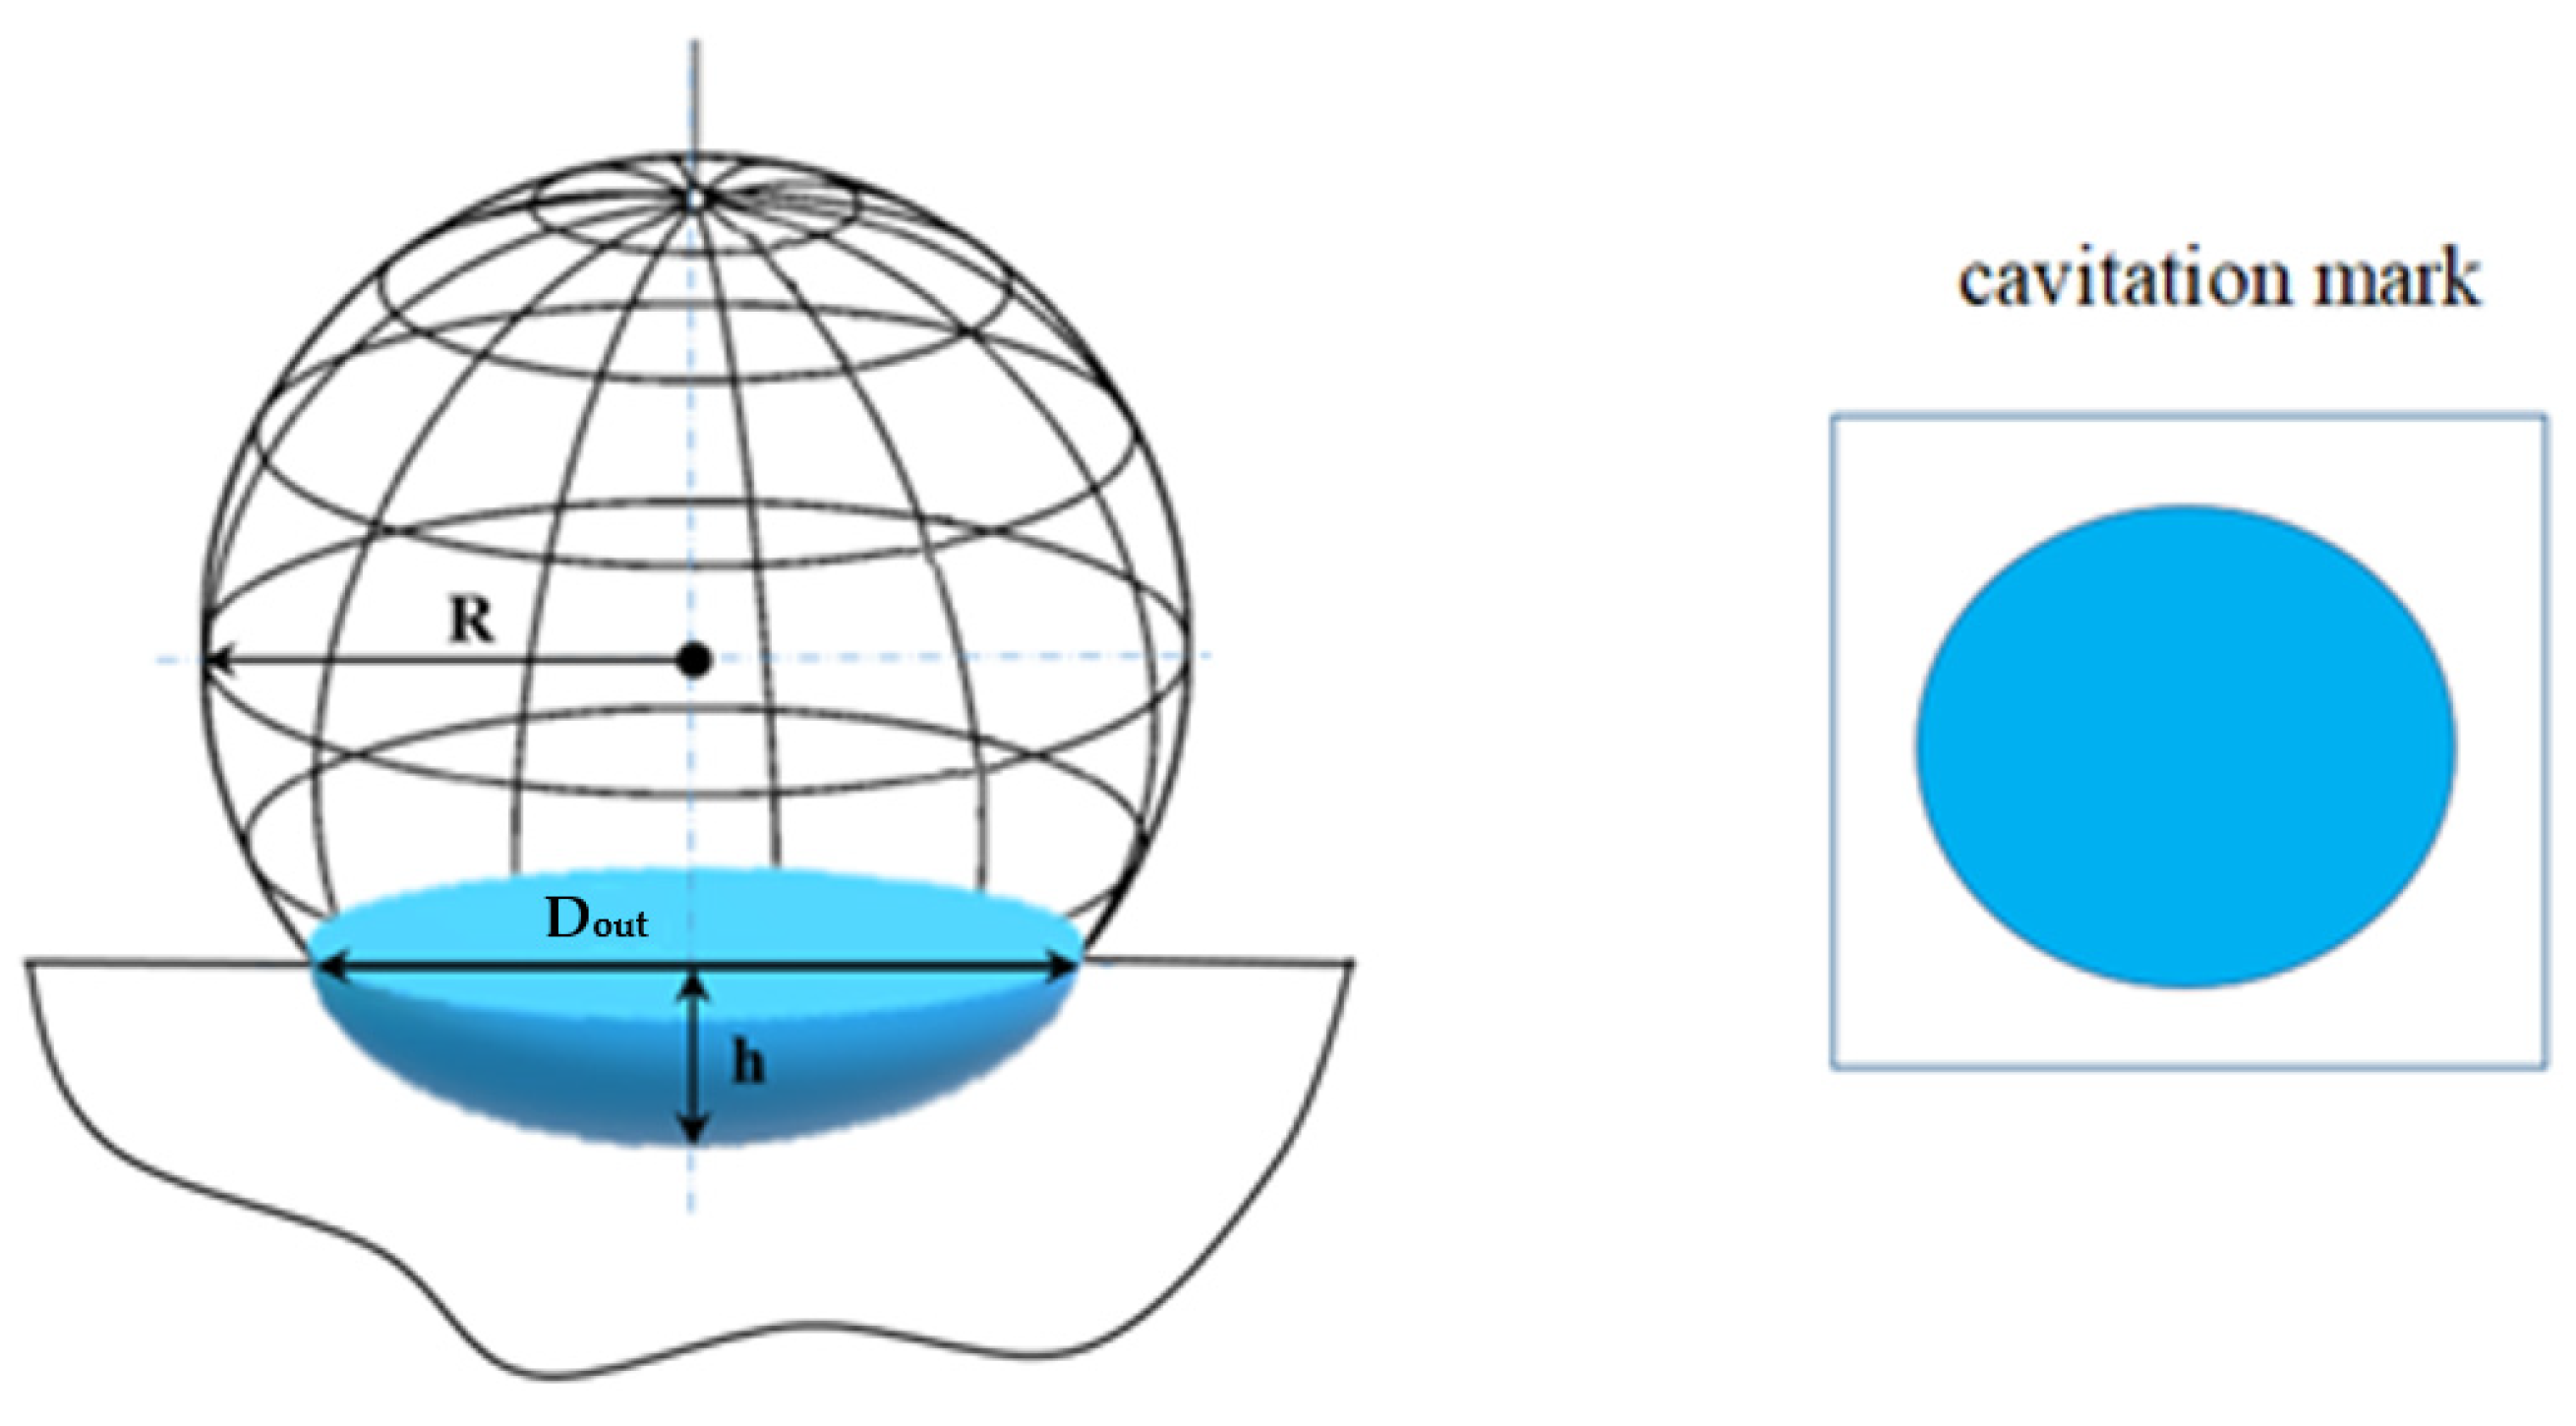
h) make it possible to evaluate the volume removal
V of the sample using the formula for the ball segment (see
Figure 9):
where
R is ball radius,
h is the depth of cavitation mark.
The ball radius in Formula (2) is calculated using the formula:
where
Dout is diameter of cavitation mark,
h is depth of cavitation mark.
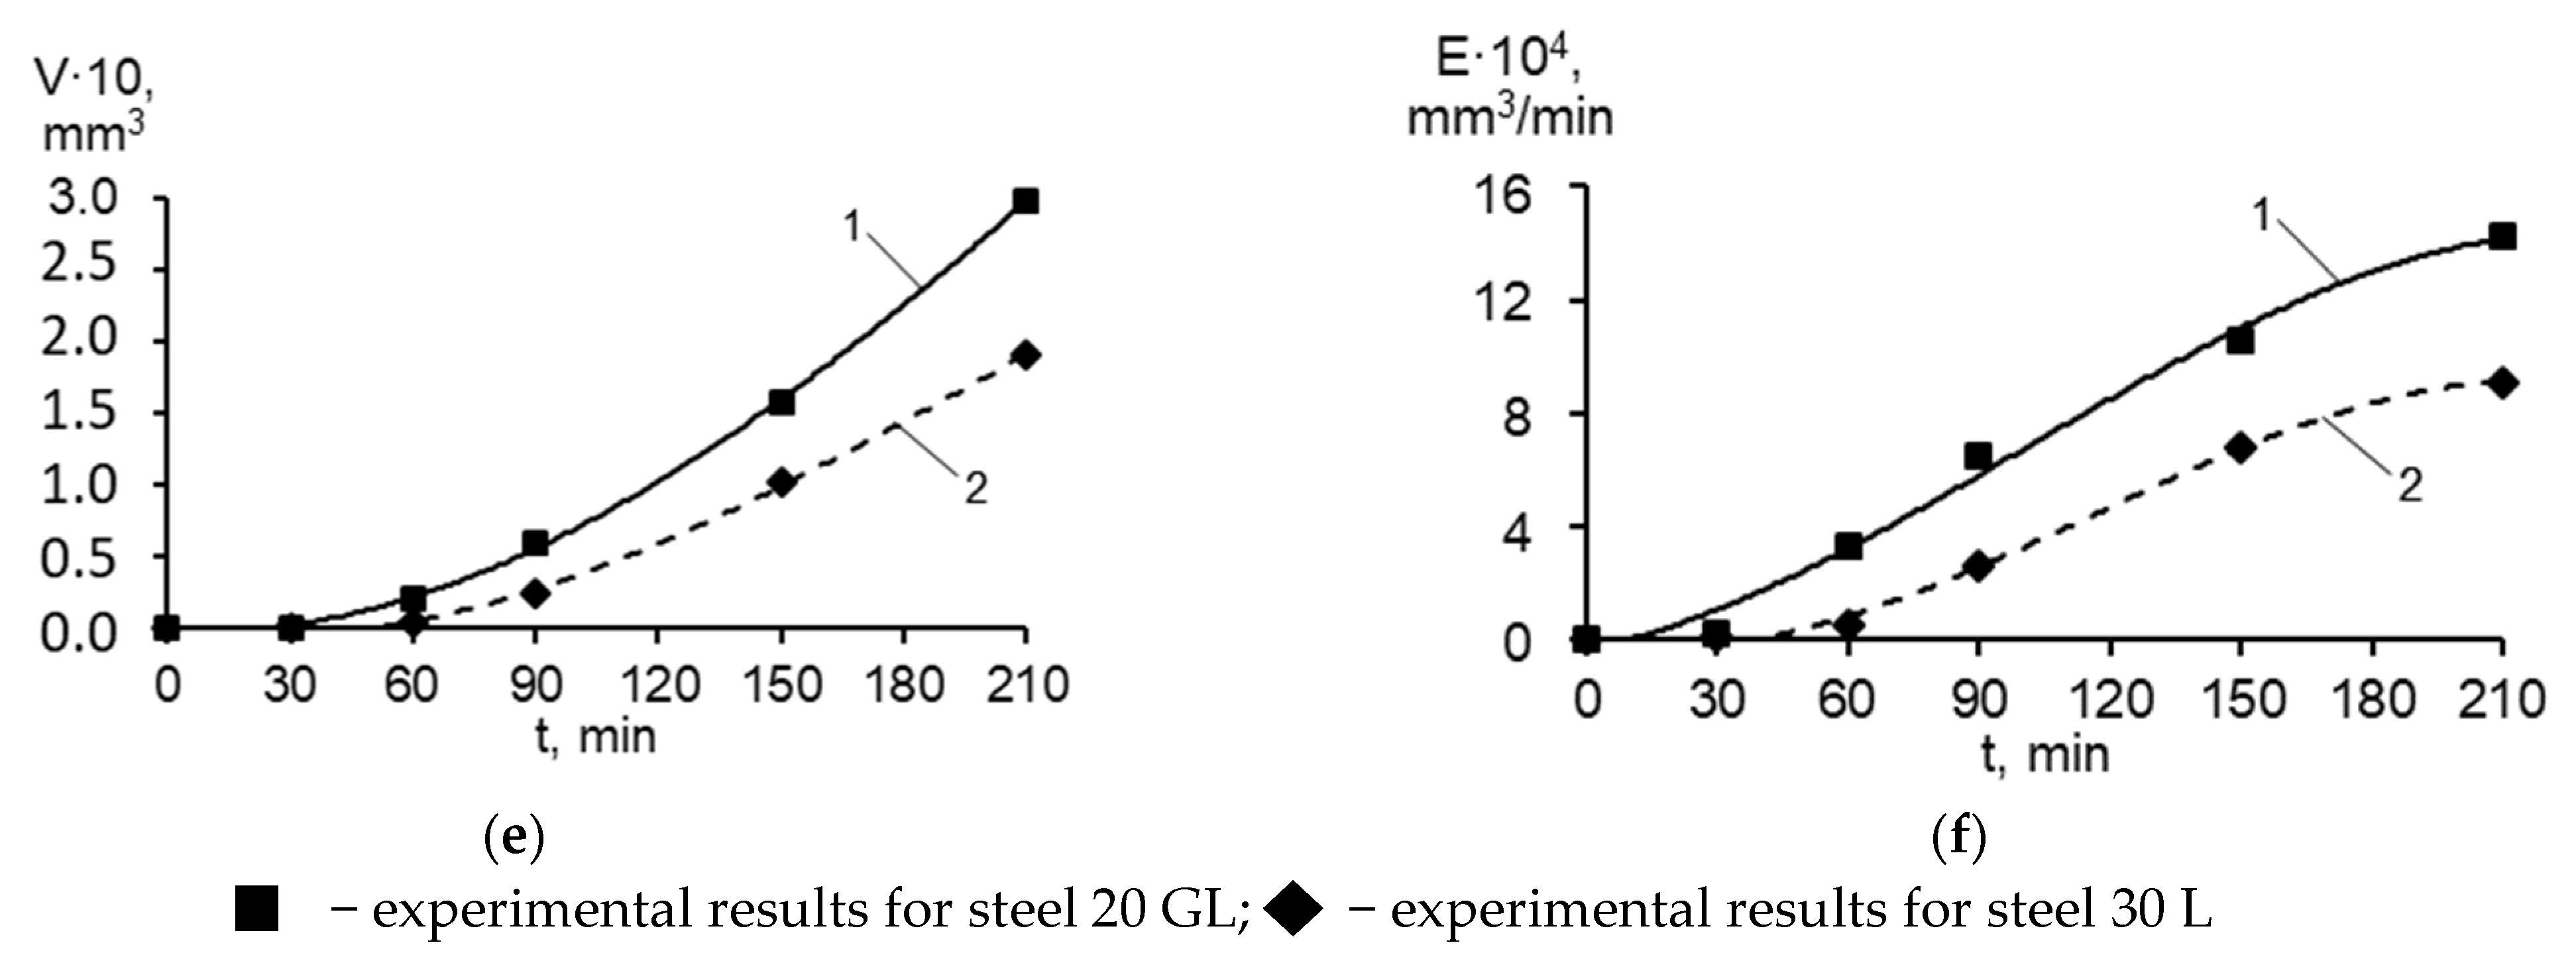
Figure 8e,f show the obtained kinetic curves of volume removal and corresponding curves of volume removal rate of examined steels 20 GL and 30 L respectively.
The proposed approach for determining volume removal extends the applicability of ASTM G134-17. The determination of cavitation resistance by volume removal was previously only possible for homogeneous materials according to ASTM G134-17. Due to the application of volume removal calculation by measuring the depth and diameter of the cavitation mark, such determination can also be calculated according to formula (2) for heterogeneous materials, including after modification of their surfaces (for different types of coatings and hardenings).
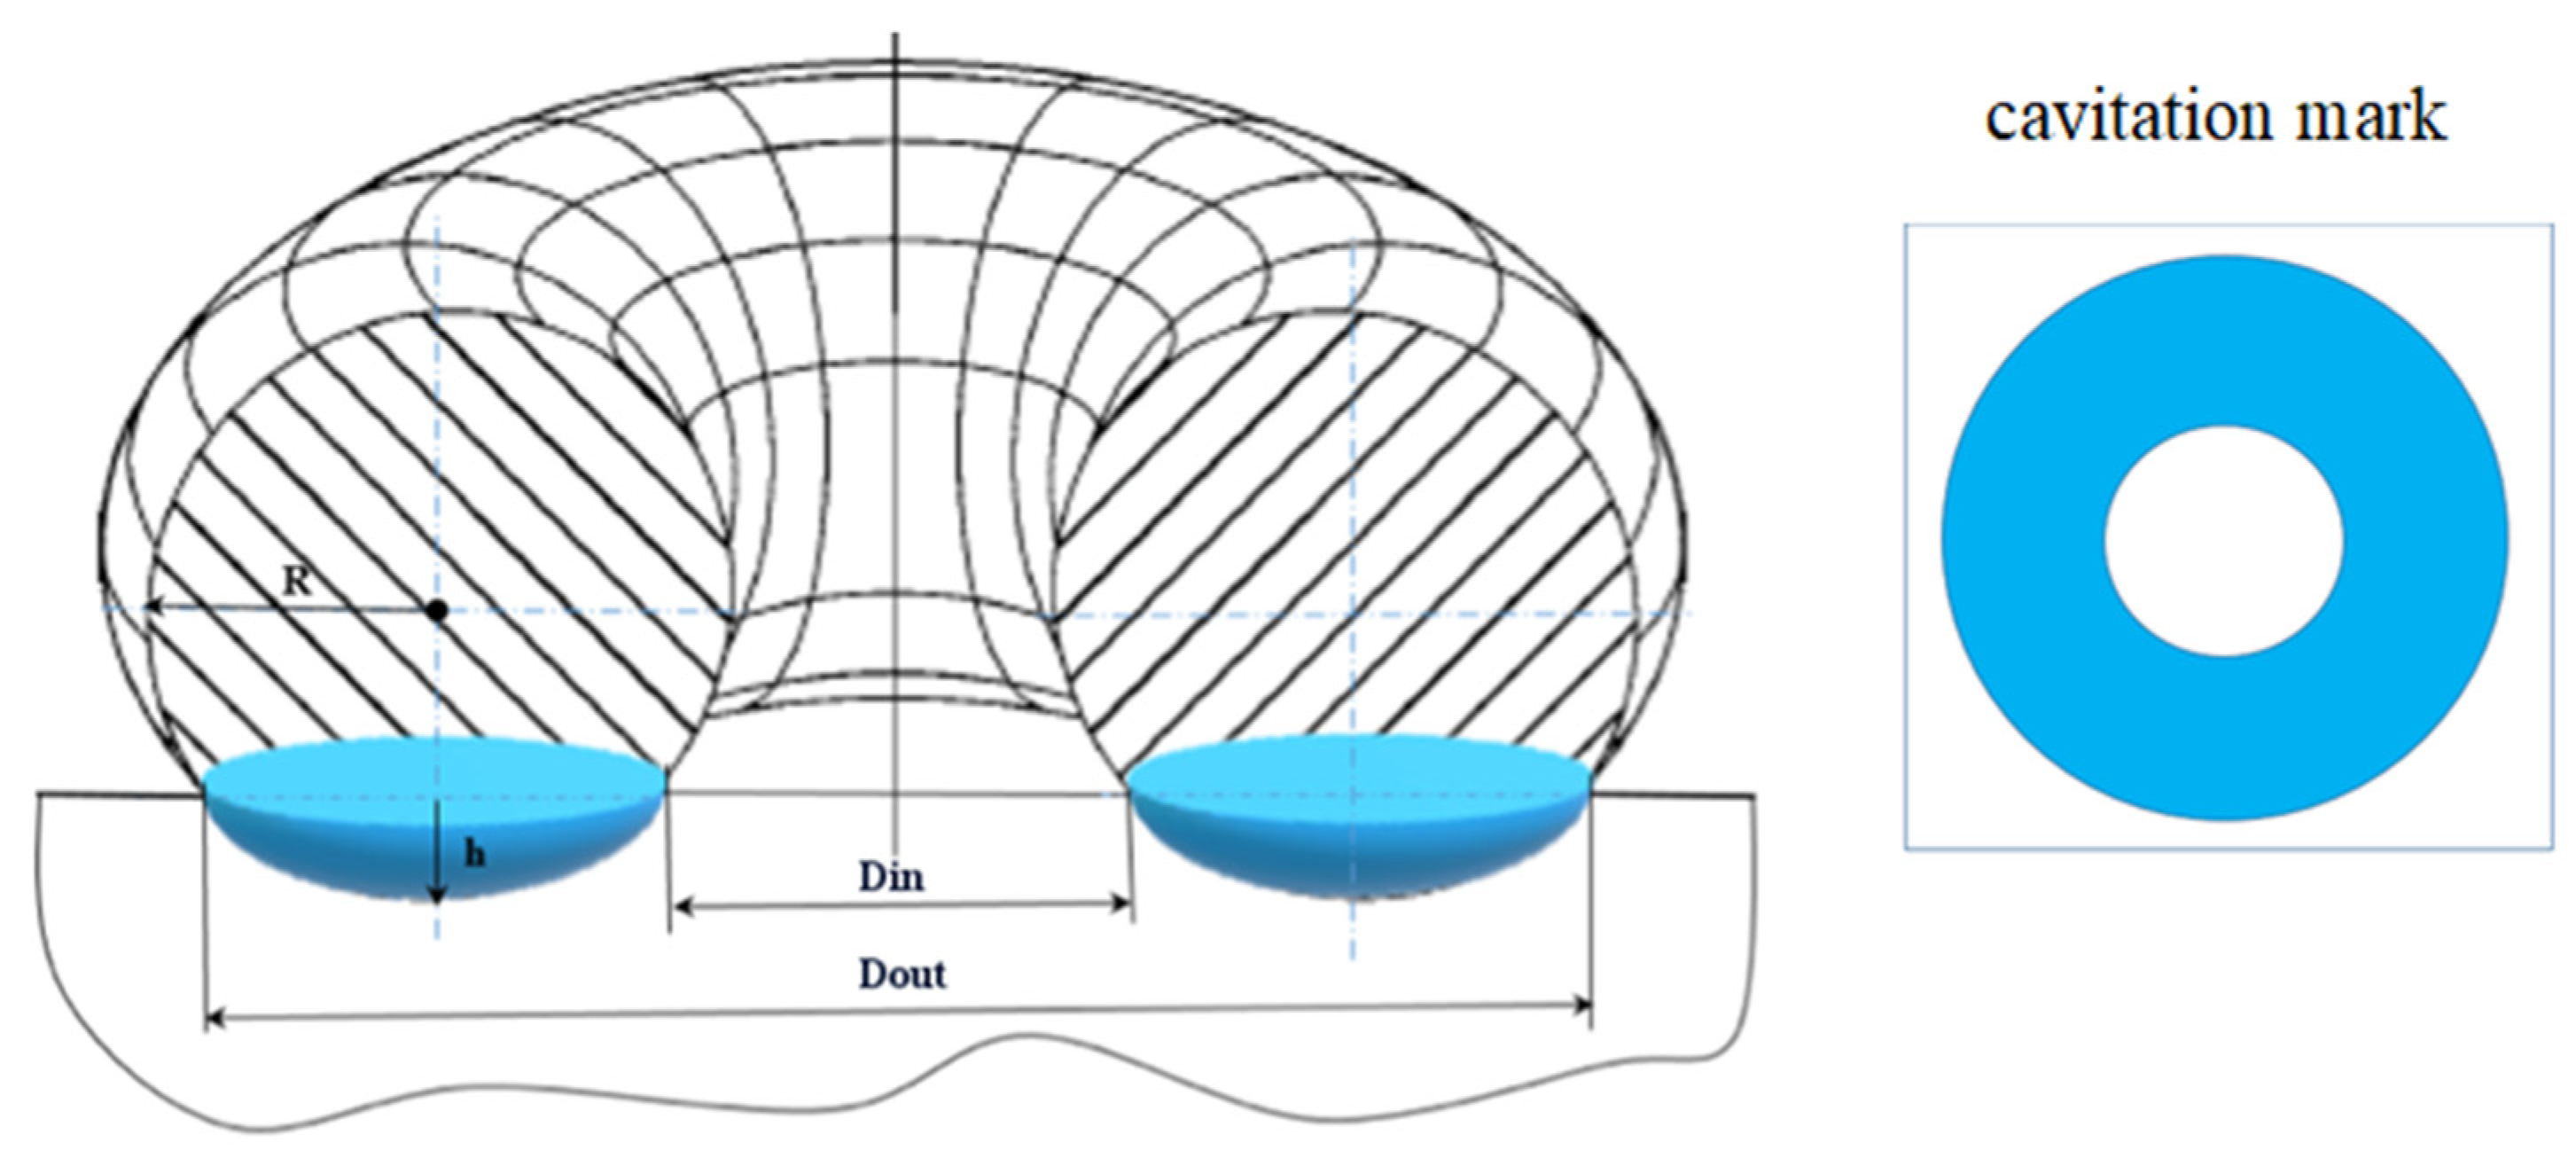
In the case of an annular cavitation mark, which is also typical for cavitation jet impact [
40,
47], the volume removal at (
Dout–
Din) ≥
h can be evaluated using the formula for the torus part volume (see
Figure 10):
where
R is radius of circle forming a torus during rotation,
Dout is outer diameter of cavitation mark,
Din is inner diameter of cavitation mark,
h is depth of cavitation mark.
Radius of circle in Formula (4) is calculated by formula:
where
Dout is diameter of cavitation mark,
Din is inner diameter of cavitation mark,
h is depth of cavitation mark.
Discussion of the applicability of Formulas (2) and (4) requires further studies for coatings with partial material delamination in the area of maximum impact, as observed on the coated test samples.
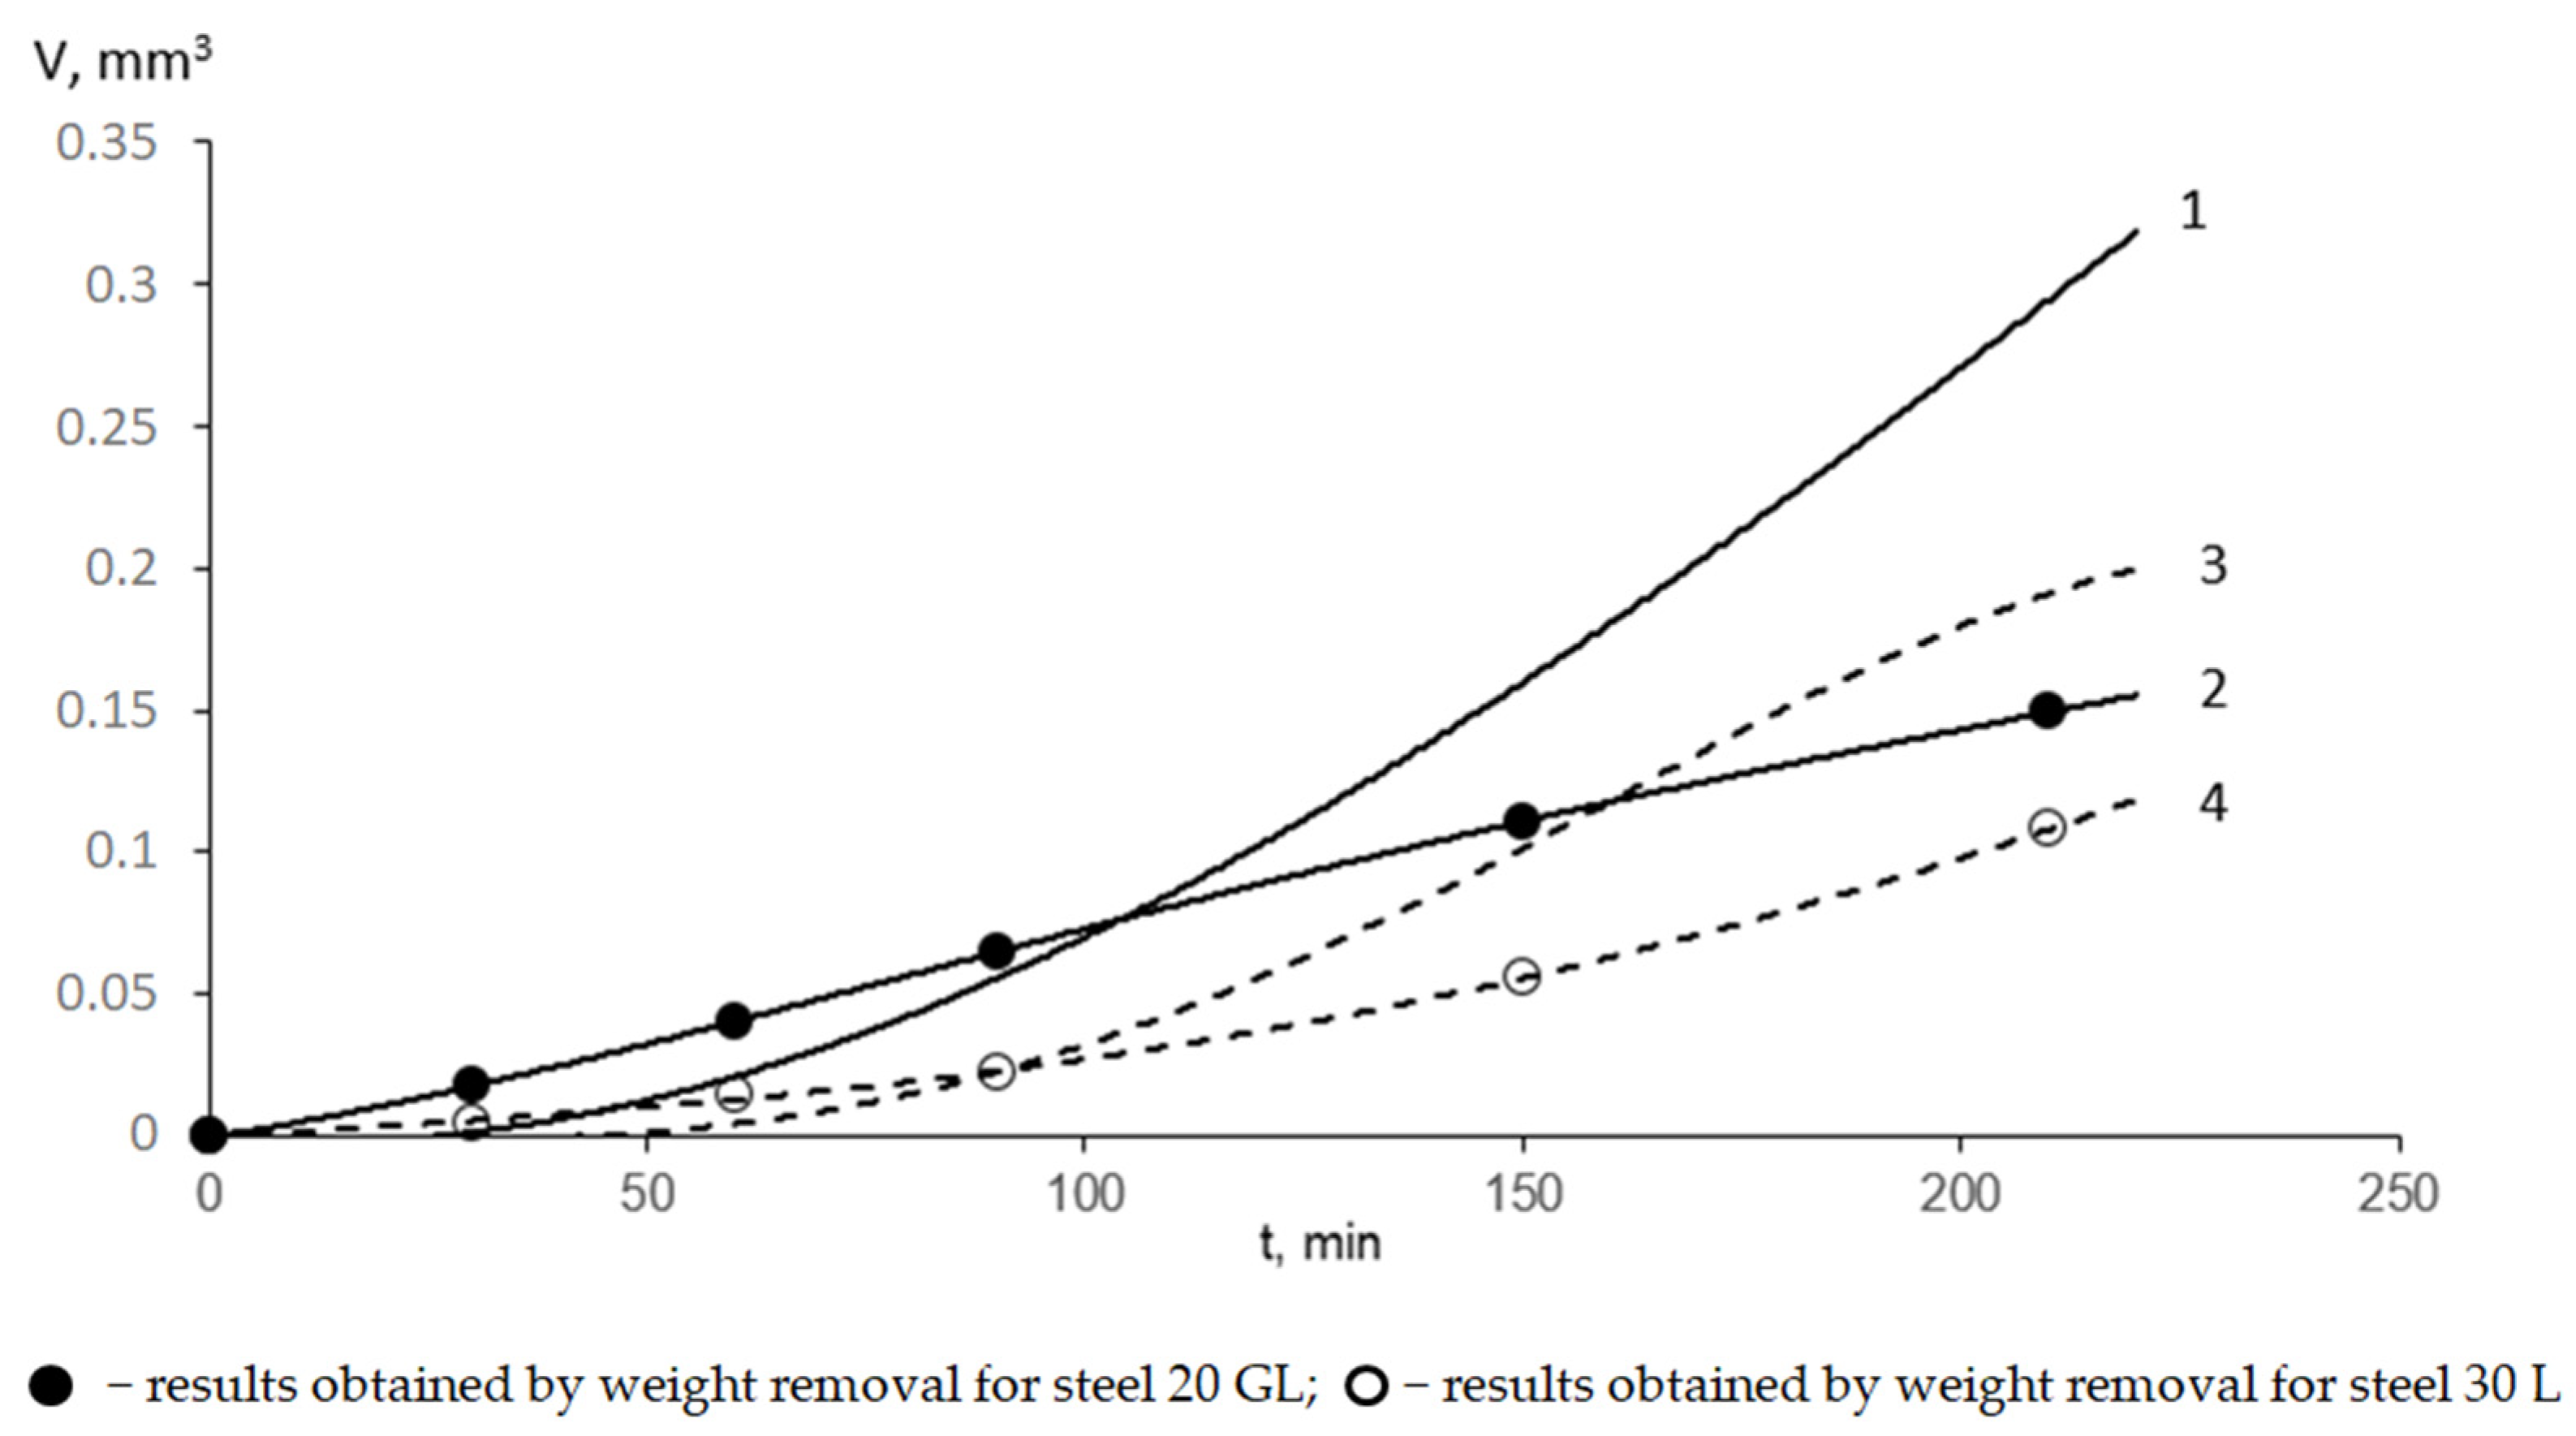
The applicability of the Formula (2) was also assessed for estimating the volume removal of the material carried away in comparison with a well-known formula for determining volume removal using the density of a material and its measured mass removal. For the studied cast steels 20 GL and 30 L, the mass removal was determined in the framework of the experiment (see
Figure 7), and the densities for these steels under normal conditions were chosen to be 7840 kg/m
3 and 7810 kg/m
3, respectively. The results of comparison of calculated (without points) and experimental data (with points) for volume removal are shown in
Figure 11.
Fairly good convergence of the two considered methods for determining the volume removal revealed under cavitation exposure only in the incubation period and during the period with the maximum wear rate until 100 min of exposure. In the area with a steady wear rate up 100 min of exposure, a significant discrepancy was recorded in the data obtained on the volume removal, obtained by processing the profile of their surface (curves 1, 3) and determined by the weight removal (curves 2, 4). This circumstance, apparently, is caused by the fact that when formula (2) is used, it does not take into account the significantly changed relief of the damaged surface, as a result of which the obtained volume loss value is overestimated (see
Figure 12), what can be the reserve coefficient when calculating the cavitation resistance of materials and methods of their protection according to the proposed formula.
Author Contributions
Conceptualization, A.M., O.Z. and A.T.; methodology, O.Z.; experiment, A.M. and A.T.; validation, M.D. and A.M.; formal analysis, O.Z. and M.D.; investigation, A.M.; data curation, O.Z. and A.M.; writing—original draft preparation, O.Z., M.D. and A.M.; writing—review and editing, A.T.; visualization, M.D. and A.M.; supervision, S.G.; project administration, A.M. and O.Z.; funding acquisition, S.G., O.Z. and A.M. All authors have read and agreed to the published version of the manuscript.
Funding
The study was conducted in the framework of a proactive research on “Study to improve the thermal-hydraulic properties and wear resistance of functional surfaces of power equipment”.
Institutional Review Board Statement
Not applicable.
Informed Consent Statement
Not applicable.
Data Availability Statement
Not applicable.
Conflicts of Interest
The authors declare no conflict of interest.
References
- Pris, C. Erosion: English Translation, 1st ed.; Mir: Moscow, Russia, 1982; pp. 100–150. [Google Scholar]
- Pylaev, N.I.; Edel, J.U. Cavitation in Water Turbines, 1st ed.; Mashinostroenie: Saint Petersburgh, Russia, 1974; pp. 84–95. [Google Scholar]
- Brijkishore; Khare, R.; Prasad, V. Prediction of cavitation and its mitigation techniques in hydraulic turbines—A review. Ocean Eng. 2021, 221, 108512. [Google Scholar] [CrossRef]
- Rodionov, V.P.; Ukolov, A.I. The laws of cavitation erosion of construction materials. Her. Dagestan State Tech. Univ. Tech. Sci. 2017, 44, 39–47. [Google Scholar] [CrossRef] [Green Version]
- Tarasov, V.N. Physics of cavitation damage. Electron. J. Tech. Acoust. 2015, 3. Available online: https://ejta.org/en/tarasov1 (accessed on 16 December 2022).
- Rao, N.S.G.; Thiruvengadam, A. Prediction of cavitation damage. Trans. Am. Soc. Civ. Eng. 1962, 127, 309–334. [Google Scholar] [CrossRef]
- Thiruvengadam, A. A Unified theory of cavitation damage. J. Fluids Eng. 1963, 85, 365–373. [Google Scholar] [CrossRef]
- Tichler, J.W.; Elsen, J.B.v.d.; Gee, A.W.J.d. Resistance against cavitation erosion of 14 chromium steels. J. Tribol. 1970, 92, 220–226. [Google Scholar] [CrossRef]
- Hattori, S.; Ishikura, R. Revision of cavitation erosion database and analysis of stainless steel data. Wear 2010, 268, 109–116. [Google Scholar] [CrossRef]
- Karimi, W.R.L. Phenomenological model for cavitation erosion rate computation. Mater. Sci. Eng. 1987, 95, 1–14. [Google Scholar] [CrossRef]
- Berchiche, N.; Franc, J.P.; Michel, J.M. A cavitation erosion model for ductile materials. J. Fluids Eng. 2002, 124, 601–606. [Google Scholar] [CrossRef] [Green Version]
- Hattori, S.; Maeda, K. Logistic curve model of cavitation erosion progress in metallic materials. Wear 2010, 268, 855–862. [Google Scholar] [CrossRef]
- Plesset, M.S.; Ellis, A.T. On the mechanism of cavitation damage. Trans. ASME 1955, 77, 1055–1064. [Google Scholar] [CrossRef]
- Jahangir, S.; Ghahramani, E.; Neuhauser, M.; Bourgeois, S.; Bensow, R.E.; Poelma, C. Experimental investigation of cavitation-induced erosion around a surface-mounted bluff body. Wear 2021, 480–481, 203917. [Google Scholar] [CrossRef]
- Shi, Y.; Luo, K.; Chen, X.; Li, D.; Jia, L. A new cavitation model considering inter-bubble action. Int. J. Nav. Arch. Ocean Eng. 2021, 13, 566–574. [Google Scholar] [CrossRef]
- Sagar, H.J.; Moctar, O.e. Dynamics of a cavitation bubble near a solid surface and the induced damage. J. Fluids Struct. 2020, 92, 102799. [Google Scholar] [CrossRef]
- Xu, W.-L.; Li, J.-B.; Luo, J.; Zhai, Y.-W. Effect of a single air bubble on the collapse direction and collapse noise of a cavitation bubble. Exp. Therm. Fluid Sci. 2021, 120, 110218. [Google Scholar] [CrossRef]
- Krella, A.; Tekumalla, S.; Gupta, M. Influence of micro Ti particles on resistance to cavitation erosion of Mg-xTi composites. Mech. Mater. 2021, 154, 103705. [Google Scholar] [CrossRef]
- Peng, C.; Tian, S.; Li, G.; Wei, M. Enhancement of cavitation intensity and erosion ability of submerged cavitation jet by adding micro-particles. Ocean Eng. 2020, 209, 107516. [Google Scholar] [CrossRef]
- Vuksanović, M.M.; Gajić-Kvaščev, M.; Husović, T.V.; Heinemann, R.J. Advanced damage resistance monitoring procedure on the composite materials’ surface-exposed to cavitation testing. Wear 2021, 474–475, 203877. [Google Scholar] [CrossRef]
- Santos, L.L.; Cardoso, R.P.; Brunatto, S.F. Behavior of the reversed austenite in CA-6NM martensitic stainless steel under cavitation. Wear 2020, 454–455, 203322. [Google Scholar] [CrossRef]
- Khvatov, B.N. Influence of surface layer condition on cavitation erosion kinetics of water turbine steel. Vestnik TSTU 2002, 8, 507–512. [Google Scholar]
- Usta, O.; Koksal, C.S.; Korkut, E. A Study on Cavitation Erosion Resistance of Marine Propeller Materials, Using a Water Jet Test Rig. In Proceedings of the Colloquium Series 3rd International Meeting—Progress in Propeller Cavitation and Its Consequences: Experimental and Computational Methods for Predictions, Istanbul, Turkey, 15–16 November 2018; pp. 1–10. [Google Scholar]
- Linderov, M.L.; Merson, D.L. Effect of cavitation on surface degradation of structural steels. Vector Nauki TSU. 2010, 3, 43–45. [Google Scholar]
- Shi, Z.; Wang, J.; Wang, Z.; Qiao, Y.; Xiong, T.; Zheng, Y. Cavitation Erosion and Jet Impingement Erosion Behavior of the NiTi Coating Produced by Air Plasma Spraying. Coatings 2018, 8, 346. [Google Scholar] [CrossRef] [Green Version]
- Krella, A.K. Cavitation erosion of monolayer PVD coatings—An influence of deposition technique on the degradation process. Wear 2021, 478–479, 203762. [Google Scholar] [CrossRef]
- Petrov, A.I.; Skobelev, M.M.; Khanychev, A.G. Study of comparative resistance to cavitational erosion of materials samples and coatings in the hydraulic machine flow sections. Her. Bauman Mosc. = State Tech. University. Ser. Mech. Eng. 2015, 2, 128–137. [Google Scholar]
- Zubrilov, S.P.; Rastrigin, N.V. Studying the cavitation process and the possibility of reducing erosive wear. Vestn. Gos. Univ. Morskogo I Rechn. Flot. Im. Admirala SO Makarova 2019, 11, 705–717. [Google Scholar] [CrossRef] [Green Version]
- Thiruvengadam, A.; Waring, S. Mechanical properties of metals and their cavitation-damage resistance. J. Ship Res. 1966, 10, 1–9. [Google Scholar] [CrossRef]
- Steller, J.; Krella, A.; Koronowicz, J.; Janicki, W. Towards quantitative assessment of material resistance to cavitation erosion. Wear 2005, 258, 604–613. [Google Scholar] [CrossRef]
- Sreedhar, B.K.; Albert, S.K.; Pandit, A.B. Cavitation damage: Theory and measurements—A review. Wear 2017, 372–373, 177–196. [Google Scholar] [CrossRef]
- Cai, T.; Pan, Y.; Ma, F. Effects of nozzle lip geometry on the cavitation erosion characteristics of self-excited cavitating waterjet. Exp. Therm. Fluid Sci. 2020, 117, 110137. [Google Scholar] [CrossRef]
- Hong, S.; Wu, Y.; Wu, J.; Zheng, Y.; Zhang, Y.; Cheng, J.; Li, J.; Lin, J. Effect of flow velocity on cavitation erosion behaviour of HVOF sprayed WC10Ni and WC-20Cr3C2–7Ni coatings. Int. J. Refract. Met. Hard Mater. 2020, 92, 105330. [Google Scholar] [CrossRef]
- Schreiner, F.; Hanke, S.; Skoda, R. Assessment of flow aggressiveness and erosion damage topography for different gap widths in ultrasonic cavitation testing. Wear 2021, 484–485, 203989. [Google Scholar] [CrossRef]
- Fujisawa, N.; Horiuchi, T.; Fujisawa, K.; Yamagata, T. Experimental observation of the erosion pattern, pits, and shockwave formation in a cavitating jet. Wear 2019, 418–419, 265–272. [Google Scholar] [CrossRef]
- Bansal, A.; Singh, J.; Singh, H.; Goyal, D.K. Influence of thickness of hydrophobic polytetrafluoroethylene (PTFE) coatings on cavitation erosion of hydro-machinery steel SS410. Wear 2021, 477, 203886. [Google Scholar] [CrossRef]
- Teran, L.A.; Laín, S.; Rodríguez, S.A. Energy effect modelling of cavitation and hard particle erosion: Implementation and validation. Wear 2021, 478–479, 203901. [Google Scholar] [CrossRef]
- Pandey, S.; Bansal, A.; Omer, A.; Singla, A.K.; Goyal, D.K.; Singh, J.; Gupta, M.K. Effect of fuel pressure, feed rate, and spray distance on cavitation erosion of Rodojet sprayed Al2O3+50%TiO2 coated AISI410 steel. Surf. Coat. Technol. 2021, 410, 126961. [Google Scholar] [CrossRef]
- Kang, C.; Liu, H.; Soyama, H. Estimation of aggressive intensity of a cavitating jet with multiple experimental methods. Wear 2018, 394–395, 176–186. [Google Scholar] [CrossRef]
- Pan, Y.; Ma, F.; Liu, B.; Cai, T. Cavitation intensity and erosion pattern of a self-excited cavitating jet. J. Mater. Process. Technol. 2020, 282, 116668. [Google Scholar] [CrossRef]
- Liu, Y.; Wu, Q.; Huang, B.; Zhang, H.; Liang, W.; Wang, G. Decomposition of unsteady sheet/cloud cavitation dynamics in fluid-structure interaction via POD and DMD methods. Int. J. Multiph. Flow 2021, 142, 103690. [Google Scholar] [CrossRef]
- Fujisawa, N.; Fujita, Y.; Yanagisawa, K.; Fujisawa, K.; Yamagata, T. Simultaneous observation of cavitation collapse and shock wave formation in cavitating jet. Exp. Therm. Fluid Sci. 2018, 94, 159–167. [Google Scholar] [CrossRef]
- ASTM G134-17; Standard Test Method for Erosion of Solid Materials by a Cavitating Liquid Jet. ASTM INTERNATIANAL: West Conshohocken, PA, USA, 2017.
- Hutli, E.; Nedeljkovic, M.S.; Radovic, N.A.; Bonyár, A. The relation between the high speed submerged cavitating jet behaviour and the cavitation erosion process. Int. J. Multiph. Flow 2016, 83, 27–38. [Google Scholar] [CrossRef] [Green Version]
- Sasaki, H.; Takeo, F.; Soyama, H. Cavitation erosion resistance of the titanium alloy Ti–6Al–4V manufactured through additive manufacturing with various peening methods. Wear 2020, 462–463, 203518. [Google Scholar] [CrossRef]
- Liu, B.; Ma, F. Erosion behavior of aluminum by an inclined cavitating jet. Wear 2021, 474–475, 203751. [Google Scholar] [CrossRef]
- Hutli, E.; Nedeljkovic, M.; Bonyár, A. Cavitating flow characteristics, cavity potential and kinetic energy, void fraction and geometrical parameters—Analytical and theoretical study validated by experimental investigations. Int. J. Heat Mass Transf. 2018, 117, 873–886. [Google Scholar] [CrossRef]
Figure 1.
Diagram of prototype cavitation jet test rig.
Figure 2.
Appearance and sketch of cavitation jet test rig.
Figure 3.
Diagram of sample positioning system in chamber of cavitation jet test rig.
Figure 4.
Microstructure of uncoated aluminum sample.
Figure 5.
Patterns of surface changes in cavitation mark area (a), surface profiles (b), and cavitation mark depth h and cavitation mark diameter Dout (c) determined by them during cavitation tests of coated aluminum samples.
Figure 6.
Microstructure of cast steels 20 GL (a) and 30 L (b).
Figure 7.
Kinetic curves of cavitation wear of steel 20 GL (1) and 30 L (2) samples.
Figure 8.
Patterns of surface changes in cavitation mark area (a), surface profiles (b), diameter of cavitation mark Dout (c), depth of cavitation mark h (d), volume removal V (e), and removal rate E (f) determined by them at cavitation test of steel 20 GL (1) and 30 L (2) samples (nozzle diameter 0.85 mm, distance to nozzle 15 mm, inlet pressure 18 MPa, outlet pressure 0.1 MPa, cavitation number 0.0055, temperature 50 °C).
Figure 9.
Schematic layout of diameter Dout and depth h of cavitation mark in ball segment shape.
Figure 10.
Schematic layout of diameters Dout and Din and depth h of cavitation mark shaped as a torus segment.
Figure 11.
Patterns of volume removal V determined by calculation using experimentally obtained weight removal (2, 4) and by the formula for a volume removal in the form of a spherical segment using the parameters of the surface profiles (1, 3) for steels 20 GL and 30 L, respectively, during cavitation tests.
Figure 12.
Schematic depiction of the capturing by a spherical segment of the calculated volume removal of material in comparison with the real volume removal of a complex figure bounded by a complex surface profile, calculated using an experimentally determined mass removal.
Table 1.
Technical characteristics of the cavitation jet test rig.
| No. | Parameter | Value |
|---|
| 1 | Maximum pressure at nozzle exit (Pin) | 20 MPa |
| 2 | Distance from nozzle to sample surface (H) | 5–55 mm |
| 3 | Pressure in test rig chamber (Pout) | 0.1 MPa |
| 4 | Number of samples engaged in experiment | 1 |
| 5 | Nozzle diameter (dnozzle) | 0.3–2 mm |
Table 2.
Chemical composition of aluminum.
| Fe, % | Si, % | Mn, % | Ti, % | Al, % | Cu, % | Be, % | Mg, % | Zn, % |
|---|
| ≤0.3 | ≤0.2 | 0.4–0.9 | ≤0.1 | 91.8–94.1 | 3.8–4.3 | 0.0002–0.005 | 1.7–2.3 | ≤0.1 |
Table 3.
Settings of SEM microscope.
| WD | SEM HV | View Field | Det |
|---|
| 9–10 mm | 10.00 kV | 500 μm | BSE |
Table 4.
Conditions of cavitation tests on coated aluminum samples.
| Pressure Pin, MPa | Nozzle Diameter dnozzle, mm |
|---|
| at H = 5 mm | at H = 15 mm |
|---|
| 10 | 0.35 | 0.35 |
| 11.5 | 0.35 | 0.35 |
| 13 | 0.35 | 0.35 |
| 15 | 0.85 | 0.85 |
| 16.5 | 0.85 | 0.85 |
| 18 | 0.85 | 0.85 |
Table 5.
Chemical composition and hardness of steels 20 GL and 30 L.
| Steel | C, % | Si, % | Mn, % | S, % | P, % | Fe, % | Hardness
HB 0.1, MPa |
|---|
| 20 GL | 0.15–0.25 | 0.2–0.4 | 1.2–1.6 | < 0.04 | < 0.04 | other | 165 |
| 30 L | 0.27–0.35 | 0.20–0.52 | 0.4–0.9 | < 0.045 | < 0.04 | other | 174 |
| Disclaimer/Publisher’s Note: The statements, opinions and data contained in all publications are solely those of the individual author(s) and contributor(s) and not of MDPI and/or the editor(s). MDPI and/or the editor(s) disclaim responsibility for any injury to people or property resulting from any ideas, methods, instructions or products referred to in the content. |
© 2022 by the authors. Licensee MDPI, Basel, Switzerland. This article is an open access article distributed under the terms and conditions of the Creative Commons Attribution (CC BY) license (https://creativecommons.org/licenses/by/4.0/).


