Article

Effect of σ-Phase on the Strength, Stress Relaxation Behavior, and Corrosion Resistance of an Ultrafine-Grained Austenitic Steel AISI 321

by
Vladimir I. Kopylov
1,
Aleksey V. Nokhrin
1,*,
Natalia A. Kozlova
1,
Mikhail K. Chegurov
1,
Mikhail Yu. Gryaznov
1,
Sergey V. Shotin
1,
Nikolay V. Melekhin
1,
Nataliya Yu. Tabachkova
2,3,
Ksenia E. Smetanina
1 and
Vladimir N. Chuvil’deev
1
1
Materials Science Department, Physical and Technical Research Institute, Lobachevsky State University of Nizhny Novgorod, 603022 Nizhny Novgorod, Russia
2
Materials Science and Metallurgy Collective Use Center, National University of Science and Technology “MISIS”, 119991 Moscow, Russia
3
FIANIT Laboratory, Laser Materials and Technology Research Center, A.M. Prokhorov General Physics Institute, Russian Academy of Sciences, 119991 Moscow, Russia
*
Author to whom correspondence should be addressed.
Metals 2023, 13(1), 45; https://doi.org/10.3390/met13010045
Submission received: 30 November 2022 / Revised: 16 December 2022 / Accepted: 19 December 2022 / Published: 24 December 2022
(This article belongs to the Special Issue Environmentally-Assisted Degradation of Metals and Alloys)

Abstract

:
This paper reported the results of research into the effect of Equal Channel Angular Pressing (ECAP) temperature and 1-h annealing temperature on mechanical properties, stress-relaxation resistance, and corrosion resistance of austenitic steel AISI 321L with strongly elongated thin δ-ferrite particles in its microstructure. The formation of α′-martensite and fragmentation of austenite grains takes place during ECAP. Ultrafine-grained (UFG) steels demonstrate increased strength. However, we observed a reduced Hall–Petch coefficient as compared with coarse-grained (CG) steels due to the fragmentation of δ-ferrite particles. UFG steel specimens were found to have 2–3 times higher stress-relaxation resistance as compared with CG steels. For the first time, the high stress-relaxation resistance of UFG steels was shown to stem from a internal stress-relaxation mechanism, i.e., the interaction of lattice dislocations with non-equilibrium grain boundaries. Short-time 1-h annealing of UFG steel specimens at 600–800 °C was found to result in the nucleation of σ-phase nanoparticles. These nanoparticles affect the grain boundary migration, raise strength, and stress-relaxation resistance of steel but reduce the corrosion resistance of UFG steel. Lower corrosion resistance of UFG steel was shown to be related to the formation of α′-martensite during ECAP and the nucleation of σ-phase particles during annealing.

1. Introduction

Coarse-grained (CG) austenitic stainless steels of Fe–Cr–Ni composition are used widely in the nuclear power engineering and petrochemical industries. Austenitic steels are used to produce critical products intended for operation in corrosive environments [1,2,3]. High corrosion resistance of austenitic steels ensures their long-term operation in aggressive environments, at elevated temperatures, and sometimes under exposure to radiation and hydrogen embrittlement [1,2,4]. CG austenitic steels are characterized by low strength and low stress-relaxation resistance (SRR), which limit their applications since products made from them fail to function well under high stress and strain in the long-term. Under continuous external stress or plastic deformation, martensite nucleation may begin in metastable austenitic steels [1,2,5,6,7,8,9]. The martensite content in austenitic steels increases along with an increase in strain [1,3,5] and decreases parallel to an increase in strain rates [6,7,9]. Martensite is supposed to negatively affect the corrosion resistance of austenitic steels [1,2,10,11,12,13]. The presence of δ-ferrite particles also reduces the corrosion resistance of austenitic steels, especially their resistance to intergranular corrosion (IGC) [14,15,16], and affects the susceptibility of austenitic steels to stress corrosion cracking [17,18,19,20,21], fatigue strength [1,22], and creep resistance [1,23] nonuniformly.
Combining high strength and corrosion resistance of austenitic steels is a crucial issue. Chromium carbides (Me23C6) and σ-phase particles, which cause IGC in austenitic steels, are often formed during annealing [1,4,24,25,26]. This happens because of deviations of the chemical composition of austenitic steels from optimal concentrations of carbon, chromium, and titanium [1]. Therefore, it is ineffective to increase strength through annealing that leads to nucleation of chromium carbide particles along austenite grain boundaries (GBs) [1,24,26]. It is noteworthy that particles causing IGC can occur during high-temperature annealing of CG austenitic steels containing large δ-ferrite particles. As shown in [1,27,28,29], the annealing of stainless steel can lead to δ-ferrite transformation into metal carbide particles (Me23C6, Fe3C) and σ-phase particles. Some papers report possible strain aging during stretching of austenitic steel specimens [30,31,32] as well as strain-induced formation of σ-phase particles [1,33,34,35,36]. These factors negatively affect the corrosion resistance of CG austenitic steels [1,37,38] but are conducive to higher strength.
Deformation at room or negative temperatures followed by annealing is a conventional method of improving the mechanical properties of austenitic stainless steels [1,3,5,8,9,11,12,30,39,40]. In the course of cold deformation of metastable austenitic steels, fractioning of austenite grains and an essential increase in the volume fraction of martensite (sometimes, over 50%) take place simultaneously [1,5,8,9,10,11,12,13,14,15,16]. During annealing, martensite transforms back into austenite [1,3,5,7,8,9,39,40,41], and thus a fine-grained austenite microstructure with increased strength according to the Hall–Petch relation is obtained [1,5,8,12,42,43,44]. Some fine-grained austenitic steels obtained by this combined method demonstrate a significant increase in strength and ductility at room temperature [1,5,7,12,39,41,44,45,46,47,48,49,50,51,52].
We estimate that the further improvement of mechanical properties, especially the SRR of austenitic stainless steels, is associated with the capabilities of Severe Plastic Deformation (SPD). At present, various SPD methods are used to form a UFG microstructure, including Equal Channel Angular Pressing (ECAP), High-Pressure Torsion, Rotary Swaging, extrusion [8,53,54,55,56,57,58,59,60,61] etc. The prospects of these methods are related to finding an optimal range of SPD temperatures that would allow a uniform UFG austenite microstructure without additional thermal processing [8,53,62]. Despite some progress in improving the hardness and strength of steels, it should be noted that cold and warm SPD often leads to strain-induced formation of martensite [54,55,56]. It stands to mention that a possibility to ensure high strain (e > 2–3), in particular without essential changes in the workpiece size is a distinctive feature of SPD methods (ECAP, High-Pressure Torsion, Accumulative Roll Bonding, etc.) [57,58,59,60,61]. Since the martensite content increases along with an increase in strain [1,5,8,54,55,56], SPD methods help to obtain steels with an increased volume fraction of martensite at room temperature. It is interesting to note that ECAP allows for a considerable content of strain-induced martensite [54,55,56]. This is quite unexpected since strain rates in ECAP are much higher than in ordinary rolling [57,58,59,61] while higher strain rates trigger a decrease in the martensite content [6,7,9]. This, in turn, helps to obtain steels with small austenite grain sizes by annealing deformed specimens [56,63]. As a result, it becomes possible to consider some SPD methods as most efficient ways to obtain super strong austenitic steels with extremely small grain sizes. In some cases, it is possible to provide a combination of increased strength and ductility in UFG steels using SPD [63,64,65].
The effect of deformation localization, which is manifested in the form of shear bands, is a specific feature of some SPD methods, including ECAP [59,61]. Nonequilibrium strain distribution inside the material may lead to nonequilibrium heterogeneous distribution of martensite in austenitic steel specimens. The microstructure of a reversed austenite phase was shown to depend on the type and character of martensite distribution [66]. Bimodal distribution of austenite grains allowed the authors in [66] to further enhance the ductility of UFG steel AISI 304L, preserving its high strength. Thus, ECAP can be considered among most efficient methods of forming a heterogeneous microstructure, the capabilities of which are being studied intensively in stainless steels [67].
The corrosion resistance of nanostructured and UFG metastable austenitic steels has been studied thoroughly [10,12,13,68,69,70]. At present, there are many contradictions with regards to corrosion resistance of UFG austenitic steels. Some authors claim that formation of a UFG microstructure does not essentially affect corrosion resistance of austenitic steels [71] or its effect is ambiguous [12,70]. Other authors report that SPD reduces corrosion resistance of metastable austenitic steels [69,72]. There are some reports that UFG austenitic steels have higher corrosion resistance as compared with similar CG steels [11,12,68,73,74,75,76,77,78,79,80]. As shown in [81,82], the corrosion resistance of austenitic steels can be improved by means of SPD despite martensite formation. This is a striking result since martensite is usually expected to reduce the corrosion resistance of austenitic steels [1,2,10,11,12,13]. It was noted that SPD can affect the corrosion resistance of UFG steels due to the impact on parameters of nonmetallic inclusions [69] and as a result of changing chromium concentration along austenite grain boundaries [75] or on steel surface layers [82]. It is worth noting that some papers [54,55] report possible σ-phase nucleation during annealing of UFG steel AISI 321. It may negatively affect the corrosion resistance of UFG austenitic steels. It is therefore relevant to choose optimal regimes of heat-deformation processing of austenitic steels that help to increase their strength without reducing their corrosion resistance.
Ensuring high stress-relaxation resistance (SRR) of austenitic steels is even more challenging. The issue of raising SRR is especially important in order to provide simultaneously high characteristics of fatigue, creep resistance, and stress corrosion cracking resistance in structural materials [83,84,85,86,87,88,89,90]. As shown in [91], the formation of particles along grain boundaries can lead to premature steel cracking due to stress relaxation at elevated temperatures. High SRR determines the capability of a stainless machine-building fastener to provide the necessary level of downforce during long operation times (see [88,89,92], etc.). High SRR along with high strength are expected to increase the downforce of a fastener and keep it during notably long operation times. Plenty of experimental and theoretical works focus on the investigation of SRR mechanisms in CG materials (see, for example, [90,91,92,93,94,95,96,97]). Dislocation glide and creep were shown to be the main stress-relaxation mechanisms in CG materials [95]. With a decrease in grain size, grain rotation and grain boundary sliding (GBS) begin to contribute to stress relaxation at elevated temperatures [95]. It is usually believed that in CG materials, the higher the level of internal stress, the higher the SRR (see, for example [98]). Therefore, strain hardening is a conventional method of increasing SRR. From this perspective, UFG metals and alloys obtained with SPD methods are considered to be promising materials for machine-building high-strength fasteners with increased SSR.
Although the effect of grain size on stress relaxation for some materials was investigated earlier [97,99,100,101,102,103], stress-relaxation mechanisms in UFG metals remain understudied. Literary analysis shows that SPD may lead to SRR increase or decrease [101,104,105,106,107,108]. As shown in [99,100,101,104], a faster and stronger reduction of stress over time was observed in UFG metals. Some authors link this phenomenon to GBS [101,104,107,108] or to interaction of lattice dislocations with GBS [101,105], which may occur during stress-relaxation tests in UFG materials along with accommodative redistribution of lattice dislocations [105,106]. So far, one can conclude that stress relaxation in UFG metals is different as compared with CG metals. As far as we know, stress-relaxation mechanisms in UFG austenitic steels have not been studied to date.
This research aimed to study the effect of SPD and annealing on SRR and resistance to IGC in metastable austenitic steels AISI 321L (steel 18-8). This type of steel has a wide variety of applications in nuclear and power engineering as it is used to produce machine building fasteners operated under simultaneous exposure to elevated temperatures, mechanical loads, and corrosive environments. In particular, low strength and high stress-relaxation rate in austenitic steels challenge assembly and disassembly of products after long-term operation. An increased content of δ-ferrite makes up the focus of this investigation. Whether it is a defect of casting or heat treatment of cast workpieces, it is typical of bulk austenitic steels.

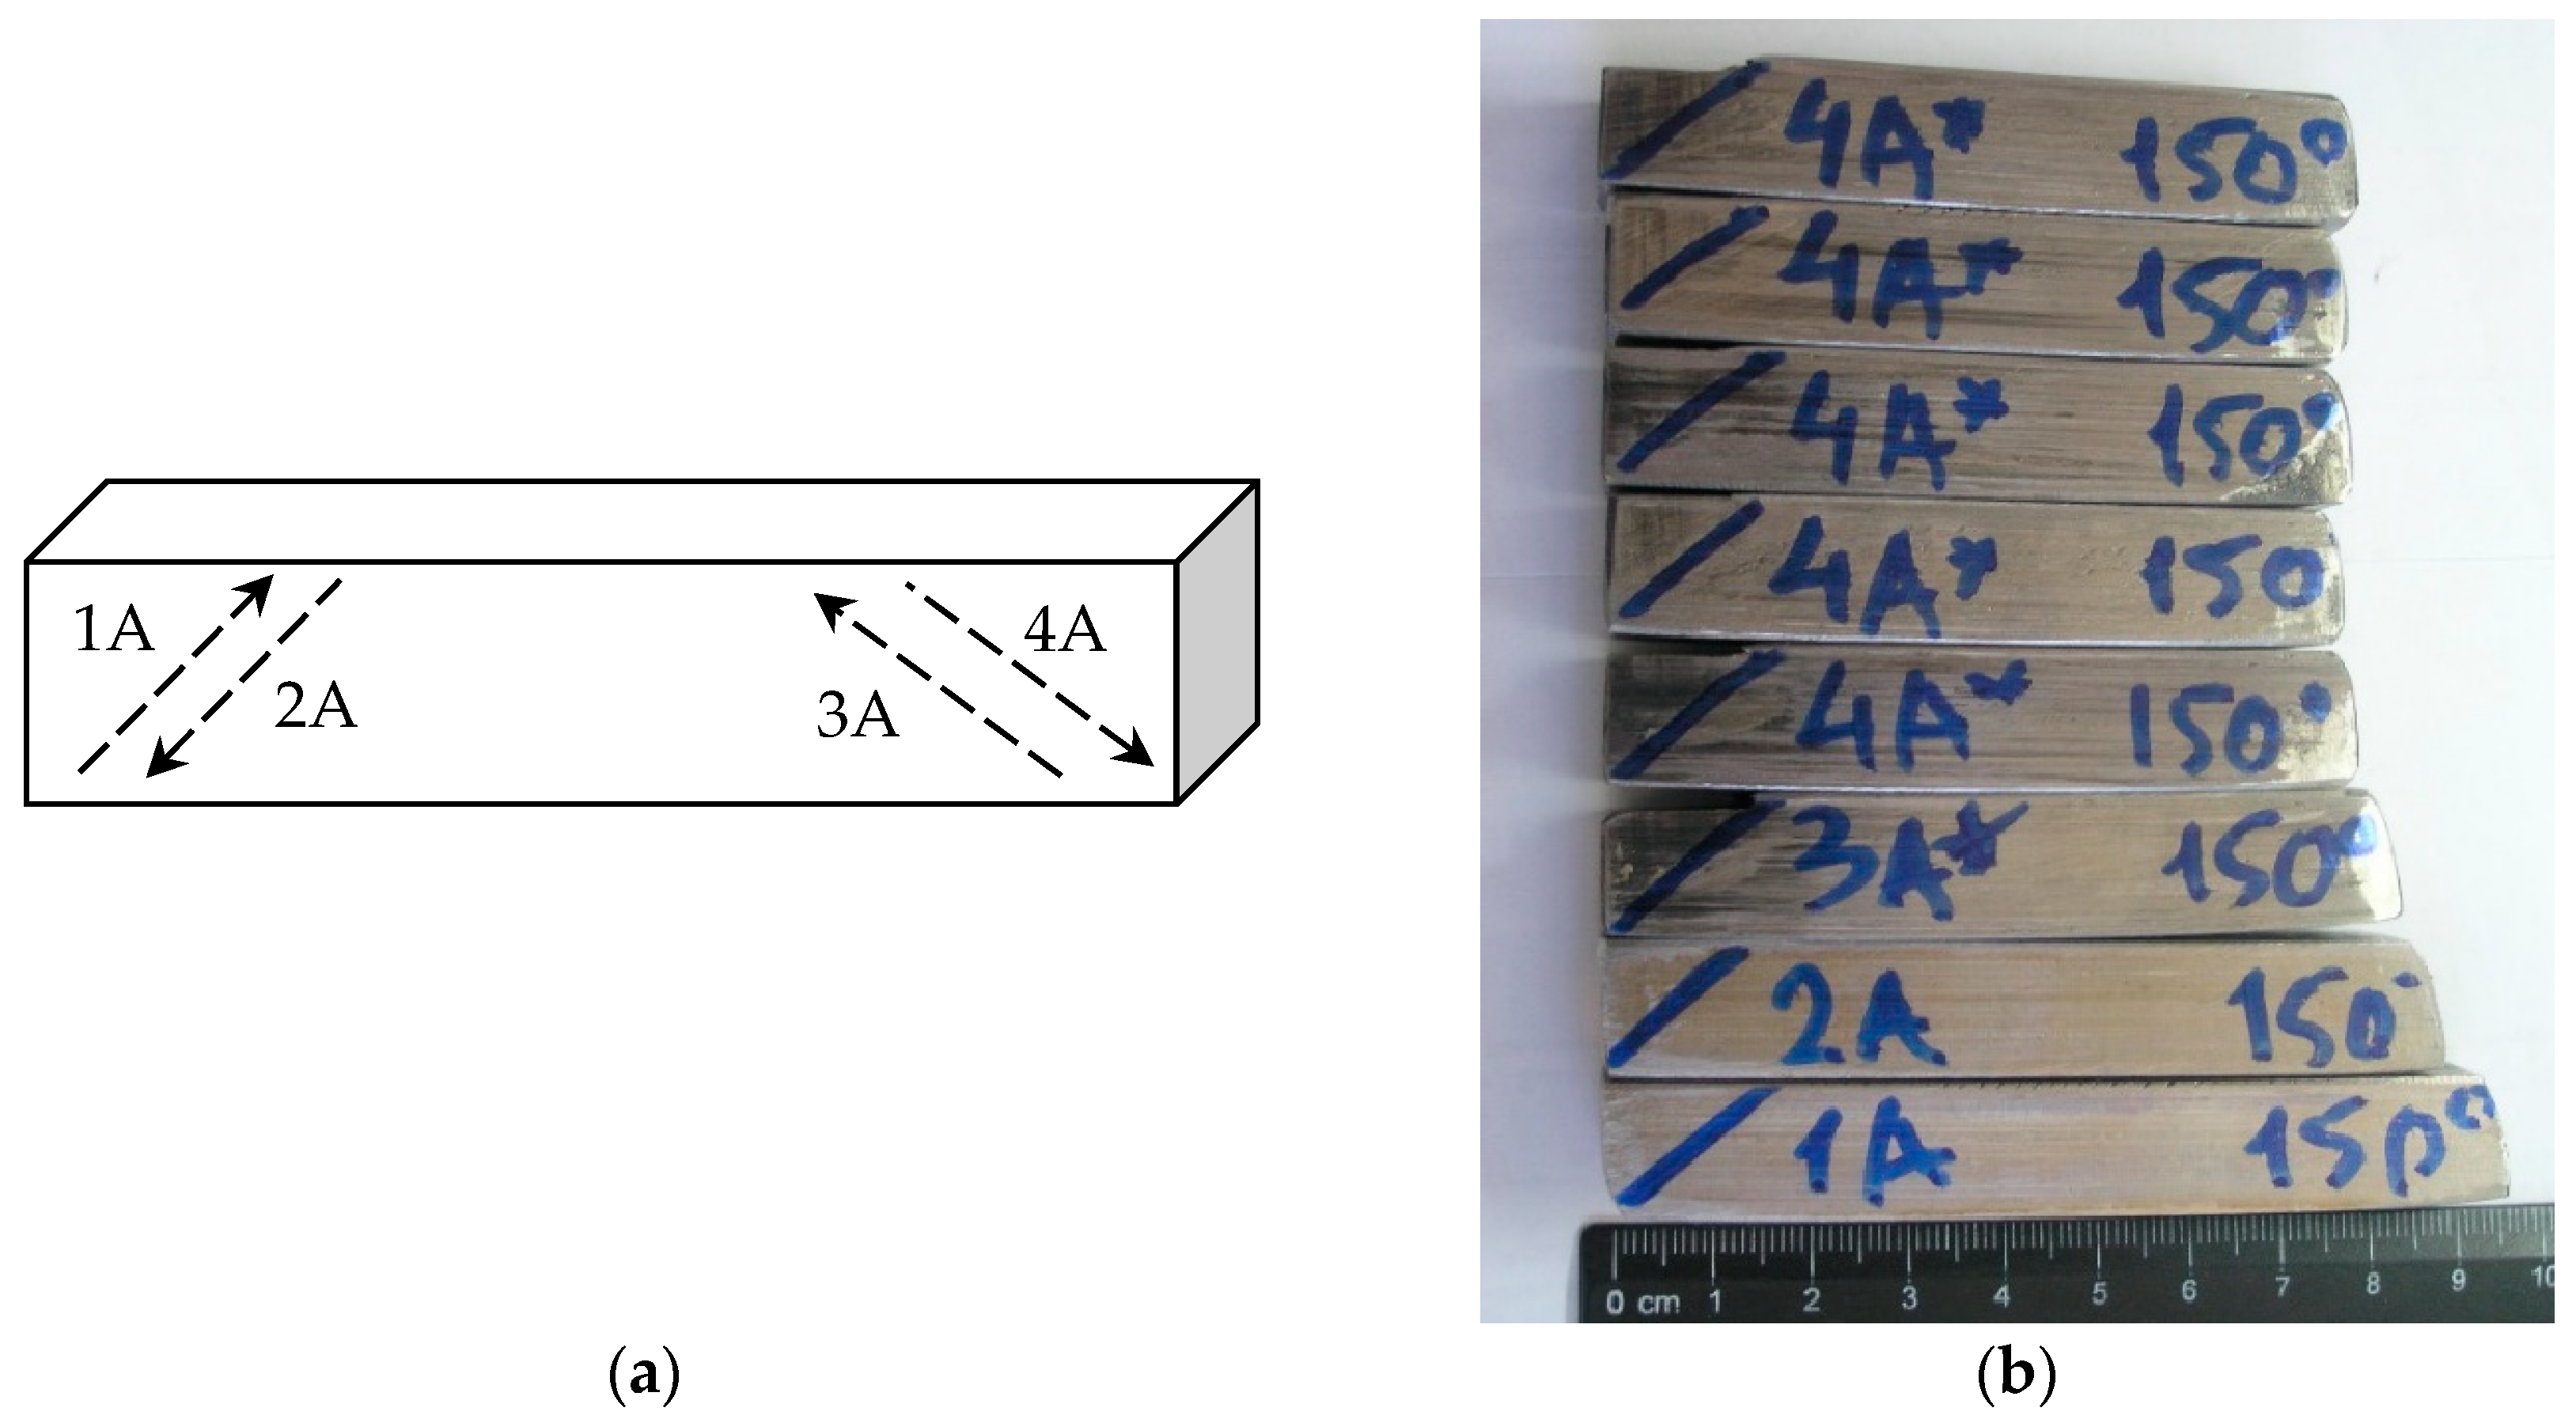
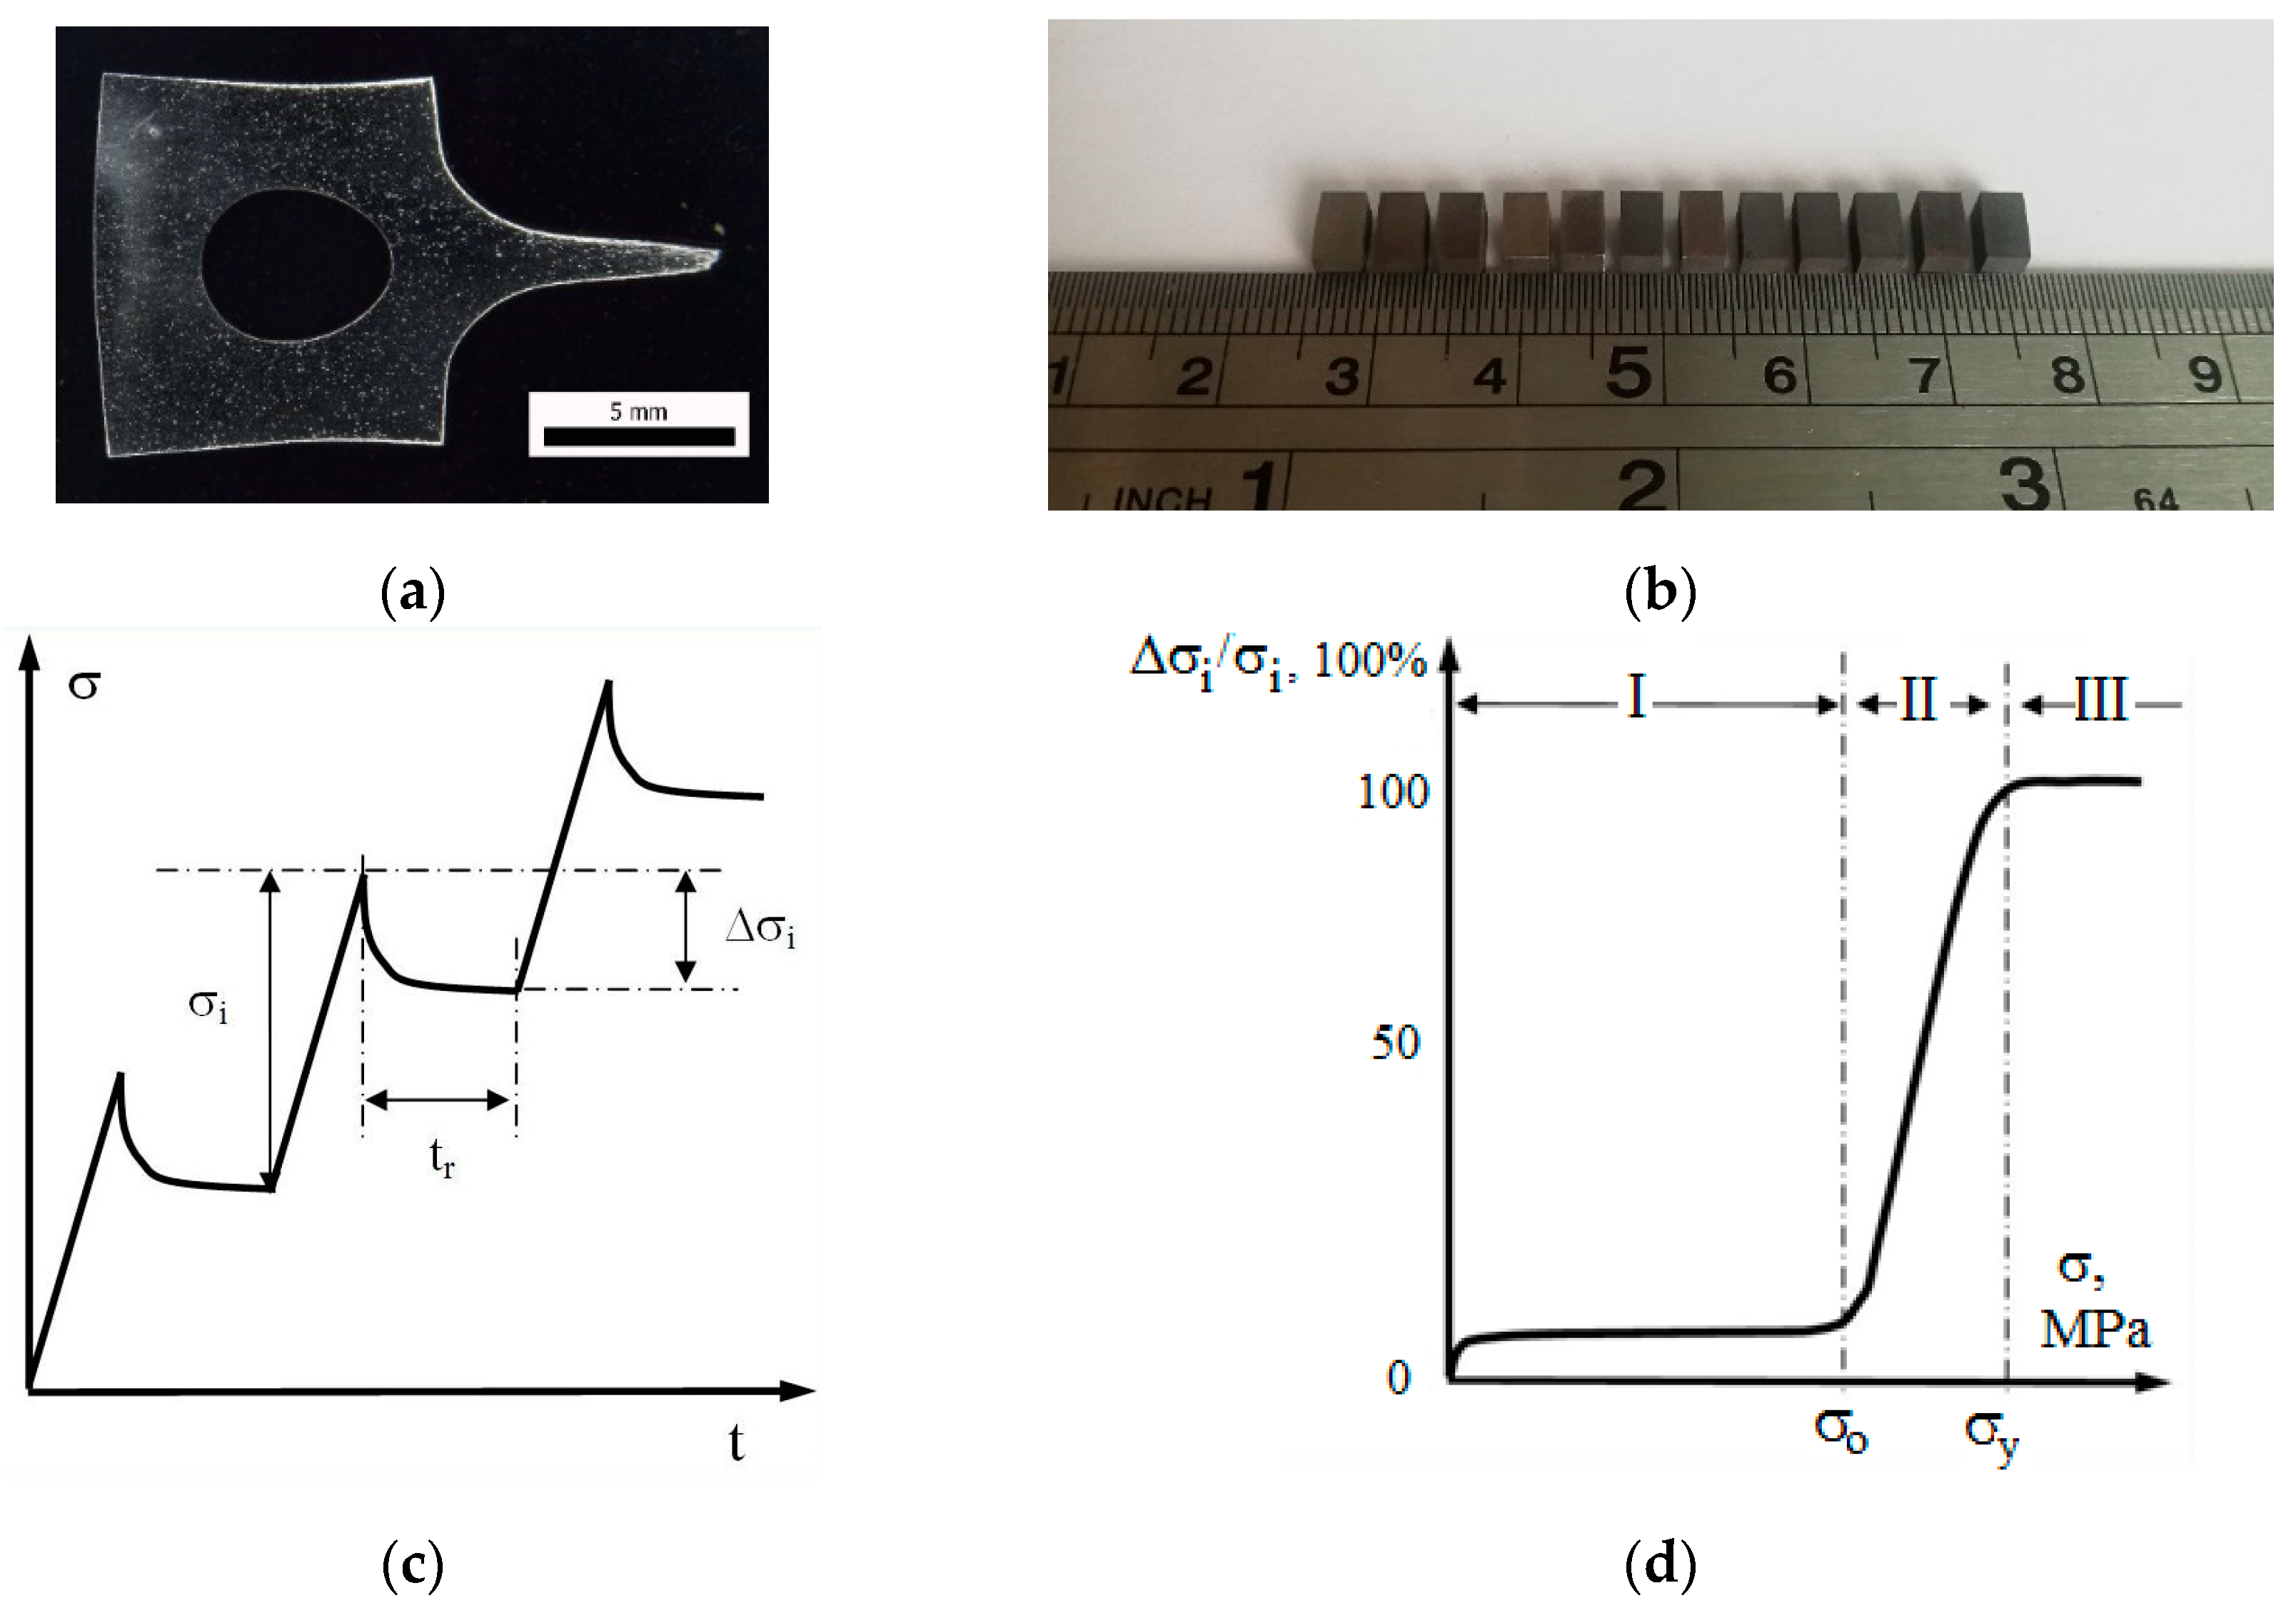
2. Materials and Methods

The Russian commercial metastable austenitic steel AISI 321L (Fe-0.08% C-17.9% Cr-10.6% Ni-0.5% Si-0.1% Ti) was investigated in this study. ECAP was used to form a UFG microstructure in steel. Workpieces of 14 × 14 × (75–85) mm in size were cut out from hot-rolled rods of 20 mm in diameter. Prior to ECAP, the rods were annealed at 1050 °C for 30 min followed by quenching in water. ECAP was performed using a Ficep® HF400L hydraulic press (Ficep® S.P.A., Varese, Italy). The intersection angle of the working channel and the output channel was π/2. The deformation scheme during ECAP is presented in Figure 1a. This scheme is a modification of ECAP A mode [58,59,61]. Figure 1b presents a photograph of steel specimens after ECAP at 150 °C. The ECAP rate was 0.4 mm/s. The ECAP temperatures were 150 °C and 450 °C, the number of pressing cycles (N) varied from one to four (N = 1–4). After every ECAP cycle, the workpiece was cooled down to room temperature (RT), fitted into the working channel, greased, mounted inside the working channel of an ECAP punch, and heated for 15 min before the next ECAP cycle. Graphite grease laced with molybdenum disulfide (MoS2) was used for ECAP.
Steel microstructure were studied using Jeol® JSM-6490 (Jeol Ltd., Tokyo, Japan) and Tescan® Vega™ (Tescan Orsay Holding, a.s., Brno, Czech Republic) scanning electron microscopes (SEMs) and Jeol® JEM-2100F (Jeol Ltd., Tokyo, Japan) transmission electron microscope (TEM). X-ray diffraction (XRD) analysis of steels was carried out using Shimadzu® XRD-7000 X-ray diffractometer (Shimadzu Europa GmbH, Korneuburg, Austria) (CuKα emission, Bragg–Brentano scheme, range of angles 2θ = 30–80°, scan rate of 1°/min). Crystal lattice parameters were determined and mass fractions of phases were calculated using the Rietveld method. Specimens for microstructure investigations were cut out along the workpiece axis.
The microhardness (Hv) of steel specimens was measured with a Duramin® Struers™ 5 microhardness tester (Struers LLC, Cleveland, OH, USA). The error of microhardness measurements was ±50 MPa. Measurements were taken under the load of 2 kg. Flat dogbone-shaped specimens were used for mechanical tests. The working part of specimens had the following dimensions: 2 × 2 × 2 mm (Figure 2a). Tensile tests were carried out using a Tinius Olsen® H25K-S machine (Tinius Olsen Ltd., Surrey, UK) at a strain rate of 3.3 × 10⁻³ s−1 (tensile strain 10−2 mm/s). Based on stress (σ)—strain (ε) curves, ultimate strength (σb) and elongation to failure (δ) were determined. The fractographic analysis after tensile tests was carried out using Jeol® JSM-6490 SEM.
Stress-relaxation tests were performed according to the technique described in Appendix A hereto [108]. Rectangular specimens of 3 × 3 mm in cross-section and of 6 mm in height were made for tests (Figure 2b). A step-wise loading of specimens was performed at the rate of 0.13%/s during td = 0.3 s. Afterwards, these specimens were kept under constant stress (σi) during the given stress-relaxation time (tr = 60 s) (Figure 2c). In the course of stress relaxation, a stress-time curve σi(t) was built and a decrease in stress ∆σi was measured (Figure 2c). Then the next loading step was taken (td = 0.3 s at 0.13%/s). As a result, a dependence of stress relaxation (∆σi) on summary stress (σ) was obtained (Figure 2d). Regions of macroelastic deformation (Stage I), microplastic deformation (Stage II), and macro-deformation (Stage III) are distinguished on the ∆σi(σ) curve. The curve was also used to determine lattice friction stress (macroelasticity stress) (σ0) and yield strength (σy) (Figure 2d).
During welding or quenching of specimens of complex geometry, internal stresses of the first type (macrostresses) are formed, which can sometimes lead to cracking [91]. The magnitude of such internal stresses depends on the size and geometry of specimens, as well as the nature of impact on them. During ECAP, internal macrostresses are formed, resulting in a slight bending of specimens (Figure 1). When cutting microspecimens of 3 × 3 × 6 mm (Figure 2a), these macroscopic stresses relax and only internal stresses associated with microstructure defects (dislocations, martensite particles, grain boundaries, etc.) remain in microspecimens. Macroelasticity stress is the key characteristic of microscopic stresses formed in steel AISI 321L during ECAP.
Resistance of steels to IGC was investigated with R-8 potentiostat-galvanostat (Electro Chemical Instruments, Chernogolovka, Russia) in line with Russian National Standard GOST 9.914-91 using the double loop electrochemical potentiokinetic reactivation (DLEPR) method. DLEPR tests were conducted at room temperature in an aqueous solution of 10%H2SO4 + 0.0025 g/L KSCN. An auxiliary electrode was made from a Pt grid, a reference electrode was made from chlorine silver, the specimen under study served as a working electrode. The specimen was a cathode polarized at a potential φ = −550 mV for 2 min. Voltage—current density i(V) curves were recorded in the range of potentials from −550 mV to +1200 mV with a rate of 3 mV/s. Susceptibility of steel to IGC was determined by the ratio of areas under passivation curve (S1) and under reactivation curve (S2) K = S1/S2, according to GOST 9.914-91.
Tafel ln(i)–E curves were measured in the same medium. Based on Tafel curves, corrosion current densities (icorr, mA/cm2) and corrosion potentials (Ecorr, mV) were obtained using a standard method. Prior to corrosion tests, the surfaces of specimens of 5 × 10 × 10 mm were subjected to mechanical grinding and polishing. Based on the results of measuring icorr, corrosion rate was calculated using the following formula: Vcorr = 8.76·icorrM/ρF, where ρ is steel density [g/cm3], M is molar mass of iron [g/mol], F = 96,500 C stands for Faraday constant. Tests arranged to determine resistance to IGC were conducted pursuant to Russian National Standard GOST 6232-2003: specimens were subjected to boiling in a solution of 25% H2SO4 + CuSO4 for 8 h. The nature of surface destruction after IGC tests was analyzed using a Leica® IM DRM optical microscope (Leica Microsystems GmbH, Wetzlar, Germany).
All specimens for research were obtained by electroerosive cutting in water. The specimens for SEM, XRD, mechanical tensile tests, stress relaxation and corrosion tests were subjected to mechanical grinding and polishing using diamond pastes of various dispersions. Grinding and polishing were performed using a Beuhler Vector Power Head polishing machine (Buehler Worldwide Headquarters, Lake Bluff, IL, USA). Specimens for SEM and XRD studies were additionally subjected to electrochemical polishing.
In order to study thermal stability of microstructure and mechanical properties of UFG steels, the specimens were annealed in EKPS-10 air furnace (Smolensk SKTB SPU JSC, Smolensk, Russia) at temperatures ranging from 100 to 800 °C. Holding time was 60 min. The specimens were placed onto a metal substrate in the furnace warmed up in advance. Th error of maintaining temperature was ±10 °C. The specimens were cooled down in water. At least three simultaneously annealed specimens were tested for each state.

3. Results

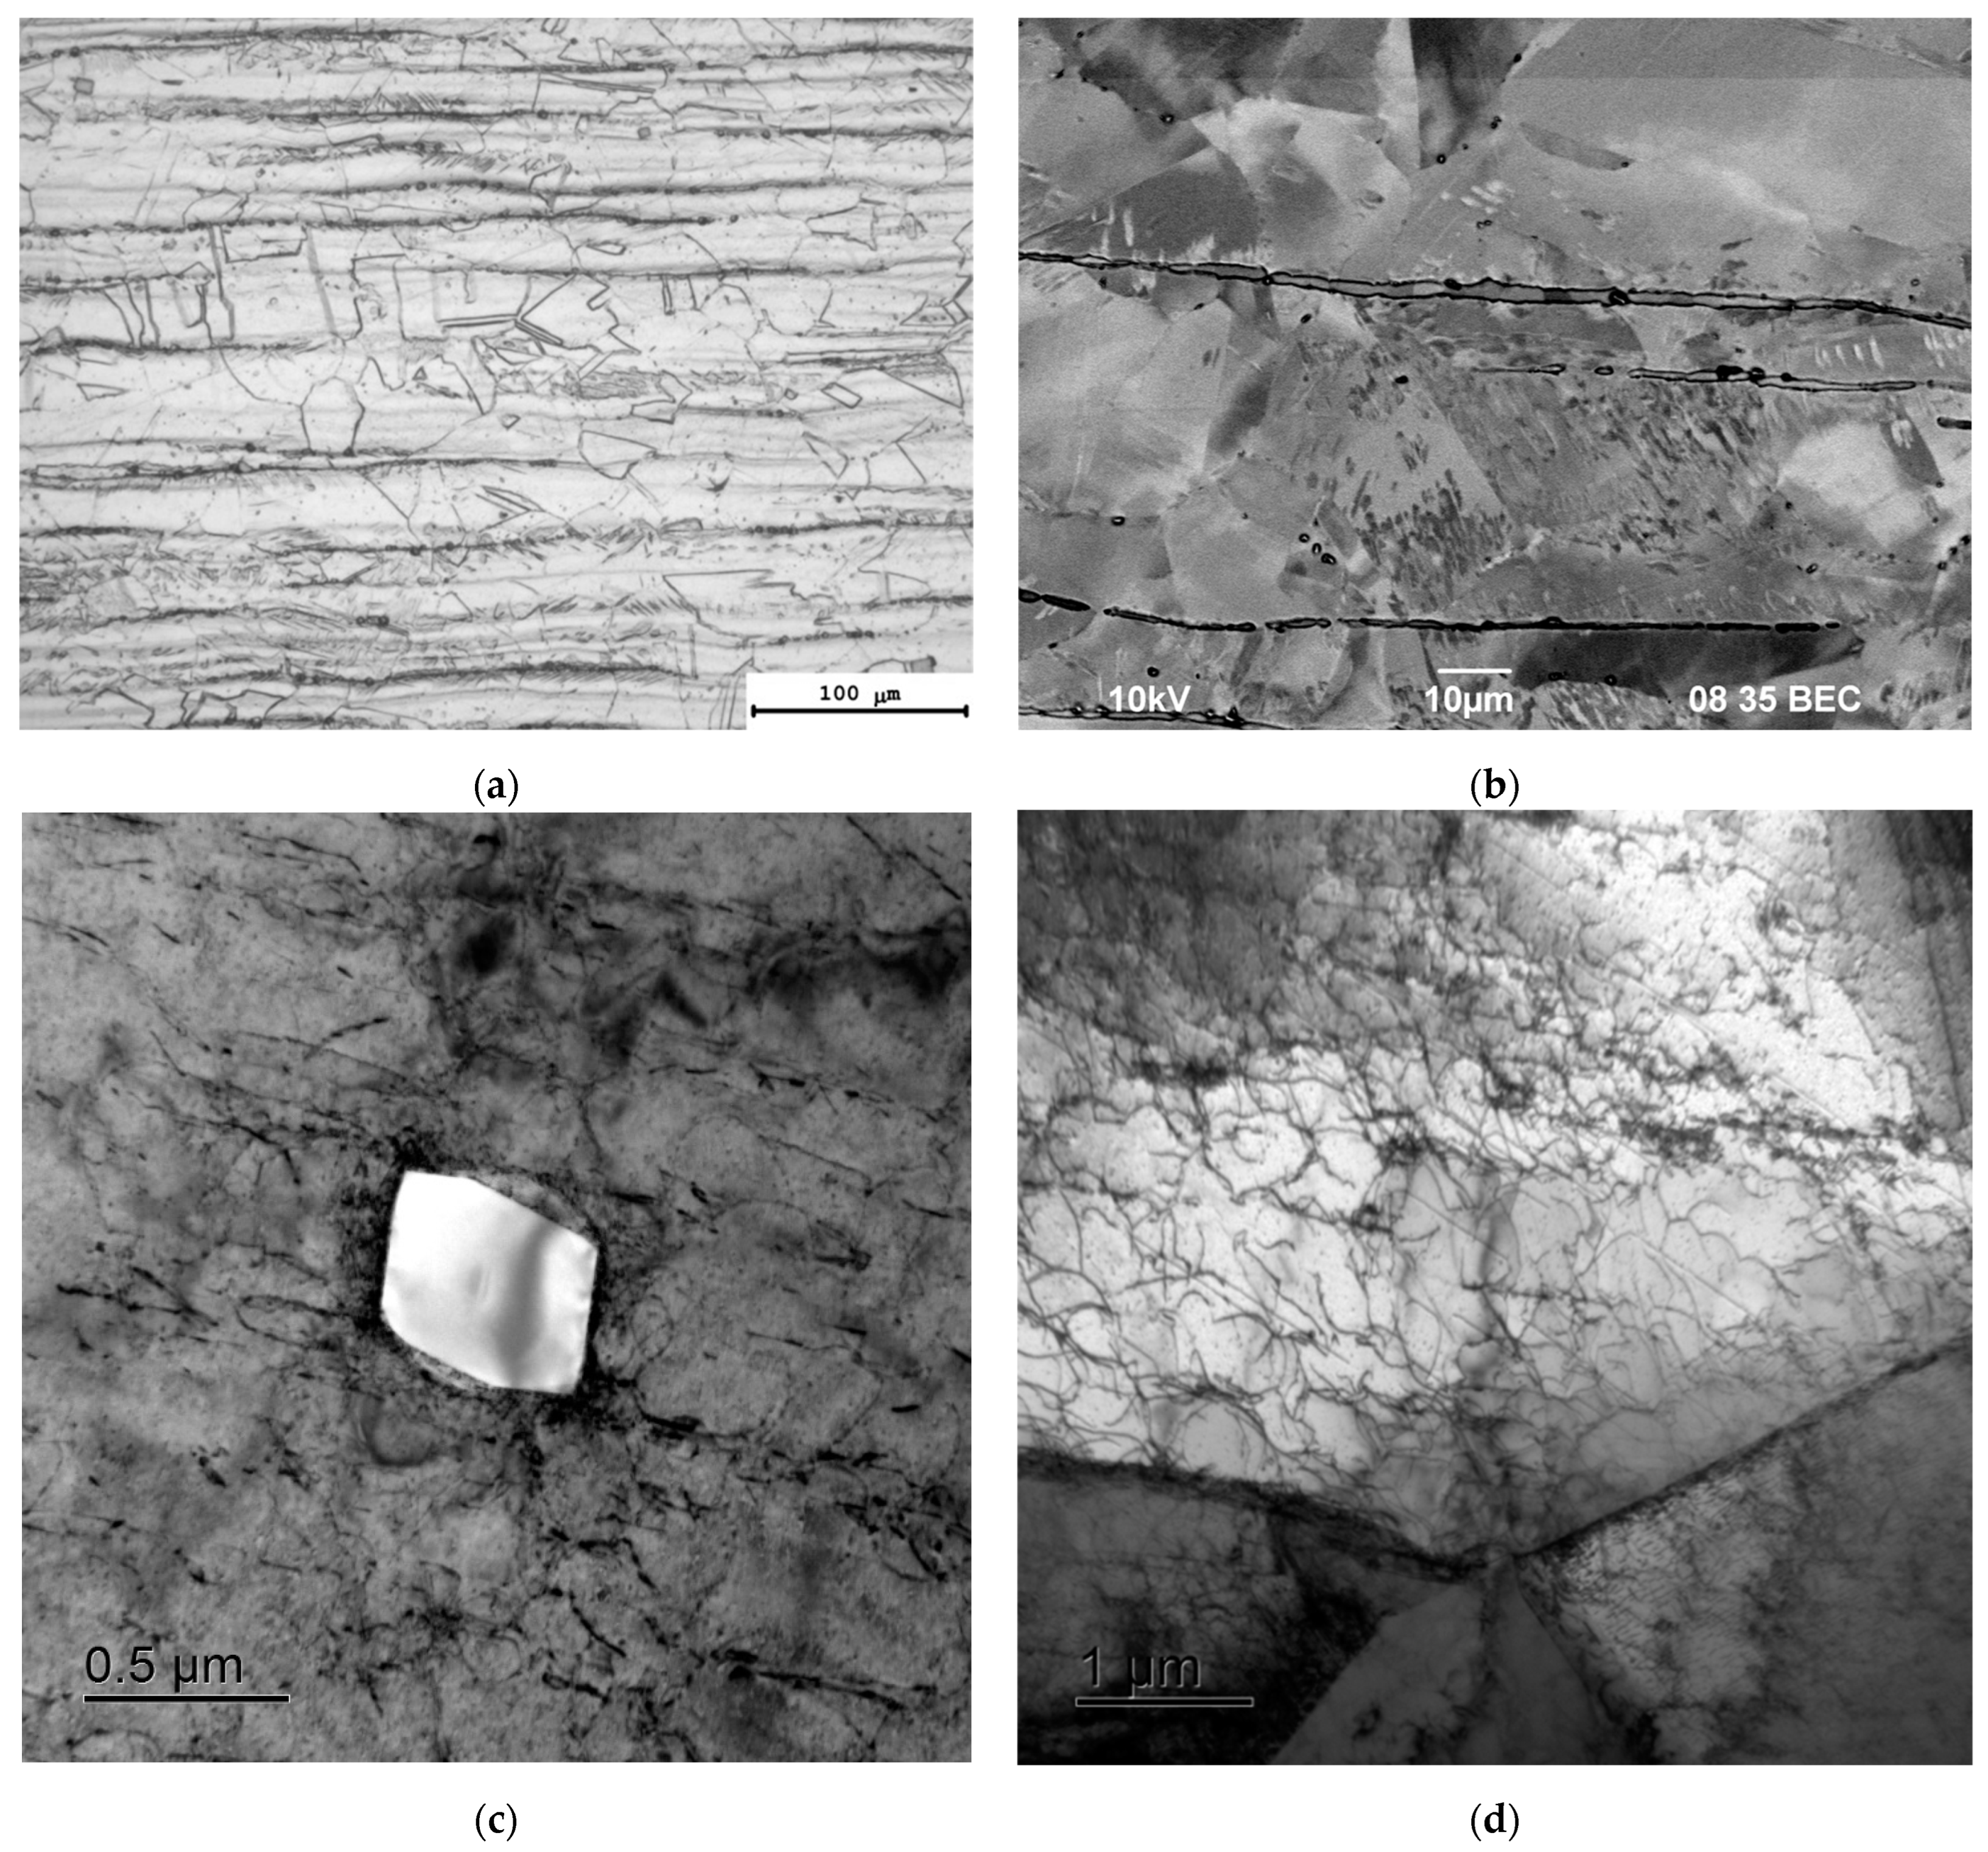
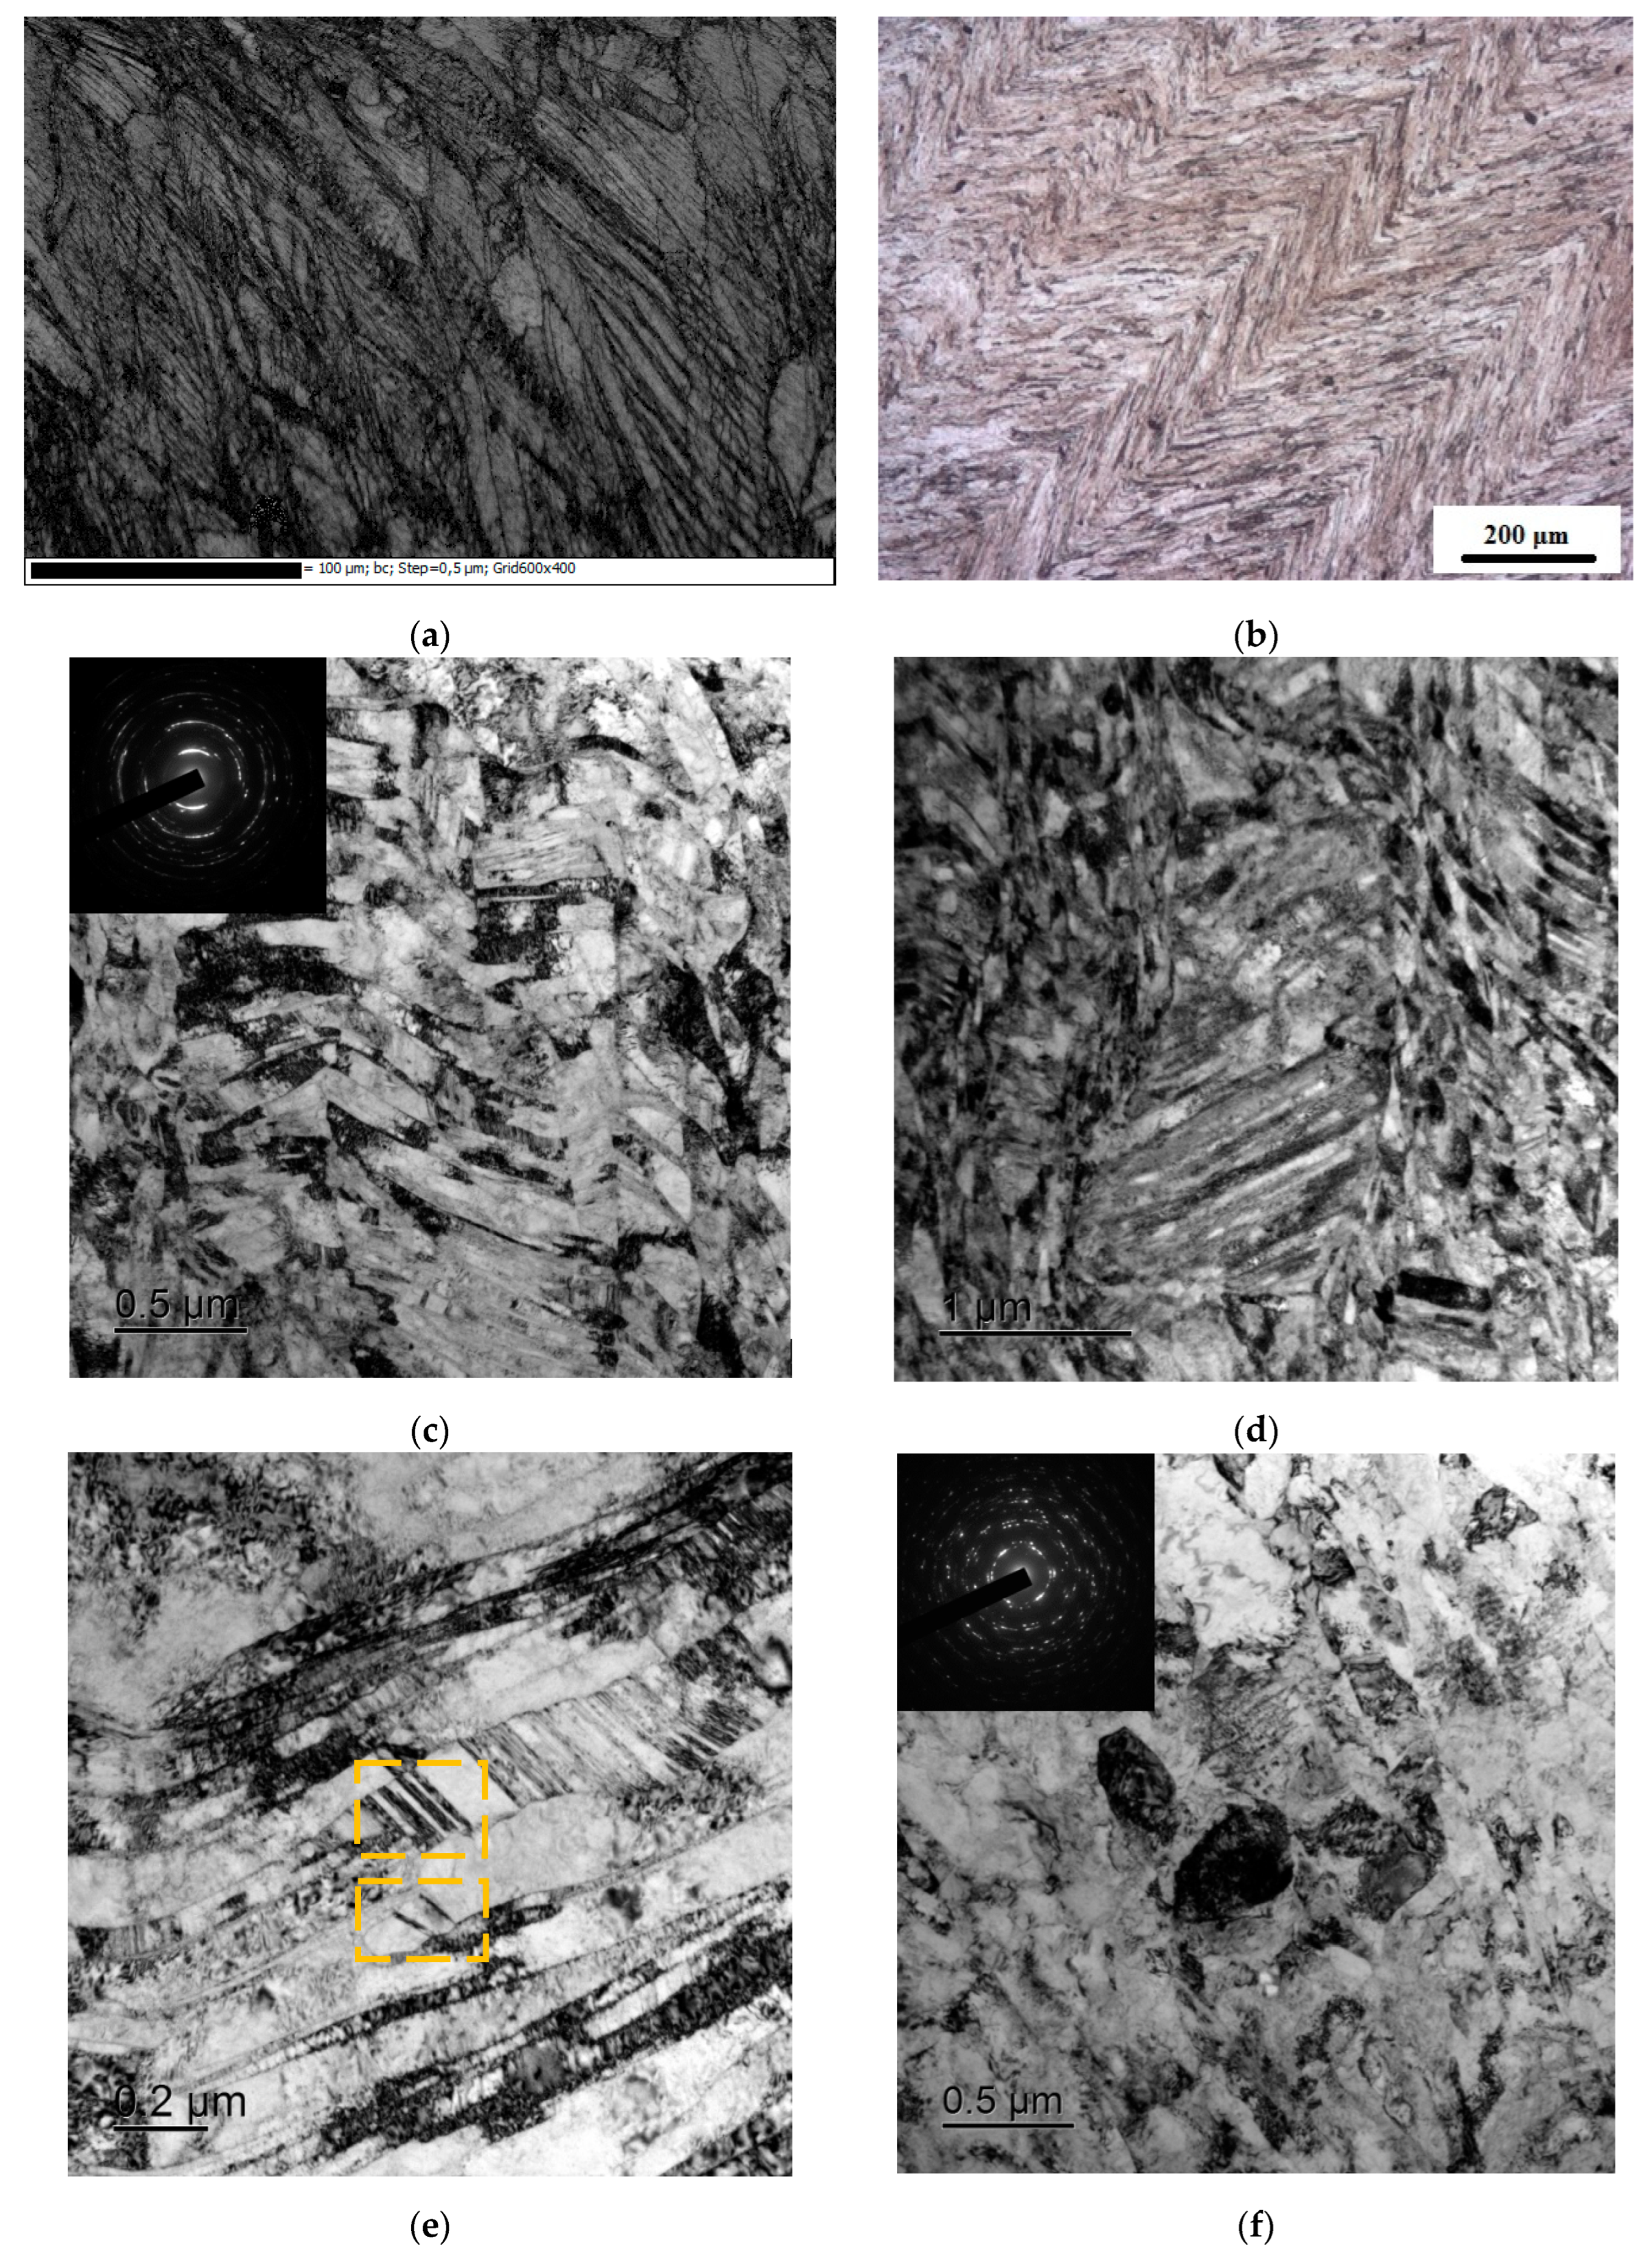
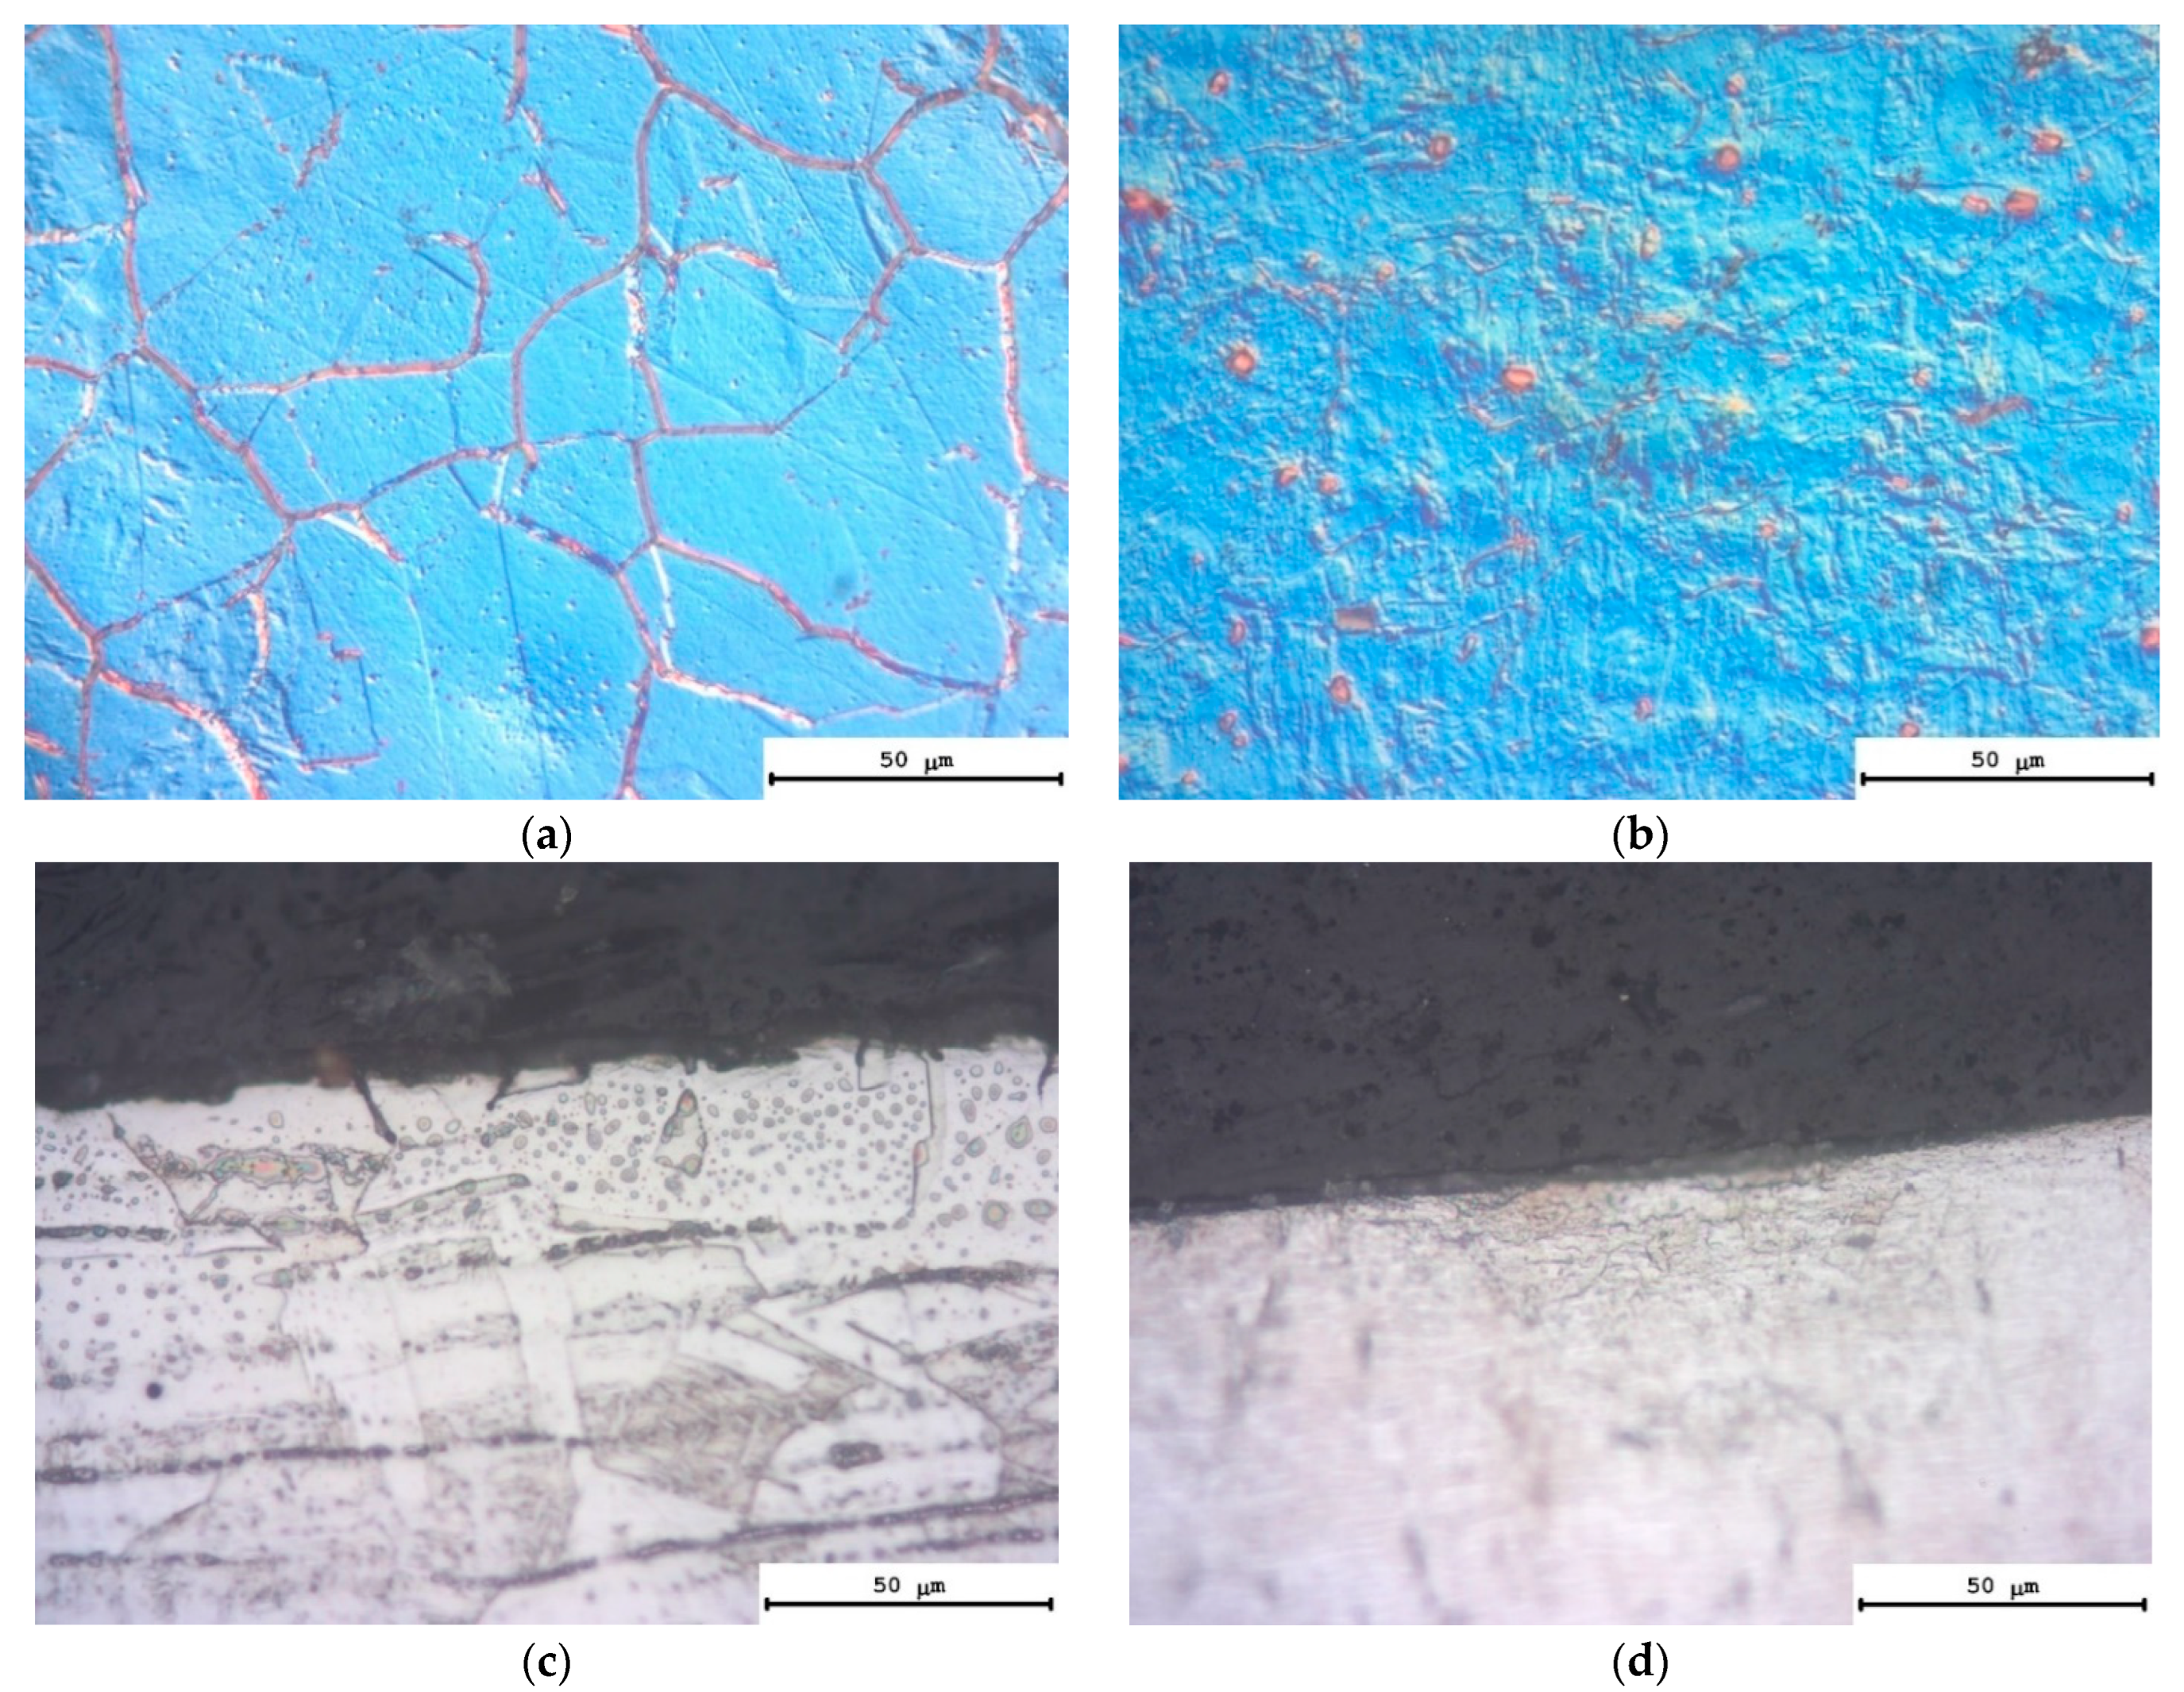
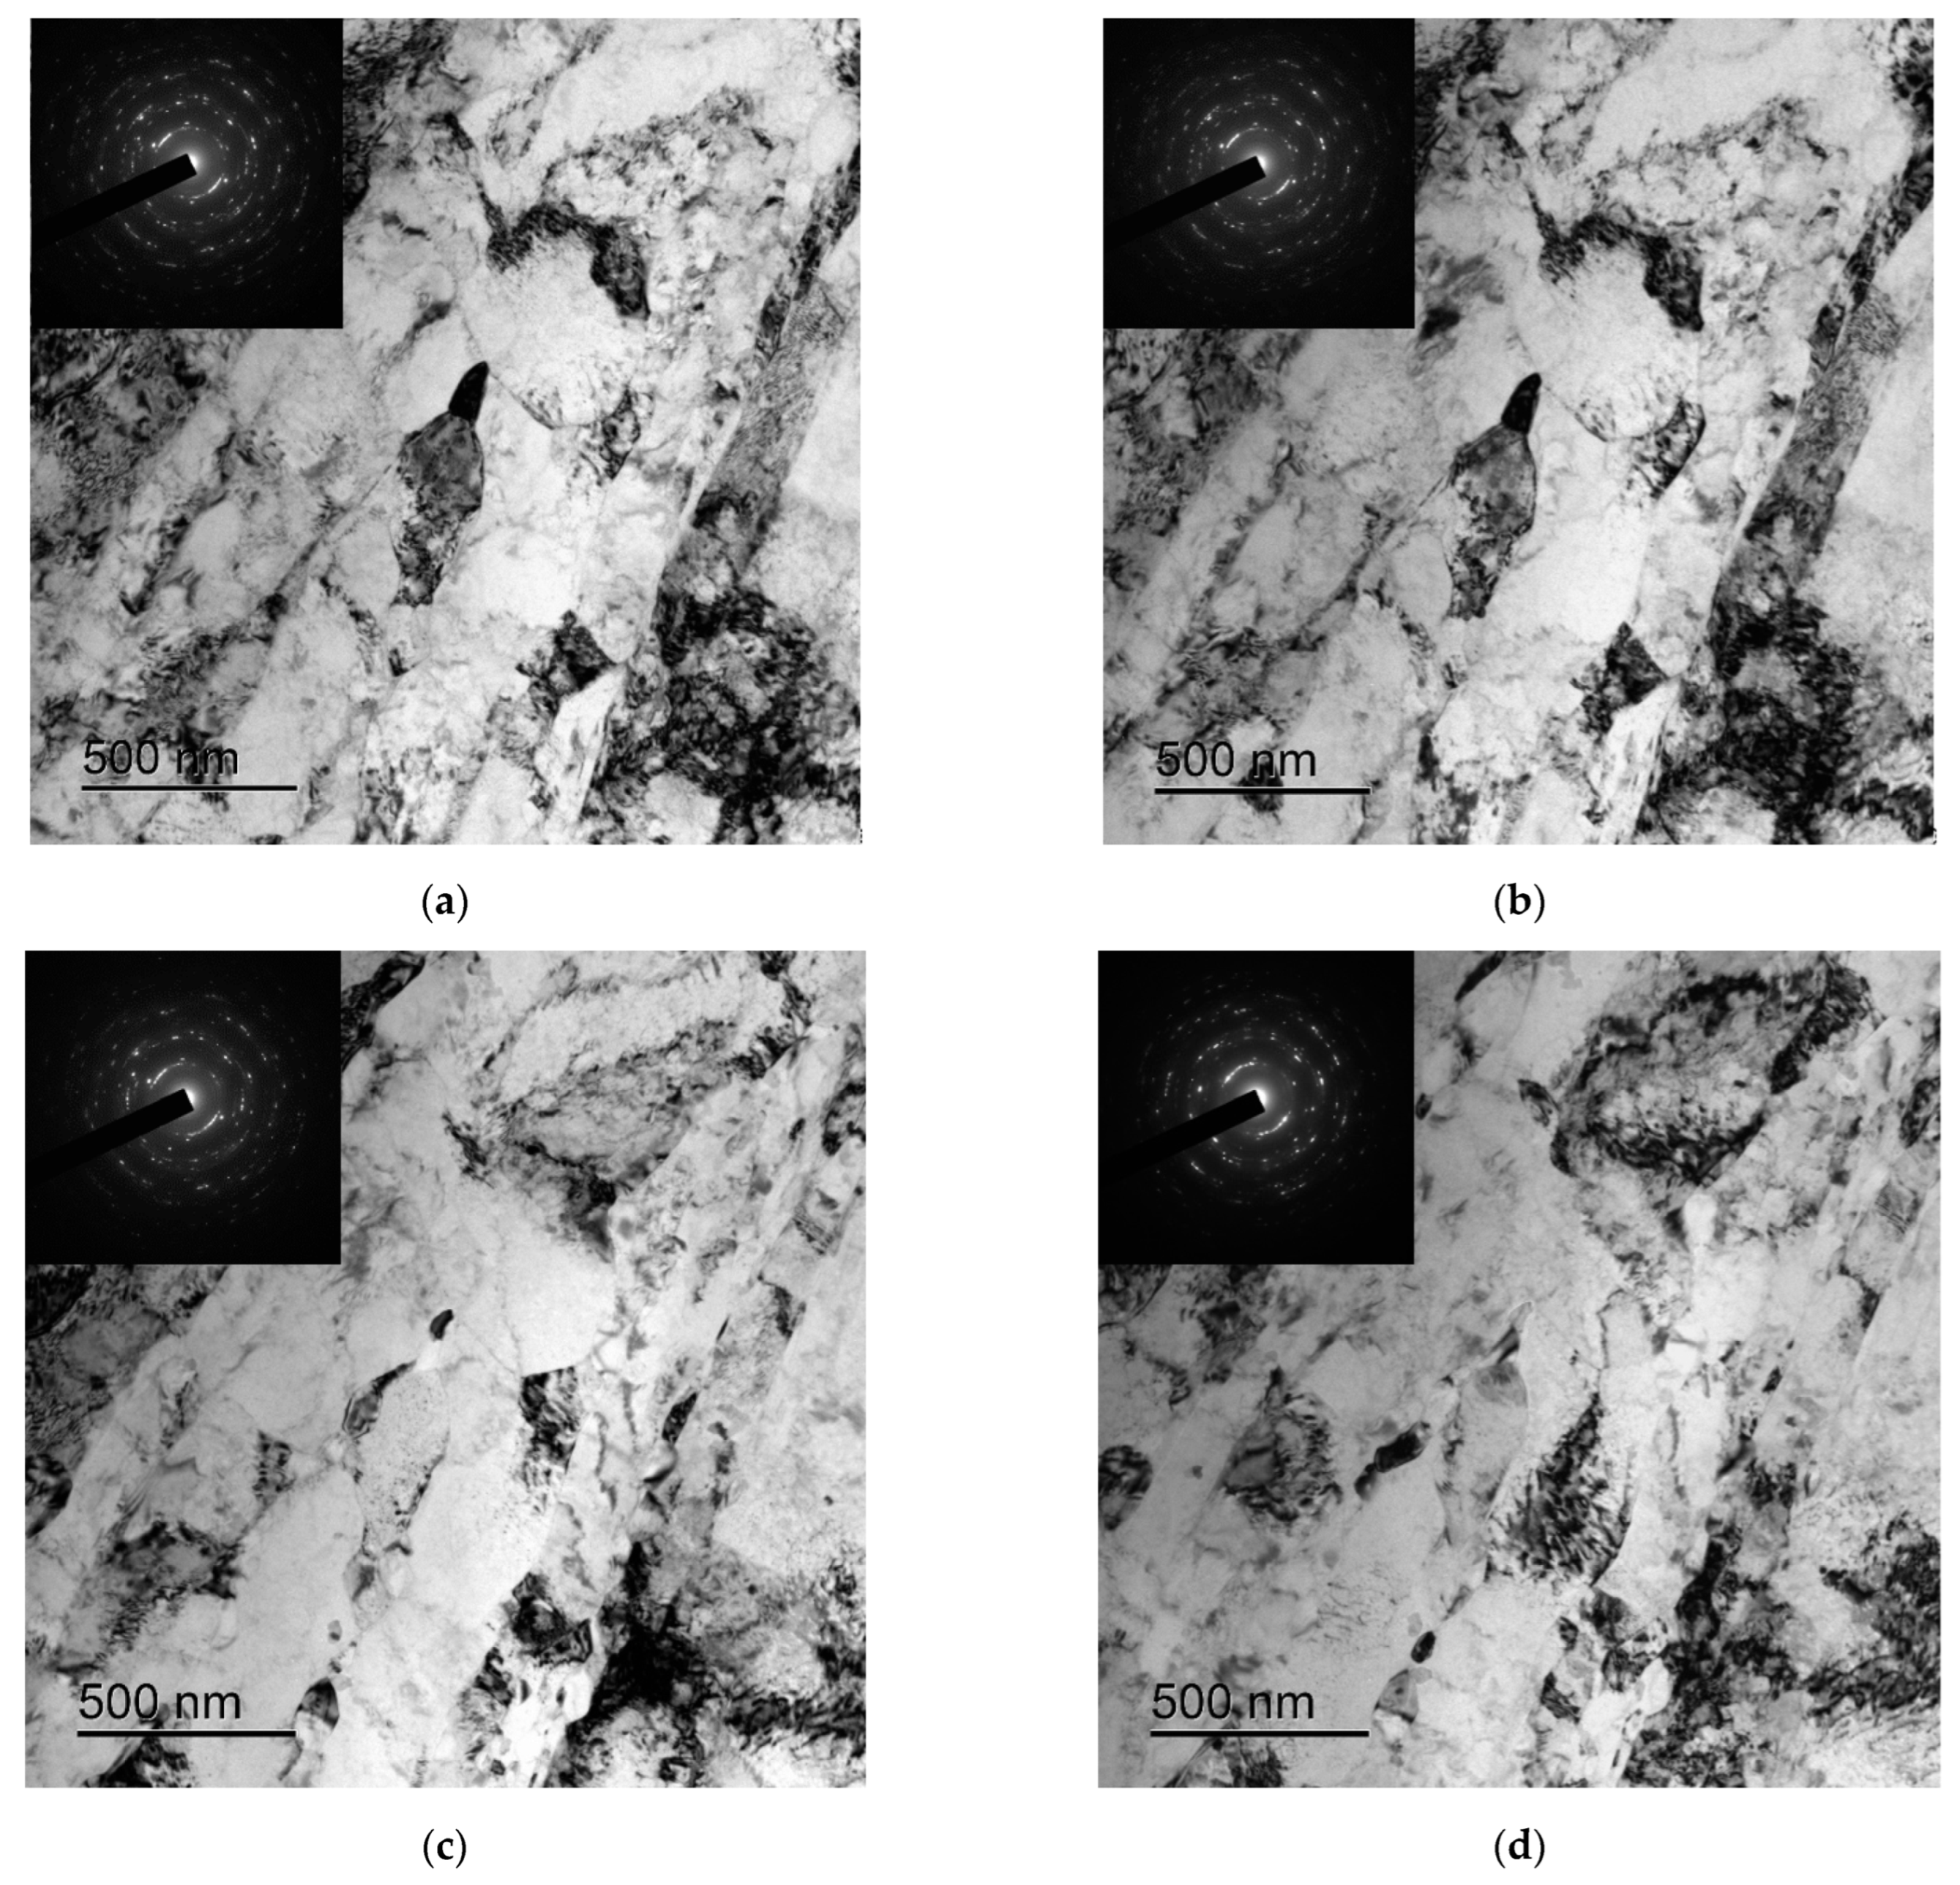
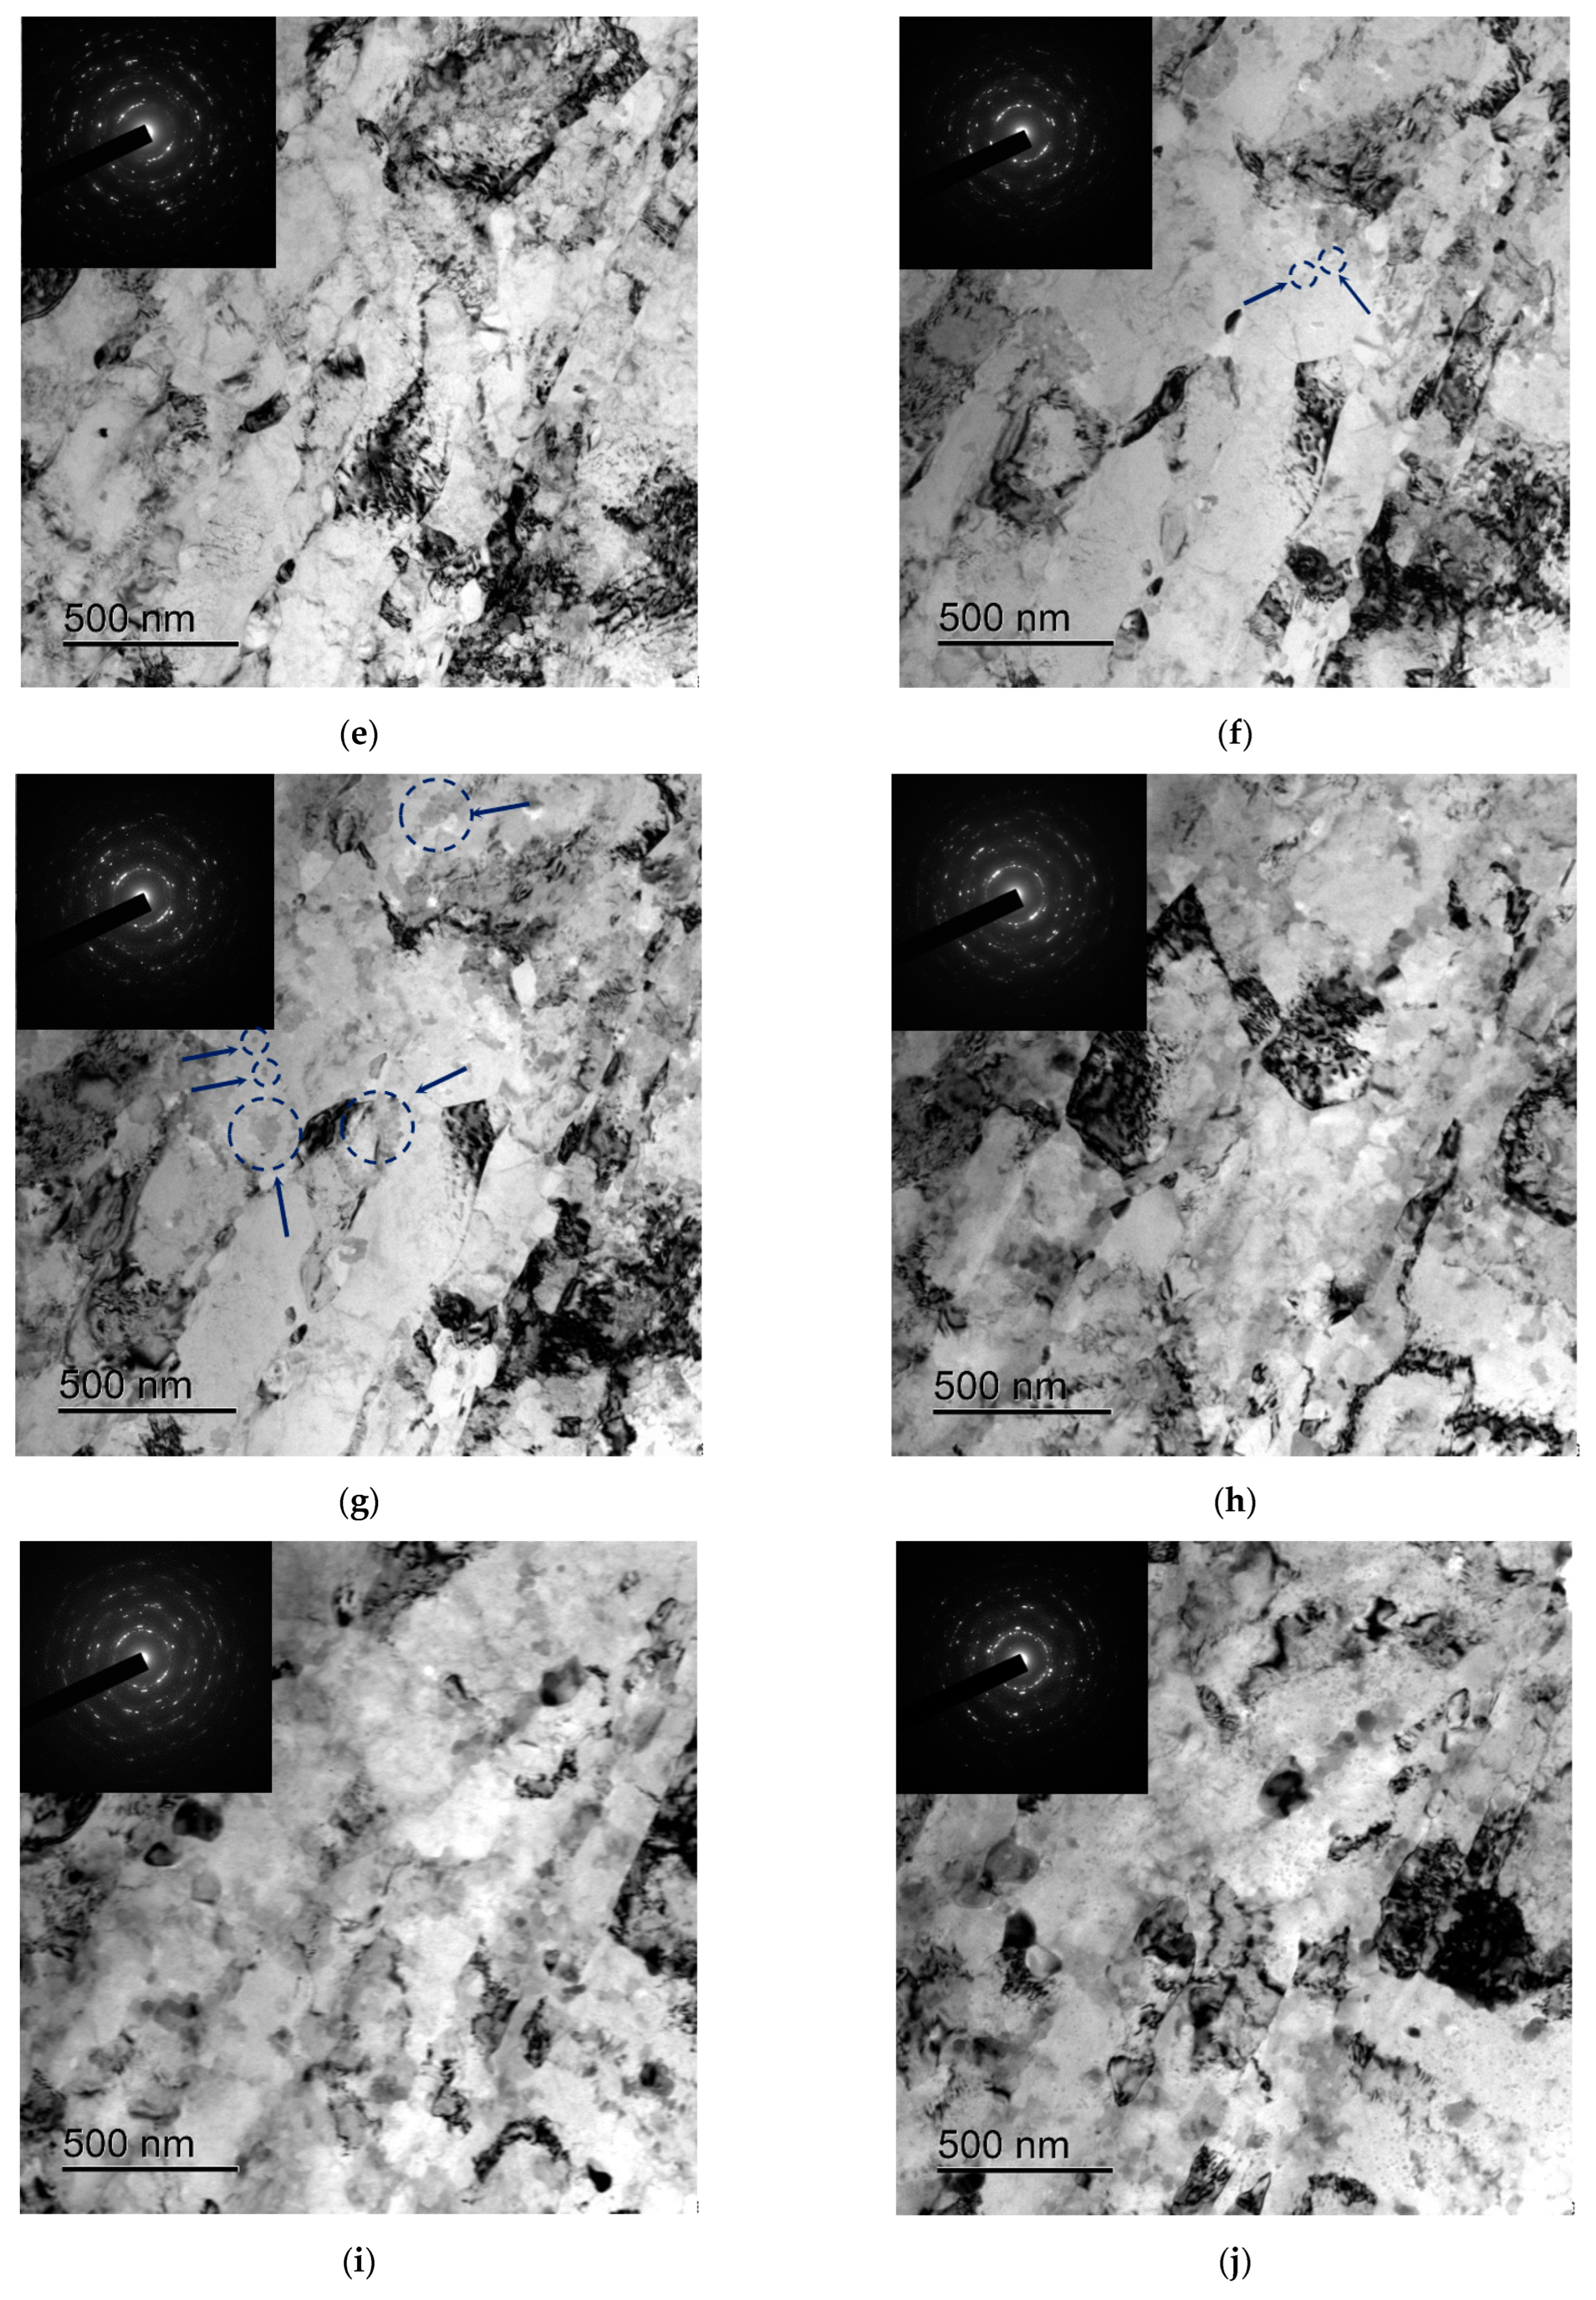
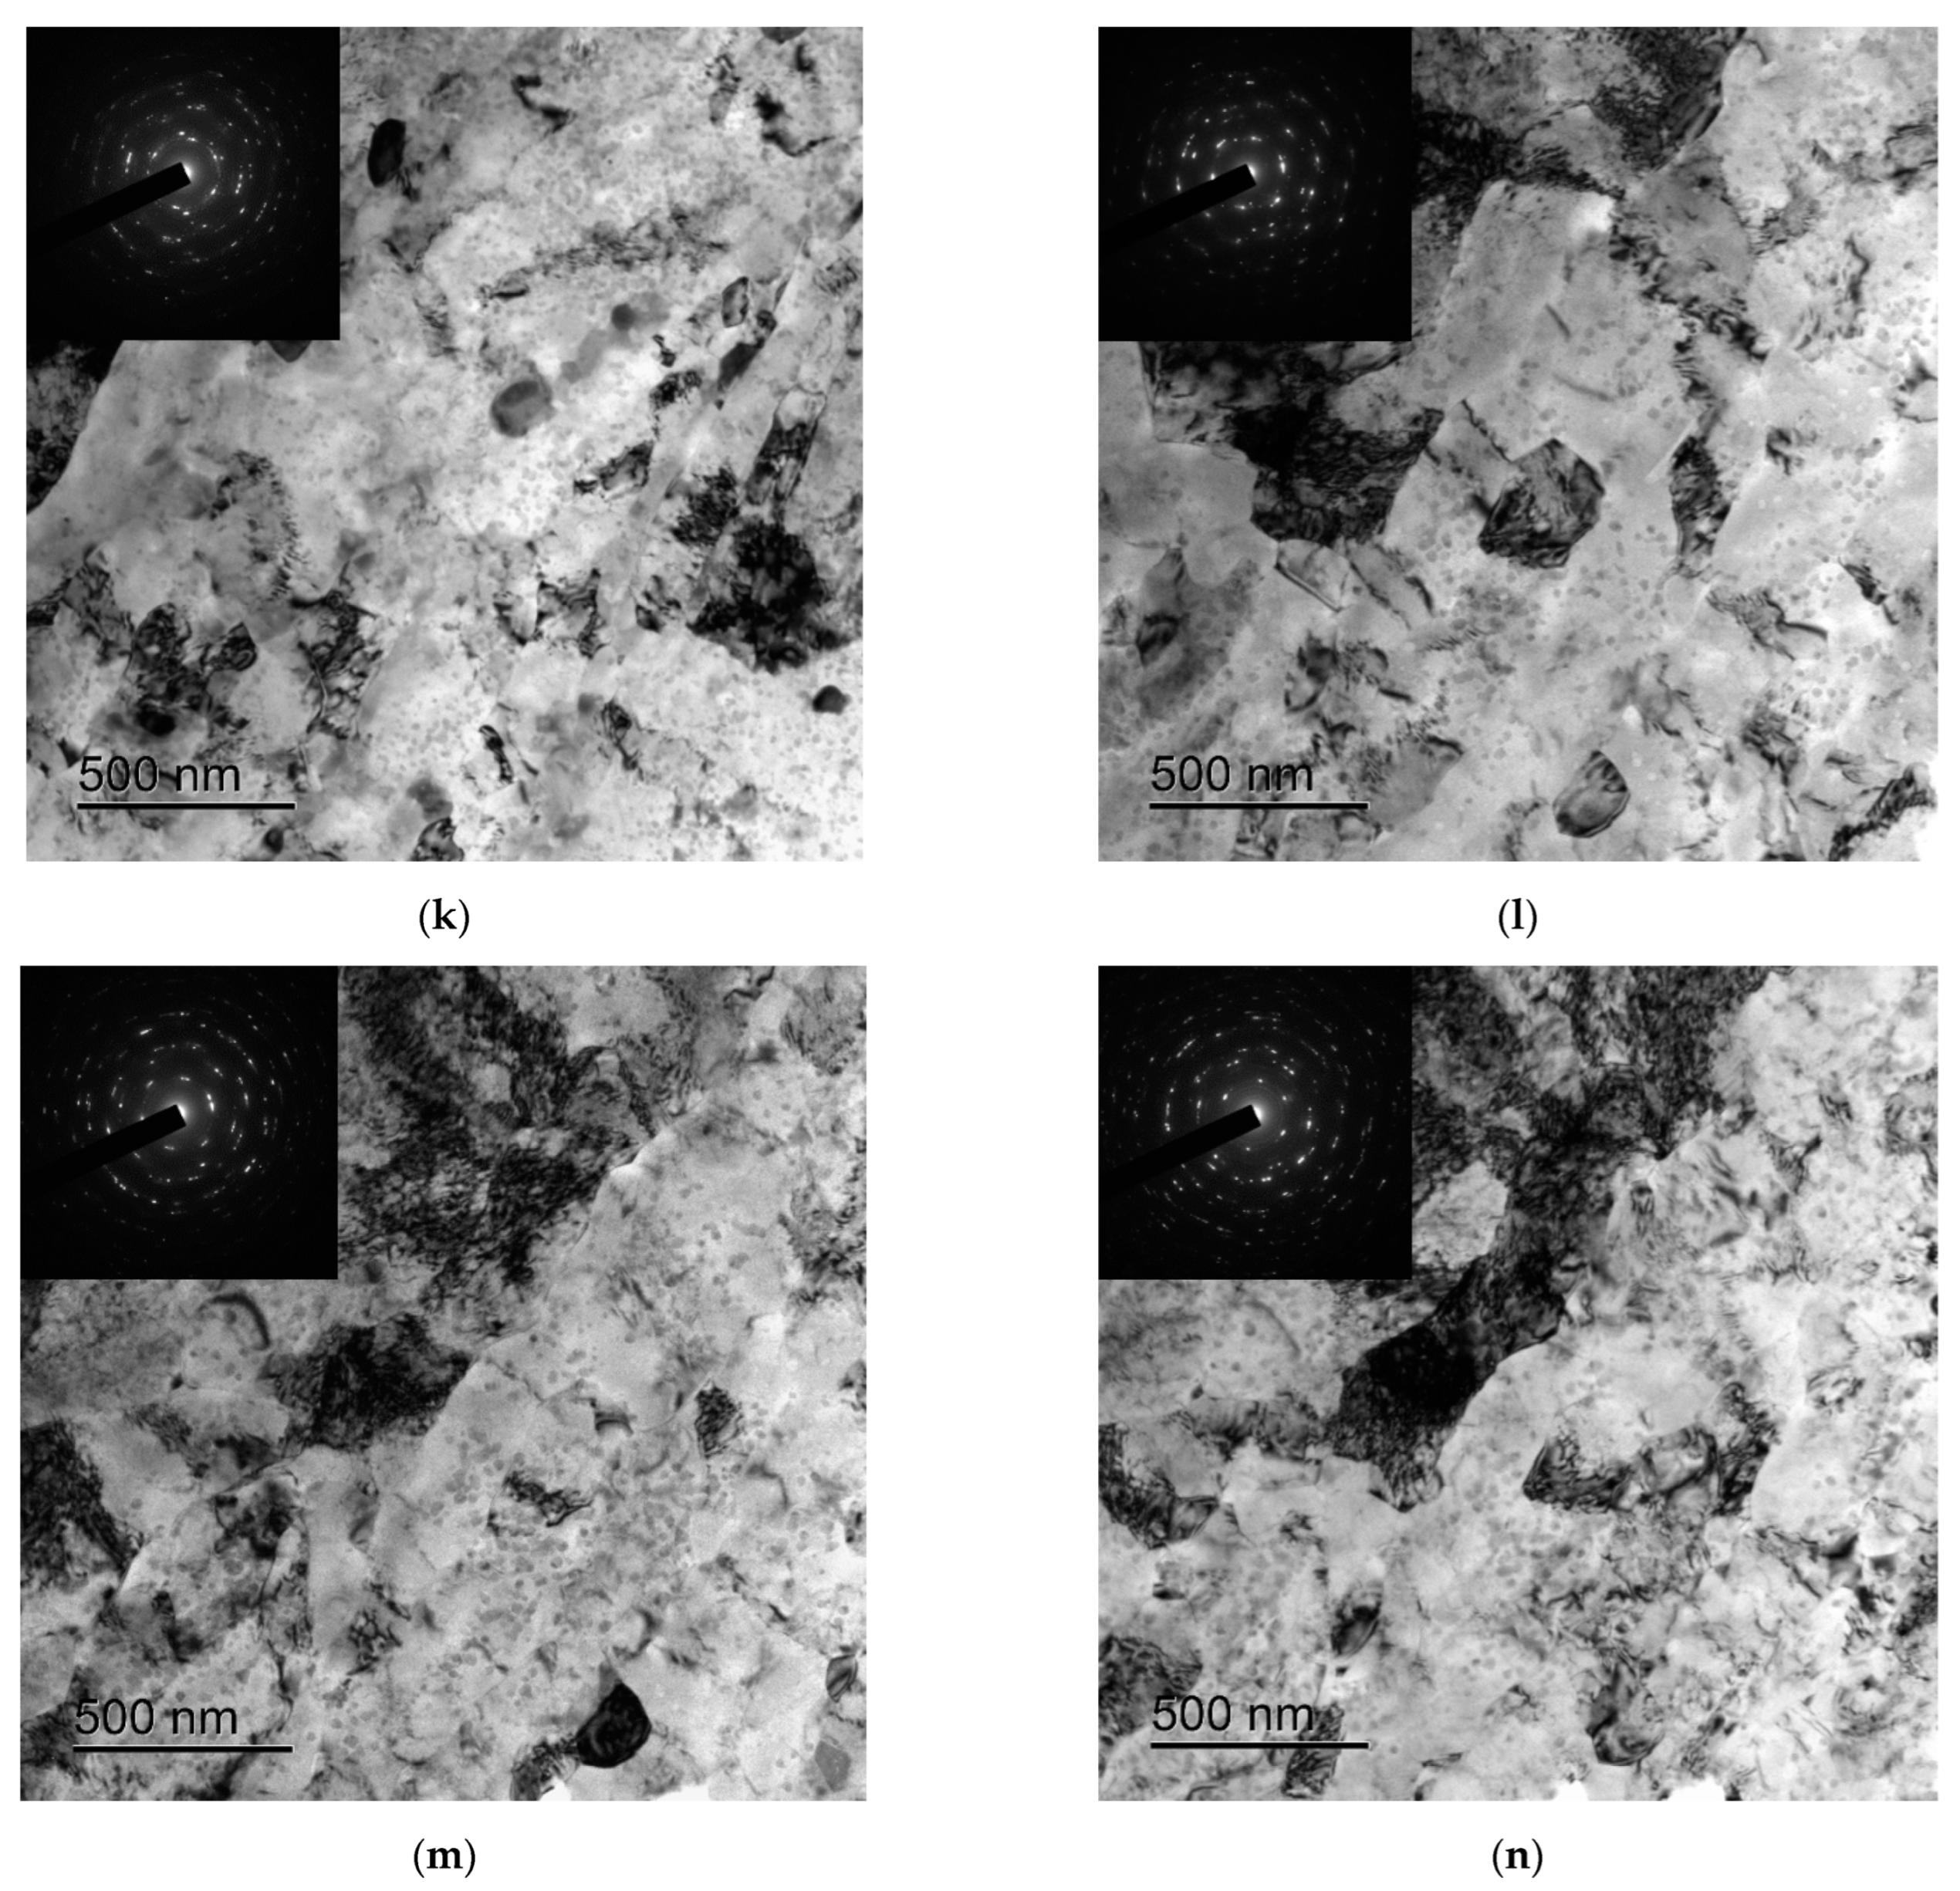
3.1. Microstructure Investigations

In its initial state, CG steel had a uniform austenite microstructure (Figure 3a,b). The average austenite grain size was ~20 μm. Thin (up to 10 μm thick) large particles of δ-ferrite elongated along deformation directions were observed in the microstructure of CG steel (Figure 3a–d). δ-ferrite particles were ~500 μm long. Lattice dislocations (Figure 3d) such as few micron- and submicron-sized titanium nitride and titanium carbonitride particles (Figure 3c) were observed inside austenite grains.
After the first ECAP cycle, the macrostructure of steel workpieces contained alternating macro-shear bands of localized deformation (Figure 4a). After four ECAP cycles, the macrostructure became more uniform, but localized deformation shear bands were seen clear enough (Figure 4b). As mentioned in the Introduction, formation of shear bands is typical of ECAP (see [61]).
Figure 5 presents XRD curves for steel specimens in their initial state and after ECAP. An XRD (111) δ-ferrite peak (PDF #00-006-0696, ICSD #52258) is seen clearly on XRD curve of CG steel at a diffraction angle 2θ~45° near a highly intensive XRD (110) γ-Fe peak (PDF #01-071-4649). The results of XRD phase analysis prove that the average mass fraction of δ-phase in steel in its initial state is ~1.5–3%. The lattice parameter of δ-phase in Fe–Cr–Ni–Ti steel was 2.8869 Å, and the lattice parameter of γ-phase was 3.5875 Å.
ECAP leads to an increase in the mass fraction of α′-phase because of strain-induced martensite. No XRD peaks from ε-martensite (PDF #00-034-0529, ICSD #631723) were found. The scale and dynamics of an increase in α′-martensite along with an increase in the number of cycles depend on ECAP temperature. After the first ECAP cycle at 150 °C, the total contents of (α′ + δ)-phase raised to ~6%. After 4 ECAP cycles, (α′ + δ)-contents grew to 7.7%. So far, one can say that after 4 ECAP cycles (T = 150 °C), α′-martensite contents increased from 0 to ~5%. An increase in ECAP temperature to 450 °C resulted in a more intensive increase in α′-martensite mass fraction: the fraction of (α′ + δ)-phase grew from 3.6% after 1 cycle to 15–17% after 4 ECAP cycles. An increase in the martensite content along with an increase in strain agrees well with the results presented in [1,5,8]. In our opinion, differences in the martensite content after ECAP at 150 °C and 450 °C detected by XRD phase analysis are related to the sample texture after ECAP (Figure 5). This leads to rather a large uncertainty in determining the martensite content in austenite. At the same time, it is important to note that XRD phase analysis unambiguously proves that a large mass fraction of martensite remains after ECAP at 450 °C. One can clearly see XRD peaks corresponding to α′-phase on the XRD curve of the specimen after ECAP at 450 °C (Figure 5).
ECAP reduced intensity and broadened XRD peaks from α′- and γ-phases. Half width at half maximum (HWHM) of XRD α′-phase peaks (111) and XRD γ-Fe peaks (110) for CG steels were 0.196° and 0.193°, respectively. After 4 ECAP cycles at 150 °C, HWHMs of α′-phase (111) and γ-Fe (110) XRD peaks in UFG steels were 0.300° and 0.277°, respectively while the same values for UFG specimens after 4 ECAP cycles at 450 °C were 0.407° and 0.289°, respectively. The lattice constants of α′-phase and γ-Fe for UFG steels after 4 ECAP cycles (aα = 2.8718 Å, aγ = 3.5863 Å − TECAP = 150 °C; aα = 2.8780 Å, aγ = 3.5897 Å − TECAP = 450 °C) were close to the ones of ferrite and austenite in CG steels. Thus, it can be argued that small sizes of coherent scattering regions mostly contribute to the broadening of XRD peaks after four ECAP cycles.
Along with the strain-induced formation of α′-martensite during ECAP, a fragmentation of an austenite grain microstructure was observed. After 4 ECAP cycles at 150 °C and 450 °C, a UFG microstructure with average grain sizes (d) of 0.3 and 0.5–0.7 μm, respectively, formed in steel (Figure 4c–f). In steel specimens obtained by ECAP at 150 °C, crossing localization micro-bands that lead to different orientations of austenite grains were observed at the microscopic level (Figure 4c,d). The microstructure of specimens after ECAP at 450 °C was more uniform, and no clear shear microbands were observed (Figure 4e,f). The nanotwins are seen in some austenite grains (Figure 4f), which can be classified as martensite according to [54,55]. No δ-phase particles were identified in a UFG microstructure during metallographic investigations that allows for a conclusion about their strong fragmentation during ECAP. No Cr23C6 and σ-phase particles, which can form during high temperature treatment of steels with δ-ferrite [1,27,28,29], were observed. Separate point reflections in electron diffraction patterns evidenced the presence of high-angle GBs in UFG steels obtained by ECAP at 450 °C (Figure 3f and Figure 4e). Electron diffraction patterns of UFG steel specimens after ECAP at 150 °C were more blurry (Figure 4c,d).
Figure 6 shows the dependence of an mean grain size on annealing temperatures (Figure 6a) as well as mcirostructures of UFG steels at different annealing temperatures (Figure 6b–f). Investigations of thermal stability of a UFG microstructure during annealing demonstrated that recrystallization temperature in UFG steels (N = 4, TECAP = 450 °C) is T1 = 700 °C (Figure 6a). Recrystallization had a clearly abnormal character accompanied by the formation of a multi-grained microstructure. After annealing at 750 °C for 1 h, recrystallized metal regions with d = 5–7 μm were observed in the fine-grained microstructure of annealed steels (Figure 6b,c). The volume fraction of these regions was ~3–10%. At increased annealing temperatures, an increase in the volume fraction of recrystallized metals as well as an increase in mean grain sizes were observed: after annealing at 900 °C for 1 h, an equiaxial austenite fine-grained microstructure with d = 8–12 μm was formed (Figure 6e, f). Raising the number of ECAP cycles to N = 4 at TECAP = 450 °C brought about no change in recrystallization temperature T1 but was accompanied by a decrease in mean recrystallized grain sizes (Figure 6a). In a completely recrystallized structure after annealing at 900 °C, one can see clusters of micron- and submicron-sized particles (Figure 6c–f) formed in the place of initial elongated δ-ferrite particles up to 0.5 mm long.
The XRD analysis demonstrated a decrease in α′-martensite fraction accompanied by annealing temperatures rising to 600 °C (1 h). After annealing at 700 and 800 °C, the α′-martensite fraction was beyond the measurement error of ±1 wt.% regardless of ECAP modes. The intensity of XRD martensite-phase peaks did not exceed the noise level.
In order to study the process of σ-phase particle formation, TEM in situ method was used. Foils from UFG steel AISI 321 were heated in the column of a Jeol JEM-2100F transmission electron microscope and, at the same time, their steel microstructure was studied. Specimens were heated gradually with a step of 100 °C, holding time for 60 min at each temperature. Heating started at room temperature and reached 800 °C. The full cycle of in situ studies included the following heating scheme: RT → heating to 300 °C, holding for 60 min → heating to 500 °C, holding for 60 min → heating to 600 °C, holding for 60 min → heating to 700 °C, holding for 60 min → heating to 800 °C, holding for 60 min → quenching. The results of electron microscopic studies of a UFG steel microstructure at each heating stage are presented in Appendix B.
The abovementioned in situ TEM investigations demonstrated nucleation of light-colored nanoparticles in UFG steels when heating to 600 °C. The mean size and volume fraction of particles increased along with an increase in heating temperature. After heating to 800 °C and holding for 0.5 h, the mean particle size was about 50 nm (Figure 7a). According to EDS results, σ-phase were the ones that nucleated (Fe–Cr intermetallic compound) (Figure 7b). The possible nucleation of σ-phase nanoparticles during annealing of UFG steel AISI 321L has already been reported in [54,55]. XRD σ-phase peaks were absent on XRD curves for the annealed specimens, probably, due to small sizes of nucleated particles. It is important to note that σ-phase particles were distributed uniformly inside the grains (Figure 7b); no preferential nucleation of σ–phase particles along austenite GBs was found.

3.2. Mechanical Properties at RT

As shipped, CG steels had lattice friction stress (‘macroelasticity stress’) (σ0) and yield strength (σy) equal to 205 MPa and 380 MPa, respectively. ECAP helped to improve of mechanical properties of steel. The σ0 increased up to 340 MPa and 425 MPa and σy up to 940 and 1070 MPa, respectively along with an increase in the number of ECAP cycles from N = 2 to 4 at 450 °C (Figure 8a). σy and σ0 values for UFG steel depended on ECAP temperature weakly—the σy increased from 1070 MPa to 1145 MPa and the σ0 decreased from 425 MPa to 410 MPa with a decrease in ECAP temperature from 450 °C to 150 °C (N = 4).
The analysis of yield strength dependence on mean grain sizes σy(d) proves that this dependence can be interpolated by a straight line σy–d−1/2 axes with a good precision (Figure 8b). This evidences the Hall–Petch relation to hold:
σy = σ0 + KHP·d−1/2,
where KHP is the Hall–Petch coefficient describing the contribution of GBs to strength of steel. The mean value of KHP coefficient determined based on the dependence in Figure 7b is KHP = 0.46–0.49 MPa·m1/2.
Figure 9 presents the dependencies of macroelasticity stress (Figure 9a) and yield strength (Figure 9b) on temperature during 1 h annealing of CG and UFG steel. σ0(T) and σy(T) dependencies for CG steel had a conventional character; an insufficient decrease in macroelasticity stress and yield strength of steel were observed at higher annealing temperatures. As shown in Figure 9a, σ0(T) dependencies have a three-stage character. The first stage (RT–300 °C) is characterized by a constant value of σ0. At the second stage of annealing (500–600 °C), an increase in σ0 was observed, which probably originates from nucleation of σ-phase particles (see above). At the third stage of annealing, at temperatures above 600 °C, a decrease in σ0 down to the values typical of CG steels in the as-shipped state was observed. The softening of UFG steels at this stage of annealing related to recrystallization leading to an increase in the grain sizes.
The dependence of yield strength on annealing temperature had a conventional two-stage character (Figure 9b). Note that an increase in macroelasticity stress at 600 °C originating from σ-phase particles nucleation led to no increase in yield strength as one could expect because of the Hall–Petch relation (Equation (1)). No essential increase in yield strength of steel due to transformation of martensite into UFG austenite was observed. Such a result evidences active grain boundary recovery going at this stage. These processes lead to a decrease in defect density in GBs [61].
Note also that macroelasticity stress and yield strength of CG steel hardly change during annealing at temperatures rising to 700 °C. After heating to higher temperatures, an insufficient decrease in σ0 and in σy was observed. After annealing at 900 °C, values of σ0 and σy for CG and UFG steels were close to each other.
The stress–strain curves σ(ε) for CG and UFG steel specimens at RT are presented in Figure 10. σ(ε) curve for CG steel had a conventional form, with a long strain hardening stage. Mean tensile ultimate strength for CG steels was σb = 720 MPa. This is a very high value, which probably stems from δ–ferrite particles and relatively small grain sizes in austenite (~20 μm).
σ(ε) curves for UFG steels had concave shapes with upper yield strengths expressed clearly. σ(ε) curves for UFG steel specimens show a short stage of stable strain flow, which transforms into a strain localization stage. A rapid stress drop of 30–50 MPa was observed at initial stages of σ(ε) curves for UFG steels (Figure 10). The presence of ‘maxima’ with upper yield strength on σ(ε) curves for UFG steels can be linked to the strain aging effect [30,31,32] or discontinuous Lüders strain, which can also lead to shapes observed on σ(ε) curves [5]. An increase in ECAP temperature from 150 °C to 450 °C resulted in an insufficient increase in the duration of a uniform strain hardening stage (Figure 10).
Tensile tests of CG and UFG steel specimens demonstrated that the formation of the UFG microstructure by ECAP (N = 4 at 150 °C) resulted in a decrease in elongation to failure (δ) from 125 to 45% and an increase in ultimate strength from 720 to 1100 MPa (Table 1). ECAP at higher temperatures (450 °C) resulted in an insufficient decrease in σb to 1020 MPa and an increase in elongation to failure to ~60%.
The fractographic analysis revealed three characteristic zones in fractures observed in CG and UFG specimens after tension tests: a fibrous zone, a radial one, and a break (cut) zone (Figure 11). It is worth mentioning that cut zones in CG steels occupied ~50% of the whole fracture area. Cut zones occupied ~70% in UFG steel after ECAP (N = 4). So far, the formation of a UFG microstructure resulted in a bigger cut zone fraction in a fracture area and, hence, in a smaller viscous component of a fracture.

3.3. Stress-Relaxation Test

Figure 12a presents ∆σi(σ) stress-relaxation curves for CG and UFG steel specimens. ∆σi(σ) curve for CG steels had a conventional three-stage character: a macroelastic deformation stage, a microplastic deformation stage, and a macro-deformation stage (see Figure 2d). It stands to note that ∆σi(σ) curves are close to each other under stresses < 150–170 MPa; no essential differences in stress-relaxation values ∆σi were observed. During microplastic deformation stage (where stress increased from 150–170 MPa to 300–320 MPa), stress-relaxation magnitude ∆σi in CG steel specimens started growing dramatically and reached ~15 MPa under 320 MPa. Along with a further increase in stress to 580–600 MPa (during macro-deformation stage), a smooth increasing in stress-relaxation magnitude to ∆σi ~20 MPa was observed.
Stress-relaxation curves for UFG steel were smoother than ∆σi(σ) curves for CG steel specimens. Note that a fairly expressed macro-deformation stage was almost absent—as one can see in Figure 12a, microplasticity deformation stage transformed into macro-deformation rather smoothly. A bigger number of ECAP cycles resulted in a shift of ∆σi(σ) curves towards higher stresses. As can see in Figure 12a, stress-relaxation magnitude ∆σi ~20 MPa in UFG steels subjected to N = 1 ECAP cycle was achieved at under 670–690 MPa whereas in UFG steels obtained by N = 4 ECAP cycles, stress-relaxation magnitude ∆σi was achieved under 935–950 MPa (TECAP = 450 °C) and 990–1010 MPa (TECAP = 150 °C).
So far, it can be assumed that ECAP austenitic steel leads to an increase in its SRR—an increase in macroelasticity stress σ0 (see above) and a decrease in stress-relaxation magnitude ∆σi at increased stresses σ.
Recrystallization annealing resulted in lower SRR parameters of UFG steels—as follows from Figure 12b, annealing temperatures rising above 650–700 °C resulted in ∆σi(σ) curves shifting towards smaller stresses. After annealing at 800–900 °C, stress-relaxation curves for deformed steel specimens had the conventional three-stage character corresponding to ∆σi(σ) curve for CG steel specimens (Figure 12a).
There were no cracks on the surface of CG and UFG steel specimens after relaxation tests (see [91]), which proves their high stress relaxation resistance despite intensive precipitation of secondary σ-phase particles and presence of α′-martensite particles.

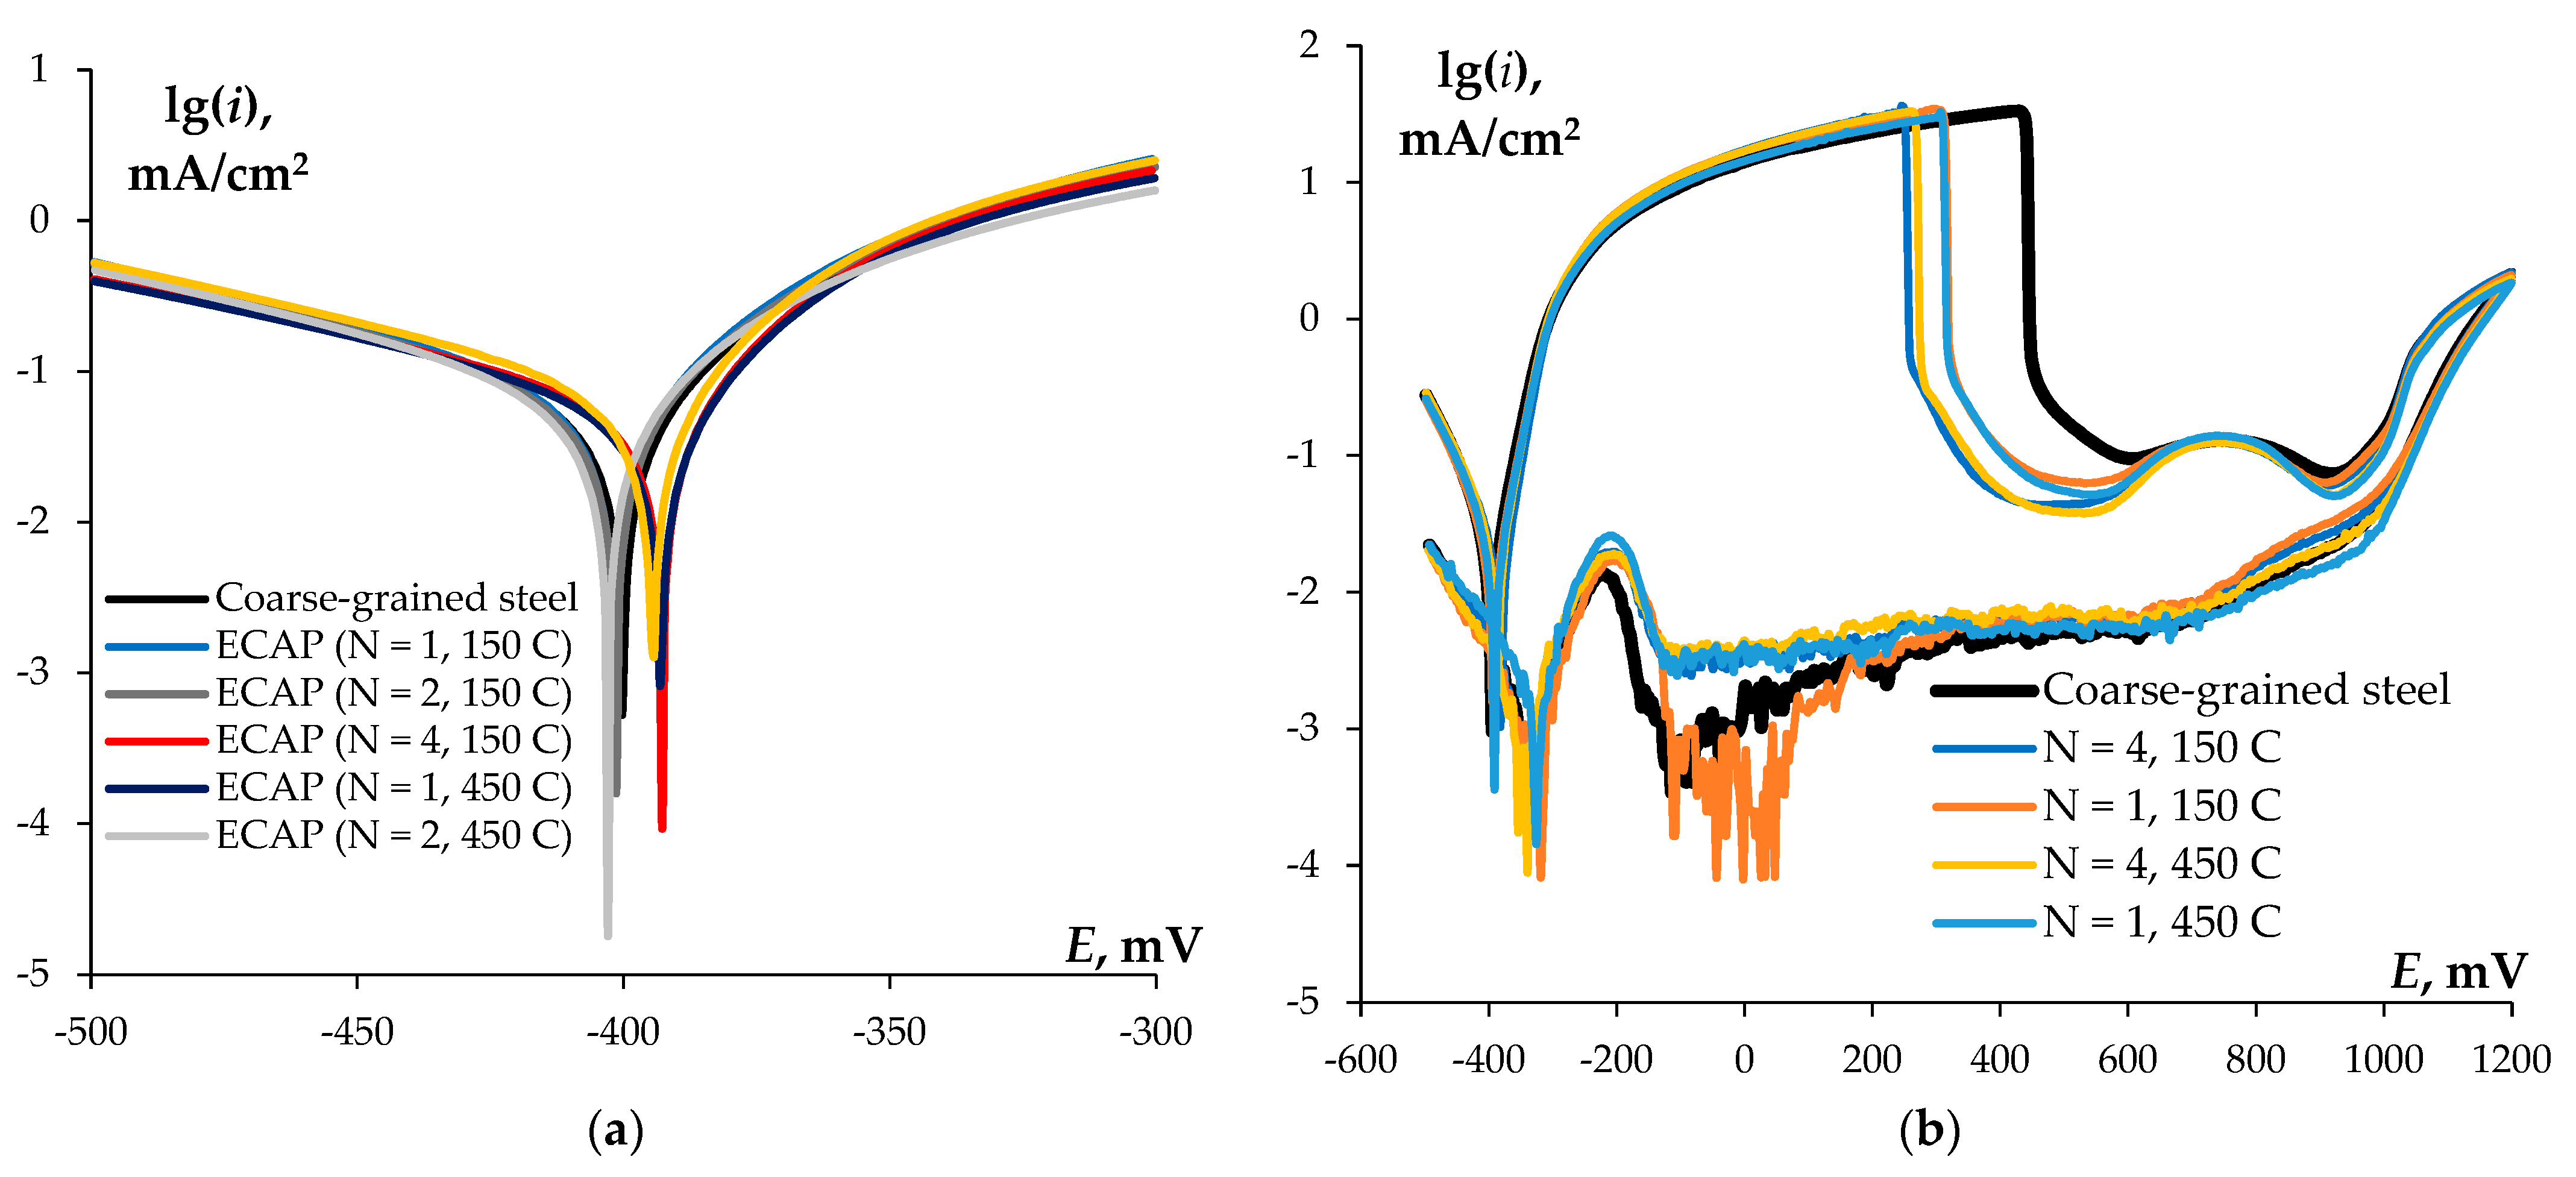
3.4. Corrosion Tests

Figure 13a presents lg(i)–E Tafel curves for CG and UFG steel specimens. The results of electrochemical testing are summarized in Table 1. lg(i)–E cures had the conventional character. CG steel specimens have smaller corrosion rates than UFG ones (Table 1). For UFG specimens obtained by ECAP at 450 °C, mean corrosion current density icorr (mean corrosion rate Vcorr) were 10–15% greater than the same characteristics for UFG steel obtained by ECAP at 150 °C.
Figure 13b presents i(E) curves illustrating the results of DLEPR tests. The results of these tests are summarized in Table 1. It follows from the data presented in Table 1 that the ratios of areas under passivation curves (S1) and reactivation curves (S2) (K = S1/S2) were small and appeared to be much less than Kmax = 0.11. This result proves that both CG and UFG steels are highly resistant to IGC. At the same time, coefficient K values for UFG steel specimens were 1.5–2.5 times higher than for CG ones. The metallographic analysis of surfaces shows that large elongated δ-ferrite particles are the areas of accelerated corrosion destruction of surfaces during DLEPR tests (Figure 14a). No IGC traces were observed on the surfaces of UFG steel specimens (Figure 14b).
The results of IGC resistance test according to Russian National Standard GOST 6232-2003 confirmed high corrosion resistance of UFG steels. As can be seen in Figure 14c, after testing for 24 hrs, corroded elongated δ-ferrite particles were observed on CG steel surfaces. In some areas, IGC corrosion defects or pitting corrosion defects were no more than 10–15 μm in depth. On the surfaces of specimens with a UFG microstructure formed as a result of 1 or 2 ECAP cycles, few corrosion pits were observed. On the surfaces of UFG specimens (N = 3, 4), no corrosion defects were observed (Figure 14d).
Annealing resulted in an increased tendency of UFG steel specimens to IGC. As follows from Figure 15a, increases in the area under reactivation curve (S2) were observed after annealing for 1 h at 600 °C. An increase in K coefficient along with an increase in annealing temperature was observed (Figure 15b). This evidences that IGC resistance of UFG steels to decrease insufficiently after annealing. According to GOST 9.914-91, the increasing of coefficient K to Kmax = 0.11 means that austenitic steel demonstrates an increased tendency to IGC. Additionally, it is important to note that K < Kmax = 0.11, with proves high IGC resistance of annealed UFG steel.
So far, UFG steel has high strength, stress-relaxation resistance, and high resistance to IGC. It allows an efficient application of UFG steel for making stress-relaxation-proof machine-building hardware used under enhanced stresses and in corrosive environments.

4. Discussion

4.1. Changes of the Phase Composition and Microstructure of Steels during ECAP and Annealing

Strain-induced martensite formation (γ → ε → α′) is known to take place during deformation of metastable austenitic steel [1,5,6,7,8,9]. Reverse transformation of α′-martensite into austenite takes place in during heating [1,5,8,39,40,41,44,45,46,47,48,49,50,51,52] that helps to reduce mean austenite grain sizes and hence, ensure enhanced strength of steel. In general, this scheme of microstructure evolution is also valid for metastable austenitic steel AISI 321L obtained by ECAP.
Let us focus on a number of particular microstructure features of UFG steel AISI 321L that are important for further analysis of results obtained.
Plastic deformation during ECAP goes nonuniformly in the whole material and is localized as deformation shear bands (Figure 4a,b). The shear bands are oriented according to orientation of major deformation axes during ECAP (at an angle of 22.5° to a workpiece axis) (see [57,58,61]). Local strain inside the shear bands is usually much greater than mean strain of a workpiece. As a result, α′-martensite content in localized shear bands would be much greater than on average in a specimens. During subsequent annealing, a bimodal multi-grained microstructure is formed. As one can see in Figure 6, areas of a non-recrystallized UFG microstructure were observed in recrystallized material at 750 °C. A uniform recrystallized austenite microstructure is formed when annealing temperatures rise (above 800 °C) (Figure 6).
Special attention should be paid to finding of α′-martensite in steel AISI 321 after ECAP at 450 °C. One can see (110) α′-martensite peaks expressed clearly in XRD curves for specimens obtained by ECAP at 450 °C (Figure 5). Note also that intensities of the α′-martensite XRD peaks for specimens obtained at 150 °C and 450 °C are comparable. Such a result is rather unexpected since an increase in ECAP temperature usually leads to a decrease in martensite content in deformed steel [1,8,9]. Although α′-martensite was observed in steel 304L earlier, after ECAP at 500 °C [109], no such observations were reported for steel AISI 321L. Unexpected results led to additional investigations, which confirmed the presence of α′-martensite after ECAP at elevated temperatures (see Appendix B).
In our opinion, there are two main reasons for considerable amounts of α′-martensite in steel AISI 321 specimens after ECAP at 450 °C.
First, it is worth noting that the rate of α′-martensite formation depends essentially on the mean austenite grain sizes [9,110]. It was noted in review [9] that even insufficient decreasing of the mean austenite grain sizes can lead to a strong decrease in the rate of α′-martensite formation. It is known [59,61] that the increasing of the SPD temperature leads to an exponential growth of the mean metal grain sizes. As it has been shown above, the mean grain sizes in steel AISI 321 after ECAP at 150 °C ad 450 °C were ~0.3 and 0.5–0.7 μm, respectively. The differences observed can lead to some increase in the α′-martensite contents in the steel AISI 321 samples after ECAP at 450 °C.
These differences can be essential enough in the case of multi-cycle ECAP when every next cycle increases the amount of martensite subject to the initial parameters of microstructure formed at the previous ECAP cycle. It was shown [9] that the intensity of changing of the mean grain sizes subject to the strain depends essentially on the SPD temperature. One can see in [111] that essential differences in the mean gain sizes (d1,d2,d3) for the materials deformed at different SPD temperatures (T1,T2,T3) can be observed at low deformation degrees. The differences in the grain sizes d1(T1), d2(T2), d3(T3) decrease with increasing strain (see [111,112]). We think that the dependence of α′-martensite content on the strain in ECAP of more coarse-grained materials can be comparable with similar dependence for more fine-grained materials in spite of a considerable difference in the SPD temperature.
The changes in the stress-strain state in the shear plastic zone in ECAP can be the second factor promoting the absence of essential differences in the α′-martensite contents after ECAP at 150 °C and 450 °C. The shear plastic zone may increase at elevated ECAP temperature. At reduced temperature, the shear plastic zone may increase due to incomplete fit of the lower part of the sample to the work channel wall [57,58,59,61]. It leads to a decrease in the effective strain rate in ECAP, which is calculated usually as the width of the shear plastic zone divided by the time of passing of the shear plastic zone by the material. The decreasing of the strain rate is known to result in an increase in the martensite content in austenite steel [6,7,9]. So far, the effect of the ECAP temperature can manifest itself indirectly via change in the martensite strain rate when changing ECAP temperature.
In our opinion, a synergetic effect of several factors takes place simultaneously in this case—(i) the effect of initial grain sizes, (ii) the step-by-step character of ECAP deformation, and (iii) the changes in the effective strain rate in ECAP. Simultaneous effect of all factors leads to the appearing of considerable amount of α′-martensite after ECAP at 450 °C.
The second feature of the microstructure of the UFG austenitic steel AISI 321 after ECAP is the presence of strongly fragmented δ-ferrite particles. As shown in Figure 2, there were strongly elongated δ-ferrite particles up to 0.5 mm long in the microstructure of steel AISI 321 in initial state. In the UFG steel after ECAP, the large δ-ferrite particles were absent. It should be stressed that the transformation of δ-ferrite into carbide particles (Fe3C, Me23C6) and σ-phase takes place at higher temperatures than the ECAP ones (150 °C, 450 °C) [1,27,28,29]. In our opinion, this allows suggesting a strong fragmentation of the δ-ferrite particles to take place during ECAP. The mean sizes of these particles in the UFG steel become comparable to the ones of the austenite grains (0.3–0.5 μm). The possibility of fragmentation of strong particles during SPD was demonstrated in [113]. We suggest the δ-ferrite particles to be distributed relatively uniformly inside the workpiece after SPD. The volume fraction of such strong particles in the steel microstructure was not too large (~2%) but the presence of these ones can affect the corrosion resistance of the steel. The δ-ferrite particles having BCC lattice and chemical composition different from the one of austenitic steel with FCC lattice can lead to the development of pitting corrosion in the steel.
Finally, the third feature of the object being studied is the nucleation of the σ-phase particles during heating of the UFG steel. The analysis of the electron microscopy results and of the results of investigations of the σ0(T) dependencies show the nucleation of the σ-phase particles to take place when heating the UFG steel up to 600 °C. At the moment, it is difficult enough to answer the question about the origin of the σ-phase particle nucleation. In our opinion, the transformation of δ-ferrite can be one of these origins [1,27,28,29]. We suggest the SPD can lead to an increasing of the degree of nonequilibrium in the δ-ferrite lattice. The formation of nonequilibrium microstructure in the materials leads to a considerable decrease in the temperature, which the diffusion processes and phase transformations begin at [114]. When heating, the strongly deformed δ-ferrite particles begin to transform at lower temperatures as compared with usual CG steels. This suggestion agrees satisfactory with the calculation of the contribution of the σ-phase particles into the magnitude of the macroelasticity stress of steel σ0 presented below. The increasing of σ0 in ~250 MPa observed at the annealing of the UFG steel can be provided by the nucleation of the particles of ~10 nm in size. According to Orowan equation, the volume fraction of such nanoparticles should be ~2%, which agrees well with the volume fraction of the δ-ferrite particles in the initial coarse-grained steel.

4.2. Investigation of Thermal Stability

First, one should pay attention to nucleation of σ-phase particles during annealing of UFG austenitic steels. It is noteworthy that nucleation of σ-phase particles was observed not in all grains. We believe that nucleation of σ-phase nanoparticles goes preferentially inside α–phase grains, the lattice constant of which is much less than that of γ-phase grains. Therefore, a supersaturated solid solution of chromium in α–phase grains is formed followed by nucleation with rising temperature. This leads to nucleation of σ–phase Fe–Cr particles during heating. We suppose that nucleation of chromium carbide Cr23C6 particles is hardly probable in this case since steel contains titanium, which reacts chemically with carbon and forms titanium carbide TiC. Possible nucleation of σ–phase particles during annealing of UFG austenitic steel AISI 321 was reported in [54,55].
Let us analyze austenite grain growth kinetics during heating of UFG steel. As shown above, grain growth starts at temperatures over 700 °C. At these temperatures, reverse transformation of martensite into austenite completes, and its effect on the austenite grain growth can be neglected. At the same time, it is worth noting that σ-phase nanoparticles formed can affect austenite GB migration during annealing of UFG steel AISI 321. The analysis of grain growth revealed that activation energy of the recrystallization (QR) determined by the slope of ln(dn−d0n) − Tm/T dependence is 6.0–8.3 kTm (~90–125 kJ/mol) (Figure 6a). The uncertainty of determining the QR was ±1 kTm. The melting point of steel was taken to be Tm = 1810 K. QR weakly depends on the number of ECAP cycles or on ECAP temperature. In calculations, n coefficient was taken as n = 4 [8] that corresponds to GB migration with particles nucleating along those GBs [115]. Recrystallization activation energy was ~20–30% less than equilibrium activation energy of GB diffusion in austenite Qb ~ 10.6 kTm (159 kJ/mol [116]). We reckon that this result proves that nonequilibrium GBs in UFG steels obtained by ECAP. The GBs in UFG materials to contain an increased concentration of defects—orientation mismatch dislocations (OMDs) and products of delocalization of the ones (tangential components of Burgers vectors of delocalized dislocations) [61]. Higher density of defects in GBs leads to an increase in free (excess) volume of the GBs in UFG material [61] and, as a consequence, to a decrease in activation energy of the grain boundary diffusion [61]. Earlier, a decrease in recrystallization activation energy in UFG metals was also observed [59,61].
Note also that at n = 2, recrystallization activation energy QR takes non-physical values (3–4.3 kTm ~ 45–63 kJ/mol), which appear to be smaller than activation energy of diffusion in the iron melt. In our opinion, this is an indirect indication that nucleating σ-phase nanoparticles affect grain boundary migration in deformed austenitic steel.

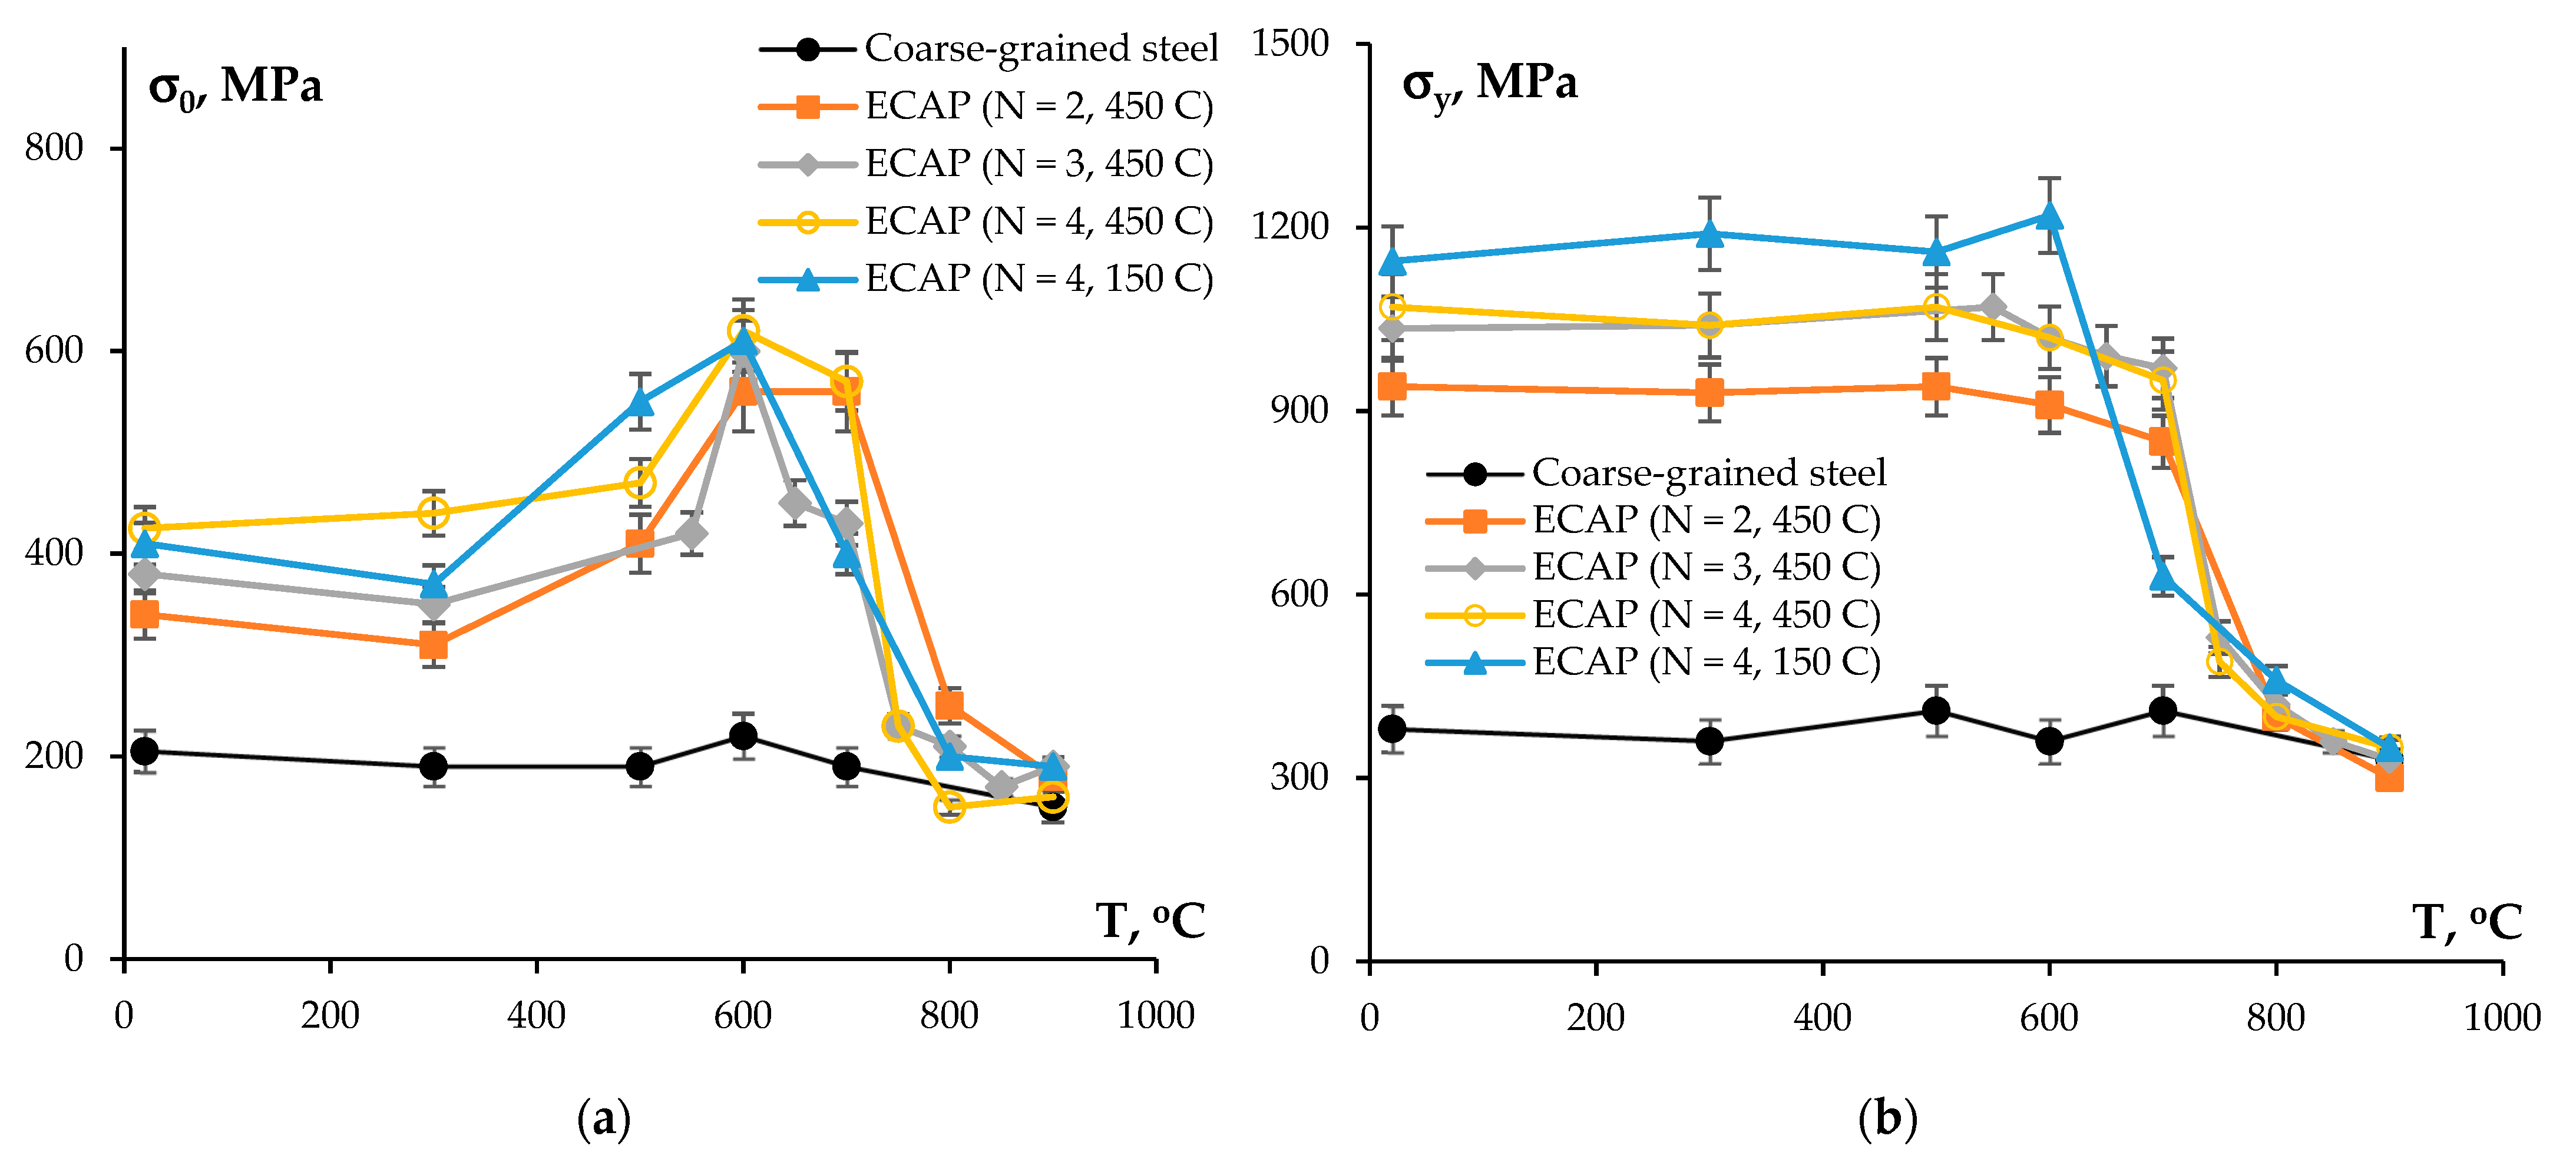
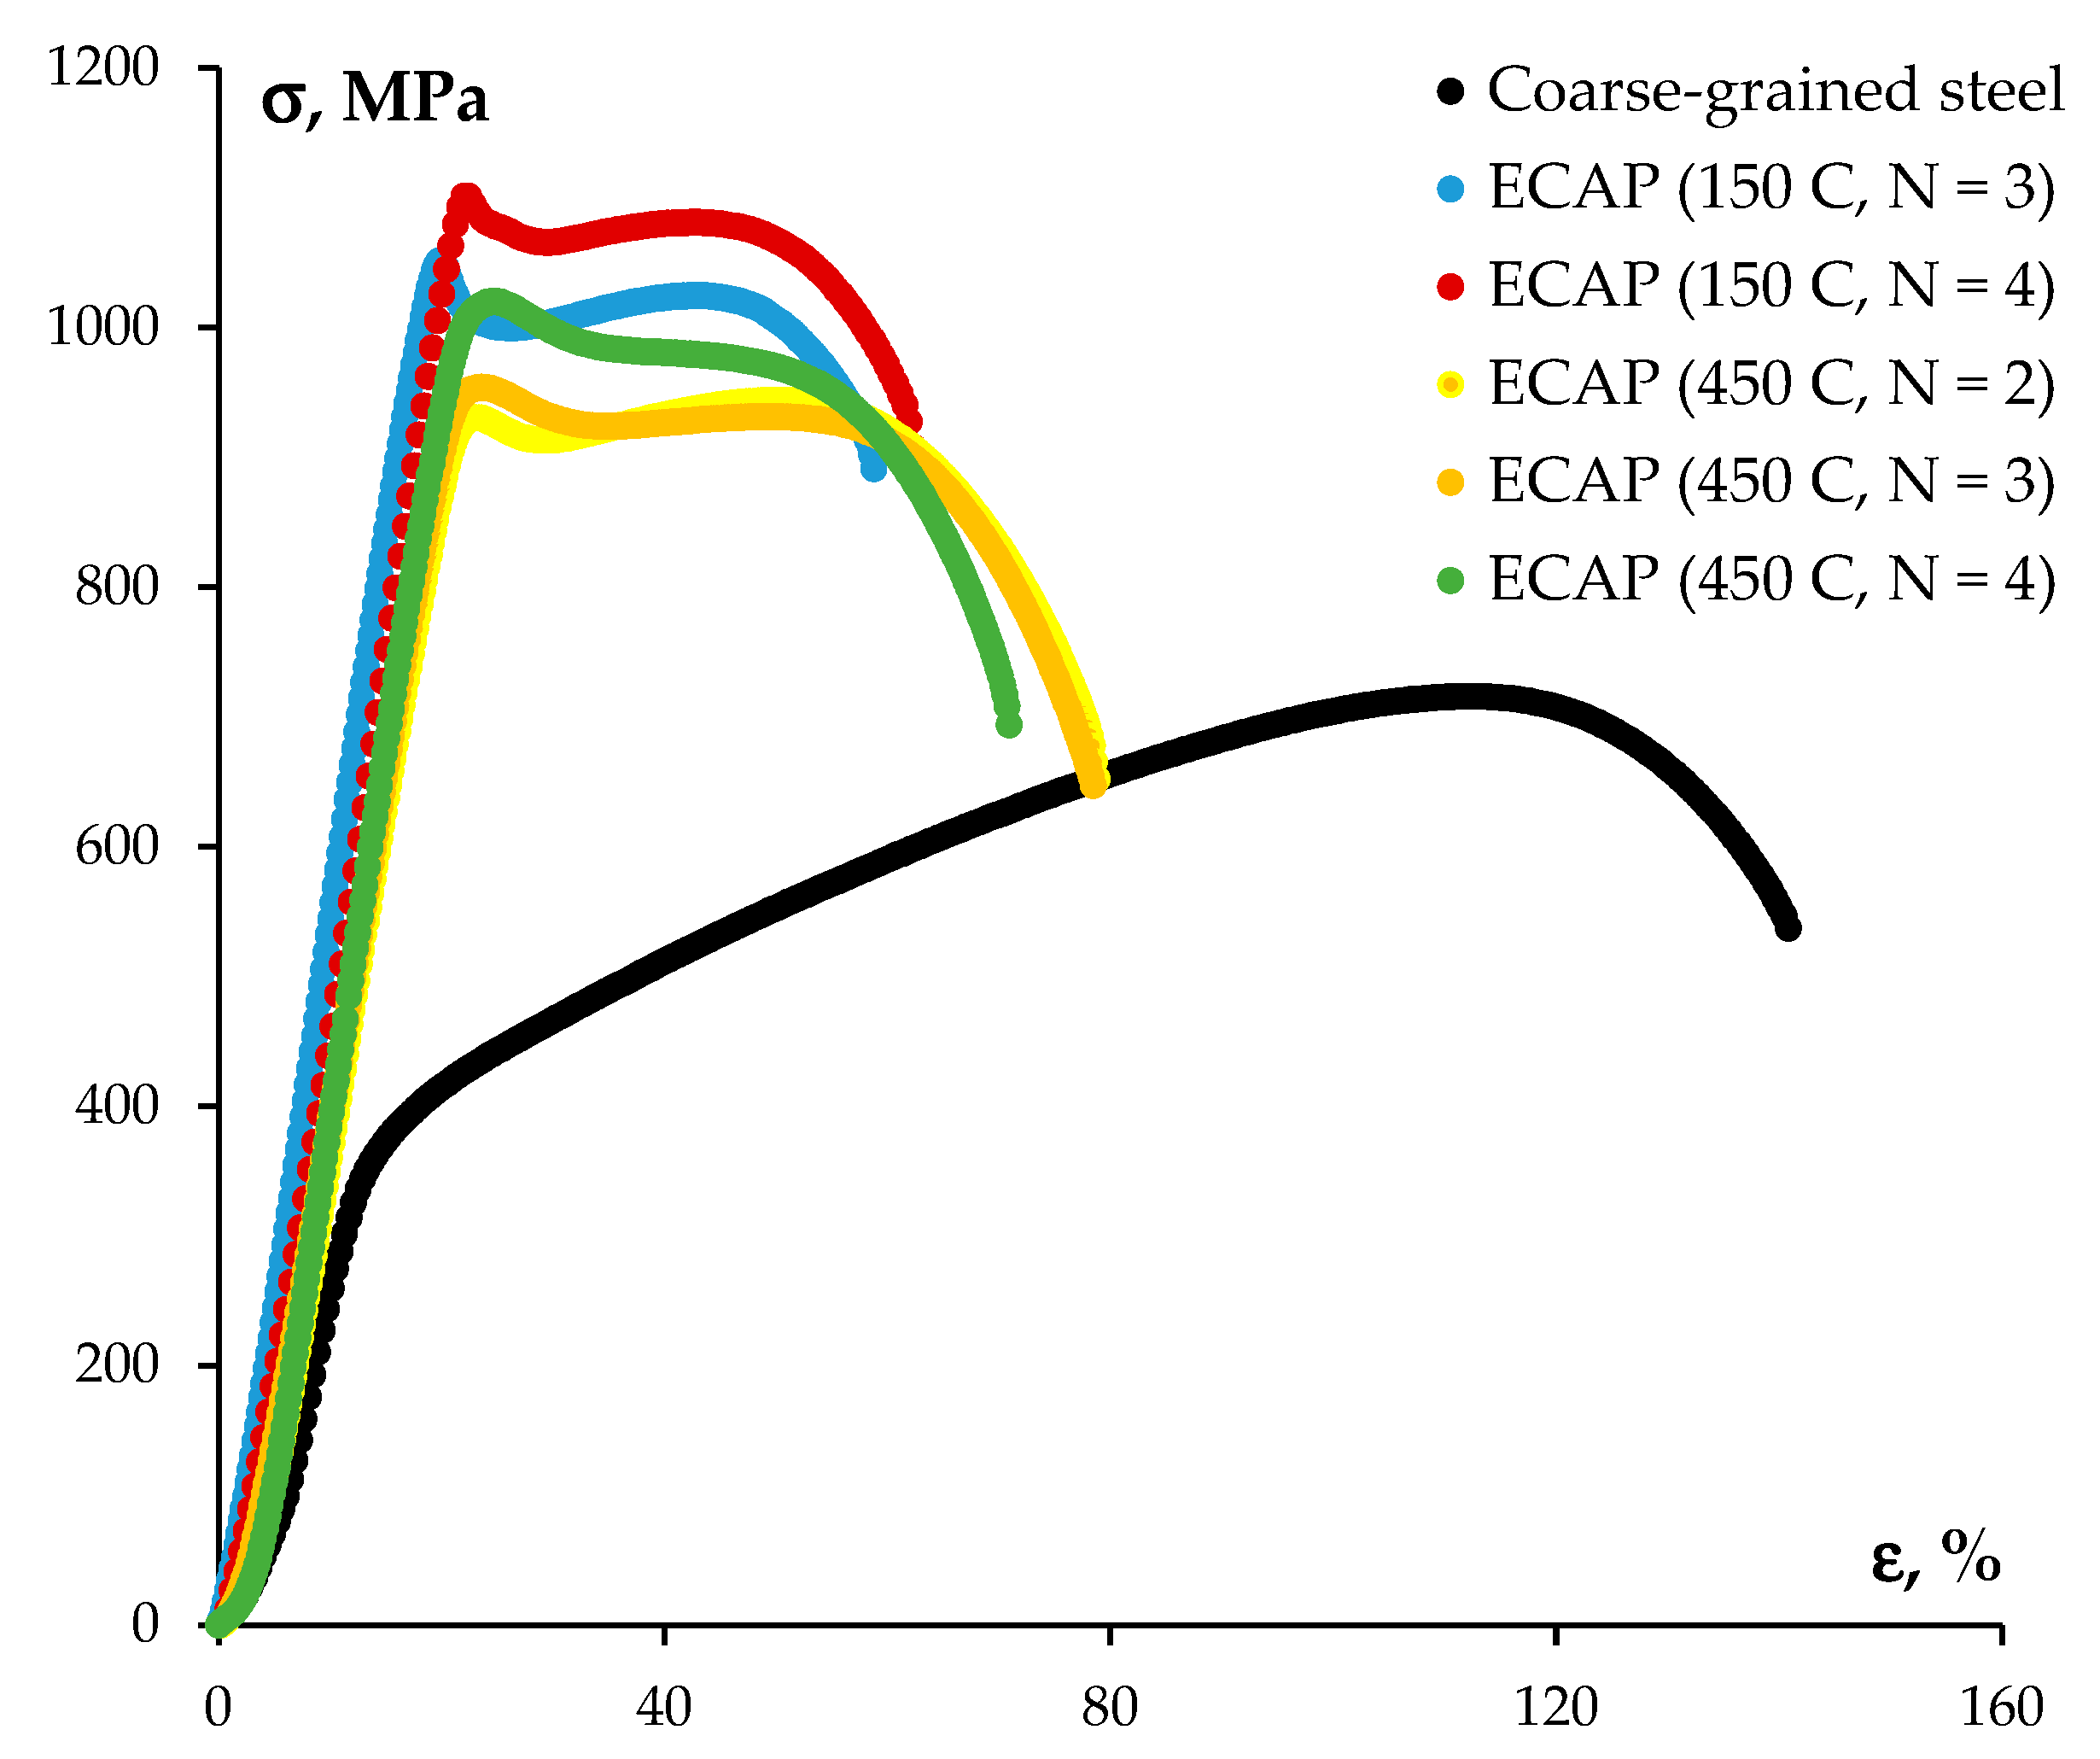
4.3. Mechanical Properties of the UFG Steel

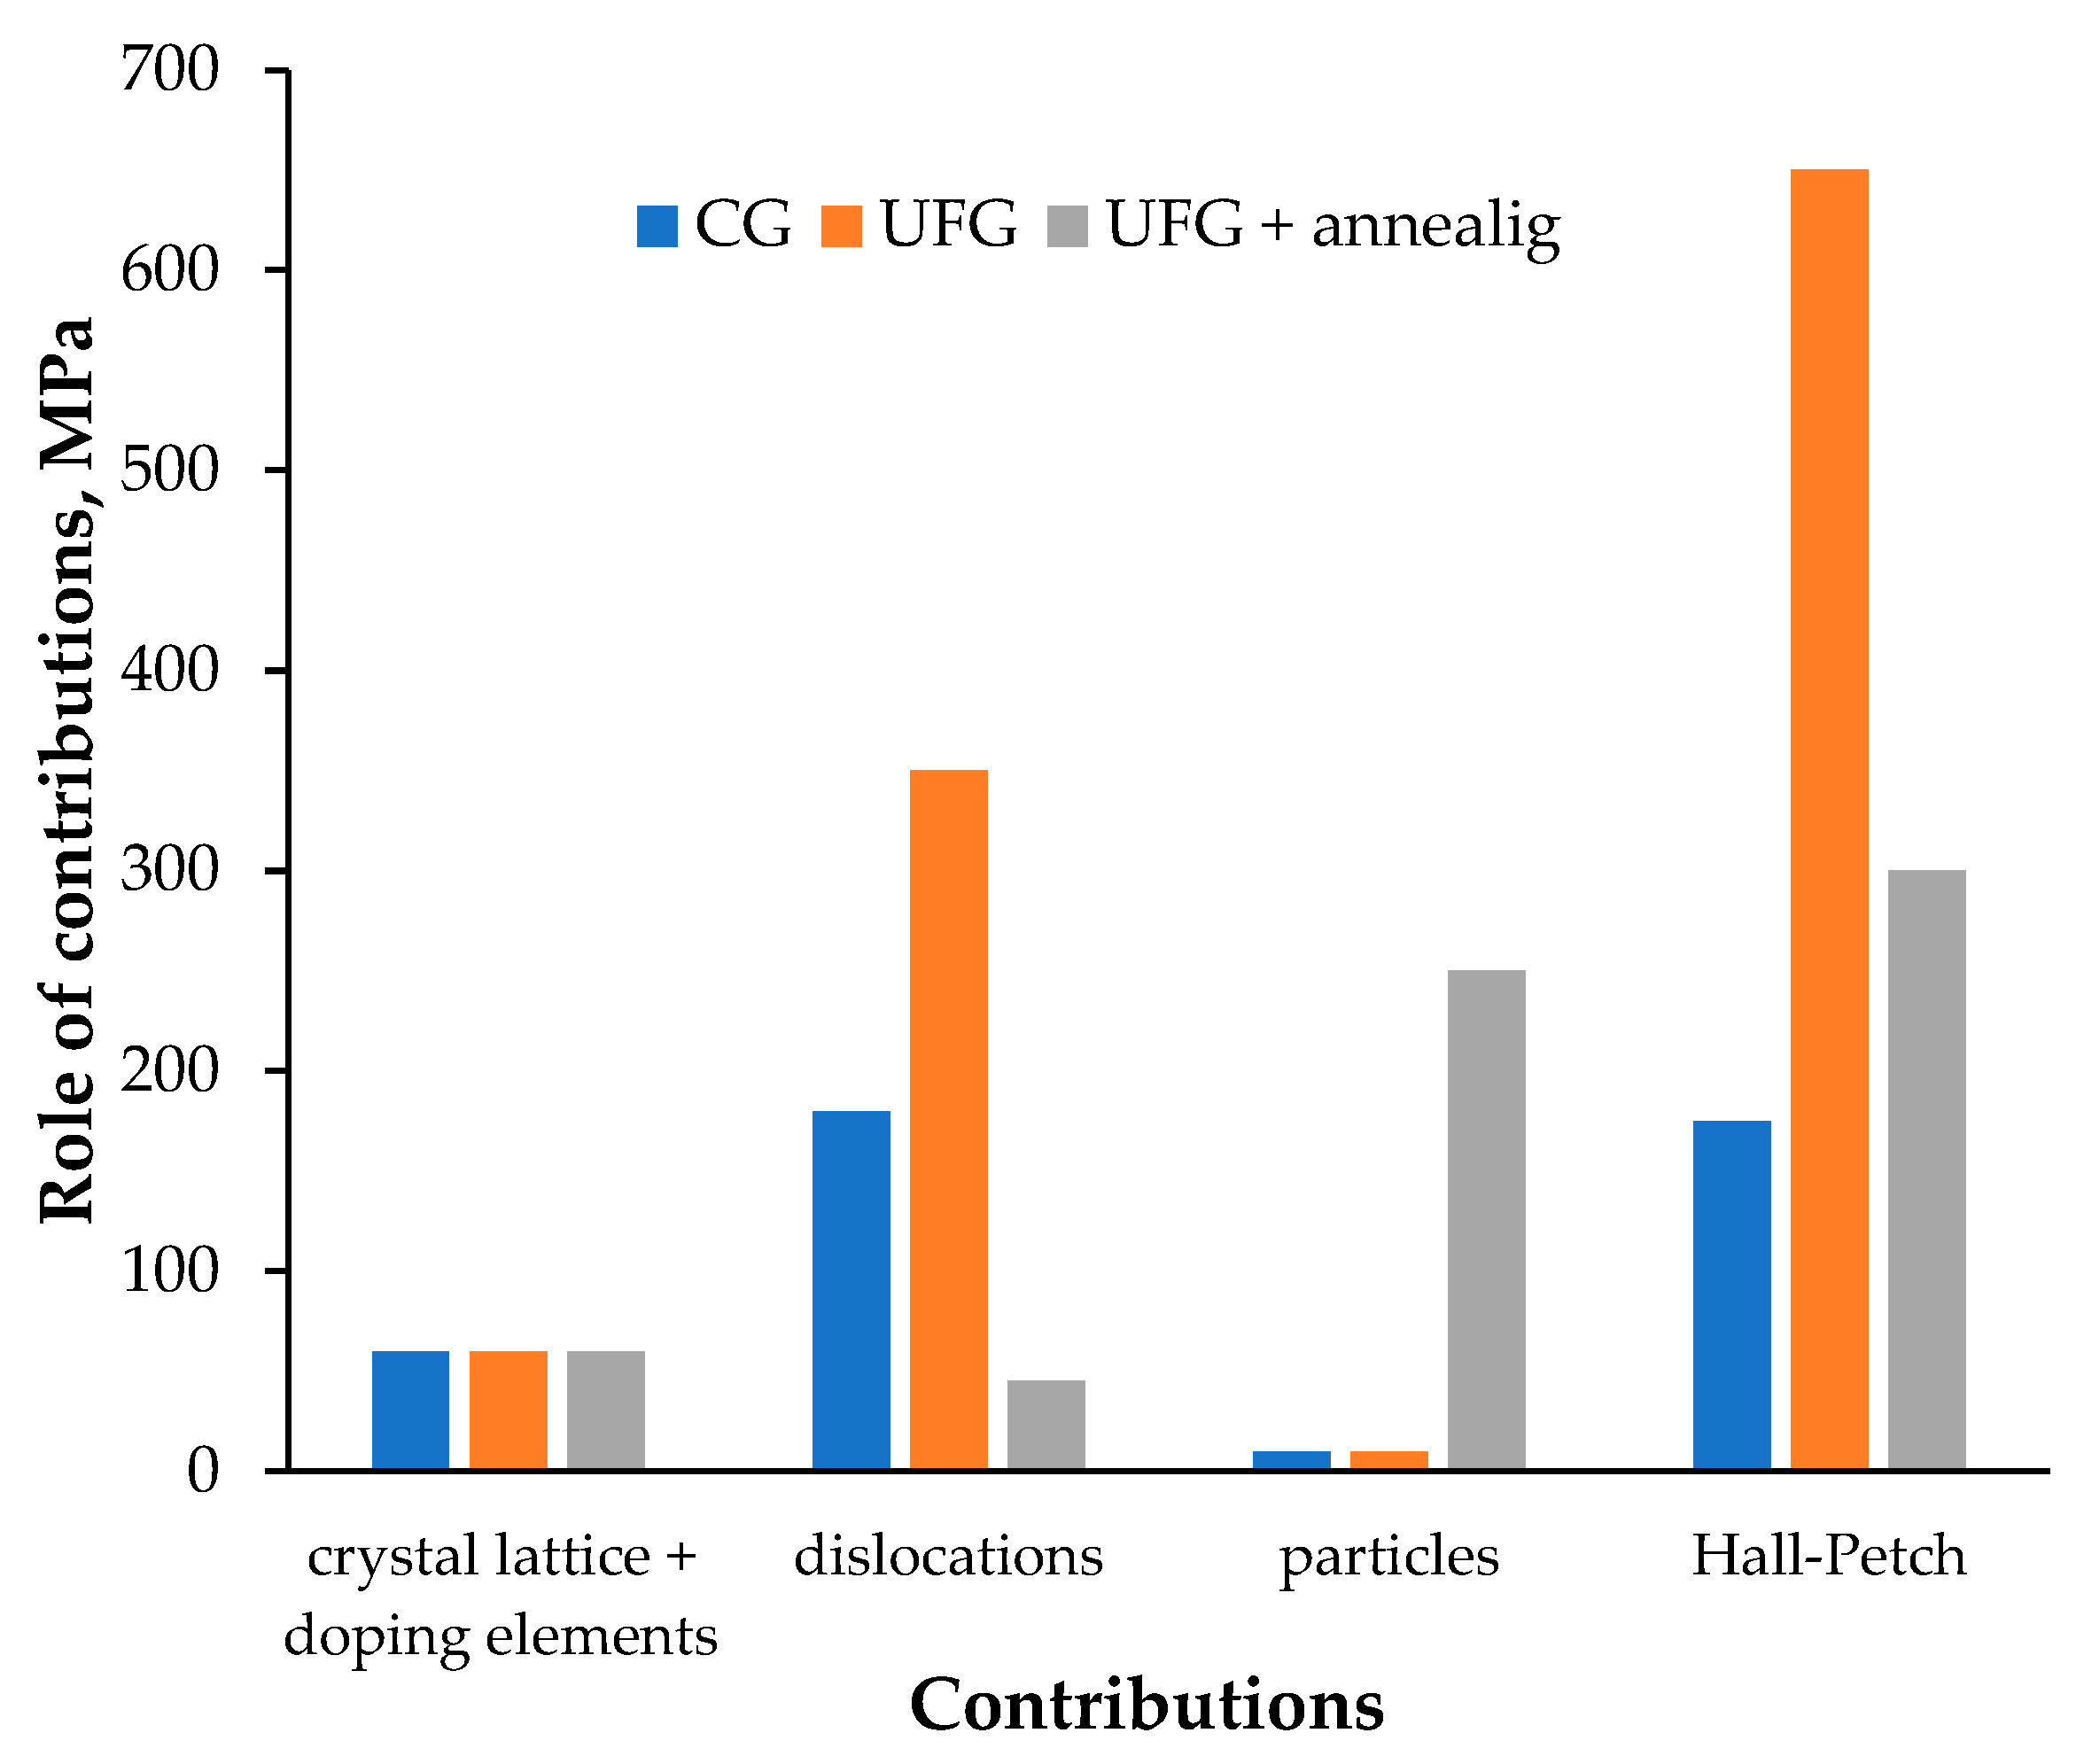
4.3.1. Steel after ECAP: Hall Petch Contribution

Yield strength σy in fine-grained austenitic steel can be calculated using Hall–Petch Equation (1) (see [1,5,42,43,44]) where macroelasticity stress σ0 in the first approximation can be calculated as the sum of the following contributions [117,118]:
σ 0 = σ PN + A i C i + α 1 MGb ρ v + 2 α 2 MGb / λ
where σPN is the stress of crystal lattice austenite, σ c = A i C i accounts for contributions of doping elements into the strengthening of austenite (Ai is the contribution of the ith doping element, the concentration of which is Ci), σ d = α 1 MGb ρ v is the contribution of the dislocations (ρv being the density of lattice dislocations), σ p = 2 α 2 MGb / λ is the contribution of secondary particles (λ is the distance between particles), where G = 81 GPa is the shear modulus, b = 0.258 nm is the Burgers vector, α1 = 0.3–0.67 is a numerical coefficient depending on the character of the distribution and of the interaction of the lattice dislocations, α2 = 0.5 is a numerical coefficient, M = 3.1 is the orientation factor (the Taylor coefficient).
According to [117,118], the contribution of doped austenite crystal lattice is σPN = 60–70 MPa. The effect of titanium nitride and carbonitride particles can be neglected in the first approximation since nucleated particles were large enough (Figure 3d) and were located far from each other at λ = 5–10 μm, the contribution of particles is σd ~ 10 MPa.
Since the effect of Ni in austenite hardening is small [117], one can assume that dislocation hardening contributes the most to macroelasticity stress of austenitic steel (σ0 = 240 MPa). The magnitude of σd = σ0 − σPN = 170–180 MPa at α1 = 0.3 corresponds to the dislocation density of ρv ~ 8·1013 m−2 whereas at α1 = 0.67 to ρv ~ 1.5·1013 m−2. This estimate of ρv agrees well with the data reported in [59,60,61].
For mean value of Hall–Petch coefficient KHP = 0.46 MPa·m1/2 (Figure 8b) and mean austenite grain size dγ ~ 20 μm (Figure 3a), effect of GB hardening σgb = KHP·d−1/2 in CG steel is ~105 MPa. The calculated value of yield strength of CG steel σy = 240 MPa + 105 MPa = 245 MPa was lower than the value measured experimentally (380 MPa).
In our opinion, there are two main reasons for a discrepancy between calculations and experimental data.
First, it is worth noting that large particles of δ-ferrite in a microstructure of austenitic steel can impede micro- and macro-deformation. The conventional approach to calculating yield strength of steel with such a composite microstructure consists of accounting for volume fraction and yield strength of δ-ferrite [30]: σ y = f γ σ y γ + f δ σ y δ , where fγ and fδ are volume fractions of austenite (γ-Fe) and of δ-ferrite, σy(α) and σy(δ) are yield strength of austenite and δ-ferrite, respectively. A similar approach can be used to calculate the ultimate strength (σb) of CG steel with large δ-ferrite particles. Regretfully, at present it is impossible to measure yield strength of δ-ferrite σy(δ) correctly. Therefore, at present it is impossible to estimate the effect of such meso-barriers on ultimate strength correctly.
The second effect, from our perspective, is the effect of GB structural and phase state on the Hall–Petch coefficient KHP. It leads to an essential difference of the mean value of KHP calculated from the dependence σy − d−1/2 from the Hall–Petch coefficients in the CG steel (K0) and in the UFG steel (KHP1). In [1,5,61,119] it was shown that the Hall–Petch coefficient in the UFG materials can essentially differ from KHP coefficient in CG materials. A conventional approach to determining an mean value of the Hall–Petch coefficient based on the slope of σy−d−1/2 dependence implies that σ0 and KHP values are constant for the whole set {σy1, σy2, …, σyn} and {d1, d2, …, den}. One can see from Figure 8a and Figure 9a, σ0 is not constant during ECAP and annealing of austenitic steel AISI 321.
The intensities of increasing macroelasticity stress σ0 and yield strength σy with an increase in the number of ECAP cycles (N) were different (Figure 8a). Data presented in Figure 8a shows that σgb = σy − σo = KHPd−1/2 in the initial state is 175 MPa and rises to σgb = 645–655 MPa along with an increase in the number of ECAP cycles to 3–4 at 450 °C. It should be emphasized that at the same time, the Hall-Petch coefficient calculated in line with KHP = (σy − σo)·d1/2 (see Equation (1)) decreased monotonically along with an increase in the number of ECAP cycles. The KHP for CG steels was 0.78 MPa·m1/2. After N = 3 and N = 4 ECAP cycles at 450 oC, it dropped to 0.46 and 0.35 MPa1/2, respectively. A similar effect was observed for UFG steels obtained by ECAP at 150 °C. So far, we can conclude that the Hall-Petch coefficient in UFG steels is smaller than in CG steels.
In our opinion, KHP decreasing during ECAP is associated with fragmentation of strongly elongated δ-ferrite particles. Harder δ-ferrite particles crossing austenite grains (Figure 3) can often impede deformation propagation in austenite grains. In our opinion, strong fragmentation of harder δ-particles during ECAP helps to eliminate an additional type of meso-barrier obstacles and promotes micro- and macro-deformation. In our opinion, fragmentation of large δ-ferrite particles is one of the possible reasons for uniform strain flow stage on stress–strain tension curves (Figure 10).
With KHP0 = 0.78 MPa·m1/2 for CG steel (see above) and dγ ~ 20 μm (Figure 3a), we observe the effect of GB strengthening in CG steel σgb ~ 175 MPa (Figure 16). In this case, yield strength of CG austenitic steel calculated with regards to the Hall–Petch coefficient corrections: σy = 240 MPa + 10 MPa + 175 MPa = 425 MPa (Figure 16). Calculated yield strength agrees well with yield strength measured experimentally (σy = 380 MPa).
Macroelasticity stress and yield strength for UFG steels after N = 4 ECAP cycles were 410–425 MPa and 1070–1145 MPa, respectively. Since σPN, σc, and σp contributions (see Equation (2)) do not change during ECAP, in our opinion, the increasing in macroelasticity stress in 30–45 MPa stems from lattice dislocations density rising to ~1.2·1014 m−2 (at α1 = 0.3) whereas an increasing in yield strength—from grain sizes going down to a submicron level.

4.3.2. Effect of Annealing: Contribution of σ-Phase Particles

As shown in Figure 9a, an increase in macroelasticity limit in ∆σ0 ~ 200 MPa was observed after annealing UFG steels at 600 °C. According to electron microscopy results, macroelasticity stress rises due to nucleation of σ-phase particles, the sizes of which are R ~ 10–15 nm (Figure 7a).
Let us assume that the effect of σ-phase nanoparticles on σ0 can be calculated using the Orowan equation [117,118]:
Δ σ 0 = α 2 MGb f v / R
where fv is the volume fraction of σ-phase particles.
At G = 81 GPa, b = 0.258 nm, α2 = 0.5, M = 3.1, and R = 15 nm, an increase in macroelasticity stress amounts to ∆σ0 ~ 250 MPa (Figure 16) that agrees very well with experimental data (Figure 9a). So far, it can be concluded that an increase in macroelasticity stress during annealing of UFG steels results from nucleation of σ-phase nanoparticles.
In increase in yield strength (∆σy) during annealing of UFG steel appeared to be much less than ∆σ0. In our opinion, this ca be explained by increased density of defects contained in nonequilibrium GBs in UFG steel. According to [61], grain boundary defects generate long-range fields of internal stresses ∆σgb preventing dislocation sliding near GBs. Density of grain boundary defects decreases during heating which leads to a decreasing in their contribution to yield strength of UFG steel. So far, yield strength changes very little while nonequilibrium GBs recover during annealing of UFG steel: an increase in macroelasticity stress ∆σ0 is offset by the contribution of grain boundary defects ∆σgb.

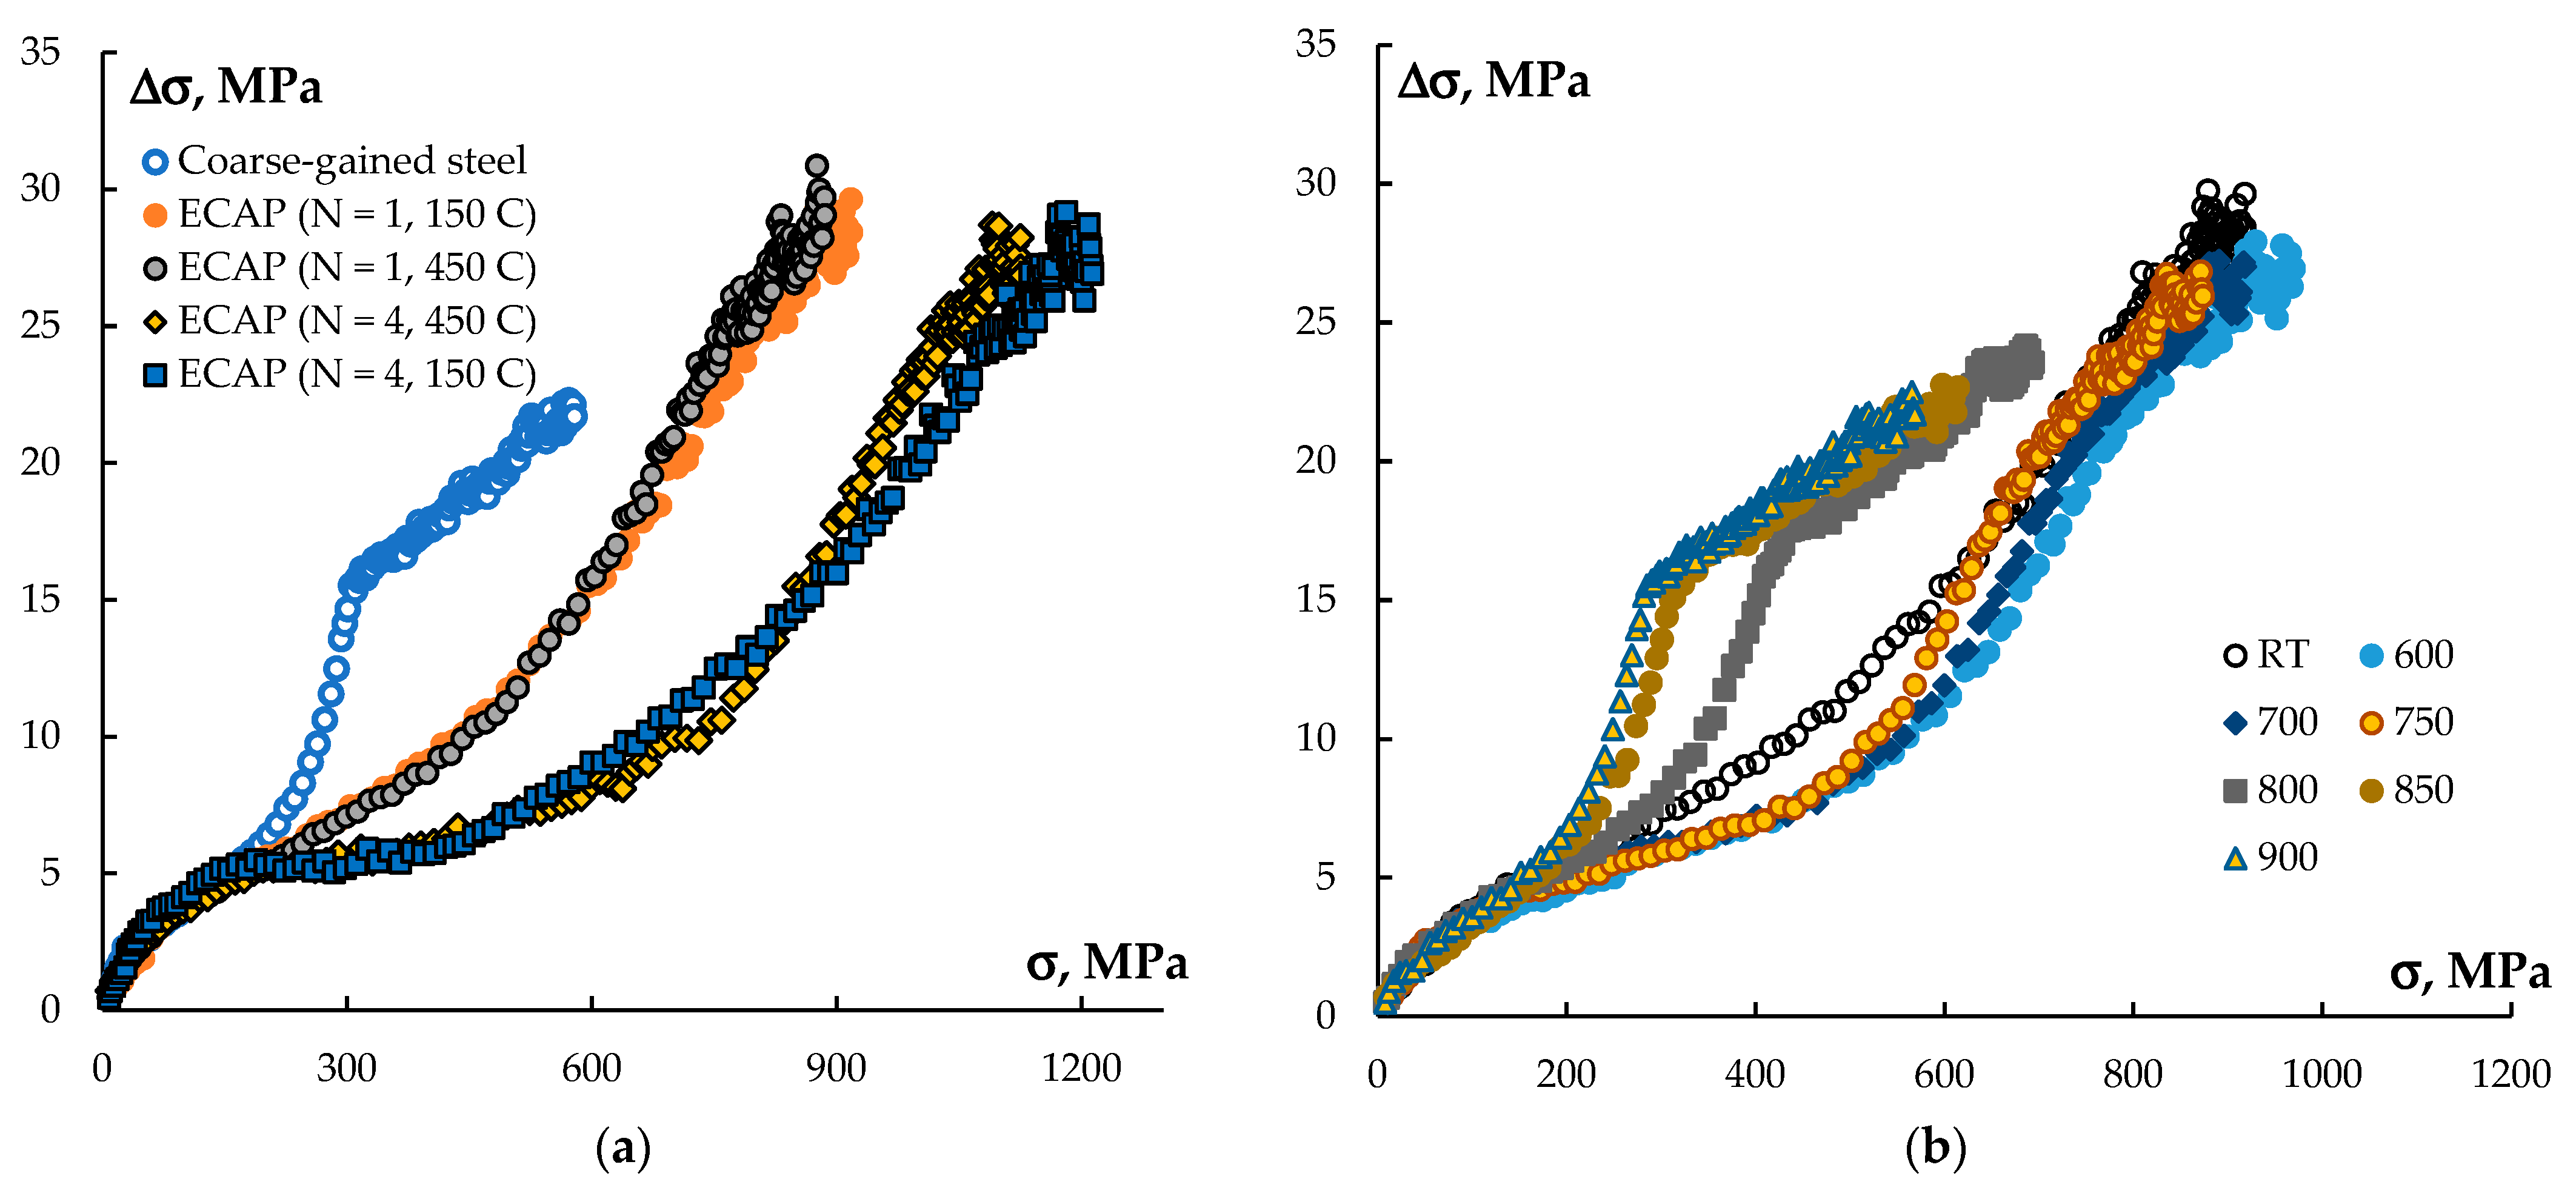
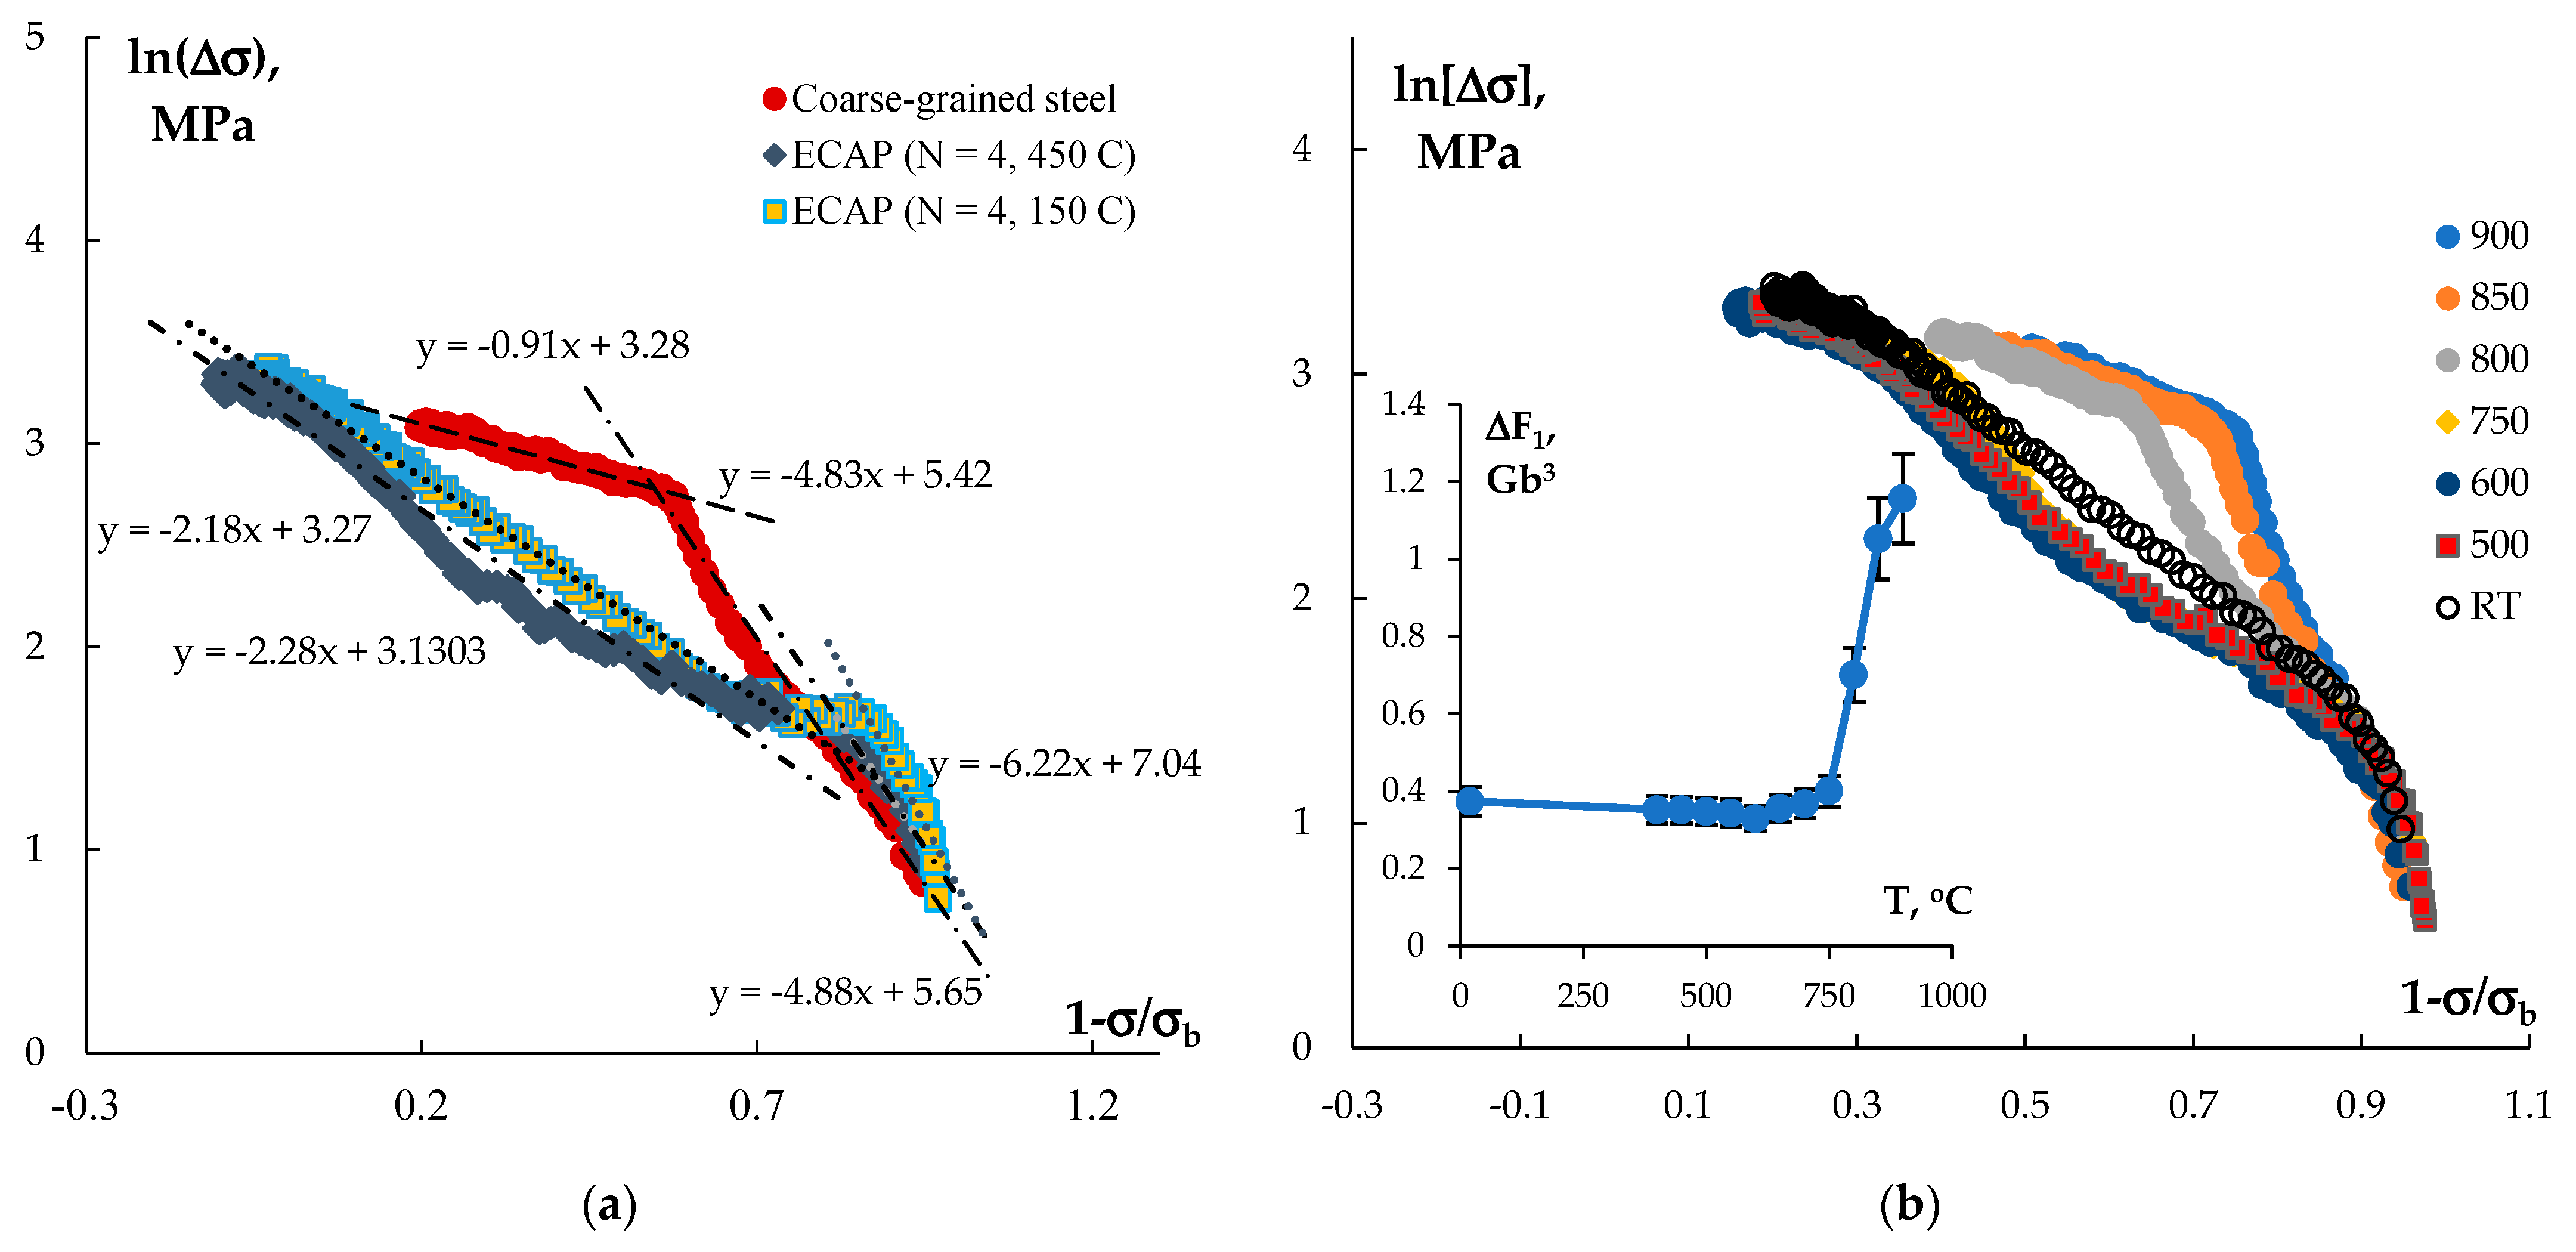
4.4. Stress-Relaxation Resistance

As shown above, UFG steel had higher stress-relaxation resistance—stress-relaxation magnitudes ∆σi in UFG steel was much smaller under the same stress (Figure 12a). Let us analyze stress-relaxation mechanisms in UFG steel underlying their improved SRR.
In general, accommodative reconstruction of a defect microstructure (first of all—of the dislocation one) is well known to be the primary stress-relaxation mechanism. In CG materials at RT, lattice dislocation glide in the field of uniformly distributed point defects occurs most often. The dependence of strain rate ε ̇ on the stress σ in this case can be described as follows:
ε ̇ = ε ̇ 0 exp Δ F / kT 1 σ / σ *
where ε ̇ 0 is pre-exponential factor, ∆F is activation energy of dislocation glide depending on the type of barriers, k is the Boltzmann constant, and σ* is non-thermal flow stress, which can be taken as equal to ultimate strength at 0 K [116]. The procedure of recalculating ultimate strength σb at RT into ultimate strength at 0 K is described in [116].
In the first approximation, strain rate during stress-relaxation tests can be accepted to be proportional to stress-relaxation rate: ε ̇ = σ ̇ / E , where E is elastic modulus. Stress-relaxation rate can be calculated as σ ̇ = Δ σ / t r . Since stress relaxation time tr = 60 s and E = 217 GPa were the same for all specimens, activation energy ∆F/kT can be determined by the slope of ln(∆σ) − 1−σ/σb dependence (Figure 17a).
As shown in Figure 17a, ln(∆σ) − 1−σ/σb dependence for CG steel has a two-stage character. Activation energy during microplastic deformation is ∆F1 ~ 4.8 kT (~0.62 Gb3) that agrees well with the data published in [116] (~0.5 Gb3 for steels 304 and 316 [116]). It is possible to conclude that gliding of lattice dislocations in the long-range stress field from other lattice dislocations is the main stress-relaxation mechanism during microplastic deformation stage. At increased stresses, activation energy tends to ∆F2 ~ 0.9 kT (~0.12 Gb3). According to the classification of [116], barriers with ∆F < 0.2 Gb3 are classified as weak barriers to dislocation motion. In the case of CG steel deformed during macro-deformation stage, austenite GBs can be treated as such obstacles.
In the case of the UFG steel, increased ∆F1 ~ 4.9–6.2 kT (~0.63–0.80 Gb3) was observed at small stresses only. In the range of micro- and macroplastic deformation, activation energy was ∆F2 ~ 2.2–2.3 kT (~0.28–0.30 Gb3). In UFG metals, GBs are the main type of barriers impeding lattice dislocations gliding. In this regard, it can be assumed that long microplastic deformation characterizes the overcoming of GBs by lattice dislocations.
Note that magnitude of ∆F2 in UFG steel (~0.28–0.30 Gb3) is considerably greater than that in CG steel (~0.12 Gb3).
Nonequilibrium GBs in UFG metals are known to have increased density of OMDs featured by ρb∆b and OMD delocalization products—the tangential (“sliding”) components of the Burgers vectors of delocalized dislocations featured by wt densities [61]. Defects introduced into GBs during ECAP generate long-range internal stress fields, which impede lattice dislocation sliding inside austenite grains and prevent dislocation clusters forming at GBs [61]. In our opinion, this factor is the primary reason for growing strain activation energy required to overcome GBs in UFG steel. This assumption is supported indirectly by changes in activation energy ∆F2 during annealing of UFG steel (Figure 17b). As can be seen in Figure 12b, recrystallization annealing of UFG steels leads to a change in stress-relaxation curves ∆σi(σ). UFG steel annealed at temperatures below 700 °C (corresponding to the start of recrystallization) lead to no essential changes in ∆F2 ~ 2.70–2.92 kT (0.34–0.37 Gb3). After annealing at 750–800 °C, ln(∆σ) − 1−σ/σb dependence turned into a two-stage one while ∆F2 decreases monotonically from 1.39–1.49 kT (0.17–0.19 Gb3) (Figure 17b). It is interesting to note that activation energy ∆F1 for annealed UFG steels increases monotonically from 5.6 kT (0.70 Gb3) at T = 800 °C up to 9.2 kT (1.16 Gb3) at T = 900 °C (Figure 17b). In our opinion, this result stems from nucleation of σ-phase particles during heating (Figure 8).
So far, the formation of long-range internal stress fields from the nonequilibrium GBs, which prevent the free motion of lattice dislocations (prevent accommodative reconstruction of the defect structure), is the reason for increased stress-relaxation resistance in UFG steel.
Changes in phase composition of steels can be an additional factor conducive to higher stress-relaxation resistance during ECAP. As follows from XRD investigations, steel after N = 4 ECAP cycles contains from ~ 7–8% up to 17–18% of stronger (α′ + δ)-phase particles. Under the same external stress, stress-relaxation magnitude in stronger (α′ + δ)–phase will be smaller than that in γ-phase. In this regard, higher content of stronger α′(δ)–phase particles can promote higher stress-relaxation magnitude of UFG steel.

4.5. Corrosion Resistance

Analysis of corrosion tests proves that ECAP result in an insufficient increase in uniform corrosion rate Vcorr calculated according to the Tafel method. Besides, the analysis of DLEPR electrochemical test results demonstrated that UFG steel a more susceptible to IGC as compared with the CG steel. It should be emphasized that despite increased tendency to IGC, UFG steels fully meet GOST 9.914-91 requirements in terms IGC resistance.
In our opinion, an increase in martensite fraction and, hence, formation of a two-phase γ + α microstructure cause higher corrosion rates and reduce IGC resistance in UFG steels. Martensite particles with a different chemical composition (unlike austenite) have a higher corrosion (dissolving) rate [11]. Therefore, an increase in the volume fraction of martensite will lead to higher uniform corrosion rates according to the ordinary rule: Vcorr = fγVγ + fαVα, where Vγ and Vα are dissolving rates for γ- and α-phases, respectively.
The formation of the two–phase microstructure leads to the appearing of the austenite–martensite microgalvanic couples in the material. These are spots of accelerated corrosion destruction during the electrochemical IGC tests. So far, a bigger fraction of martensite ensures an increase in uniform corrosion rate and IGC one.
The second factor conducive to poorer IGC resistance of steels after ECAP can be redistribution of doping elements (chromium and nickel) during SPD. In [120], GBs in nanocrystalline austenitic steel Fe-12%Cr-30%Ni with the grain size ~60 nm were shown to be enriched with nickel after SPD but to have a reduced chromium concentration. The width of near-boundary zone enriched with nickel was predicted theoretically to increase with rising temperature [120]. Strain-induced segregation of Ni atoms along austenite GBs was used to explain the formation of ferromagnetic clusters along GBs in the Fe-12%Cr-30%Ni and Fe-12%Cr-40%Ni steels during SPD [121]. Such a strain-induced decomposition of solid solution Fe–Cr–Ni would promote an accelerated electrochemical corrosion near GBs in UFG steel AISI 321L.
σ-phase particles nucleation is another factor that should be taken into account when analyzing the results of investigations corrosion resistance in UFG steel. As shown in Figure 7, nucleation of σ-phase nanoparticles distributed nonuniformly inside specimens during annealing of UFG steel was observed. Data presented in Figure 15 shows that σ-phase particles nucleation raises IGC rates in UFG steel. Since no preferential nucleation of σ-phase particles along GBs was observed (see Figure 7a), this effect is quite unexpected. In our opinion, depletion of austenite GBs with chromium reduces corrosion resistance in annealed UFG steel (see, [120]).

5. Conclusions

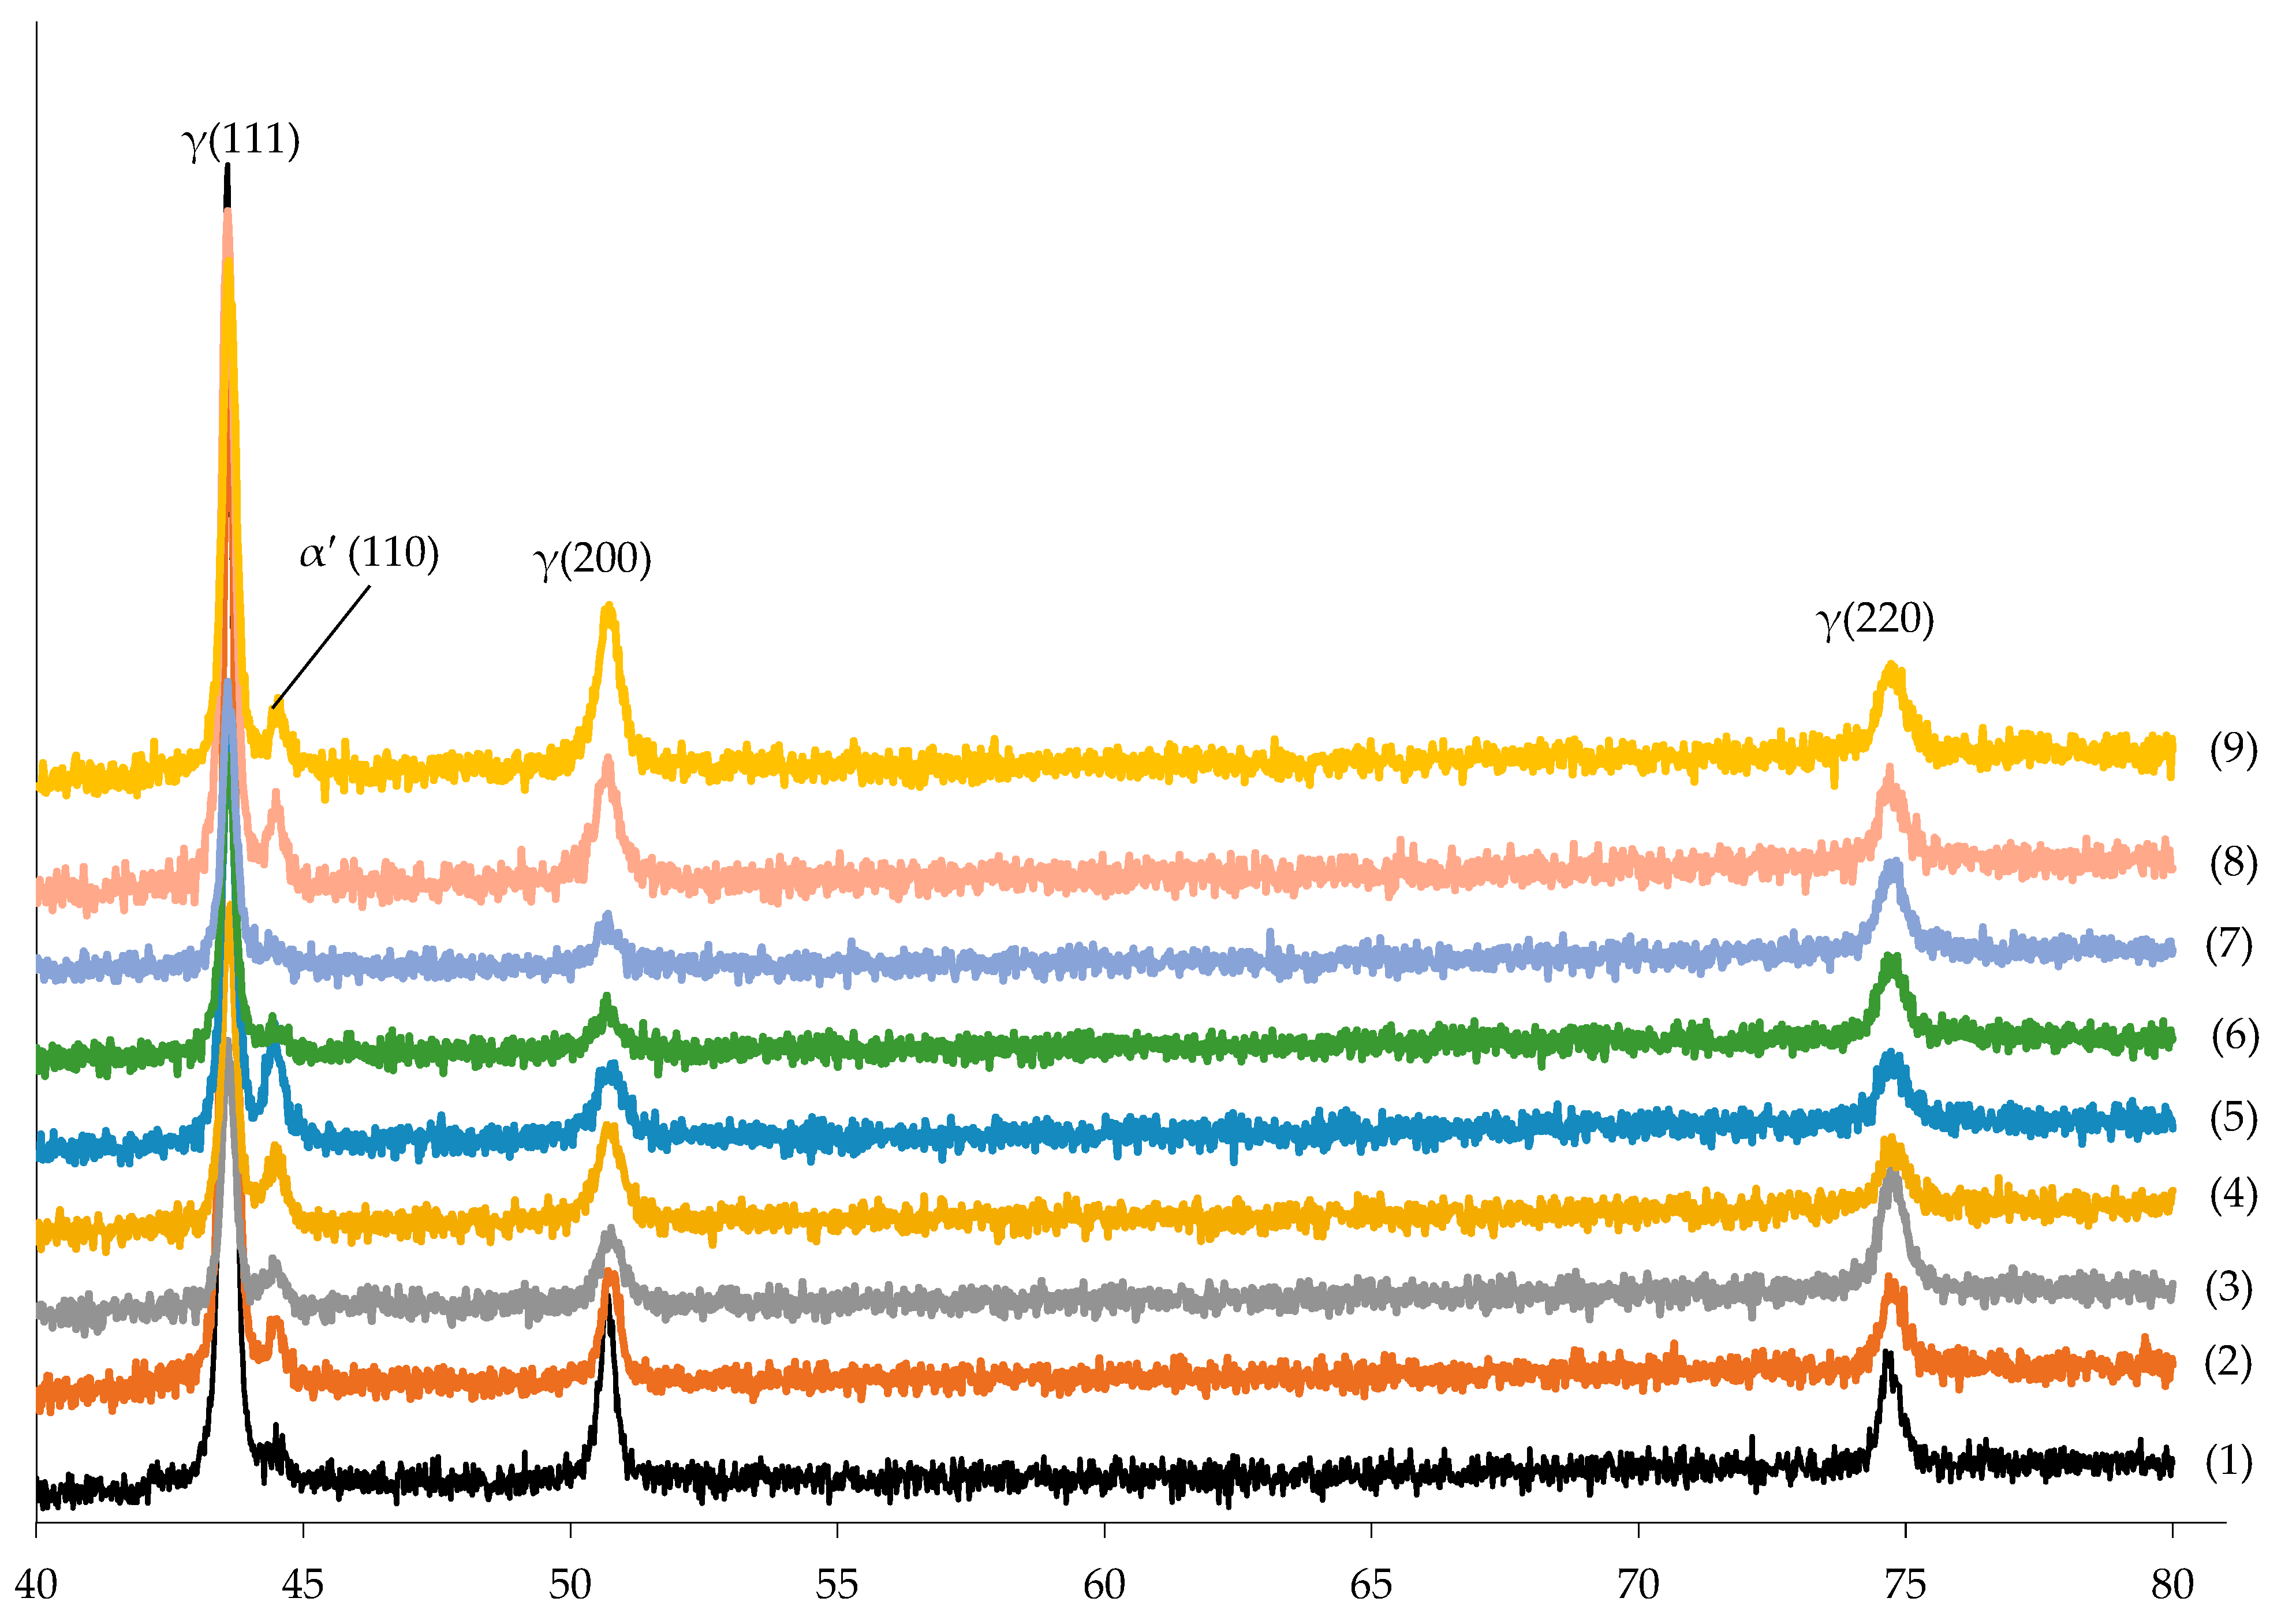
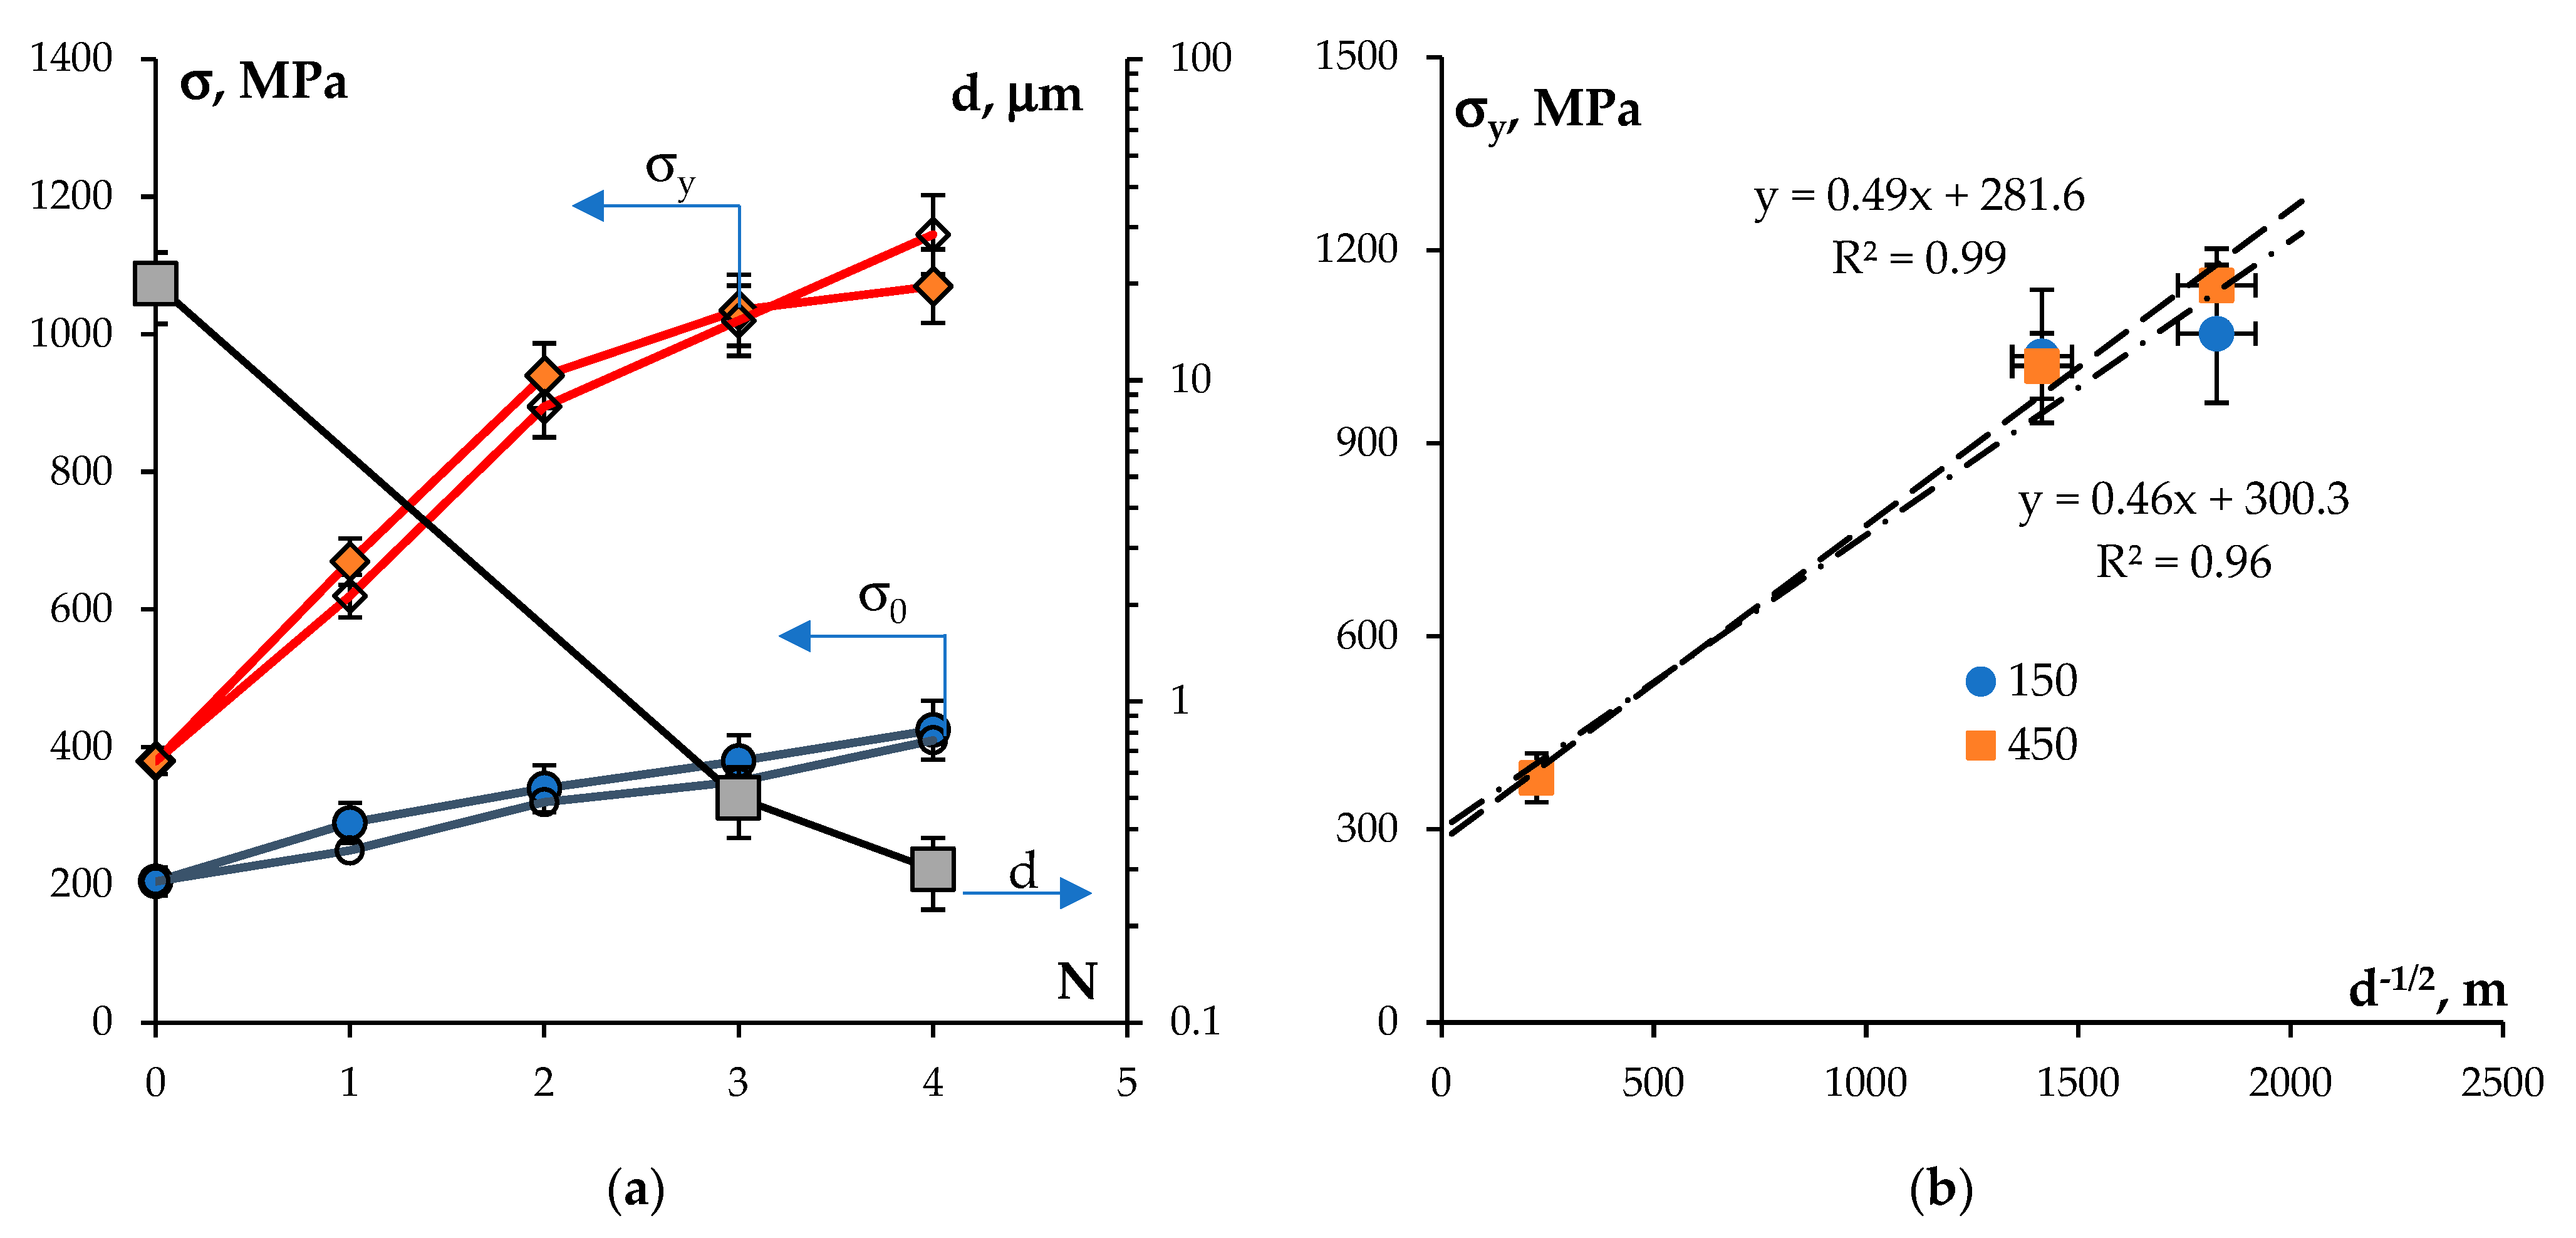
  • UFG steel specimens with improved mechanical properties were obtained by ECAP. After N = 4 ECAP cycles at 150 °C and 450 °C, ultimate strength values of steel were 1100 and 1020 MPa, respectively. Higher steel strength during ECAP results from an increase in dislocation density and modification of a grain structure down to a submicron scale. Uniform strain flow stages were observed on σ(ε) stress–strain curves of UFG steels at room temperature. XRD phase analysis revealed that strain–induced martensite forms during ECAP. The martensite content in a UFG steel microstructure achieved 15–16%.
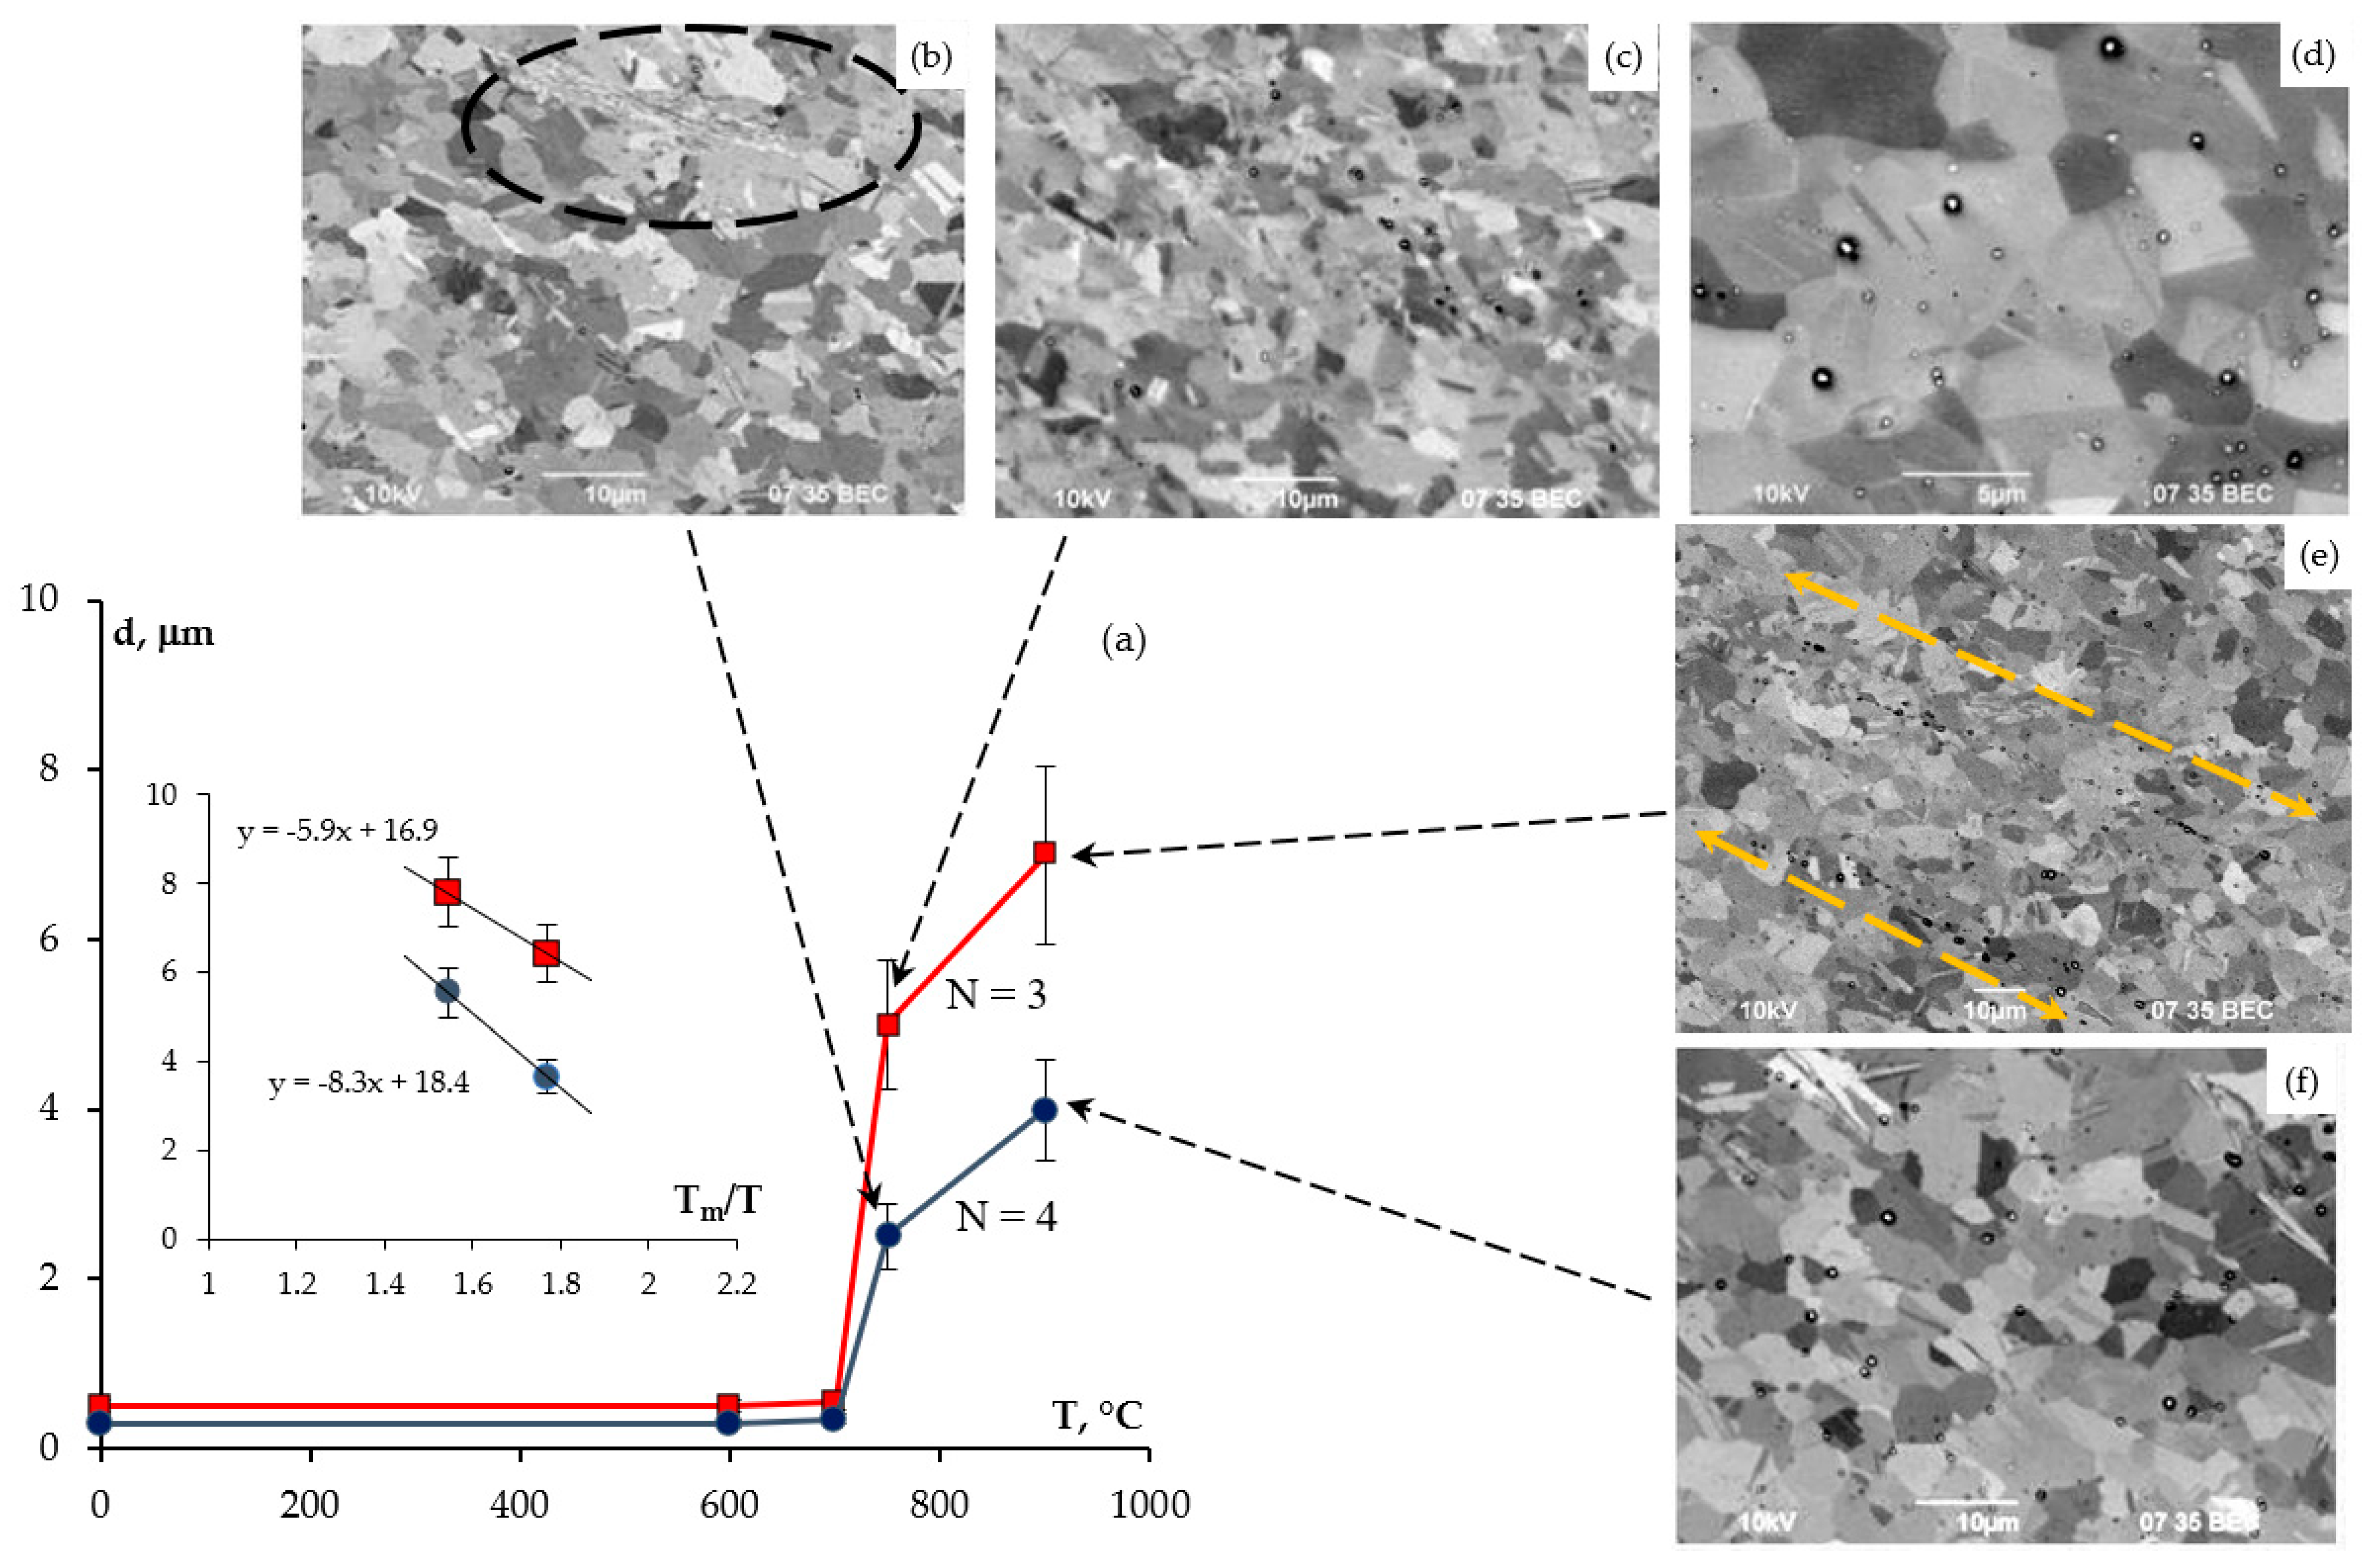
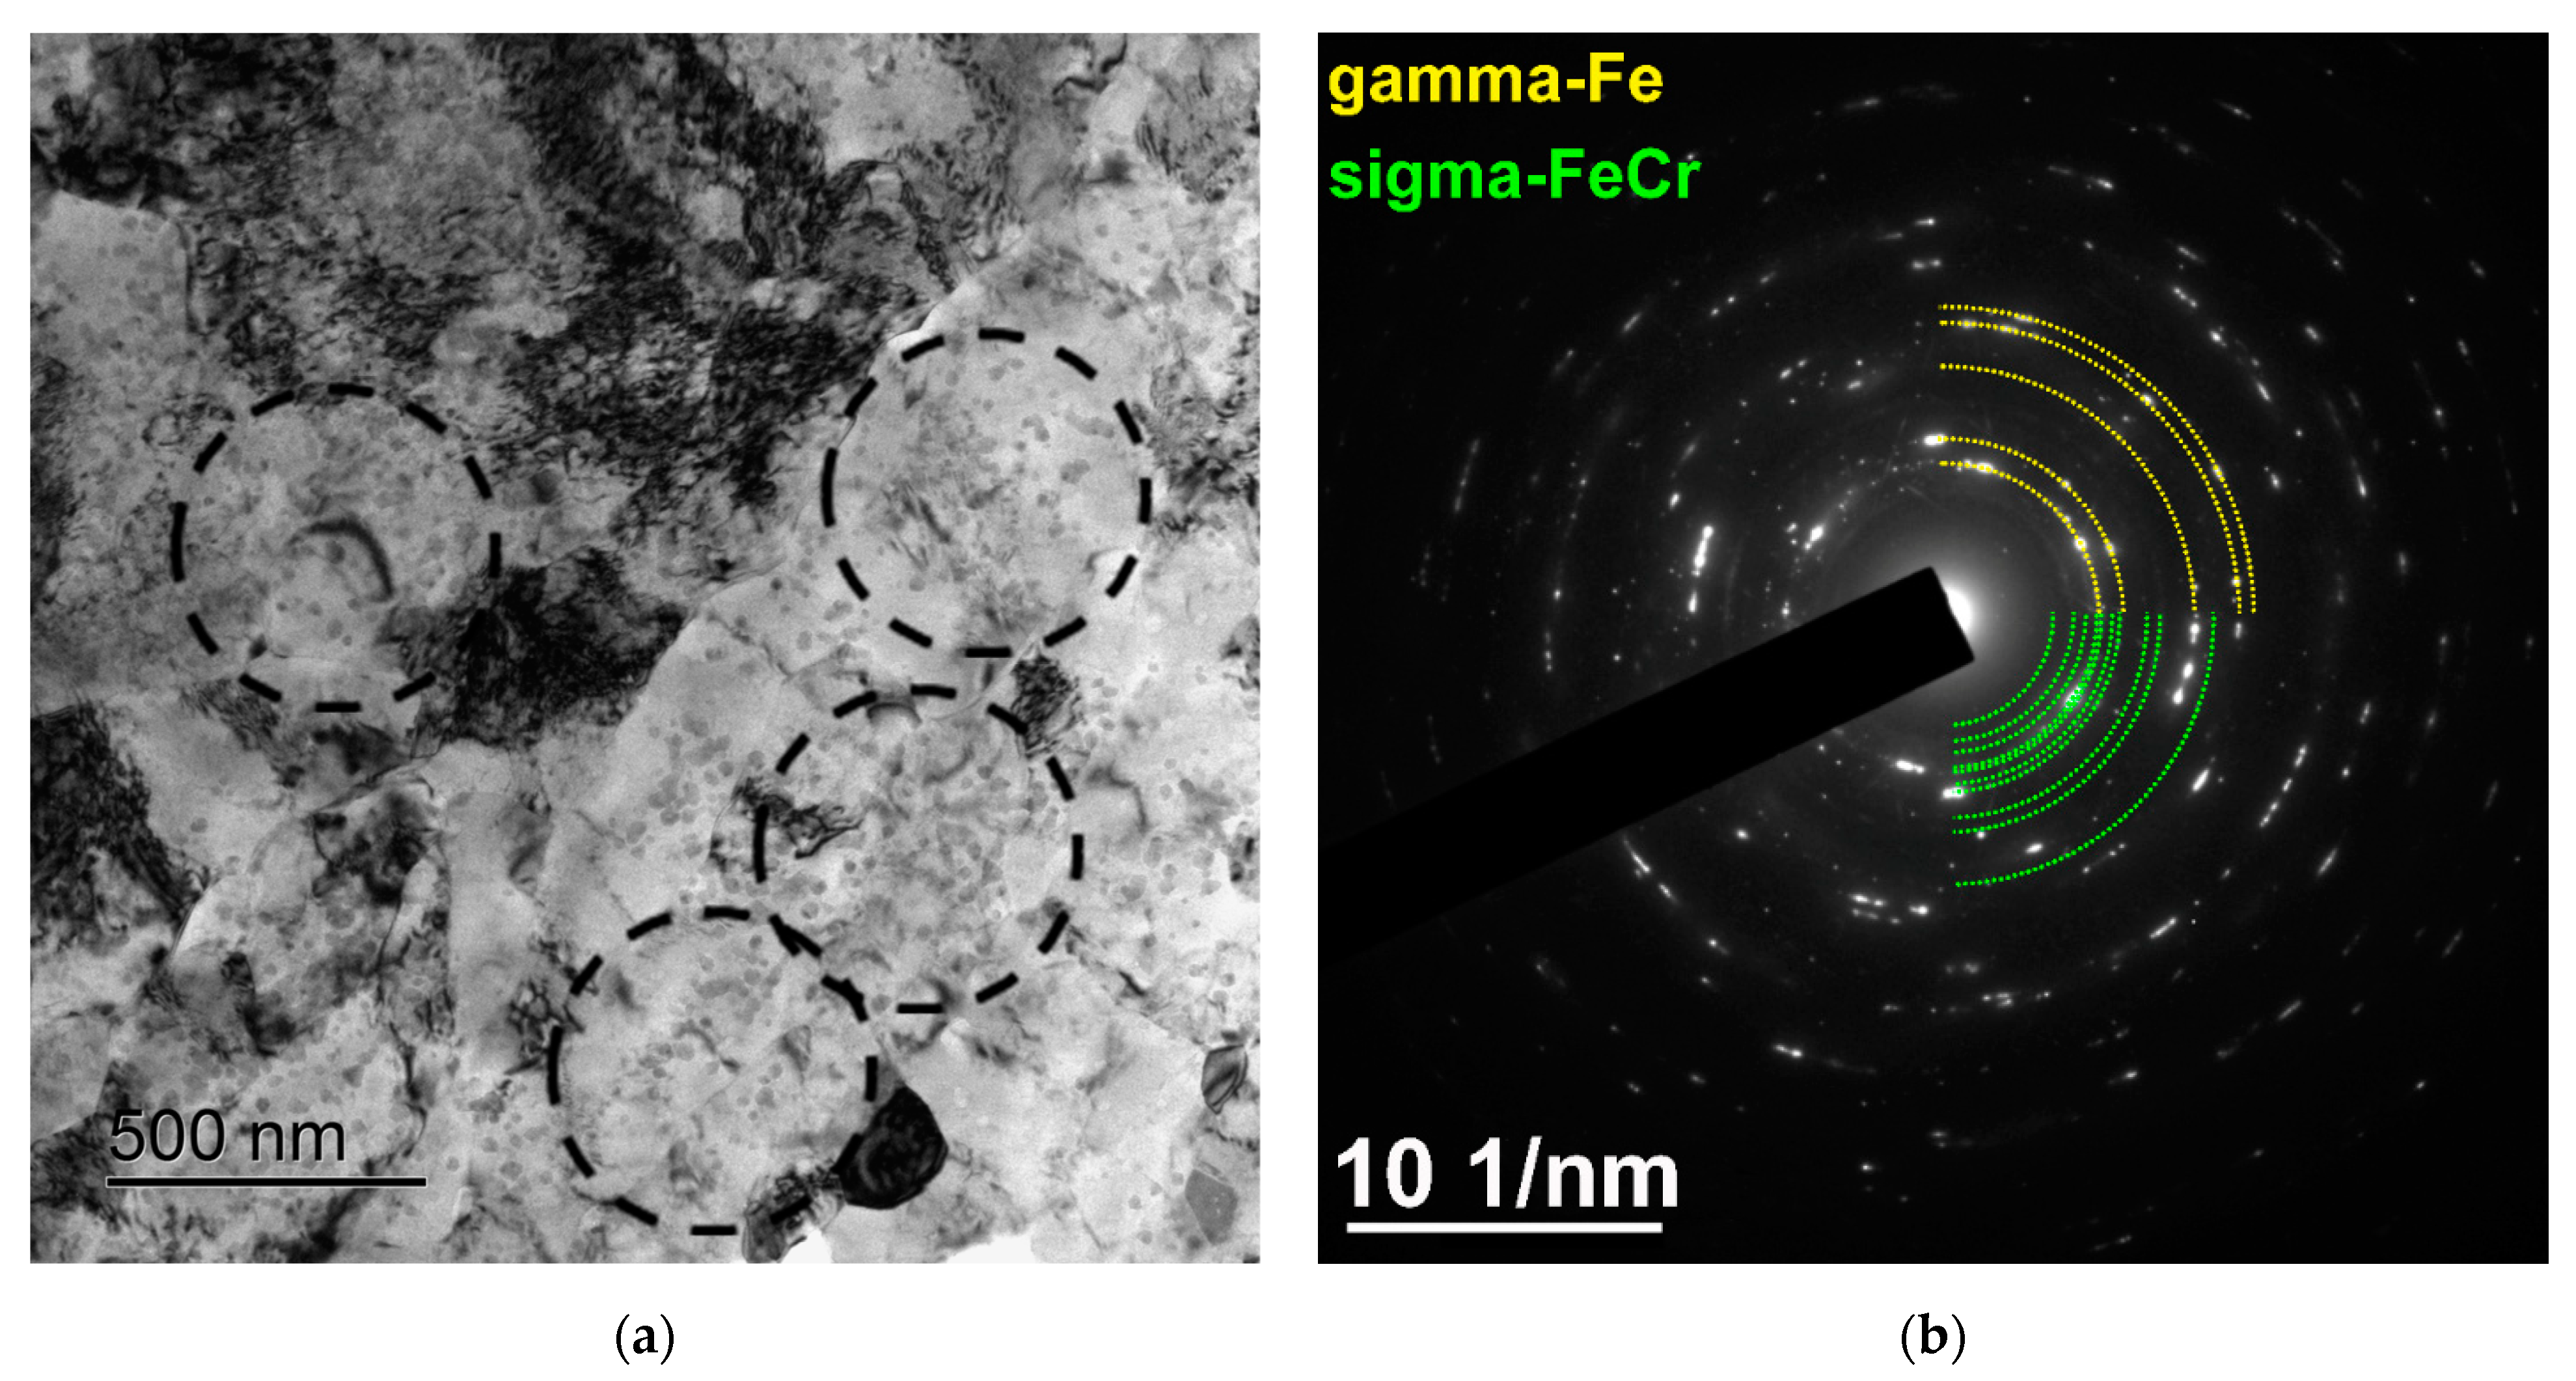
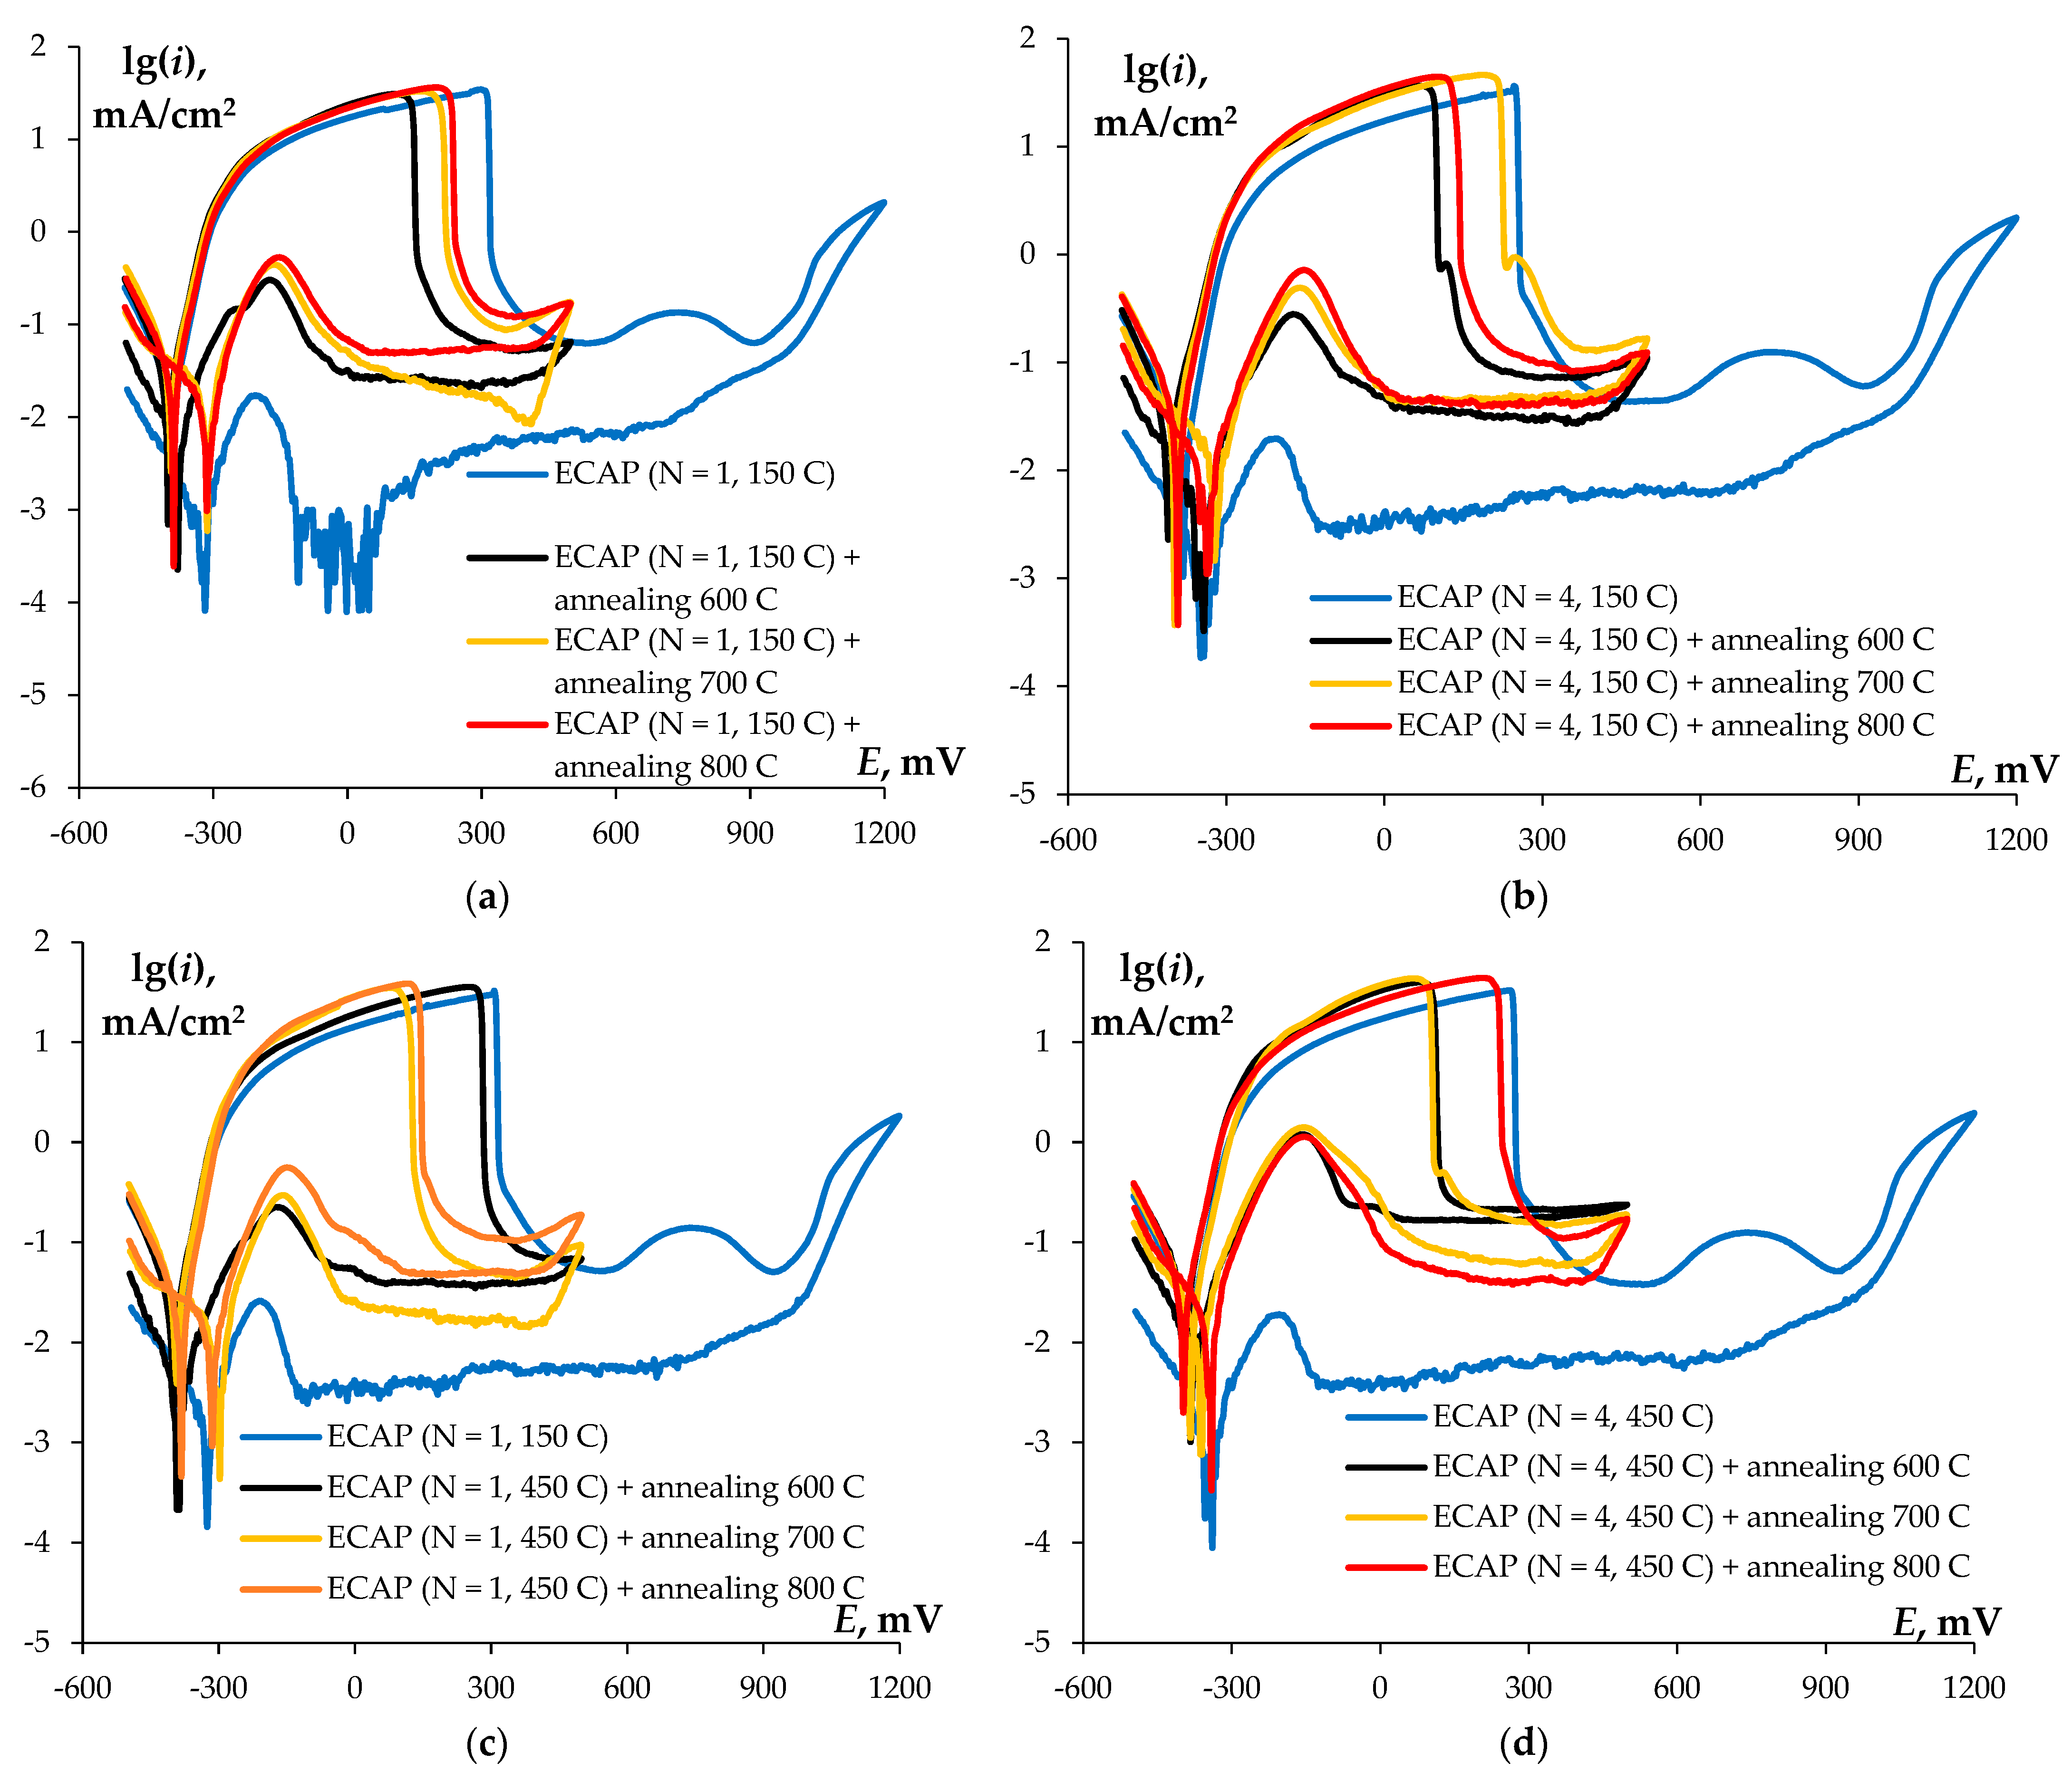
  • Annealing of UFG steels at temperatures above 700 °C led to recrystallization accompanied by a decrease α′-martensite fraction and nucleation of σ–phase nanoparticles. The activation energy of grain boundaries migration (6.0–8.3 kTm) was 20–30% lower than that of diffusions along the austenite grain boundaries. The reduction of the activation energy was caused by excess density of defects—orientation mismatch dislocations and products of dislocation delocalization along nonequilibrium grain boundaries.
  • UFG steel demonstrate improved stress-relaxation resistance—by a higher macroelasticity stress and lower stress-relaxation magnitude (under given stress). Better stress-relaxation resistance of UFG steel was caused by a special internal stress-relaxation mechanism associated with interaction of the lattice dislocations with nonequilibrium grain boundaries in UFG steel. The second probable origin of the increased stress-relaxation resistance of the UFG steel can be the presence of stronger α′-martensite particles that prevent dislocation glide during stress relaxation. High resistance to stress relaxation of annealed UFG steel is provided by nucleation of σ-phase nanoparticles blocking of dislocations glide. An increase in the fraction of nucleated σ-phase nanoparticles led to an increase in plastic deformation activation energy in UFG steel.
  • ECAP process reduces corrosion resistance of austenitic steel: an increase in uniform corrosion rates and an increase in susceptibility of steels to intergranular corrosion were observed. Lower corrosion resistance was caused, first of all, by α′-martensite particles with higher dissolving rate. α′-martensite particles led to microgalvanic martensite–austenite couples that appear in a steel microstructure, an accelerated intergranular corrosion is possible along their grain boundaries. σ-phase particles nucleation is the second reason for reduced corrosion resistance of UFG steel.

Author Contributions

Conceptualization, V.I.K. and A.V.N.; methodology, V.I.K. and V.N.C.; validation, V.I.K., A.V.N. and V.N.C.; formal analysis, V.I.K. and V.N.C.; investigation, V.I.K., N.A.K., M.K.C., M.Y.G., S.V.S., N.V.M., N.Y.T. and K.E.S.; resources, V.I.K. and V.N.C.; data curation, V.I.K. and V.N.C.; writing—original draft preparation, V.I.K., A.V.N. and V.N.C.; writing—review and editing, V.I.K. and V.N.C.; visualization, A.V.N.; supervision, V.I.K.; project administration, V.I.K.; funding acquisition, V.I.K. All authors have read and agreed to the published version of the manuscript.

Funding

The research was supported by the Russian Science Foundation (Grant No. 22-19-00238). TEM microstructure studies were carried out using the equipment provided by the “Materials Science and Metallurgy” Collective Use Center of National University of Science and Technology “MISIS” with the financial support from the Ministry of Science and Higher Education of Russian Federation (Grant No. 075-15-2021-696).

Data Availability Statement

Not applicable.

Conflicts of Interest

The authors declare no conflict of interest.

Abbreviations

DLEPR—double loop electrochemical potentiokinetic reactivation (method); CG—coarse-grained (steel); ECAP—Equal Channel Angular Pressing; HWHM—half width at half maximum (XRD peak); IGC—intergranular corrosion; GB—grain boundary; OMDs—orientation mismatch dislocations; RT—room temperature; SEM—scanning electron microscopy; SPD—Severe Plastic Deformation; SSR—stress-relaxation resistance; TEM—transmission electron microscopy; UFG—ultrafine-grained (steel); XRD—X-ray diffraction (phase analysis).

Appendix A

Appendix A shows in situ TEM results regarding the process of σ-phase particle formation.
Foils from UFG steel AISI 321 were heated in the column of a Jeol JEM-2100F transmission electron microscope and, at the same time, the steel microstructure was studied. Specimens were heated gradually with a step of 100 °C, with holding time of 60 min at each temperature. Heating started from room temperature and reached 800 °C. The full cycle of in situ studies included the following heating scheme: room temperature → heating to 300 °C, holding for 60 min → heating to 500 °C, holding for 60 min → heating to 600 °C, holding for 60 min → heating to 700 °C, holding for 60 min → heating to 800 °C, holding for 60 min → quenching.
Below are the photographs of the microstructure of UFG steel AISI 321 (ECAP, N = 4 at 450 °C) after each stage of heating. The first precipitated σ-phase particles in Figure A1f,g are marked with arrows and dash lines.
Figure A1. TEM images of the microstructure of UFG steel AISI 321L (ECAP, N = 4 at 450 °C) at room temperature (a) and after in situ heating: (b) 300 °C, 1 h; (c) 500 °C, 0 h; (d) 500 °C, 0.5 h; (e) 500 °C, 1 h; (f) 600 °C, 0 h; (g) 600 °C, 0.5 h; (h) 600 °C, 1 h; (i) 700 °C, 0 h; (j) 700 °C, 0.5 h; (k) 700 °C, 1 h; (l) 800 °C, 0 h; (m) 800 °C, 0.5 h; (n) 800 °C, 1 h.
Metals 13 00045 g0a1aMetals 13 00045 g0a1bMetals 13 00045 g0a1c

Appendix B

To confirm possible formation of α′-martensite at elevated SPD temperatures, we produced steel AISI 321L specimens at different ECAP temperatures (Figure A2). These specimens were subjected to a single ECAP cycle (N = 1) at temperatures from 50 to 400 °C. All the rest conditions of the experiment were completely identical to the ones described in Materials and Methods. The photographs of the workpieces after ECAP are presented in Figure A2.
Figure A2. The steel AISI 321L workpieces after ECAP at different temperatures.
Metals 13 00045 g0a2
The specimens for the XRD investigations were cut out along and across the workpiece axis.
Figure A3 presents XRD curves for specimens produced at different ECAP temperatures. The (110) XRD peaks from α′-martensite at diffraction angles of 2θ ~ 44.4–44.7° are seen clearly on XRD curves for all the specimens. The intensities and half width at half maximum (HWHM) values for (110) α′-martensite XRD peaks hardly depend on ECAP temperature. No XRD peaks corresponding to ε-martensite were observed.
So far, one can say that α′-martensite particles are present in UFG steel AISI 321L specimens after ECAP at 400 °C.
This result agrees well with the results of [109], which reported steel 304 after ECAP at 500 °C to contain ~10% of α′-martensite. ECAP in [109] was performed in Bc scheme in a setup with 90o crossing angle of channels; strain rate was ~4 mm/s. In [109], it was shown that the martensite content in UFG steel 304 almost did not depend on the number of ECAP cycles but the increasing of the number of ECAP cycles up to N = 8 leads to the fragmentation of the α′-martensite grains.
We stick to the opinion that the results obtained suggest that α′-martensite in UFG austenitic steels obtained by ECAP can be observed at higher deformation temperatures than in the case of conventional deformation processing methods.
Figure A3. XRD curves for specimens cut out from transverse (a) and longitudinal (b) sections of workpieces obtained by ECAP at different temperatures.
Metals 13 00045 g0a3

References

  1. Lo, K.H.; Shek, C.H.; Lai, J.K.L. Recent developments in stainless steels. Mater. Sci. Eng. R 2009, 65, 39–104. [Google Scholar] [CrossRef]
  2. Sagaradze, V.V.; Filippov, Y.I.; Matvienko, M.F.; Miroshnichenko, B.I.; Loskutov, V.E.; Kanaykin, V.A. Corrosion Cracking of Austenitic and Ferrite-Pearlite Steels; Ural Branch RAS: Yekaterinburg, Russia, 2004; p. 228. (In Russian) [Google Scholar]
  3. Sagaradze, V.V.; Uvarov, A.I. Hardening and Properties of Austenitic Steels; M.N. Mikheev Institute of Metal Physics RAS: Yekaterinburg, Russia, 2013; p. 720. (In Russian) [Google Scholar]
  4. Yang, X.; Yu, C.; Yang, X.; Yan, K.; Qian, G.; Wang, B.; Yan, W.; Shi, X. Microstructure and mechanical properties of an austenitic heat-resistance steel after service at 570 °C and 25.4 MPa for 18 years. J. Mater. Eng. Perform. 2021, 30, 1030–1038. [Google Scholar] [CrossRef]
  5. Järvenpää, A.; Jaskari, M.; Kisko, A.; Karjalainen, P. Processing and properties of reversion-treated austenitic stainless steels. Metals 2020, 10, 281. [Google Scholar] [CrossRef] [Green Version]
  6. Shen, Y.F.; Li, X.X.; Sun, X.; Wang, Y.D.; Zuo, L. Twinning and martensite in a 304 austenitic stainless steel. Mater. Sci. Eng. A 2012, 552, 514–522. [Google Scholar] [CrossRef]
  7. Talonen, J.; Hänninen, H. Formation of shear bands and strain-induced martensite during plastic deformation of metastable austenitic stainless steels. Acta Mater. 2007, 55, 6108–6118. [Google Scholar] [CrossRef]
  8. Tikhonova, M.; Kaibyshev, R.; Belyakov, A. Microstructure and mechanical properties of austenitic stainless steels after dynamic and post-dynamic recrystallization treatment. Adv. Eng. Mater. 2018, 20, 1700960. [Google Scholar] [CrossRef]
  9. Gupta, R.K.; Birbilis, N. The influence of nanocrystalline structure and processing route on corrosion of stainless steel: A review. Corros. Sci. 2015, 92, 1–15. [Google Scholar] [CrossRef]
  10. Shit, G.; Ningshen, S. The effect of severe plastic deformation on the corrosion resistance of AISI type 304L stainless steel. J. Mater. Eng. Perform. 2020, 29, 5696–5709. [Google Scholar] [CrossRef]
  11. He, Q.; Wei, W.; Wang, M.-S.; Guo, F.-J.; Zhai, Y.; Wang, Y.-F.; Huang, C.-X. Gradient microstructure design in stainless steel: A strategy for uniting strength-ductility synergy and corrosion resistance. Nanomaterials 2021, 11, 2356. [Google Scholar] [CrossRef]
  12. Chen, X.; Gussev, M.; Balonis, M.; Bauchy, M.; Sant, G. Emergence of micro-galvanic corrosion in plastically deformed austenitic stainless steels. Mater. Des. 2021, 203, 109614. [Google Scholar] [CrossRef]
  13. Bai, G.; Lu, S.; Li, Y. Intergranular corrosion behavior associated with delta-ferrite transformation of Ti-modified Super304H austenitic stainless steel. Corros. Sci. 2015, 90, 347–358. [Google Scholar] [CrossRef]
  14. Arganis-Juárez, C.R.; Vázquez, A.; Garza-Montes-de-Oca, N.F.; Colás, R. Sensitization of an austenitic stainless steel due to the occurrence of δ-ferrite. Corros. Rev. 2019, 37, 179–186. [Google Scholar] [CrossRef]
  15. Shi, H.; Wu, T.; Gong, Q.; Ding, W.; Chai, Y.; Weisenburger, A.; Chang, L.; Zhang, Z.; Wang, K.; Richter, J.; et al. Hot salt corrosion of additively manufactured stainless steel 316L and Inconel 718 in MgCl2/KCl/NaCl chloride salt at 700 °C. Corros. Sci. 2022, 207, 110561. [Google Scholar] [CrossRef]
  16. Wang, J.; Su, H.; Chen, K.; Du, D.; Zhang, L.; Shen, Z. Effect of δ-ferrite on the stress corrosion cracking behavior of 321 stainless steel. Corros. Sci. 2019, 158, 108079. [Google Scholar] [CrossRef]
  17. Abe, H.; Watanabe, Y. Role of δ-ferrite in stress corrosion cracking retardation near fusion boundary in 316NG welds. J. Nucl. Mater. 2012, 424, 57–61. [Google Scholar] [CrossRef]
  18. Lai, C.-L.; Lu, W.-F.; Huang, J.-Y. Effect of δ-ferrite content on the stress corrosion cracking behavior of cast austenitic stainless steel in high-temperature water environment. Corrosion 2014, 70, 591–597. [Google Scholar] [CrossRef]
  19. Lu, W.-F.; Huang, J.-Y.; Yung, T.-Y.; Chen, T.-C.; Tsai, K.-C. Effect of thermal aging on the stress corrosion cracking behavior of cast stainless steel with different δ-ferrite levels in high temperature water environment. J. Nucl. Mater. 2022, 568, 153900. [Google Scholar] [CrossRef]
  20. Cui, T.; Xu, X.; Pan, D.; Lu, Z.; Li, X.; Ma, J.; Zhang, Y.; Yang, S.; Shoji, T. Comparison of stress corrosion cracking susceptibilities of 308L and 309L cladding layers in high-temperature water with various dissolved oxygen concentrations. J. Nucl. Mater. 2022, 569, 153913. [Google Scholar] [CrossRef]
  21. Wang, Q.; Chen, S.; Lv, X.; Jiang, H.; Rong, L. Role of δ-ferrite in fatigue crack growth of AISI 316 austenitic stainless steel. J. Mater. Sci. Technol. 2022, 114, 7–15. [Google Scholar] [CrossRef]
  22. Warren, A.; Griffiths, I.; Harniman, R.; Flewitt, P.; Scott, T. The role of ferrite in type 316H austenitic stainless steels on the susceptibility to creep cavitation. Mater. Sci. Eng. A. 2015, 635, 59–69. [Google Scholar] [CrossRef]
  23. Pardo, A.; Merino, M.; Coy, A.; Viejo, F.; Carboneras, M.; Arrabal, R. Influence of Ti, C and N concentration on the intergranular corrosion behavior of AISI 316Ti and 321 stainless steel. Acta Mater. 2007, 55, 2239–2251. [Google Scholar] [CrossRef]
  24. Wasnik, D.; Kain, V.; Samajdar, I.; Verlinden, B.; De, P. Resistance of sensitization and intergranular corrosion through extreme randomization of grain boundaries. Acta Mater. 2002, 50, 4587–4601. [Google Scholar] [CrossRef]
  25. Li, X.; Chang, L.; Liu, C.; Leng, B.; Ye, X.; Han, F.; Yang, X. Effect of thermal aging on corrosion behavior of type 316H stainless steel in molten chloride salt. Corros. Sci. 2021, 191, 109784. [Google Scholar] [CrossRef]
  26. Rhouma, A.B.; Amadou, T.; Sidhom, H.; Braham, C. Correlation between microstructure and intergranular corrosion behavior of low delta-ferrite content AISI 316L aged in the range 550–700 °C. J. Alloys Compd. 2017, 708, 871–886. [Google Scholar] [CrossRef]
  27. Tseng, C.C.; Shen, Y.; Thompson, S.W.; Mataya, M.C.; Krauss, G. Fracture and the formation of sigma phase, M23C6, and austenite from delta-ferrite in an AISI 304L stainless steel. Metall. Mater. Trans. A 1994, 25, 1147–1158. [Google Scholar] [CrossRef]
  28. Zhao, L.; Wei, S.; Wu, D.; Gao, D.; Lu, S. δ-ferrite transformation mechanism and its effect on mechanical properties of 316H weld metal. J. Mater. Sci. Technol. 2020, 57, 33–42. [Google Scholar] [CrossRef]
  29. Jeong, S.W.; Kang, U.G.; Choi, J.Y.; Nam, W.J. Comparative study of hardening mechanisms during aging of a 304 stainless steel containing α′-martensite. J. Mater. Eng. Perform. 2012, 21, 1937–1942. [Google Scholar] [CrossRef]
  30. Zergani, A.; Mirzadeh, H.; Mahmudi, R. Evolutions of mechanical properties of AISI 304L stainless steel under shear loading. Mater. Sci. Eng. A 2020, 791, 139667. [Google Scholar] [CrossRef]
  31. Mola, J.; Luan, G.; Huang, Q.; Ullrich, C.; Volkova, O.; Estrin, Y. Dynamic strain aging mechanisms in a metastable austenitic stainless steel. Acta Mater. 2021, 212, 116888. [Google Scholar] [CrossRef]
  32. Hsieh, C.-C.; Lin, D.-Y.; Wu, W. Dispersion strengthening behavior of σ phase in 304 modified stainless steels during 1073 K hot rolling. Met. Mater. Int. 2007, 13, 359–363. [Google Scholar] [CrossRef]
  33. Hsieh, C.-C.; Lin, D.-Y.; Wu, W. Precipitation behavior of σ phase in 19Cr-9Ni-2Mn and 18Cr-0.75Si stainless steels hot-rolled at 800 °C with various reduction ratios. Mater. Sci. Eng. A 2007, 467, 181–189. [Google Scholar] [CrossRef]
  34. Zhou, Q.; Liu, J.; Gao, Y. An insight into oversaturated deformation-induced sigma precipitation in Super304H austenitic stainless steel. Mater. Des. 2019, 181, 108056. [Google Scholar] [CrossRef]
  35. Park, S.H.C.; Sato, Y.S.; Kokawa, H.; Okamoto, K.; Hirano, S.; Inagaki, M. Rapid formation of the sigma phase in 304 stainless steel during friction stir welding. Scr. Mater. 2003, 49, 1175–1180. [Google Scholar] [CrossRef]
  36. Mao, X.; Zhao, W. Electrochemical polarization method to detect aging embrittlement of 321 stainless steel. Corrosion 1993, 49, 335–342. [Google Scholar] [CrossRef]
  37. Calderón-Hernández, J.W.; Alves, S.F., Jr.; de Moraes, F.P.; de Melo, H.G.; Padilha, A.F. Correlation between microstructure and corrosion behavior in an AISI 316L steel pipeline exposed for 100,700 h at 640 °C in a petrochemical plant. Mater. Corros. 2021, 72, 1762–1773. [Google Scholar] [CrossRef]
  38. Panov, D.; Chernichenko, R.; Naumov, S.; Pertcev, A.; Stepanov, N.; Zherebtsov, S.; Salishchev, G. Excellent strength-toughness synergy in metastable austenitic stainless steel due to gradient structure formation. Mater. Lett. 2021, 303, 130585. [Google Scholar] [CrossRef]
  39. Panov, D.; Kudryavtsev, E.; Chernichenko, R.; Smirnov, A.; Stepanov, N.; Simonov, Y.; Zherebtsov, S.; Salishchev, G. Mechanisms on the reverse martensite-to-austenite transformation in metastable austenitic stainless steel. Metals 2021, 11, 599. [Google Scholar] [CrossRef]
  40. Du, C.; Liu, G.; Sun, B.; Xin, S.; Shen, T. A 2.9 GPa strength nano-gradient and nano-precipitated 304L-type austenitic stainless steel. Materials 2020, 13, 5382. [Google Scholar] [CrossRef]
  41. Qin, W.; Li, J.; Liu, Y.; Kang, J.; Zhu, L.; Shu, D.; Peng, P.; She, D.; Meng, D.; Li, Y. Effects of grain size on tensile property and fracture morphology of 316L stainless steel. Mater. Lett. 2019, 254, 116–119. [Google Scholar] [CrossRef]
  42. Yanushkevich, Z.; Dobatkin, S.V.; Belyakov, A.; Kaibyshev, R. Hall-Petch relationship for austenitic stainless steels processed by large strain warm rolling. Acta Mater. 2017, 136, 39–48. [Google Scholar] [CrossRef]
  43. Forouzan, F.; Najafizadeh, A.; Kermanpur, A.; Hedayati, A.; Surkialiabad, R. Production of nano/submicron grained AISI 304L stainless steel through the martensite reversion process. Mater. Sci. Eng. A 2010, 527, 7334–7339. [Google Scholar] [CrossRef]
  44. Ma, Y.; Jin, J.-E.; Lee, Y.-K. A repetitive thermomechanical process to produce nano-crystalline in a metastable austenitic steel. Scr. Mater. 2005, 52, 1311–1315. [Google Scholar] [CrossRef]
  45. Liu, X.; Zhou, M.; Zhang, X. Ultra-flash annealing constructed heterogeneous austenitic stainless steel with excellent strength-ductility. Mater. Charact. 2022, 192, 112182. [Google Scholar] [CrossRef]
  46. Misra, R.; Nayak, S.; Mali, S.; Shah, J.; Somani, M.; Karjalainen, L. Microstructure and deformation behavior of phase-reversion-induced nanograined/ultrafine-grained austenitic stainless steel. Metall. Mater. Trans. A 2009, 40, 2498–2509. [Google Scholar] [CrossRef]
  47. Lee, Y.K.; Jin, J.E.; Ma, Y.Q. Transformation-induced extraordinary ductility in an ultrafine-grained alloy with nanosized precipitates. Scr. Mater. 2007, 57, 707–710. [Google Scholar] [CrossRef]
  48. Amininejad, A.; Jamaati, R.; Hosseinipour, S.J. Improvement of strength-ductility balance of SAE 304 stainless steel by asymmetric cross rolling. Mater. Chem. Phys. 2020, 256, 123668. [Google Scholar] [CrossRef]
  49. Li, J.; Cao, Y.; Gao, B.; Li, Y.; Zhu, Y. Superior strength and ductility of 316L stainless steel with heterogeneous lamella structure. J. Mater. Sci. 2018, 53, 10442–10456. [Google Scholar] [CrossRef]
  50. Shirdel, M.; Mirzadeh, H.; Parsa, M.H. Enhanced mechanical properties of microalloyed austenitic stainless steel produced by martensite treatment. Adv. Eng. Mater. 2015, 17, 1226–1233. [Google Scholar] [CrossRef]
  51. Misra, R.; Wan, X.; Challa, V.; Somani, M.; Murr, L. Relationship of grain size and deformation mechanism to the fracture behavior in high strength—High ductility nanostrucutred austenitic stainless steel. Mater. Sci. Eng. A 2015, 626, 41–50. [Google Scholar] [CrossRef]
  52. Dobatkin, S.; Rybalchenko, O.; Enikeev, N.; Tokar, A.; Abramova, M. Formation of fully austenitic ultrafine-grained high strength state in metastable Cr-Ni-Ti stainless steel by severe plastic deformation. Mater. Lett. 2016, 166, 276–279. [Google Scholar] [CrossRef]
  53. Rybal’Chenko, O.; Dobatkin, S.; Kaputkina, L.; Raab, G.; Krasilnikov, N. Strength of ultrafine-grained corrosion-resistance steels after severe plastic deformation. Mater. Sci. Eng. A 2004, 387–389, 244–248. [Google Scholar] [CrossRef]
  54. Dobatkin, S.V.; Rybal’chenko, O.V.; Raab, G.I. Structure formation, phase transformations and properties in Cr-Ni austenitic steel after equal-channel angular pressing and heating. Mater. Sci. Eng. A 2007, 463, 41–45. [Google Scholar] [CrossRef]
  55. Kositsyna, I.I.; Sagaradze, V.V.; Kopylov, V.I. Formation of high-strength and high-plastic state in metastable austenitic steels by the method of equal-channel angular pressing. Phys. Met. Metallogr. 1999, 88, 493–498. (In Russian) [Google Scholar]
  56. Segal, V. Equal-channel angular extrusion (ECAE): From a laboratory curiosity to an industrial technology. Metals 2020, 10, 244. [Google Scholar] [CrossRef] [Green Version]
  57. Segal, V. Review: Modes and processes of Severe Plastic Deformation. Materials 2018, 11, 1175. [Google Scholar] [CrossRef] [Green Version]
  58. Valiev, R.Z.; Langdon, T.G. Principles of equal-channel angular pressing as a processing tool for grain refinement. Progr. Mater. Sci. 2006, 51, 881–981. [Google Scholar] [CrossRef]
  59. Zhilyaev, A.P.; Langdon, T.G. Using high-pressure torsion for metal processing: Fundamentals and applications. Progr. Mater. Sci. 2008, 53, 893–979. [Google Scholar] [CrossRef]
  60. Segal, V.M.; Beyerlein, I.J.; Tome, C.N.; Chuvil’deev, V.N.; Kopylov, V.I. Fundamentals and Engineering of Severe Plastic Deformation; Nova Science Publishers: New York, NY, USA, 2010; p. 542. [Google Scholar]
  61. Qu, S.; Huang, C.; Gao, Y.; Yang, G.; Wu, S.; Zang, Q.; Zhang, Z. Tensile and compressive properties of AISI 304L stainless subjected to equal channel angular pressing. Mater. Sci. Eng. A 2008, 475, 207–216. [Google Scholar] [CrossRef]
  62. Huang, C.X.; Yang, G.; Wang, C.; Zhang, Z.F.; Wu, S.D. Mechanical behaviors of ultrafine-grained 301 austenitic stainless steel produced by Equal-Channel Angular Pressing. Metall. Mater. Trans. A 2011, 42, 2061–2071. [Google Scholar] [CrossRef]
  63. Tirekar, S.; Jafarian, H.R.; Eivani, A.R. Towards engineering of mechanical properties through stabilization of austenite in ultrafine grained martensite-austenite dual phase steel processed by accumulative roll bonding. Mater. Sci. Eng. A 2017, 684, 120–126. [Google Scholar] [CrossRef]
  64. Liu, M.; Gong, W.; Zheng, R.; Li, J.; Zhang, Z.; Gao, S.; Ma, C.; Tsuji, N. Achieving excellent mechanical properties in type 316 stainless steel by tailoring grain size in homogeneously recovered of recrystallized nanostructures. Acta Mater. 2022, 226, 117629. [Google Scholar] [CrossRef]
  65. Sabooni, S.; Karimzadeh, F.; Enayati, M.H.; Ngan, A.H.W. The role of martensitic transformation on bimodal grain structure in ultrafine grained AISI 304L stainless steel. Mater. Sci. Eng. A 2015, 636, 221–230. [Google Scholar] [CrossRef] [Green Version]
  66. Romero-Resendiz, L.; El-Tahawy, M.; Zhang, T.; Rossi, M.; Marulanda-Cardona, D.; Yang, T.; Amigó-Borrás, V.; Huang, Y.; Mirzadeh, H.; Beyerlein, I.; et al. Heterostructured stainless steel: Properties, current trends, and future perspectives. Mater. Sci. Eng. R. 2022, 150, 100691. [Google Scholar] [CrossRef]
  67. Miyamoto, H. Corrosion of ultrafine grained materials by severe plastic deformation, an overview. Mater. Transact. 2016, 57, 559–572. [Google Scholar] [CrossRef] [Green Version]
  68. Ura-Bińczyk, E. Effect of grain refinement on the corrosion resistance of 316L stainless steel. Materials 2021, 14, 7517. [Google Scholar] [CrossRef]
  69. Krawczynska, A.T.; Chrominski, W.; Ura-Binczyk, E.; Kulczyk, M.; Lewandowska, M. Mechanical properties and corrosion resistance of ultrafine grained austenitic stainless steel processed by hydrostatic extrusion. Mater. Des. 2017, 136, 34–44. [Google Scholar] [CrossRef]
  70. Krawczynska, A.T.; Gloc, M.; Lublinska, K. Intergranular corrosion resistance of nanostructured austenitic stainless steel. J. Mater. Sci. 2013, 48, 4517–4523. [Google Scholar] [CrossRef] [Green Version]
  71. Pisarek, M.; Keędzierzawski, P.; Janik-Czachor, M.; Kurzydlowski, K.J. Effect of hydrostatic extrusion on the corrosion resistance of type 316 stainless steel. Corrosion 2008, 64, 131–137. [Google Scholar] [CrossRef]
  72. Pisarek, M.; Kedzierzawski, P.; Janik-Czachor, M.; Kurzydlowski, K.J. Effect of hydrostatic extrusion on passivity breakdown on 303 austenitic stainless steel in chloride solution. J. Solid State Electrochem. 2009, 13, 283–291. [Google Scholar] [CrossRef]
  73. Jinlong, L.; Hongyun, L.; Tongxiang, L.; Wenli, G. The effect of grain refinement and deformation on corrosion resistance of passive film formed on the surface of 304 stainless steel. Mater. Res. Bull. 2015, 70, 896–907. [Google Scholar] [CrossRef]
  74. Hug, E.; Babu, R.P.; Monnet, I.; Etienne, A.; Moisy, F.; Pralong, V.; Enikeev, N.; Abramova, M.; Sauvage, X.; Radiguet, B. Impact of nanostructuration on the corrosion resistance and hardness of irradiated 316 austenitic stainless steels. Appl. Surf. Sci. 2017, 392, 1026–1035. [Google Scholar] [CrossRef]
  75. Wang, S.; Sun, M.; Xu, Y.; Long, K.; Zhang, Z. Enhanced localized and uniform corrosion resistances of bulk nanocrystalline 304 stainless steel in high-concentration hydrochloric acid solutions at room temperature. J. Mater. Sci. Technol. 2018, 34, 2498–2506. [Google Scholar] [CrossRef]
  76. Tiamiyu, A.A.; Eduok, U.; Szpunar, J.A.; Odeshi, A.G. Corrosion behavior of metastable AISI 321 austenitic stainless steel: Investigating the effect of grain size and prior plastic deformation on its degradation pattern in saline media. Sci. Rep. 2019, 9, 12116. [Google Scholar] [CrossRef] [PubMed] [Green Version]
  77. Zhang, H.; Xue, P.; Wu, L.; Song, Q.; Wang, D.; Xiao, B.; Ma, Z. Effect of grain ultra-refinement on corrosion behavior of ultra-high strength high nitrogen stainless steel. Corros. Sci. 2020, 174, 108847. [Google Scholar] [CrossRef]
  78. Wang, S.; Sun, M.; Liu, S.; Liu, X.; Xu, Y.; Gong, C.; Long, K.; Zhang, Z. Synchronous optimization of strengths, ductility and corrosion resistances of bulk nanocrystalline 304 stainless steel. J. Mater. Sci. Technol. 2020, 37, 161–172. [Google Scholar] [CrossRef]
  79. Lei, Y.; Wang, Z.; Zhang, B.; Luo, Z.; Lu, J.; Lu, K. Enhanced mechanical properties and corrosion resistance of 316L stainless steel by pre-forming a gradient nanostructured surface layer and annealing. Acta Mater. 2021, 208, 116773. [Google Scholar] [CrossRef]
  80. Mordyuk, B.N.; Prokopenko, G.I.; Vasylyev, M.A.; Iefimov, M.O. Effect of structure evolution induced by ultrasonic peening on the corrosion behavior of AISI-321 stainless steel. Mater. Sci. Eng. A 2007, 458, 253–261. [Google Scholar] [CrossRef]
  81. Tiamiyu, A.A.; Eduok, U.; Odeshi, A.G.; Szpunar, J.A. Effect of prior plastic deformation and deformation rate on the corrosion resistance of AISI 321 austenitic stainless steel. Mater. Sci. Eng. A 2019, 745, 1–9. [Google Scholar] [CrossRef]
  82. Xiao, X.; Li, D.; Li, Y.; Lu, S. Intergranular precipitation behavior and its influence on the stress relaxation cracking susceptibility of Super304H austenitic stainless steel weld metal during long-term aging. Mater. Charact. 2021, 178, 111309. [Google Scholar] [CrossRef]
  83. Yamashita, M.; Wada, Y. The stress-relaxation behavior of type 304 stainless steel. International Journal of Pressure Vessels and Piping 1990, 42, 203–216. [Google Scholar] [CrossRef]
  84. Dayalan, I.; Crasta, P.F.; Pradhan, S.; Gupta, R. A review on stress relaxation cracking in austenitic stainless steel. In Proceedings of the International Conference on Intelligent Manufacturing and Automation. Lecture Notes in Mechanical Engineering, Mumbai, India, 27–28 March 2020; Vasudevan, H., Kottur, V., Raina, A., Eds.; Springer: Singapore, 2020; pp. 427–434. [Google Scholar] [CrossRef]
  85. Yoon, K.B.; Yu, J.M.; Nguyen, T.S. Stress relaxation cracking in 304H stainless steel weld of a chemical reactor serviced at 560 °C. Eng. Fail. Anal. 2015, 56, 288–299. [Google Scholar] [CrossRef]
  86. Wang, Y.Q.; Spindler, M.W.; Truman, C.E.; Smith, D.J. Critical analysis of the prediction of stress relaxation from forward creep of type 316H austenitic stainless steel. Mater. Des. 2016, 95, 656–668. [Google Scholar] [CrossRef]
  87. Tendo, M.; Yamada, K.; Shimura, Y. Stress relaxation behavior at high-tension bolted connections of stainless-steel plates. J. Eng. Mater. Technol. 2001, 123, 198–202. [Google Scholar] [CrossRef]
  88. Anciaux, M.J. Stress relaxation of austenitic stainless steels at 290 °C. Metall. Transact. A 1981, 12, 1981–1985. [Google Scholar] [CrossRef]
  89. Bordzyuka, A.M.; Getsov, L.B. Stress Relaxation in Metals and Alloys; Nauka: Moscow, Russia, 1978; p. 256. (In Russian) [Google Scholar]
  90. Povolo, F.; Tinivella, R.J.; Reggiardo, J.F.; Botteri, G.B. Stress relaxation in bending of type AISI304 stainless steel at 773 and 823 K. J. Mater. Sci. 1992, 27, 1505–1513. [Google Scholar] [CrossRef]
  91. Bahrami, A.; Mohammanejad, A.; Khouzani, M.K.; Pouradineh, M.; Esmaeili, V. Stress relaxation cracking failure in a high pressure steam pipeline in a ammonia plant. Int. J. Press. Vessel. Pip. 2021, 194A, 104542. [Google Scholar] [CrossRef]
  92. Chen, B.; Smith, D.J.; Flewitt, P.E.J.; Spindler, M.W. Constitutive equations that describe creep stress relaxation for 316H stainless steel at 550 °C. Mater. High Temp. 2011, 28, 155–164. [Google Scholar] [CrossRef]
  93. Yamada, H.; Li, C.-Y. Stress relaxation and mechanical equation of state in austenitic stainless steels. Metall. Transact. 1973, 4, 2133–2136. [Google Scholar] [CrossRef]
  94. Luo, J.; Xiong, W.; Li, X.; Chen, J. Investigation of high-temperature stress relaxation behavior of Ti-6Al-4V sheet. Mater. Sci. Eng. A 2019, 743, 755–763. [Google Scholar] [CrossRef]
  95. Ghauri, I.M.; Haider, K.; Afzal, N.; Siddique, S.A. A comparative study of stress relaxation rate in unirradiated and irradiated pure titanium at low temperatures. Int. J. Modern Phys. B 2007, 21, 5247–5255. [Google Scholar] [CrossRef]
  96. Ghuri, I.M.; Afzar, N.; Haider, K. Rate controlling process of stress relaxation in high purity irradiated titanium. J. Phys. D Appl. Phys. 2006, 39, 2829–2831. [Google Scholar] [CrossRef]
  97. Liu, P.; Zong, Y.; Shan, D.; Guo, B. Relationship between constant-load creep, decreasing-load creep and stress relaxation of titanium alloy. Mater. Sci. Eng. A 2015, 638, 106–113. [Google Scholar] [CrossRef]
  98. Peng, H.-L.; Li, X.-F.; Chen, X.; Jiang, J.; Luo, J.-F.; Xiong, W.; Chen, J. Effect of grain size on high-temperature stress relaxation behavior of fine-grained TC4 titanium alloy. Trans. Nonferrous Met. Soc. China 2020, 30, 668–677. [Google Scholar] [CrossRef]
  99. Butt, M.Z.; Khiliji, M.S. On the strength and stress-relaxation response of fine-grained Cu-42.2at%Zn-0.6at%Pd alloy polycrystals. J. Alloys Compd. 2009, 479, 252–256. [Google Scholar] [CrossRef]
  100. Suzuki, Y.; Ueno, K.; Murasawa, K.; Kusuda, Y.; Takamura, M.; Hakoyama, T.; Hama, T.; Suzuki, S. Effect of surface area of grain boundaries on stress relaxation behavior in pure copper over wide range of grain size. Mater. Sci. Eng. A 2020, 794, 139585. [Google Scholar] [CrossRef]
  101. Butt, M.Z.; Kauser, N.; Akbar, S.; Shaheed, S.S.; Siddiq, M.; Arshad, M.; Ashraf, M. Loss a stress equivalence in the strain-rate sensitivity of flow stress in fine-grain polycrystalline copper. Phys. Stat. Sol. 1999, 173, 349–356. [Google Scholar] [CrossRef]
  102. Butt, M.Z.; Kauser, N.; Akbar, S.; Shaheed, S.S.; Siddiq, M.; Arshad, M.; Ashraf, M. Grain size and plastic strain as co-determinants of stress-relaxation process in polycrystalline nickel. J. Mater. Sci. Lett. 1996, 15, 1381–1383. [Google Scholar] [CrossRef]
  103. Mohebbi, M.S.; Akbarazadeh, A.; Yoon, Y.-O.; Kim, S.-K. Stress relaxation and flow behavior of ultrafine grained AA1050. Mech. Mater. 2015, 89, 23–34. [Google Scholar] [CrossRef]
  104. Wang, Y.M.; Hamza, A.V.; Ma, E. Temperature-depended strain rate sensitivity and activation volume of nanocrystalline Ni. Acta Mater. 2006, 54, 2715–2726. [Google Scholar] [CrossRef]
  105. Kapoor, R.; Chakravartty, J.K. Deformation behavior of an ultrafine-grained Al-Mg alloy produced by equal-channel angular pressing. Acta Mater. 2007, 55, 5408–5418. [Google Scholar] [CrossRef]
  106. Ko, Y.G.; Kim, J.H.; Lee, C.S.; Shin, D.H.; Semiatin, S.L. Load relaxation behavior of ultra-fine grained Ti-6Al-4V alloy. Mater. Sci. Forum 2005, 475–479, 2955–2960. [Google Scholar] [CrossRef]
  107. Goyal, A.; Doquet, V.; Pouya, A. Grain boundary sliding and strain rate sensitivity of coarse and fine/ultrafine grained 5082 aluminum alloys. Metall. Mater. Trans. A 2020, 51, 1109–1122. [Google Scholar] [CrossRef]
  108. Chuvil’deev, V.N.; Nokhrin, A.V.; Boldin, M.S.; Baranov, G.V.; Sakharov, N.V.; Belov, V.Y.; Lantsev, E.A.; Popov, A.A.; Melekhin, N.V.; Lopatin, Y.G.; et al. Impact of mechanical activation on sintering kinetics and mechanical properties of ultrafine-grained 95W-Ni-Fe tungsten heavy alloys. J. Alloys Compd. 2019, 773, 666–688. [Google Scholar] [CrossRef]
  109. Zheng, Z.J.; Gao, Y.; Liu, J.W.; Zhu, M. A hybrid refinement mechanism of microstructure of 304 stainless steel subjected to ECAP at 500 °C. Mater. Sci. Eng. A 2015, 639, 615–625. [Google Scholar] [CrossRef]
  110. Kisko, A.; Misra, R.D.K.; Talonen, J.; Karjalainen, L.P. The influence of grain size on the strain-induced martensite formation in tensile straining of an austenitic 15Cr-9Mn-Ni-Cu stainless steel. Mater. Sci. Eng. A 2013, 578, 408–416. [Google Scholar] [CrossRef]
  111. Yamashita, A.; Horita, Z.; Langdon, T.G. Improving the mechanical properties of magnesium amd magnesium alloy through severe plastic deformation. Mater. Sci. Eng. A 2001, 300, 142–147. [Google Scholar] [CrossRef]
  112. Shaeri, M.; Ebrahimi, M.; Salehi, M.; Seyyedein, S.H. Effect of ECAP temperature on microstructure and mechanical properties of Al-Zn-Mg-Cu alloys. Prog. Nat. Sci. Mater. Int. 2016, 26, 182–191. [Google Scholar] [CrossRef] [Green Version]
  113. Straumal, B.B.; Kulagin, R.; Klinger, L.; Rabkin, E.; Straumal, P.B.; Kogtenkova, O.A.; Baretzky, B. Structure refinement and fragmentation of precipitates under Severe Plastic Deformation: A review. Materials 2022, 15, 601. [Google Scholar] [CrossRef]
  114. Razumov, I.K.; Yermakov, A.Y.; Gornostyrev, Y.N.; Straumal, B.B. Nonequilibrium phase transformations in alloys under severe plastic deformation. Physics-Uspekhi 2020, 63, 733–757. [Google Scholar] [CrossRef]
  115. Martin, J.; Doerty, R. Stability of Microstructure of Metallic Systems; Cambridge Univ. Press: Cambridge, UK, 1976; p. 426. [Google Scholar]
  116. Frost, H.J.; Ashby, M.F. Deformation-Mechanism Maps: The Plasticity and Creep of Metals and Ceramics; Pergamon Press: Oxford, UK, 1982; p. 165. [Google Scholar]
  117. Pickering, F.B. Physical Metallurgy and the Design of Steels; Applied Science Publ. Ltd.: London, UK, 1978; p. 275. [Google Scholar]
  118. Gol’dshteyn, M.I.; Litvinov, V.S.; Bronfin, B.M. Metal Physics of High-Strength Alloys; Metallurgiya: Moscow, Russia, 1986; p. 312. (In Russian) [Google Scholar]
  119. Chuvil’Deev, V.N.; Nokhrin, A.V.; Myshlyaev, M.M.; Kopylov, V.I.; Lopatin, Y.G.; Melekhin, N.V.; Piskunov, A.V.; Bobrov, A.A.; Pirozhnikova, O.E. Effect of recovery and recrystallization on the Hall-Petch relation parameters in submicrocrystalline metals: I. Experimental studies. Russ. Metall. Met. 2018, 1, 71–89. [Google Scholar] [CrossRef]
  120. Kuznetsov, A.R.; Starikov, S.A.; Sagaradze, V.V.; Stepanov, I.A.; Pechenkin, V.A.; Michael, G. Studying deformation-induced segregation in the Fe-Cr-Ni alloy. Phys. Met. Metallogr. 2004, 98, 294–299. (In Russian) [Google Scholar]
  121. Deryagin, A.I.; Zavalishin, V.A.; Sagaradze, V.V.; Kuznetsov, A.R. Low-temperature strain-induced atomic segregation in chromium-nickel steels. Phys. Met. Metallogr. 2000, 89, 610–621. (In Russian) [Google Scholar]
Figure 1. Deformation scheme during ECAP (a) and general view of specimens obtained by ECAP at 150 °C (b).
Metals 13 00045 g001
Figure 2. Specimens (a,b) and test procedures (c,d). General view of specimens prepared for tension (a) and stress-relaxation (b) tests. Stress-relaxation test technique: (c) typical load and σi(t) relaxation curves, (d) ∆σi(σ) typical curve.
Metals 13 00045 g002
Figure 3. Microstructure of steel in its initial state: (a,b) δ-phase particles in steel in its initial state ((a)—optical microscopy; (b)—SEM); (c,d) microstructure of austenite grains (TEM).
Metals 13 00045 g003
Figure 4. Macrostructure (a,b) and microstructure (cf) of UFG steel specimens: (a,b) macrostructure of steel specimens after the first ECAP cycle at 150 °C (a) and 450 °C (b); TEM-microphotographs and electron diffraction patterns of a steel microstructure after ECAP (N = 4) at 150 °C (ce) and 450 °C (f). Nanotwins in (f) are marked with dash lines. (b) shows microscopic shear bands.
Metals 13 00045 g004
Figure 5. Results of XRD phase analysis of steel specimens in their initial state (line (1)) and after ECAP (lines (2)–(9)): (2) N = 1 at 150 °C; (3) N = 2 at 150 °C; (4) N = 3 at 150 °C; (5) N = 4 at 150 °C; (6) N = 1 at 450 °C; (7) N = 2 at 450 °C; (8) N = 3 at 450 °C; (9) N = 4 at 450 °C.
Metals 13 00045 g005
Figure 6. Dependences of mean grain sizes on 1-h annealing temperature for UFG steel specimens subjected to ECAP at TECAP = 450 °C (a) and SEM images of microstructure after annealing at different temperatures: (b) 750 °C (ECAP, N = 4 at 450 °C); (c,d) 750 °C (ECAP, N = 3 at 450 °C); (e) 900 °C (ECAP, N = 3 at 450 °C); (f) 900 °C (ECAP, N = 4 at 450 °C).
Metals 13 00045 g006
Figure 7. Nucleation of σ-phase particles in UFG steels (N = 4, TECAP = 450 °C) after heating to 800 °C and holding for 60 min. TEM-microphotographs (a) and electron diffraction patterns (b). Intensive particle nucleation regions are marked with dash lines.
Metals 13 00045 g007
Figure 8. Results of investigations of mechanical properties of UFG steel (TECAP = 450 °C): (a) dependencies of mean grain sizes and mechanical properties of steel on the number of ECAP cycles; (b) dependence of the yield strength on grain size on σy–d−1/2 axes.
Metals 13 00045 g008
Figure 9. Dependencies of the macroelasticity stress (a) and yield strength (b) on temperatures during 1 h annealing of UFG steel.
Metals 13 00045 g009
Figure 10. Stress–strain tension curves for CG and UFG steel specimens at RT.
Metals 13 00045 g010
Figure 11. Fractographic analysis of fractures of steel specimens after tension tests at RT: (a,b) coarse-grained steel, (c,d) UFG steel (N = 4, TECAP = 150 °C), (e,f) UFG steel (N = 4, TECAP = 450 °C). (a,b): Zone 1—a fibrous fracture zone; Zone 2—a radial zone; Zone 3—a cut zone; (d): a fibrous zone consisting of a set of pits and featuring viscous fracture.
Metals 13 00045 g011
Figure 12. Results of stress-relaxation tests: (a) stress-relaxation curves for CG and UFG steel specimens; (b) stress-relaxation curves for UFG steel specimens (ECAP, N = 1, 150 °C) after annealing at different temperatures.
Metals 13 00045 g012
Figure 13. Results of electrochemical investigations of CG and UFG steel specimens: (a) Tafel curves lg(i)–E; (b) results of DLEPR tests.
Metals 13 00045 g013
Figure 14. Surfaces of CG steel specimens (a,c) and UFG steel specimens (N = 4, 450 °C) (b,d) after DLEPR tests (a,b) and after tests in a boiling acid solution (c,d).
Metals 13 00045 g014
Figure 15. The effect of annealing temperature on IGC resistance in UFG steel. The results of investigations of resistance against IGC by DLEPR: lg(i)–E curves for UFG steel after ECAP at 150 °C (a,b), 450 °C (c,d) and annealing at 600, 700, 800 °C, 1 h.
Metals 13 00045 g015
Figure 16. Contributions of microstructure parameters to yield strength in CG and UFG steel.
Metals 13 00045 g016
Figure 17. Dependences of stress-relaxation magnitude on stress applied on ln(∆σi) − 1−σ/σb axes: (a) comparison of CG and UFG steels (analysis of the data presented in Figure 12a); (b) effect of annealing temperatures on relaxation curves for UFG steel (analysis of the data presented in Figure 12b).
Metals 13 00045 g017
Table 1. Results of the mechanical tests and corrosions tests of CG and UFG steel.
Steel Mechanical Tensile TestCorrosions Tests
Tafel Test ResultsDLEPR Test Results (GOST 9.914-91)IGC Test (GOST 6232-2003)
σb, MPaδ, %Ecorr, mVicorr, mA/cm2Vcorr, mm/yearS1/S2, 104Corrosion Type *Corrosion Type *
Coarse-grained steel 720125−4030.0730.580.93IGCIGC and PC
ECAP, N = 1, T = 150 °C--−4020.0720.561.64UC PC
ECAP, N = 2, T = 150 °C103055−4030.0830.641.96UCPC
ECAP, N = 3, T = 150 °C110040−4040.0840.652.07UC-
ECAP, N = 4, T = 150 °C110045−4040.0840.652.34UC-
ECAP, N = 1, T = 450 °C--−4040.0920.712.78UCPC
ECAP, N = 2, T = 450 °C95070−4060.0840.643.25UC-
ECAP, N = 3, T = 450 °C95065−4060.0990.772.41UC-
ECAP, N = 4, T = 450 °C102060−4030.0970.752.22UC-
* IGC—intergranular corrosion, UC—uniform corrosion, PC—pitting corrosion.
Disclaimer/Publisher’s Note: The statements, opinions and data contained in all publications are solely those of the individual author(s) and contributor(s) and not of MDPI and/or the editor(s). MDPI and/or the editor(s) disclaim responsibility for any injury to people or property resulting from any ideas, methods, instructions or products referred to in the content.

