Article

Effect of Toughness and Ductility on the Cavitation Erosion of Martensitic Stainless Steel

1
CAS Key Laboratory of Nuclear Materials and Safety Assessment, Institute of Metal Research, Chinese Academy of Sciences, Shenyang 110016, China
2
School of Materials Science and Engineering, Shenyang Aerospace University, Shenyang 110136, China
*
Author to whom correspondence should be addressed.
Metals 2023, 13(1), 154; https://doi.org/10.3390/met13010154
Submission received: 9 December 2022 / Revised: 29 December 2022 / Accepted: 2 January 2023 / Published: 12 January 2023
(This article belongs to the Special Issue Corrosion and Protection of Metallic Materials)

Abstract

:
Martensitic stainless steel containing 13% Cr–4% Ni suffers cavitation erosion (CE) as the common material of hydro turbine impellers. Two 13% Cr–4% Ni stainless steel samples were obtained by different melting and heating processes. One was of relatively low toughness but high ductility (LTHD), and the other was of relatively high toughness but low ductility (HTLD). This paper is to clarify the relationship between the mechanical properties and the CE resistance of the experimental steel samples. The CE of the two materials was studied using an ultrasonic vibration cavitation erosion rig. Mass loss, morphological observation, nanoindentation characterization, and tensile tests were employed to clarify the erosion mechanism. The results showed that LTHD stainless steel had slightly higher ductility, but lower toughness than HTLD material. The mass loss method verified that the CE resistance of LTHD material was higher than that for the HTLD material. In addition, both materials had an incubation stage of 2 h in the distilled water. The SEM revealed that material removal was preferentially initiated from the grain boundaries and slip zone after the incubation period. The ductility could delay the fracture of the material, which contributed more to cavitation erosion resistance than the toughness of the materials. The hardness test showed few relationships with the CE resistance.

1. Introduction

Cavitation erosion (CE) is one of the most common forms of damage in pipelines, propeller blades, turbines, and pumps [1,2]. Nearly 40% of the turbine units in China are damaged by CE to varying degrees, which not only reduces efficiency but even causes shutdowns and accidents. Many methods can be utilized to improve the CE resistance, including increasing the tolerance of the materials to CE [1,3,4,5,6] and reducing the harshness of CE conditions [7,8,9,10,11]. Materials selection is a basic and widely adopted approach to resisting CE.
Materials’ resistance to CE is closely related to their mechanical properties, such as hardness [1,12], microstructure [13,14], stacking fault energy [15], and superelasticity [16]. Niederhofer et al. [17] investigated the CE of CrMnCN austenitic stainless steels. They found high CE resistance was partially due to the material’s toughness. Sasaki et al. [18] discovered that increasing fatigue strength could also enhance the CE resistance of the additive manufacturing of Ti-6Al-4V. He et al. [19] studied the CE of four metals: copper, brass, pure aluminum, and aluminum alloy. They pointed out that the yield strength was proportional to CE resistance. It can be observed that there is no individual parameter that is widely accepted and identified for evaluating CE resistance. The composition parameters were recommended to comprehensively analyze the relations [20]. However, it is difficult to distinguish the individual action of the mechanical properties from the change in microstructure or hardness.
Normally, a material’s hardness is positively correlated to its resistance to CE [13,21,22]. However, it is not the crucial parameter of CE for a hyper-elastic material [23,24,25]. In addition, toughness and ductility are closely related to CE [17]. Beak et al. [20] studied the influence of ductility and load on erosion. They deemed that mechanical and microstructural factors should be considered simultaneously. Paolantonio and Hanke [26] reported that high material strength could reduce ductile damage and slow CE progression. However, up to now, few published studies have been carried out on the relationship between CE and toughness and ductility. It was known that the higher the matrix toughness of most materials, the slower the crack expansion rate [27,28,29]. Interestingly, toughness and ductility are contradictory parameters. For the same kind of material, which can be more suitable to represent the CE resistance of the material? How do the toughness and the ductility affect the CE process? Unfortunately, there is rare investigation to solve the problems described above. The novelty of this work is to clarify the effect of toughness and ductility on CE performance.
Two martensitic stainless steels (13% Cr–4% Ni stainless steel) with different toughness and ductility were selected for these CE experiments. Their CE resistance was compared through mass loss measurements and surface morphology observation. X-ray diffraction measurements, nanoindentation tests, and roughness measurements were also employed for the CE mechanism analysis. The effect of the toughness and ductility on the CE of the two martensitic stainless steels is discussed.

2. Experimental

2.1. Materials and Properties

A commonly used martensitic stainless steel for hydro turbines, 0Cr13Ni4Mo (13% Cr–4% Ni) was utilized as the target material. Figure 1 shows the microstructures of the low-toughness but high-ductility (LTHD) specimen, and high-toughness but low-ductility (HTLD) specimen obtained by metallurgical microscopy before CE testing. The samples were first polished and then etched with ferric chloride etching solution before the observation. It can be observed that both LTHD and HTLD 13% Cr–4% Ni materials are characteristic of plate-like martensitic organization [30,31,32,33]. This indicates that the microstructure of the LTHD 13% Cr–4% Ni sample (Figure 1a) is similar to that of the HTLD sample (Figure 1b). Although the heat treatment method of the former materials was different from that of the latter, it seems that no obvious effect can be observed in the metallurgical structures.
The chemical compositions of the two materials are shown in Table 1. It can be observed that impure elements P and S were removed by the ultra-purified melting method. This method refers to vacuum induction and consumable smelting. The experimental material was first prepared by vacuum induction melting, and then refined by vacuum arc remelting to reduce the contents of tramp elements (P, S, O, etc.). These elements are harmful to the steel’s mechanical properties. The element P has great solubility in the ferrite, which can reduce the plasticity and enlarge the austenitic grains. In addition, the element S is prone to form sulfide (FeS, MnS), which distributes along grain boundaries causing them to be highly sensitive to cracks and brittleness.
Different toughness and ductility were obtained by different smelting processes and heat treatment methods. Low-toughness but high-ductility (LTHD) material was homogenized at 1050 °C, tempered once at 630 °C, and tempered twice at 590 °C for one hour for each condition. High-toughness but low-ductility (HTLD) material was normalized at 1000 °C for six hours and tempered at 600 °C for six hours followed by air cooling. The mechanical properties of the two materials were tested using an Amsler tensile machine according to ISO 6892 standard at room temperature [34]. The sample was machined into a lamellar, dog-bone-shaped tensile shape with a 15 mm gauge length and 2 mm2 cross-section. Three specimens were measured for each material, and the average value of the three measurements was calculated as the representative value.
The mechanical properties of the HTLD and LTHD 13% Cr–4% Ni martensitic stainless steels are listed in Table 2. Rm, Rp0.2, and A represent tensile strength (MPa), yield strength (MPa), and elongation after break, respectively. The strength of the LTHD material is almost the same as that of the HTLD material. The toughness of the former is approximately 95% of that of the latter. The ductility of LTHD material is enhanced by approximately 23% by using the control of the chemical composition (Table 1) and the ultra-purified melting method.

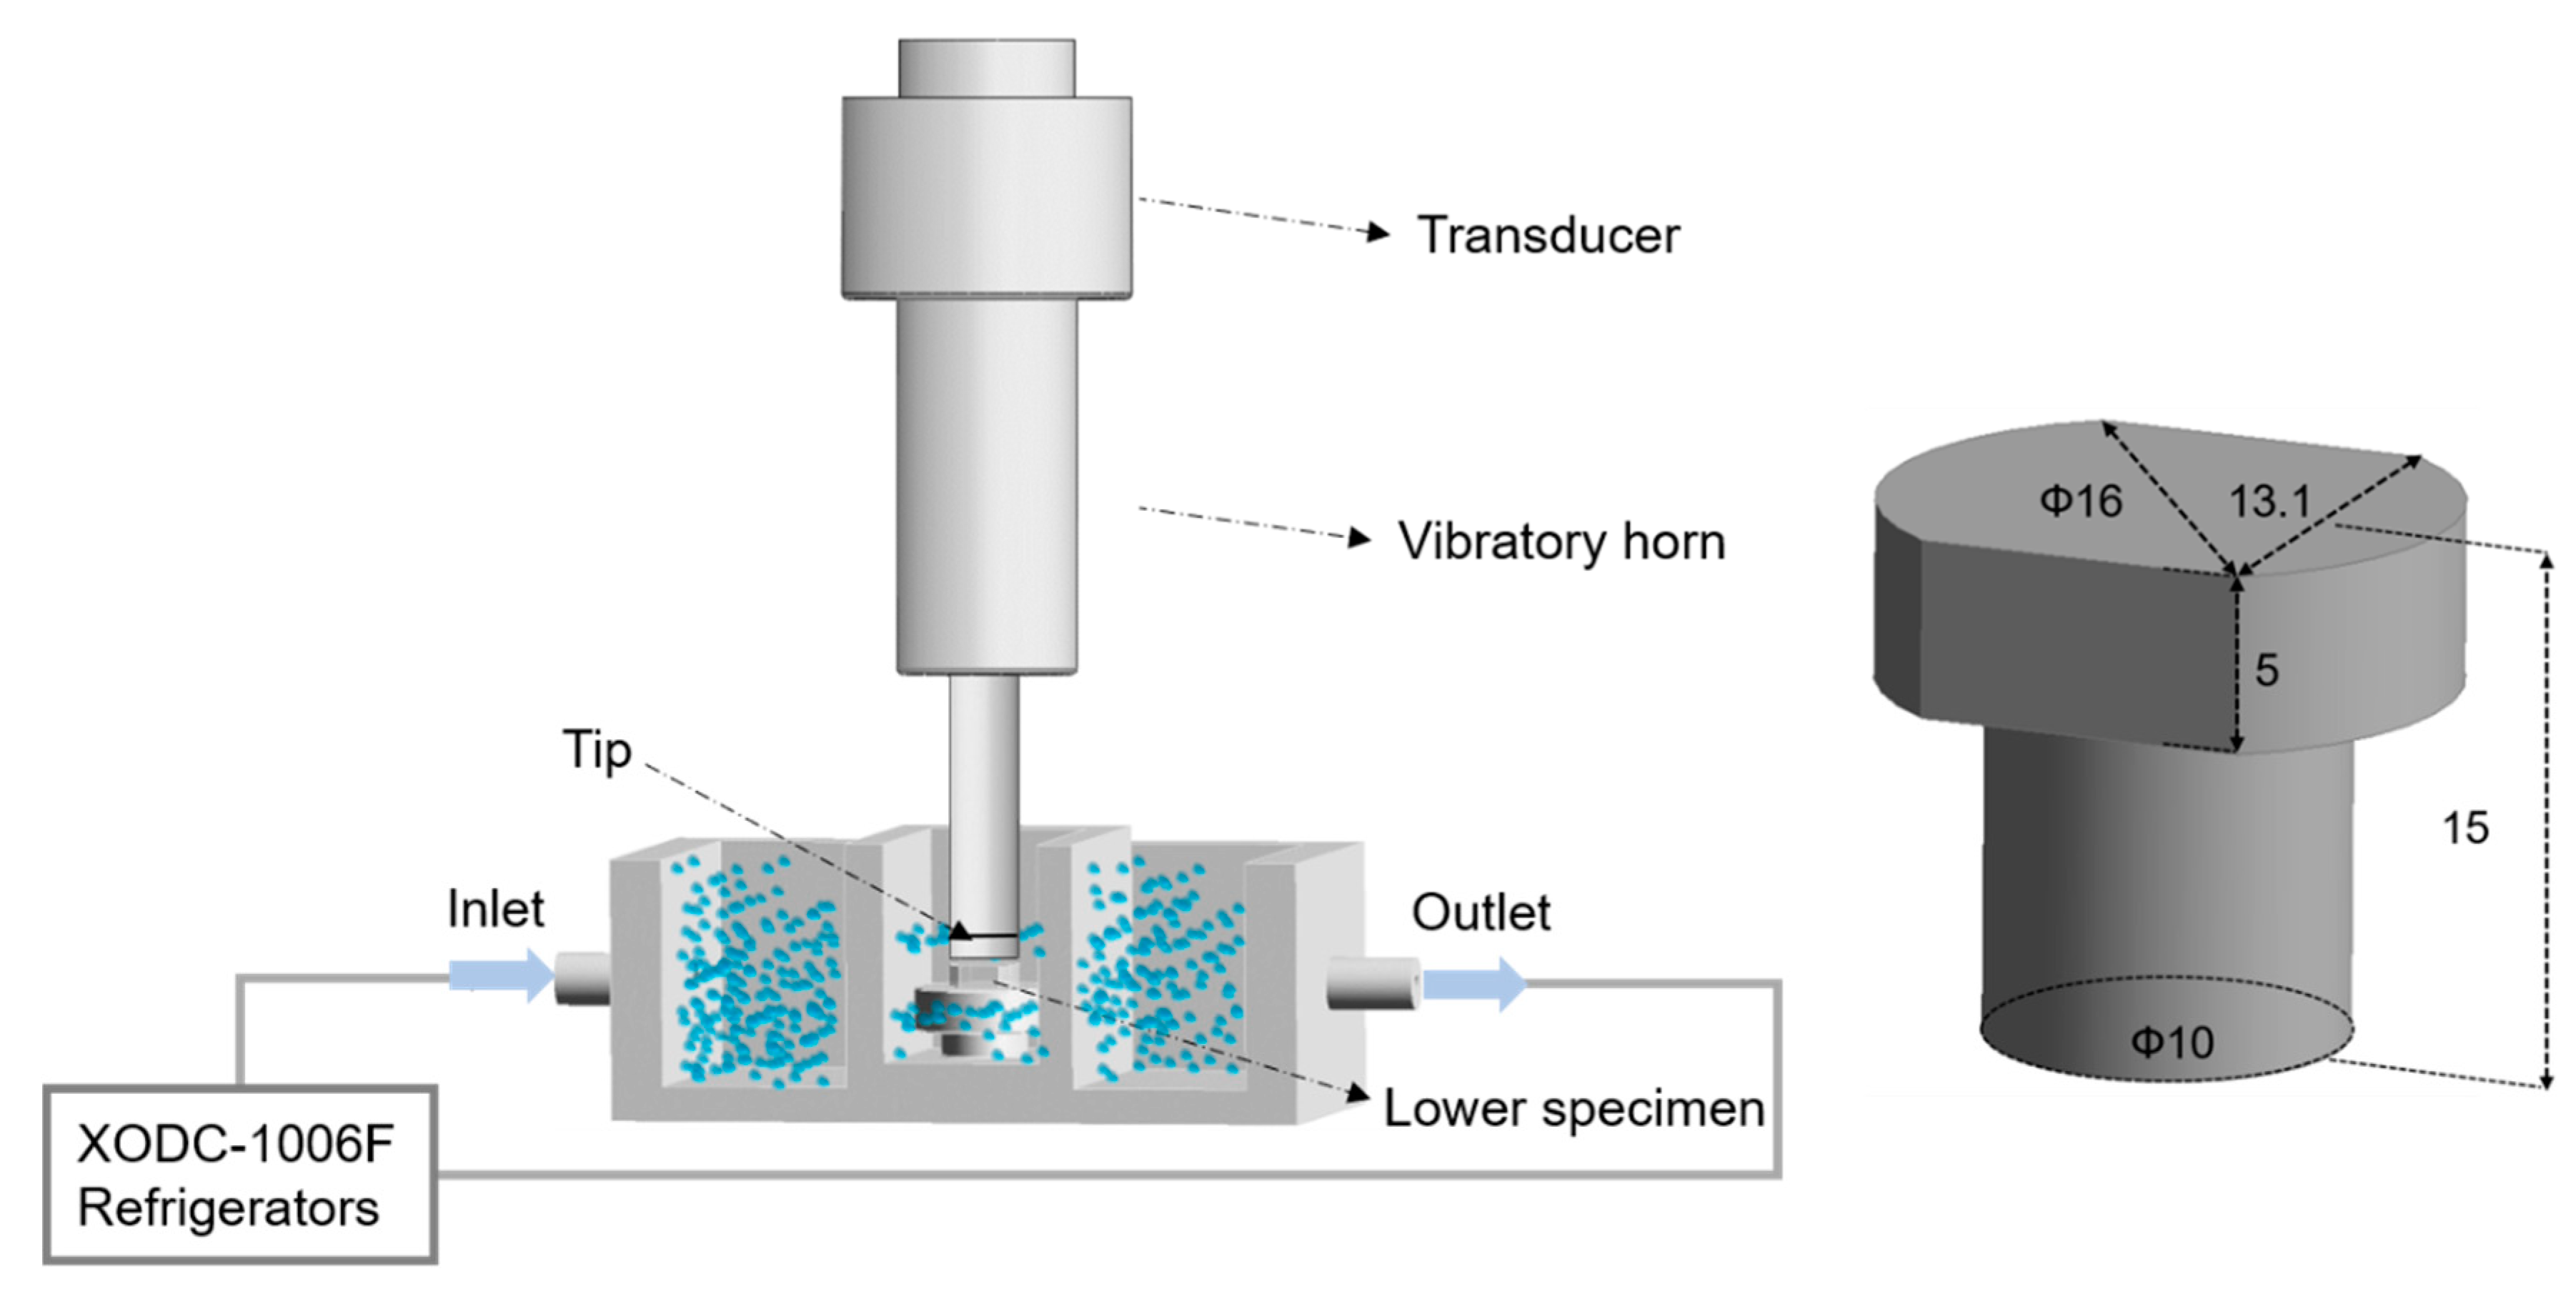
2.2. Cavitation Erosion Tests

CE experiments were performed with an ultrasonic vibration device, model XOQS-2500 (Nanjing Xian’ou, China) with a frequency of 20 kHz and a peak vibration amplitude of 50 μm [4,6,35]. Figure 2 shows the experimental rig and the sample. The specimens for the CE tests were polished with 240-, 400-, 800-, 1200-, and 2000-grit sandpaper, in sequence, followed by polishing with 2.5# diamond polishing paste. All the samples were ultrasonically washed in ethyl alcohol, dried with air, and weighed with an analytical balance (GL224-1SCN) (GL International Instrument, Shanghai, China) with an accuracy of 0.1 mg. The CE specimen was fixed on a specimen holder as a lower specimen with a distance of 0.5 mm from the tip of the titanium cavitation head. The tip material was TC4. Each specimen used a new tip. Therefore, the used titanium cavitation tip was replaced prior to each specimen experiment. Each tip lasted for 6 h. The CE experiments were carried out in deionized water of a volume of 2 L at a temperature of 25 ± 2 °C. The temperature of the solution was controlled with a cryostat model XODC-1006F (Nanjing Xian’ou, China). A representative result was calculated using the average mass loss based on at least three repeated values.
The metallographic structures of the materials were observed using a ZEISS optical microscope (Carl Zeiss AG, Guangzhou, China) after being etched with a ferric chloride solution. The erosion morphology after each CE time was analyzed with a Quattro S (Thermo Fisher Scientific, Waltham, MA, USA) field emission environmental scanning electron microscopy (SEM). Surface phase compositions were detected using X-ray diffraction (XRD) (PW3040/x0 X’Pert PRO Console equipment) (PANalytical B.V., Almelo (Netherlands) Eindhoven) before and after CE tests. A Nano Indenter G200 (Agilent Technologies Inc., CA, USA) device was utilized to measure the material’s hardness with a load of 20 mN, duration time of 20 s, and peak pressure for 10 s. The hardness measurement was performed at 10 different spots for each sample to ensure the representativeness of the data. White light interferometry (MicroXAM-1200) (KLA Corporation, CA, USA) was employed to measure the surface roughness.

3. Results and Discussion

3.1. Mass Loss and Mass Loss Rate

The variation of cumulative mass loss and mass loss rate of the two stainless steels with experimental time in deionized water is shown in Figure 3. It can be seen that both materials experienced a similar variation trend. The change in the cumulative mass loss had two stages: an incubation stage and an increasing stage (Figure 3a). In the first stage, there was almost no mass loss for both the LTHD and HTLD stainless steels and this trend lasted until 2 h. This stage is called the incubation stage, during which no obvious damage occurred [6]. After this stage, both the mass losses increased at different increasing rates, and the mass loss gap between the two materials became obvious. The cumulative mass loss of the LTHD material was less than that of the HTLD material at each moment. At the end of the experiment (6 h), the mass loss of the former material was 68.9% of that of the latter, indicating better CE resistance of LTHD stainless steel.
The mass loss rate followed the same trend as the cumulative mass loss (Figure 3b). A slow mass loss rate in the incubation stage and a high increasing mass loss rate in the rest time can be observed. In the incubation stage, the increasing rates were too small to be distinguished from each other. While in the next stage, the increasing trend of the LTHD material was almost the same as that of the HTLD material but at a lower value.
The mass loss was negatively correlated with the CE resistance [36]. The more mass loss, the lower the CE resistance. In this view, the LTHD material had a higher resistance to CE than the HTLD material, although they had the same incubation period (2 h). Generally speaking, the incubation period is a sign of CE resistance [37]. The material with a longer incubation period usually has higher CE resistance. However, this cannot apply to the case we studied. The CE resistances cannot be distinguished from each other only by the duration time of the incubation stage (Figure 3). It seems that the criteria for determining CE resistance during the incubation period are not suitable for the same kinds of materials.
The CE resistance depends on many parameters including hardness [38,39], work-hardening rate [30,40], plasticity [41], and so on. In the present case, two 13% Cr–4% Ni stainless steels differ in toughness and ductility (Table 2). For the austenitic stainless steels, high toughness corresponded to high CE resistance [18]. While the reverse was observed for 13% Cr–4% Ni martensitic stainless steel (Figure 3 and Table 2). The ductility of the LTHD material was higher than that of the HTLD material, which coincided with the trend of CE resistance. It seems that the difference in the CE resistance is more related to the ductility, which needs to be further clarified with more details of the CE characteristics.

3.2. Evolution of CE Morphology

Figure 4 shows the evolutions of the surface SEM morphologies of LTHD and HTLD 13% Cr–4% Ni stainless steels with CE time in deionized water. Slight plastic deformation occurred on both materials after 1 h of CE (Figure 4a,b). The amount and degree of the deformation were slightly less on the LTHD material (Figure 4a) than on the HTLD material (Figure 4b). More convex grain boundaries and slip bands could be identified on the HTLD material surface (Figure 4b) than on the LTHD material. However, no obvious material removal could be observed for both materials up to that time, which was consistent with the mass loss results (Figure 3). This indicates that the surfaces of the LTHD and HTLD materials were still dominated by the deformation mechanism. When the test time lasted for 2 h, the accumulated stress exceeded the material’s tensile strength resulting in the initiation of the material removal (Figure 4c,d). Partial spalling and fracture preferentially occurred on the deformed grain boundaries. At that moment, the dominant CE mechanism began to change from plastic deformation to material removal. This change was also reflected in the slight mass loss after CE for 2 h (Figure 3).
When the CE entered into the increasing stage, material removal was much more severe than that in the incubation stage (Figure 4e,f). This phenomenon was more obvious on the surface of the HTLD material (Figure 4f). Almost no original surface remained. In contrast, although the material spalling and the fracture became worse on the grain boundaries, they had not extended to the main parts of the grains (Figure 4e). The remaining original surface of the LTHD was much greater than that of the HTLD material, indicating higher CE resistance of LTHD material. This can be also seen in the comparison of the mass loss (Figure 3).
At the end of the CE test, severe CE occurred on both the LTHD and HTLD materials. The surface morphology of the former material was very similar to that of the latter. The entire surface was dominated by CE craters. Therefore, the CE resistance of the two materials could not be distinguished from each other only by the surface morphologies at the end of the test. This indicates that the CE resistance cannot be judged only by the erosion of surface morphologies. Moreover, the surface morphology characteristics of the two materials are not consistent with their cumulative mass loss. Compared with the morphology observation, mass loss is more suitable for evaluating the CE degree.
The morphology differences between the two materials were concentrated during the periods around the incubation stage. As the CE time further increased, severe CE covered up the CE differences, especially for the two materials with similar chemical compositions and mechanical properties. More details were needed to clarify the reasons causing the difference in CE. Therefore, local magnifications of the surface SEM morphologies in the incubation stage of the CE morphologies were performed, which are presented in Figure 5.
At the CE time of 0.5 h, plastic deformation occurred on the grains due to repeated bombardment of the cavitation bubbles for both materials (Figure 5a,d). The deformation accumulated and piled onto the grain boundaries, leading to material protrusions. After 1 h, the deformation was aggravated for both (Figure 5b,e). However, the deformation was more severe on the LTHD material (Figure 5b) than on the HTLD material (Figure 5e). At the critical time of the incubation stage, a small amount of material removal could be observed on both materials (Figure 5c,f). Local small CE pits characterized the surface of the LTHD stainless steel (Figure 5c), while the CE craters were concentrated on the grain boundaries of the HTLD stainless steel (Figure 5f). Moreover, it was noticed that the CE was still dominated by plastic deformation instead of material removal during this period.
LTHD material was more prone to deformation due to its lower toughness than HTLD (Figure 5b,e), while its high ductility could absorb more of the impact energy of the collapsing bubbles and remain unremoved (Figure 4f and Figure 5c). In contrast, HTLD material could delay the deformation due to its high toughness (Figure 5e). However, the material was more easily removed once deformation occurred, due to its low ductility (Figure 4g). Therefore, the effect of the toughness and the ductility on the CE could be determined through the SEM morphology characteristics in the incubation stage.
The X-ray diffraction patterns of LTHD and HTLD materials before and after the CE are shown in Figure 6. Before the CE test, the two materials had the same phase compositions. They were both composed of martensite (α phase) [42]. It is well known that the width of the XRD peaks indicates the grain size [43]. The narrower the peak, the larger the grain. The height and area of the peak imply the grain content. As can be seen from the graph (Figure 6), the LTHD had a similar grain size to that of the HTLD material. Moreover, neither HTLD nor LTHD materials had new phases created after CE, which suggests that no phase changes occurred under the condition of CE load.
Normally there is reversed austenite phase in this typical 13% Cr–4% Ni martensitic stainless steel [32,44]. However, it was not detected in the metallograph image (Figure 1) and the XRD results. This may be explained by the amount of the reversed austenite phase being too small to be detected.

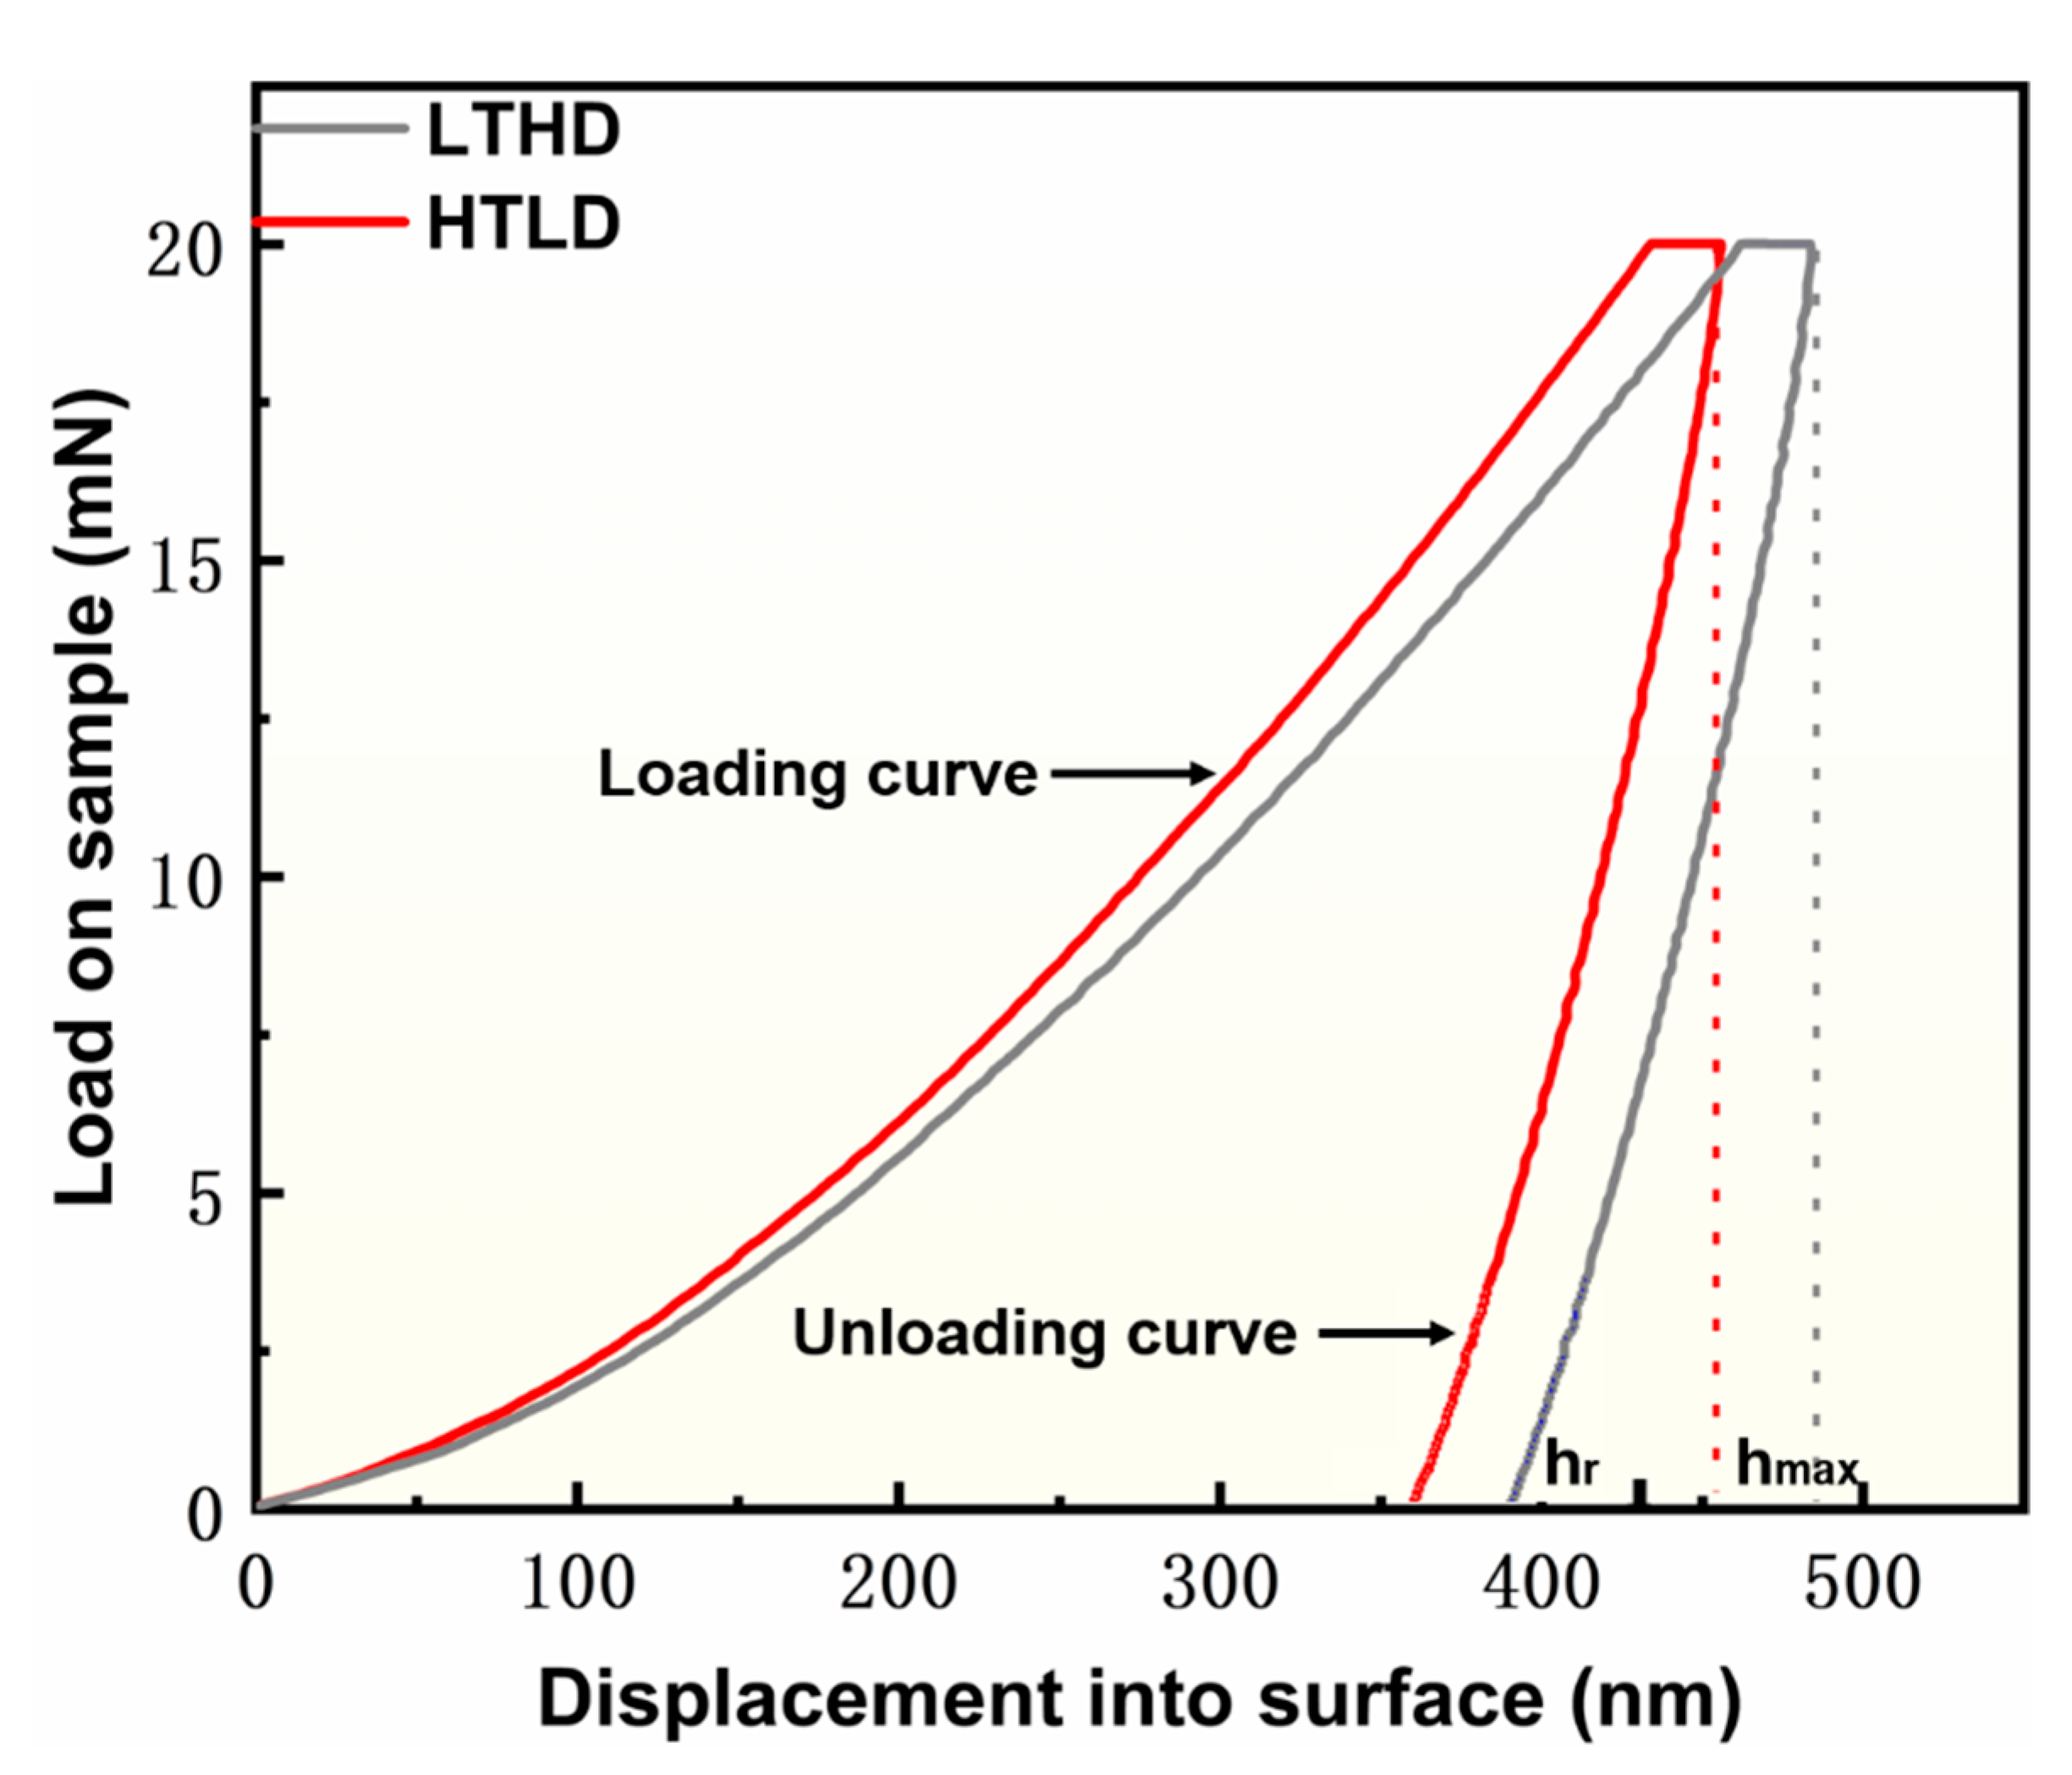
3.3. Nanoindentation

CE resistance is highly dependent on material hardness [4]. Therefore, the microhardness was measured by the nanoindentation equipment and the relationship to CE is discussed. Typical nanoindentation load–displacement curves for the LTHD and HTLD materials are plotted in Figure 7. The indentation parameters are listed in Table 3. The depth recovery ratio (ηh) characterizes the elastic behavior of the specimen, as shown in Equation (1):
η h = h m a x h r h m a x
where hmax is the maximum penetration depth, and hr is the residual depth after unloading. The hardness, Hd (GPa), can be calculated by the ratio of the peak indentation load (Fmax) to the projected area of hardness impression (Ac) using Equations (2) and (3), as follows:
H d = F m a x A C = F m a x 26.43 h c 2
h c = h m a x ε P h S
where hc is the contact depth at peak load; P(h) is the corresponding loa; ε is the correction index, taken as 0.75 [45]; and S is the slope of the unloading curve.
The maximum indentation depth (hmax) of LTHD material (454.8 nm) was slightly lower than that of the HTLD (483.9 nm), indicating its higher hardness (Table 3). The hardness of the former material (6.12 GPa) was approximately 1.04 times that of the latter material. High hardness is a sign of resistance to plastic deformation, because it may be caused by the dislocations being impeded along the slip plane [46].
The kinds of materials used in this study have similar metallographic structure, grain size (Figure 1), chemical composition (Table 1), and strength (Table 2). Therefore, the hardness could reflect more CE resistance because it was less prone to be disturbed by the other parameters. The LTHD material with higher hardness (Table 3) showed higher CE resistance than the HTLD material (Figure 3). This trend was found widely in many studies [1,47]. However, the hardness cannot greatly contribute to the CE resistance due to their few differences. From another point of view, this indicates that CE resistance is more likely to be related to toughness and ductility.
In addition to the hardness, the depth recovery ratio (ηh) of the LTHD material was also relatively higher than that of the HTLD material. This means that the elasticity of the former material was slightly higher than that of the latter material. Qiao et al. [45] found that material elasticity is proportional to the resistance to CE. They suggested that the increase in elastic energy played a crucial role in resisting CE. However, the depth recovery ratio of the LTHD was only 1.08 times that of the HTLD material. Therefore, the elasticity of the HTLD material contributed little to the CE resistance instead of being the determining parameter.
To sum up, the hardness and elasticity of LTHD material were both higher than that of the HTLD material, although the difference was not significant. One point is certain, that they did not play a negative role in enhancing the CE resistance, since they have similar metallographic structures and chemical compositions.

3.4. Roughness

Figure 8 presents the variation of the surface roughness of LTHD and HTLD materials with CE time in deionized water. At the end of the first hour, the surfaces of the LTHD and HTLD materials exhibited obvious fluctuation, due to plastic deformation (Figure 8a,b). This fluctuation reached the maximum when the CE was carried out for 2 h, which can be speculated from the obvious color contrast (Figure 8c,d). However, the surface roughness was similar to each other, which was consistent with the cumulative mass loss (Figure 3). Within the incubation stage, the roughness was mainly caused by plastic deformation.
After the incubation stage, the roughness value (Sa) increased by approximately 10% and 29% for LTHD and HTLD materials, respectively (Figure 8e,f). At the end of the CE tests, the values of Sa increased by more than 5 times that of the first hour for both the materials (Figure 8g,h). However, the visual fluctuation was not as severe as that reflected by the roughness value. This is because local deep CE craters contributed most of the Sa, which can be proved by the local dark red color in Figure 8g,h. This also indicates that most parts of the surface were uniformly removed, accompanied by local deep craters.
To further clarify the relationship between the mechanical properties and the CE resistance, more details on the CE characteristics are provided, in terms of roughness parameters. Table 4 presents the definitions of the roughness parameters used in this work. Figure 9 plots a bar graph of the roughness parameters Ssk, Sku, Spk, Sk, and Svk after CE for 6 h. Skewness is a parameter which is sensitive to deep valleys and high peaks since it can measure the symmetry of the profile around its mean line. The values of Ssk were −0.172 and −1.14 for the LTHD and HTLD materials, respectively. They were both negative, indicating there were more deep valleys than high peaks in the roughness profile of the two materials [48]. Additionally, the valleys on the LTHD material were less than those on the HTLD material, indicating less material removal and higher CE resistance.
On the contrary, kurtosis (Sku) reveals the probability density sharpness of the roughness profile. The value of Sku was more than 3 for LTHD, and less than 3 for HTLD materials, which indicates that the surface peaks were greater in number and sharper on the former materials (Figure 9). The sharp peaks of the HTLD material may be removed by CE, resulting in a blunt profile and high mass loss.
In addition to Ssk and Sku, Spk, Sk, and Svk can also describe the roughness features (Table 4). Comparing the three parameters, it can be observed that the height of the surface layer of LTHD material was lower than that of the HTLD material, indicating a bigger fluctuation (Spk). Higher Sk for the LTHD material suggests a higher base material remained after CE. In light of the Svk and Sk, lower Svk indicates shallower craters and less material removal.
All the above parameters prove that the LTHD material experienced less severe CE for the same test conditions. Its low toughness provides low resistance to the impact energy of the collapsing bubbles. However, its high ductility can undergo more severe surface fluctuation, which prevents more materials from spalling. By contrast, HTLD material is more prone to removal once the CE load exceeds the yield strength, due to its lower ductility, although its high toughness can better resist the impact of the collapsing bubbles at the beginning of CE (Figure 3 and Figure 9). Therefore, it can be deduced that ductility plays a more important role than toughness in resisting CE.

4. Conclusions

(1) Two 13% Cr–4% Ni martensite stainless steel specimens, one with low toughness but high ductility (LTHD), and one with high toughness but low ductility (HTLD), were obtained by controlling impure elements (P and S) and using technology for heat processing.
(2) The hardness showed few relationships with the CE resistance of LTHD and HTLD martensite stainless steel.
(3) The cavitation erosion resistance of LTHD stainless steel was higher than that of HTLD stainless steel, although they have the same incubation stage (2 h).
(4) For the same 13% Cr–4% Ni martensite stainless steel specimens, ductility, rather than toughness, contributed more to cavitation resistance.

Author Contributions

L.Z., experiment, methodology, writing—original draft preparation; H.H., writing—reviewing, investigation, data curation; X.G., writing—reviewing, validation, suggestion. All authors have read and agreed to the published version of the manuscript.

Funding

This research received no external funding.

Data Availability Statement

Not applicable.

Acknowledgments

The authors are particularly grateful to P. Wang and D.Z. Li at the Institute of Metal Research, Chinese Academy of Sciences for providing the raw materials and the related mechanical property analysis.

Conflicts of Interest

The authors declare that they have no known competing financial interests or personal relationships that could have appeared to influence the work reported in this paper.

References

  1. Abreu, M.; Elfsberg, J.; Jonsson, S. Cavitation erosion behavior of austempered ductile irons of increasing hardness. Wear 2021, 484–485, 204036. [Google Scholar] [CrossRef]
  2. Hu, H.X.; Zheng, Y.G. The effect of sand particle concentrations on the vibratory cavitation erosion. Wear 2017, 384–385, 95–105. [Google Scholar] [CrossRef]
  3. Pan, H.D.; Tao, J.; Meng, E.; Hu, H.X.; Wang, Z.B. The effects of sand particles on the synergy of cavitation erosion-corrosion of MIG welding stainless steel coating in saline water. Scanning 2020, 2020, 8876406. [Google Scholar] [CrossRef] [PubMed]
  4. Hu, H.X.; Jiang, S.L.; Tao, Y.S.; Xiong, T.Y.; Zheng, Y.G. Cavitation erosion and jet impingement erosion mechanism of cold sprayed Ni–Al2O3 coating. Nucl. Eng. Des. 2011, 241, 4929–4937. [Google Scholar] [CrossRef]
  5. Hu, H.X.; Zheng, Y.G.; Qin, C.P. Comparison of Inconel 625 and Inconel 600 in resistance to cavitation erosion and jet impingement erosion. Nucl. Eng. Des. 2010, 240, 2721–2730. [Google Scholar] [CrossRef]
  6. Li, Z.X.; Zhang, L.M.; Ma, A.L.; Hu, J.X.; Zhang, S.; Daniel, E.F.; Zheng, Y.G. Comparative study on the cavitation erosion behavior of two different rolling surfaces on 304 stainless steel. Tribol. Int. 2021, 159, 106994. [Google Scholar] [CrossRef]
  7. Shao, C.L.; Zhang, Z.Y.; Zhou, J.F. Study of the flow in a cryogenic pump under different cavitation inducements by considering the thermodynamic effect. Int. J. Numer. Methods Heat Fluid Flow 2019, 30, 4307–4329. [Google Scholar] [CrossRef]
  8. Chen, L.Y.; Zhang, L.X.; Peng, X.X.; Shao, X.M. Influence of water quality on the tip vortex cavitation inception. Phys. Fluids 2019, 31, 023303. [Google Scholar] [CrossRef]
  9. Hosbach, M.; Gitau, S.; Sander, T.; Leuteritz, U.; Pfitzner, M. Effect of taper, pressure and temperature on cavitation extent and dynamics in micro-channels. Exp. Therm. Fluid Sci. 2019, 108, 25–38. [Google Scholar] [CrossRef]
  10. Xu, W.L.; Wang, Q.F.; Wei, W.R.; Luo, J.; Chen, S.Y. Effects of air bubble quantity on the reduction of cavitation erosion. Wear 2021, 482–483, 203937. [Google Scholar] [CrossRef]
  11. Hosbach, M.; Skoda, R.; Sander, T.; Leuteritz, U.; Pfitzner, M. On the temperature influence on cavitation erosion in micro-channels. Exp. Therm. Fluid Sci. 2020, 117, 110140. [Google Scholar] [CrossRef]
  12. Ji, X.L.; Shan, Y.P.; Ji, C.C.; Wang, H.; Zhao, Z.X. Slurry erosion behavior of two Zr-based bulk metallic glasses. Wear 2021, 476, 203684. [Google Scholar] [CrossRef]
  13. Bregliozzi, G.; Schino, A.D.; Ahmed, S.I.U.; Kenny, J.M.; Haefke, H. Cavitation wear behaviour of austenitic stainless steels with different grain sizes. Wear 2005, 258, 503–510. [Google Scholar] [CrossRef]
  14. Zhang, L.M.; Li, Z.X.; Hu, J.X.; Ma, A.L.; Zhang, S.; Daniel, E.F.; Umoh, A.J.; Hu, H.X.; Zheng, Y.G. Understanding the roles of deformation-induced martensite of 304 stainless steel in different stages of cavitation erosion. Tribol. Int. 2021, 155, 106752. [Google Scholar] [CrossRef]
  15. Zhang, X.F.; Fang, L. The effect of stacking fault energy on the cavitation erosion resistance of α-phase aluminum bronzes. Wear 2002, 253, 1105–1110. [Google Scholar] [CrossRef]
  16. Cohen, T.; Durban, D. Cavitation in elastic and hyperelastic sheets. Int. J. Eng. Sci. 2010, 48, 52–66. [Google Scholar] [CrossRef]
  17. Niederhofer, P.; Huth, S. Cavitation erosion resistance of high interstitial CrMnCN austenitic stainless steels. Wear 2013, 301, 457–466. [Google Scholar] [CrossRef]
  18. Sasaki, H.; Takeo, F.; Soyama, H. Cavitation erosion resistance of the titanium alloy Ti–6Al–4V manufactured through additive manufacturing with various peening methods. Wear 2020, 462–463, 203518. [Google Scholar] [CrossRef]
  19. He, J.; Liu, X.M.; Li, B.B.; Zhai, J.X.; Song, J.Q. Cavitation erosion characteristics for different metal surface and influencingfactors in water flowing system. Appl. Sci. 2022, 12, 5840. [Google Scholar] [CrossRef]
  20. Beake, B.D. The influence of the H/E ratio on wear resistance of coating systems–Insights from small-scale testing. Surf. Coat. Technol. 2022, 442, 128272. [Google Scholar] [CrossRef]
  21. Nowakowska, M.; Łatka, L.; Sokołowski, P.; Szala, M.; Toma, F.L.; Walczak, M. Investigation into microstructure and mechanical properties effects on sliding wear and cavitation erosion of Al2O3–TiO2 coatings sprayed by APS, SPS and S-HVOF. Wear 2022, 508–509, 204462. [Google Scholar] [CrossRef]
  22. Zhao, L.Q.; Hu, H.X.; Zheng, Y.G.; Guo, X.M.; Pu, J.X. Behavior and mechanism of slurry erosion to grooved surface at different angles. Colloids Surf. A 2023, 656, 130410. [Google Scholar] [CrossRef]
  23. Yang, L.M.; Tieu, A.K.; Dunne, D.P.; Huang, S.W.; Li, H.J.; Wexler, D.; Jiang, Z.Y. Cavitation erosion resistance of NiTi thin films produced by Filtered Arc Deposition. Wear 2009, 267, 233–243. [Google Scholar] [CrossRef] [Green Version]
  24. Gerke, L.; Stella, J.; Schauer, J.C.; Pohl, M.; Winter, J. Cavitation erosion resistance of a-C:H coatings produced by PECVD on stainless steel and NiTi substrates. Surf. Coat. Technol. 2010, 204, 3418–3424. [Google Scholar] [CrossRef]
  25. Bitzer, M.; Rauhut, N.; Mauer, G.; Bram, M.; Vaßen, R.; Buchkremer, H.P.; Stöver, D.; Pohl, M. Cavitation-resistant NiTi coatings produced by low-pressure plasma spraying (LPPS). Wear 2015, 328–329, 369–377. [Google Scholar] [CrossRef]
  26. Paolantonio, M.; Hanke, S. Damage mechanisms in cavitation erosion of nitrogen-containing austenitic steels in 3.5% NaCl solution. Wear 2021, 464–465, 203526. [Google Scholar] [CrossRef]
  27. Price, J.N.; Hull, D. Effect of matrix toughness on crack propagation during stress corrosion of glass reinforced composites. Compos. Sci. Technol. 1987, 28, 193–210. [Google Scholar] [CrossRef]
  28. Matikainen, V.; Koivuluoto, H.; Vuoristo, P. A study of Cr3C2-based HVOF- and HVAF-sprayed coatings: Abrasion, dry particle erosion and cavitation erosion resistance. Wear 2020, 446–447, 203188. [Google Scholar] [CrossRef]
  29. Zheng, Z.B.; Long, J.; Guo, Y.; Li, H.; Zheng, K.H.; Qiao, Y.X. Corrosion and impact–abrasion–corrosion behaviors of quenching–tempering martensitic Fe–Cr alloy steels. J. Iron Steel Res. Int. 2022, 29, 1853–1863. [Google Scholar] [CrossRef]
  30. Heathcock, C.J.; Protheroe, B.E.; Ball, A. Cavitation erosion of stainless steels. Wear 1982, 81, 311–327. [Google Scholar] [CrossRef]
  31. Kumar, N.; Arora, N. Effect of solution treatment on slurry erosive wear performance of martensitic and nitrogen strengthened austenitic stainless steel. Mater. Lett. 2021, 284, 128932. [Google Scholar] [CrossRef]
  32. Santos, L.L.; Cardoso, R.P.; Brunatto, S.F. Behavior of the reversed austenite in CA-6NM martensitic stainless steel under cavitation. Wear 2020, 454–455, 203322. [Google Scholar] [CrossRef]
  33. Zhang, S.H.; Wang, P.; Li, D.Z.; Li, Y.Y. Investigation of the evolution of retained austenite in Fe–13%Cr–4%Ni martensitic stainless steel during intercritical tempering. Mater. Des. 2015, 84, 385–394. [Google Scholar] [CrossRef]
  34. ISO 6892-1:2019; Metallic Materials—Tensile Testing—Part 1: Method of Test at Room Temperature. International Organization for Standardization: Geneva, Switzerland, 2019.
  35. Zheng, Y.G.; Luo, S.Z.; Ke, W. Cavitation erosion–corrosion behaviour of CrMnB stainless overlay and 0Cr13Ni5Mo stainless steel in 0.5M NaCl and 0.5M HCL solutions. Tribol. Int. 2018, 41, 1181–1189. [Google Scholar] [CrossRef]
  36. Rajput, A.; Ramkumar, J.; Mondal, K. Cavitation resistance of a Cr-Mn stainless steel, a mild steel, and a high-carbon steel based on rust protectivity and corrosion behavior. J. Mater. Eng. Perform. 2021, 31, 439–447. [Google Scholar] [CrossRef]
  37. Pohl, M.; Stella, J. Quantitative CLSM roughness study on early cavitation-erosion damage. Wear 2002, 252, 501–511. [Google Scholar] [CrossRef]
  38. Park, M.C.; Kim, K.N.; Shin, G.S.; Yun, J.Y.; Shin, M.H.; Kim, S.J. Effects of Ni and Mn on the cavitation erosion resistance of Fe–Cr–C–Ni/Mn austenitic alloys. Tribol. Lett. 2013, 52, 477–484. [Google Scholar] [CrossRef]
  39. Abedini, M.; Ghasemi, H.M.; Ahmadabadi, M.N.L. Tribological behavior of NiTi alloy in martensitic and austenitic states. Mater. Des. 2009, 30, 4493–4497. [Google Scholar] [CrossRef]
  40. Liu, W.; Zheng, Y.G.; Liu, C.S.; Yao, Z.M.; Ke, W. Cavitation erosion behavior of Cr-Mn-N stainless steels in comparison with 0Cr13Ni5Mo stainless steel. Wear 2003, 254, 713–722. [Google Scholar] [CrossRef]
  41. Durban, D.; Birman, V.; Israel, H. On the elasto-plastie stress concentration at a circular hole in an anisotropie sheet. Acta Meehanica 1982, 43, 73–84. [Google Scholar] [CrossRef]
  42. Crawford, J.D. CA-6NM—An Update; Steel Founders Society of America: Crystal Lake, IL, USA, 1974; pp. 1–13. [Google Scholar]
  43. Hu, H.Z.; Hu, H.X.; Jiang, S.L.; Zheng, Y.G. Numerical study of flow past a circular cylinder using SSTκ-ω, LES and ELES formulations. Prog. Comput. Fluid Dyn. 2015, 15, 203–210. [Google Scholar] [CrossRef]
  44. Song, Y.Y.; Li, X.Y.; Rong, L.J.; Li, Y.Y.; Nagai, T. Reversed austenite in 0Cr13Ni4Mo martensitic stainless steels. Mater. Chem. Phys. 2014, 143, 728–734. [Google Scholar] [CrossRef]
  45. Qiao, Y.X.; Chen, J.; Zhou, H.L.; Wang, Y.X.; Song, Q.N.; Li, H.B.; Zheng, Z.B. Effect of solution treatment on cavitation erosion behavior of high-nitrogen austenitic stainless steel. Wear 2019, 424–425, 70–77. [Google Scholar] [CrossRef]
  46. Li, W.; Vittorietti, M.; Jongbloed, G.; Sietsma, J. The combined influence of grain size distribution and dislocation density on hardness of interstitial free steel. J. Mater. Sci. Technol. 2020, 45, 35–43. [Google Scholar] [CrossRef]
  47. Cheng, F.T.; Lo, K.H.; Man, H.C. NiTi cladding on stainless steel by TIG surfacing process: Part I. cavitation erosion behavior. Surf. Coat. Technol. 2003, 172, 308–315. [Google Scholar] [CrossRef]
  48. Sedlaček, M.; Gregorčič, P.; Podgornik, B. Use of the roughness parameters Ssk and Sku to control friction—A method for designing surface texturing. Tribol. Trans. 2016, 60, 260–266. [Google Scholar] [CrossRef]
  49. ISO 25178-2:2012; Geometrical Product Specifications (GPS)-Surface Texture: Areal—Part 2: Terms, Definitions and Surface Texture Parameters. International Organization for Standardization: Geneva, Switzerland, 2012.
Figure 1. Plate-like martensite metallographic organizations of (a) LTHD, and (b) HTLD martensitic stainless steels.
Metals 13 00154 g001
Figure 2. Schematic of ultra-sonic vibrational cavitation erosion equipment and a specimen.
Metals 13 00154 g002
Figure 3. Plot of the cumulative mass loss (a) and annual thinning rate (b) of the LTHD and HTLD 13% Cr–4% Ni martensitic stainless steels as a function of time in deionized water at 25 °C.
Metals 13 00154 g003
Figure 4. Surface morphologies of LTHD (a,c,e,g) and HTLD (b,d,f,h) after CE for 1 h (a,b), 2 h (c,d), 3 h (e,f), and 6 h (g,h) in deionized water.
Metals 13 00154 g004
Figure 5. Surface SEM morphologies of the LTHD (ac) and HTLD (df) materials after CE for 0.5 h (a,d), 1 h (b,e), and 2 h (c,f).
Metals 13 00154 g005
Figure 6. XRD patterns of the LTHD and HTLD before CE tests.
Metals 13 00154 g006
Figure 7. Nanoindentation test on the surface of LTHD and HTLD martensitic stainless steels.
Metals 13 00154 g007
Figure 8. Changes in surface roughness of LTHD and HTLD after different CE times.
Metals 13 00154 g008
Figure 9. Comparison of the roughness parameters of the LTHD and HTLD materials after CE for 6 h.
Metals 13 00154 g009
Table 1. Chemical compositions (in wt%) of LTHD and HTLD 13% Cr–4% Ni martensitic stainless steels.
MaterialCSiMnPSCrNiMoFe
LTHD0.040.400.600.0050.001813.004.50.50bal.
HTLD0.0420.410.590.0220.00312.844.670.53bal.
Table 2. Mechanical parameters of LTHD and HTLD 13% Cr–4% Ni martensitic stainless steels.
MaterialsRm (MPa)Rp0.2 (MPa)A%
LTHD110088016
HTLD111793013
Table 3. Indentation parameters derived from the load–displacement curves in Figure 7.
Materialshmax (nm)hr (nm)ηhHd (GPa)
LTHD454.8347.20.2376.118 ± 0.173
HTLD483.9377.80.2195.871 ± 0.202
Table 4. Roughness parameter definitions and the schematic profile.
Parameter (Unit)DefinitionSchematic Profile
SskSsk (Skewness) values represent the degree of bias of the roughness shape.Metals 13 00154 i001[48]
SkuSku (Kurtosis) value is a measure of the sharpness of the roughness profile.Metals 13 00154 i002[48]
Spk (μm)Height above the mean height, indicating the removed area.Metals 13 00154 i003[49]
Sk (μm)Height difference of the middle part of a peak.
Svk (μm)Depth of the valley below the middle part of the peak.
Disclaimer/Publisher’s Note: The statements, opinions and data contained in all publications are solely those of the individual author(s) and contributor(s) and not of MDPI and/or the editor(s). MDPI and/or the editor(s) disclaim responsibility for any injury to people or property resulting from any ideas, methods, instructions or products referred to in the content.

