Article

Ultrasonic Correction Measurement for Residual Stress in 5083 Aluminum Alloy Welded Component of High-Speed Train

1
Key Laboratory of Advanced Technologies of Materials, Ministry of Education, Southwest Jiaotong University, Chengdu 610031, China
2
CRRC Qingdao Sifang Co., Ltd., Qingdao 266071, China
3
Department of Chemical and Material Engineering, University of Auckland, Auckland 1052, New Zealand
4
Chengdu Institute of Special Equipment Inspection and Testing, Chengdu 610000, China
*
Author to whom correspondence should be addressed.
Metals 2023, 13(1), 137; https://doi.org/10.3390/met13010137
Submission received: 29 November 2022 / Revised: 1 January 2023 / Accepted: 5 January 2023 / Published: 10 January 2023
(This article belongs to the Special Issue Mechanical Properties of Metals Welding Joints)

Abstract

:
The measurement and control of residual stresses are crucial to the structural safety of high-speed trains. The critical refraction longitudinal wave method is extensively employed for the residual stress measurement, and the correction of the influencing factors is the key to the detection accuracy. However, the existing methods mostly give purely mathematical expressions which are only applicable to their studied materials. Hence, this paper proposes the specific influence factor correction method to enhance the applicability and accuracy, and the 5083 aluminum alloy welded component is utilized for testing. Subsequently, the stress coefficient K and the compensation acoustic time under the influence of internal factors are obtained by employing the proposed method, combined with the simulation to determine the focused detection zone, the hole-drilling and X-ray methods are utilized for comparisons, and the results indicate that the test data have a good coincidence. Meanwhile, the detection errors of each zone before and after the correction are analyzed. Moreover, combined with the experimental verification, it is found that the penetration depth of a critical refraction longitudinal wave approaches its one wavelength; the corresponding study is conducted with this characteristic and concludes that in the weld zone, the longitudinal residual stresses are mainly concentrated on the surface of the measured material. Finally, the above results indicate that the proposed method can provide more accurate measurements for engineering applications.

1. Introduction

The 5083 aluminum alloy is a high magnesium alloy that has characteristics of light weight, high strength, high corrosion resistance and easy processing [1,2]. Therefore, the 5083 aluminum alloy is a common material in the fields of rail transportation, ships and aerospace [3,4]. Meanwhile, this material is extensively employed for key components of the high-speed train body and underframe due to its good balance of mechanical properties [5,6]. Because of the welding process, the aluminum alloy components inevitably have uneven residual stresses distributed in the welded joints and the rest of the zone, which can affect the strength and fatigue life of the components [7,8]. In actual operation, the key components of high-speed trains are subjected to long-term alternating loads under complicated and variable environmental conditions [9,10]. Under the combined effect of the above factors and a corrosive environment, the aluminum alloy components tend to produce cracks in advance and eventually cause the failure of the components [11,12]. Therefore, the evaluation of residual stresses in the aluminum alloy component is essential. The existing residual stress measurement methods mainly include the contour method, the slitting method, the hole-drilling method, the neutron diffraction method, the X-ray method and the ultrasonic method [13,14,15]. The advantages of the ultrasonic method include that it is convenient to use, quick, portable, inexpensive and free of radiation hazards; thus, this method is more suitable for engineering applications among the above-mentioned measurement methods [16]. The essence of the ultrasonic method is to establish a relationship between the stress and the ultrasonic propagation acoustic time to achieve the evaluation of the stress, the corresponding evaluation parameter is called the stress coefficient of the material, and this correlation within the elastic limit is called the acoustoelastic effect, first proposed by S. Oka in 1937 [17]. Bray first proposed the critical refraction longitudinal wave (LCR wave) method in 1995, and Song determined that the sensitivity of the LCR wave to stress is the highest among different types of ultrasonic waves [18,19]. Since the LCR wave is a longitudinal wave that propagates along the surface of the material at a certain depth, this is very suitable for the residual stress measurement in metal components. Recent studies have revealed that ultrasonic testing has obtained wide attention in the field of non-destructive testing and evaluation, but there are still many issues that need to be studied [20]. Taking the LCR method as an example, since the ultrasonic testing is a sensitive operation, this method is susceptible to the internal and external factors during practical application, which leads to poor consistency and reliability of the test results; thus, the relevant industries are often more recognized the hole-drilling and X-ray methods. Qozam and Zhu employed the method of calibrating stress coefficients in the different microstructure zones, and this method compensates the influence of the internal factor on the detection accuracy to some extent [16,21]. However, they tended to ignore the correction of the reference acoustic time, and the given methods were mostly purely mathematical equations, without proposing a theoretical correction model with applicability. Aiming at the above issues, this paper utilizes the 5083 aluminum alloy welded components of the high-speed train underframe for testing and conducts the following research based on the LCR method. Firstly, the specific influence factor correction model is proposed and the focused detection zone is confirmed by the finite element simulation. Subsequently, through the calibration of the key parameters and experimental evaluation, the test results of the ultrasonic correction detection, the X-ray method and the hole-drilling method are compared to determine the effectiveness of the proposed model. Finally, the experimental verification is performed to determine the penetration depth of the LCR wave and the residual stress distribution trend of the measured material at the weld zone is studied.

2. Ultrasonic Measurement Method

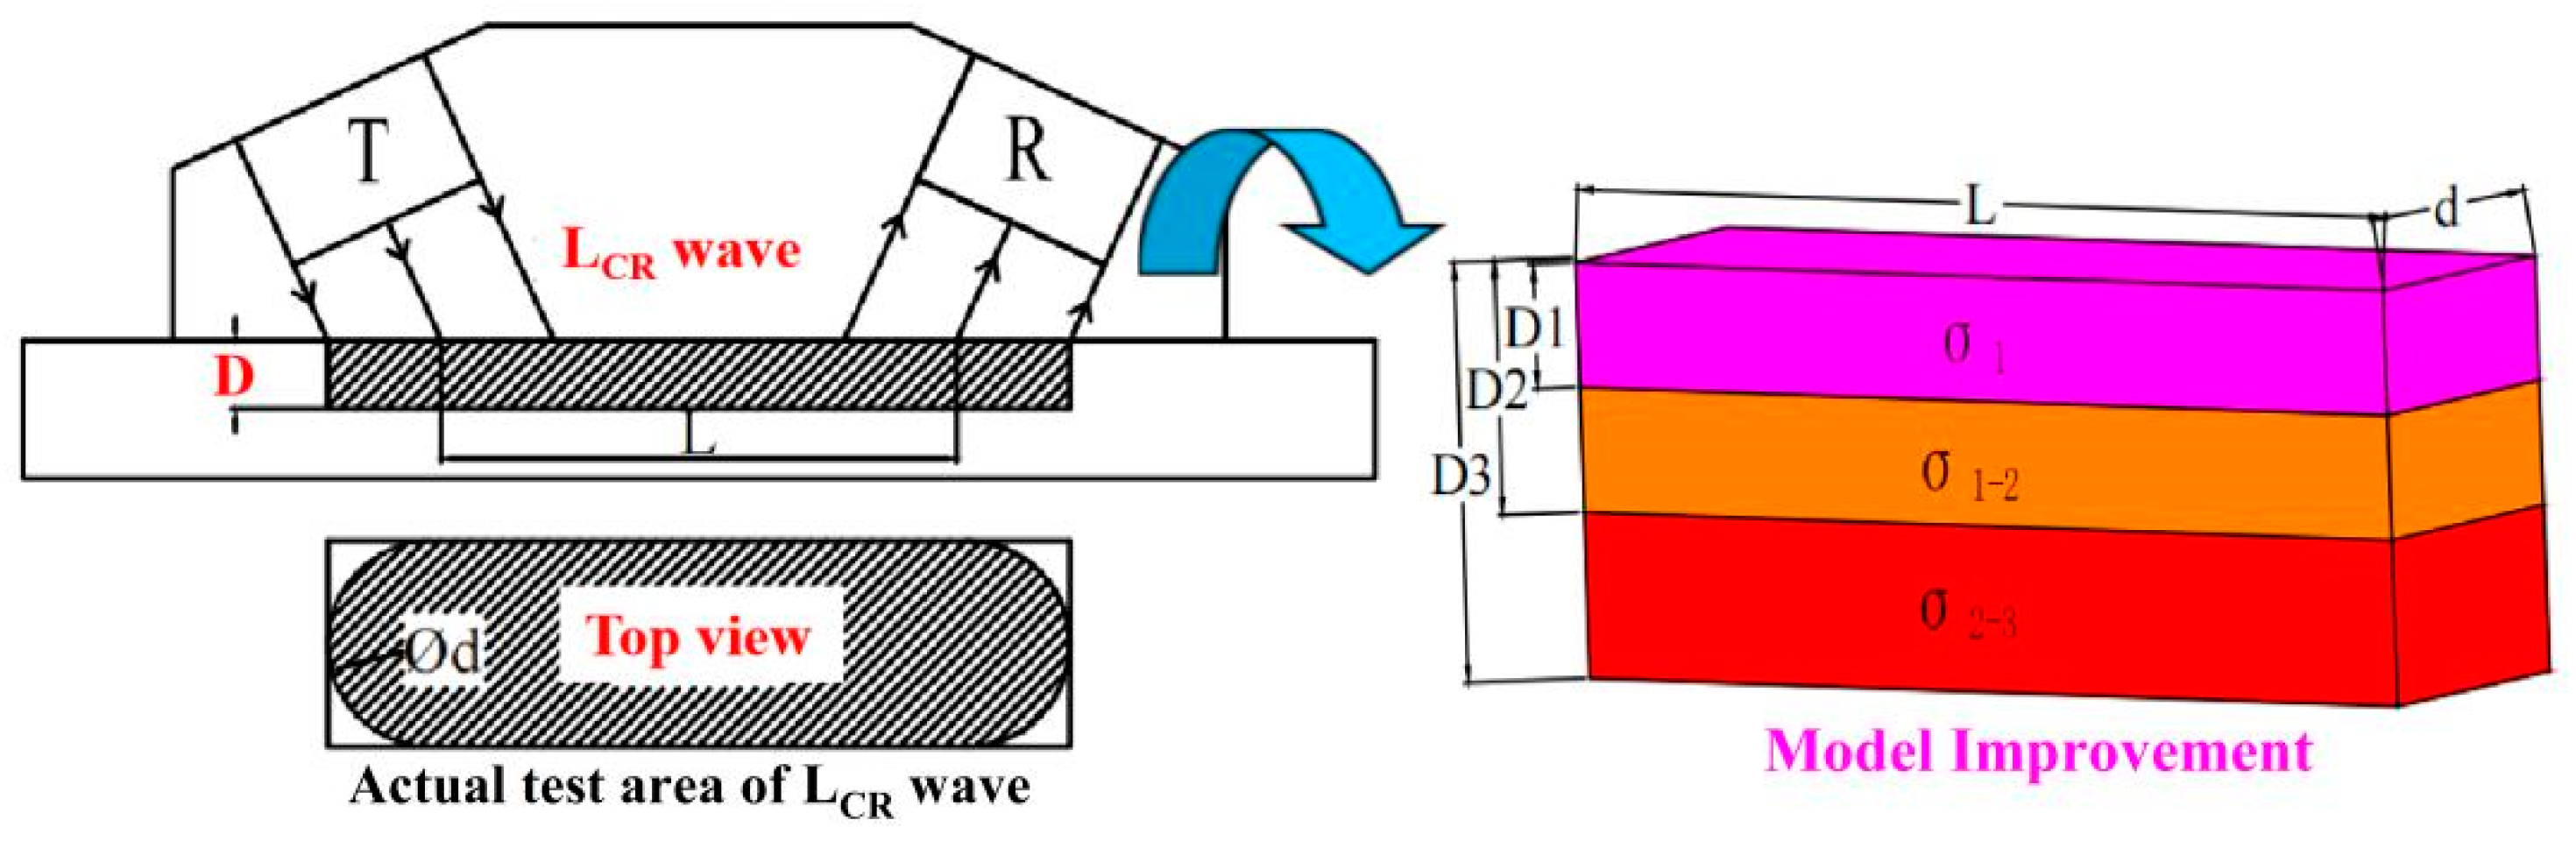
2.1. Theoretical Model of LCR Wave Method

Longitudinal wave is the most sensitive to stress, thus this paper utilizes longitudinal wave for testing. Acoustoelasticity theory indicates that when the isotropic solid material resists a single-direction stress, the relationship between longitudinal wave velocity and stress can be expressed as follows [22]:
ρ 0 V σ 2 = λ + 2 μ + σ 3 λ + 2 μ λ + μ μ 4 λ + 10 μ + 4 m + λ + 2 l
where Vσ [mm/ns] is the propagation velocity of longitudinal wave in a stressed material; ρ0 [g/cm3] is the density of the measured material; σ [N/mm2] is the stress applied to the longitudinal wave propagation path of the material; λ [kN/mm2] and μ [kN/mm2] are the second-order elastic constants of the measured material; m [kN/mm2] and l [kN/mm2] are the third-order elastic constants of the measured material.
According to Equation (1), the velocity of the longitudinal wave without stress is obtained, then Equation (1) can be further expressed as:
V σ 2 = V 0 2 1 + k σ
k = λ + μ μ 4 λ + 10 μ + 4 m + λ + 2 l V 0 2 3 λ + 2 μ
where V0 [mm/ns] is the propagation velocity of longitudinal wave in an unstressed material; k [mm2/N] is the acoustoelasticity coefficient of longitudinal wave.
After the derivation of Equation (2), considering that (V0Vσ) << V0, and for simplifying the model, it is approximated that V0/Vσ is equal to 1, then Equation (2) can be varied as follows:
Δ σ = 2 k V 0 . Δ V
where Δσ [N/mm2] and ΔV [mm/ns] denote the change in stress and longitudinal wave velocity, respectively.
If the longitudinal wave propagation acoustic distance is constant, the relationship between ΔV and the change in acoustic time is as follows:
Δ V = L t 2 . Δ t
where L [mm] and t [ns] denote the propagating acoustic distance and the propagation acoustic time in a material, respectively, and Δt [ns] is the change in propagation acoustic time.
Combining Equations (4) and (5), the following equation can be obtained:
Δ σ = 2 L k V 0 t 2 . Δ t
Similarly, the approximation is that the propagation acoustic time of zero stress is the same as t. Combined with Equation (3), the Equation (6) can be varied as follows:
Δ σ = K . t σ t 0
K = 2 V 0 3 λ + 2 μ λ + μ μ 4 λ + 10 μ + 4 m + λ + 2 l L
where K [N.mm−2.ns−1] is the stress coefficient of the measured material; tσ [ns] and t0 [ns] denote the longitudinal wave propagation acoustic time in a stressed and a reference material, respectively.
In Equation (7), Δσ is the stress change relative to the reference point, if the reference point is not subjected to the stress, Δσ presents the actual stress value of the material.
According to Snell’s law, when the longitudinal wave propagates along the first critical angle from a medium 1 with a slower wave velocity to a medium 2 with a faster wave velocity, the critical refraction longitudinal wave with a refraction angle equal to 90° can be generated, and the generation mechanism is shown in Figure 1. The first critical angle is calculated by the following equation.
θ L C R = arcsin V 1 V 2
where θLCR [°]is the first critical angle, V1 [mm/ns] and V2 [mm/ns] are the propagation velocities of longitudinal waves in medium 1 and medium 2, respectively.
In the actual application, the reflected waves propagating in medium 1 of the longitudinal wave can cause confusion in the identification of the LCR wave. Hence, the medium 1 material of the probe set needs to be grooved at the bottom to isolate the propagation path of the reflected waves.

2.2. Correction Model of Influence Factor

The accuracy of K and (tσt0) is the core of ensuring detection accuracy. When the measured material is affected by external or internal factors, the values of tσ, t0 and K2 will change accordingly. The currently proposed methods do not distinguish the differences between the internal and external factor corrections. When employing the LCR wave method, if the measured material is affected by the internal factor, the amount of change in the reference waveform before and after being affected needs to be calibrated. Then the internal factor correction model for stress detection can be expressed as follows:
σ = K h . Δ t h + t 0 t h
where Kh [N.mm−2.ns−1] is the tensile or compressive stress coefficient of the measured material; Δth [ns] is the change in acoustic time collected by the testing system under the influence of a certain factor; th [ns]and t0 [ns] are the LCR wave propagation acoustic times of the reference material before and after being affected, respectively.
Meanwhile, when the measured material is affected by the external factor, the actual amount of change in propagation acoustic time collected by the testing system is (t(σ,h)t0) because the reference waveform signal stored by the testing system is unchanged. However, the change in propagation acoustic time utilized to evaluate the stress should be (tσt0), thus, the acoustic time with the value of (tσt(σ,h)) needs to be compensated to avoid excessive errors. Similarly, the external factor correction model for stress detection can be expressed as follows:
σ = K h . Δ t h + t σ t σ , h
where K(h) [N.mm−2.ns−1] is the stress coefficient under the influence of the external factor; t(σ,h) [ns] is the LCR wave propagation acoustic time under the simultaneous influence of stress and the external factor; h is the characterization value of the influencing factor.

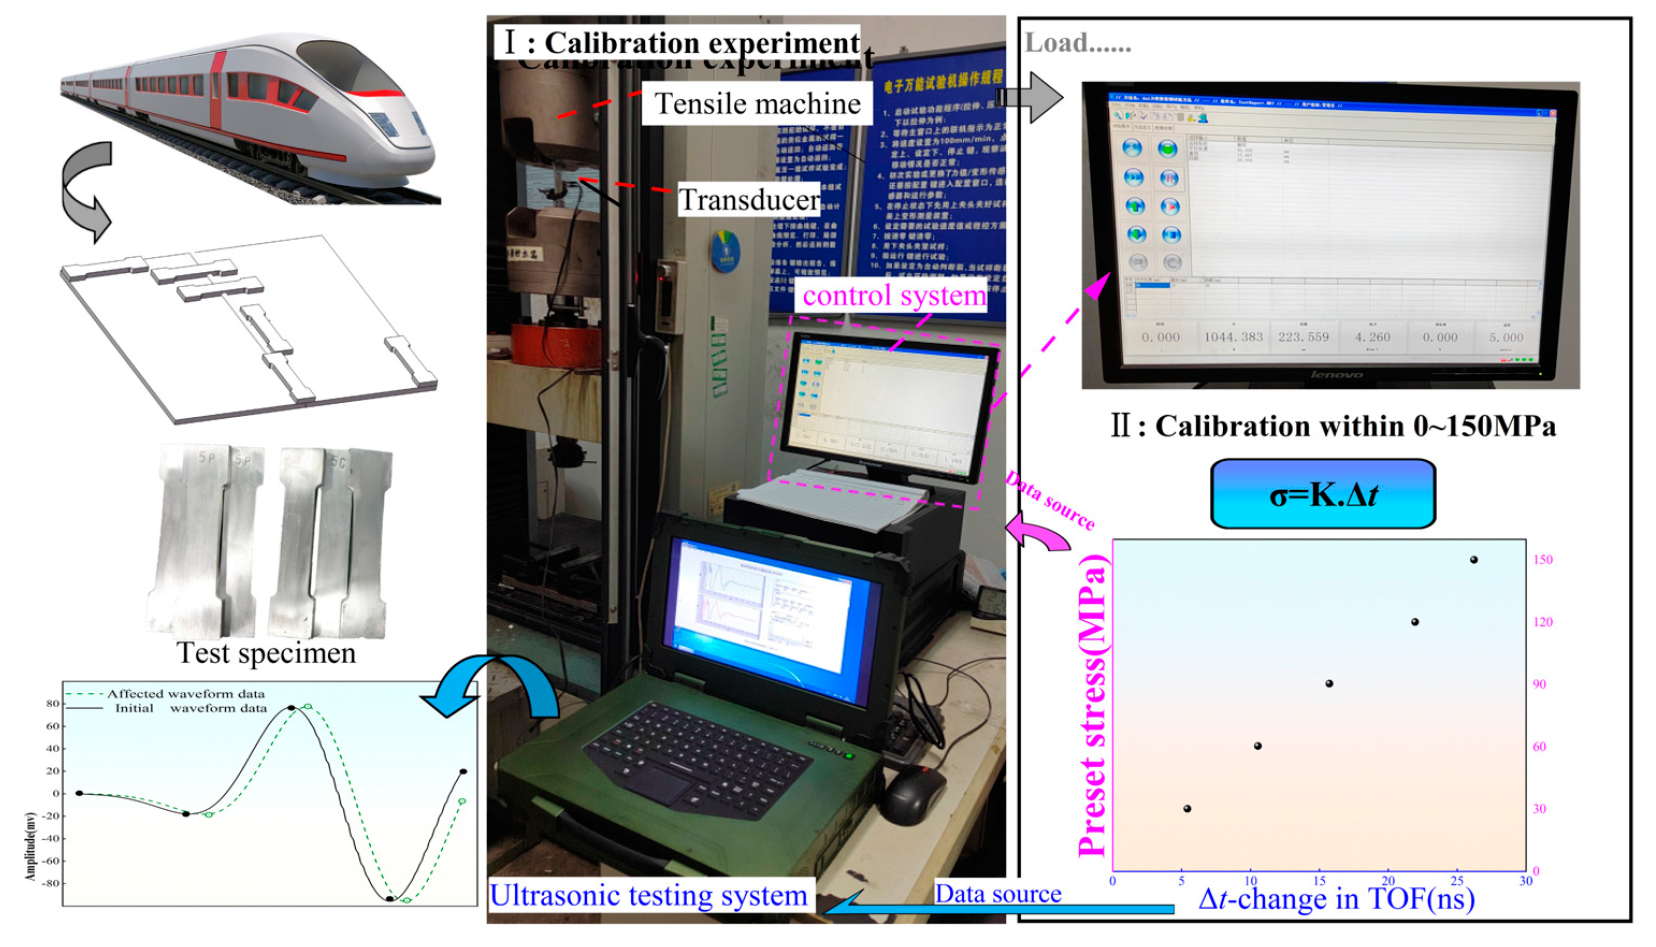
2.3. Acoustic Time Variation Measurement with Ultrasonic Testing System

In this experiment, the ultrasonic testing system employs a 4-bit dual-channel ultrasonic pulse transceiver and data acquisition card, which has a sampling frequency of 200 MHz and a time resolution of 5 ns. To further improve the detection accuracy, 50 times cubic spline interpolation is performed for the LCR wave, and the time resolution is increased to 0.1 ns. Moreover, the probe set includes the 2.5 MHz transducers and the plexiglass wedge, which propagates acoustic distance to about 20 mm. When the longitudinal wave is affected by the stress during propagation, the waveform before and after being affected usually have the same information, except for a certain change in acoustic time, as shown in Figure 2. Therefore, the cross-correlation algorithm is utilized to calculate the change in acoustic time of the LCR wave.

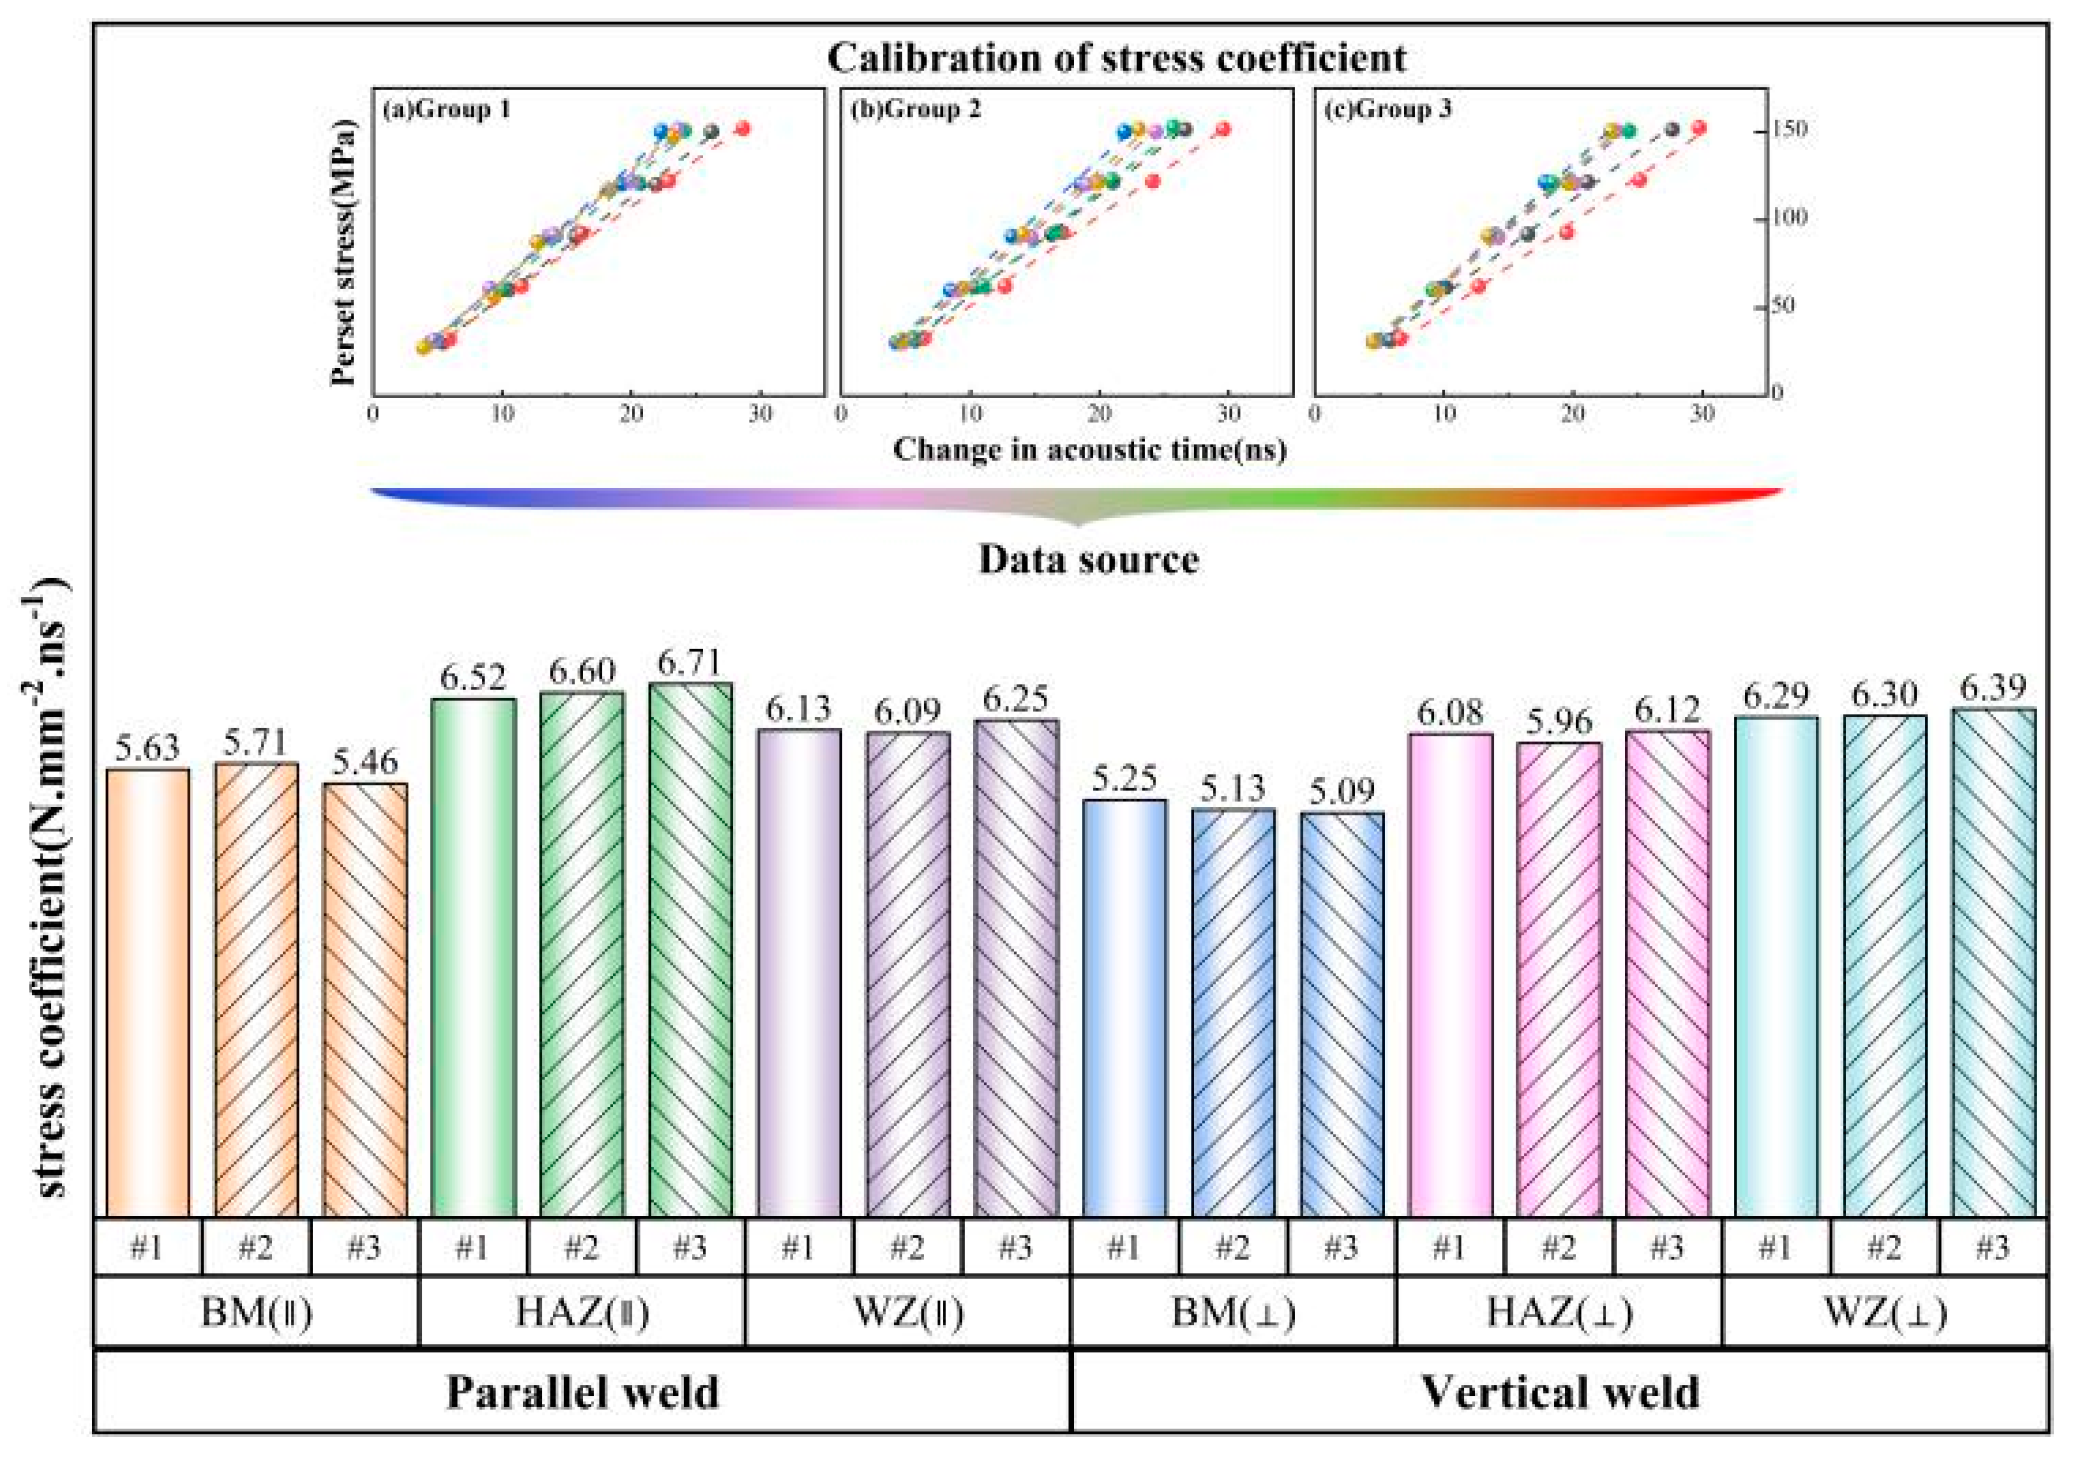
3. Coefficient Calibration and Test Verification

3.1. Correction of Stress Coefficient and Compensation of Acoustic Time

In this paper, the 5083 aluminum alloy welded component of the CCRC Qingdao Sifang high-speed train underframe is utilized for the study, and the measured material is jointed by the MIG welding method. The measured materials are found to have more microcracks at and near the weld joint than other zones during the regular maintenance. Hence, this paper aims to evaluate the residual stresses in the important zones of the measured materials by the ultrasonic correction detection. Moreover, these materials are roughly sized at 300 mm × 300 mm × 8 mm, and the surface roughness of the measured material is guaranteed to be less than 10 μm. Meanwhile, the surface of the measured materials needs to be cleaned with alcohol to ensure that there is no stain in the test zone. Since the base material (BM), heat affected zone (HAZ) and weld zone (WZ) of the welded component undergo the different thermal cycles, their microstructures have great differences. Combined with Equation (10), it can be seen that there is a necessity for the internal factor correction. Therefore, the corresponding test specimens are prepared, and the corresponding test diagram is shown in Figure 3:
In terms of the acoustic time compensation, considering that the prepared specimens of WZ and HAZ still have the certain residual stress, thus the ultrasonic impact is employed to obtain the reference signal of LCR wave in the above two zones. Combined with Equation (10), the compensation acoustic times of the HAZ and WZ are obtained, and take the average of the test results. Moreover, the ambient temperature is kept constant at 20 °C to eliminate the impact of temperature on the calibration results. Hence, the calibrations of the stress coefficients in each zone are shown in Figure 4, and their compensation acoustic time are shown in Table 1:

3.2. Finite Element Simulation Based on Sysweld

Before the actual operation, in order to achieve more representative and targeted measurements, this section uses the thermal-elastic-plastic finite unit method for simulation to obtain the change trend of longitudinal residual stresses in the measured material, and to determine the actual priority zones for detection. The Visual-Mesh software is utilized for 3D modeling and meshing, and the 3D model dimensions are consistent with the actual test material. The numerical calculations and post-processing analysis are conducted by Sysweld, where the corresponding material properties utilize the database that comes with the software. The welding process is MIG welding, and the selected heat source is the double ellipsoidal heat source. Figure 5 presents the geometry for mesh definition and the simulation result.
As can be seen from Figure 5, the residual stresses distributed in the longitudinal direction of the measured material are mostly tensile stresses, and the tensile stress in the center zone near the weld seam is the largest, while in the weld zone is relatively small. Meanwhile, there is some residual compressive stress distributed in a small zone away from the weld seam. Hence, combined with the simulation result, the actual comparison test mainly focuses on the zone subject to the greatest stress in this simulation result.

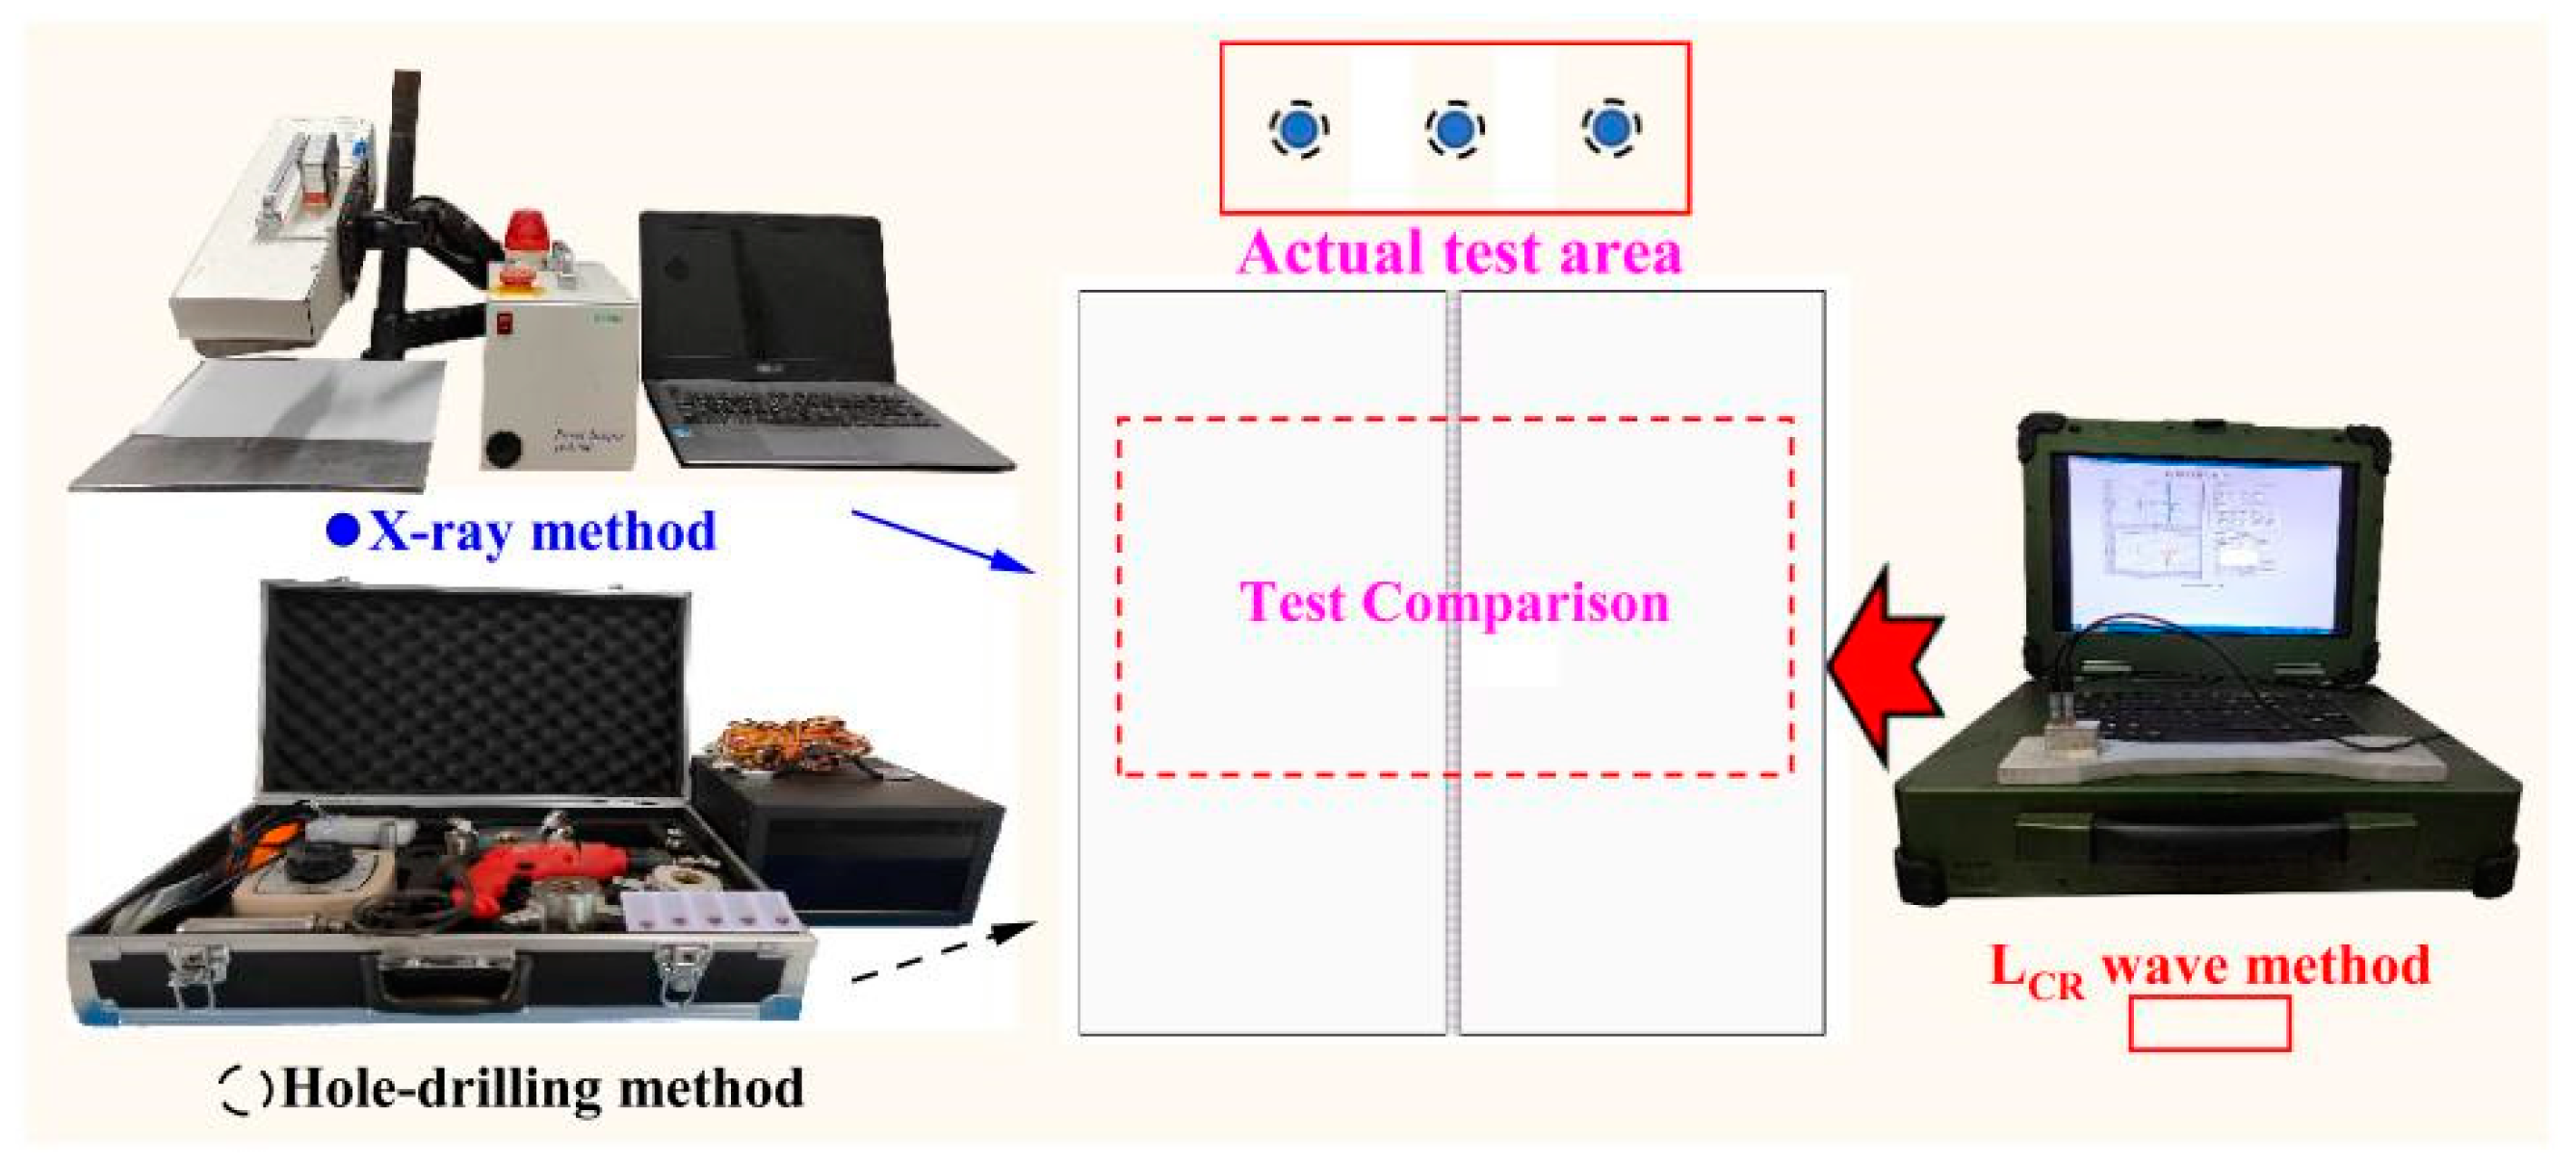
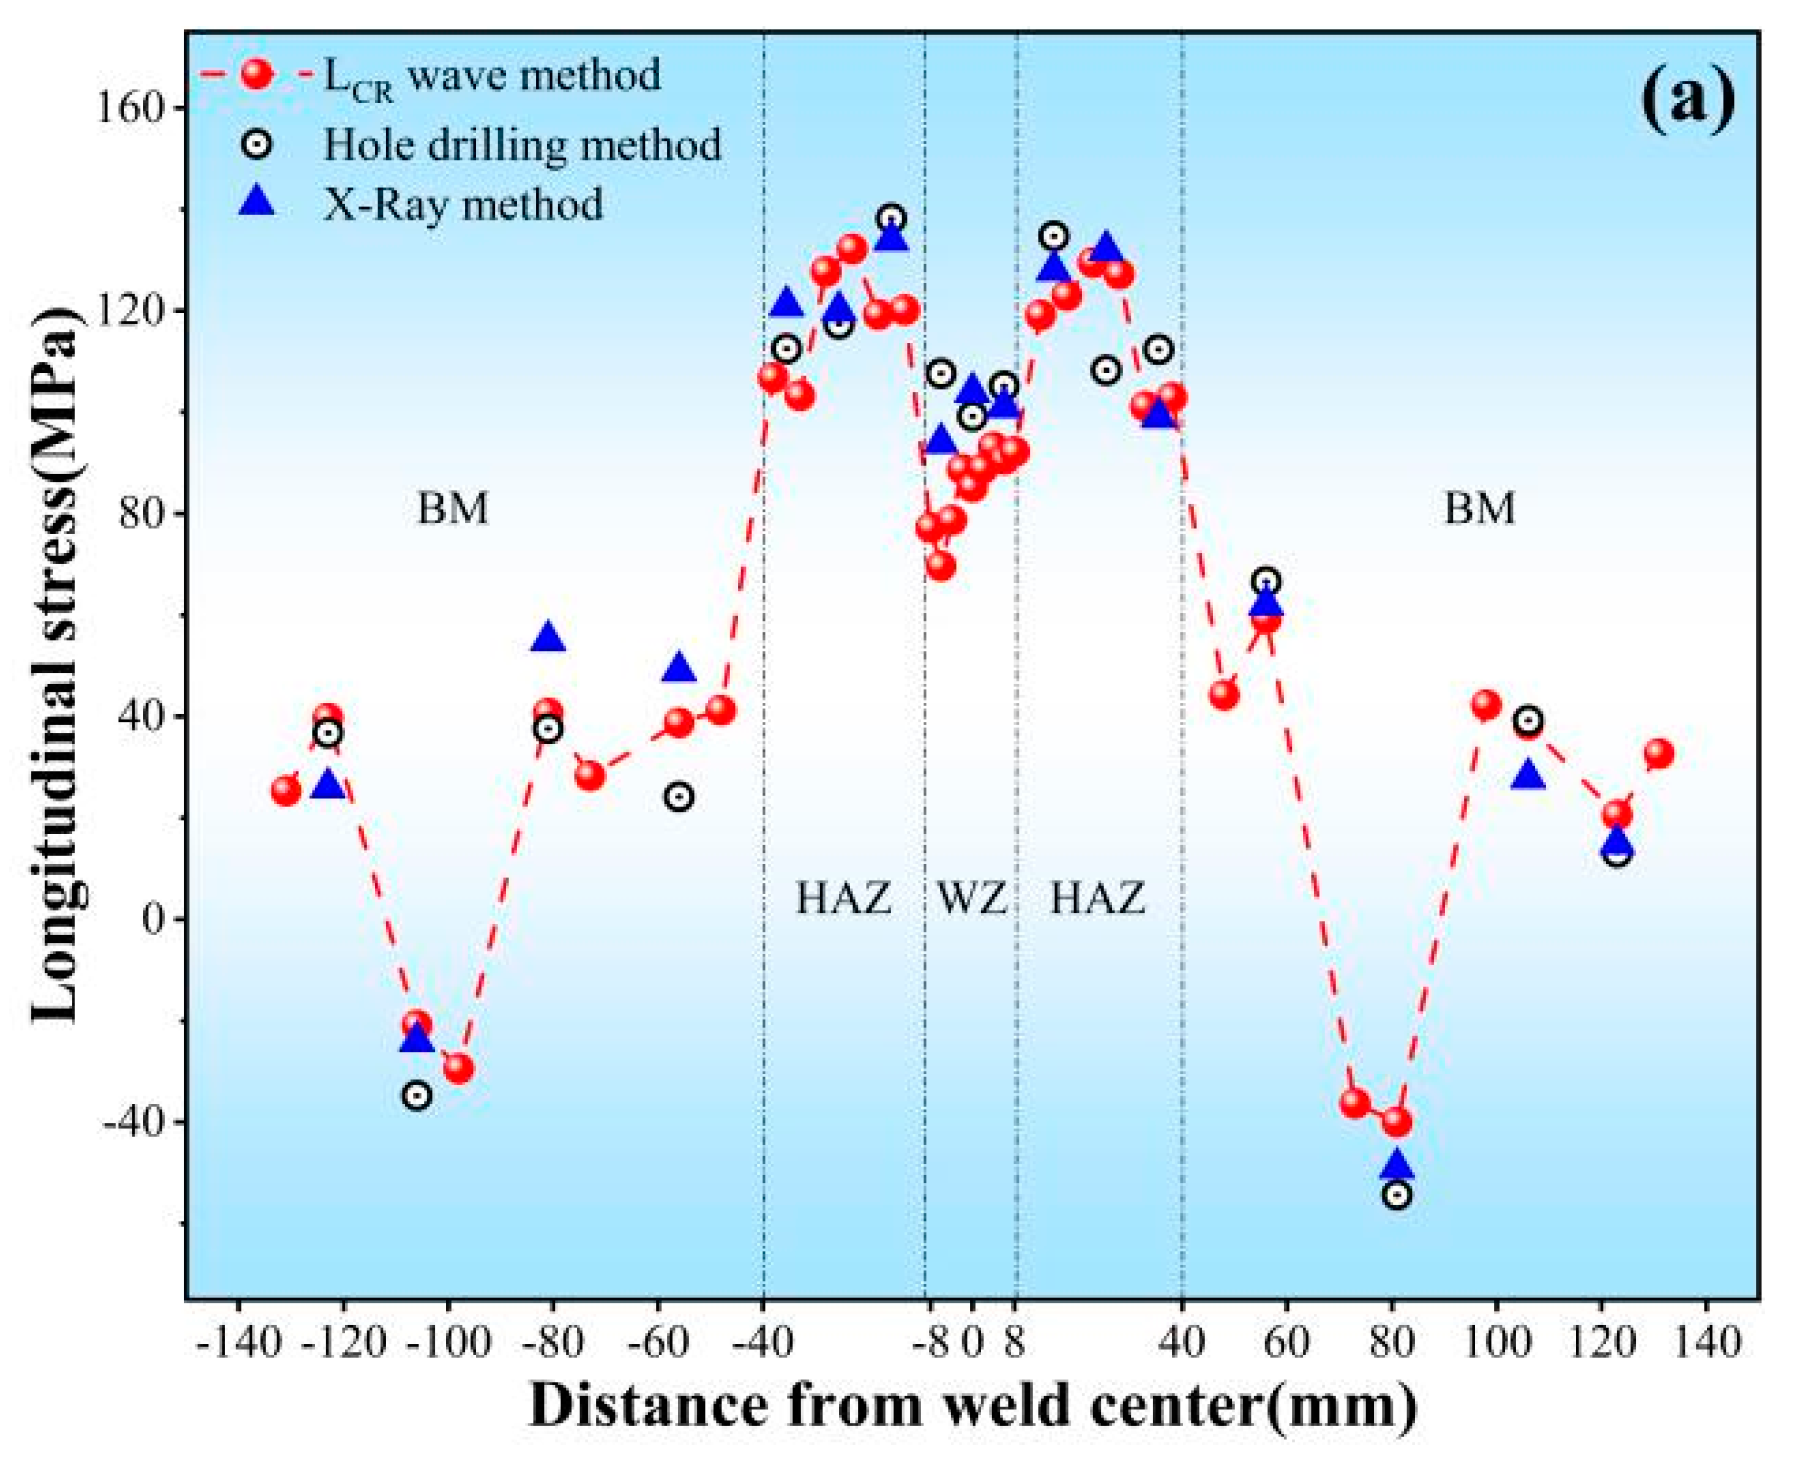
3.3. Comparison of Test Results of Different Methods

Although the simulation result cannot accurately reflect the actual amount of residual stress on the measured material, it can provide some reference to the trend of stress distribution. From the simulation result in the previous section, the ultrasonic correction detection is conducted in the actual corresponding measurement zone to study the residual stress distribution of the measured material. Meanwhile, the hole-drilling and X-ray methods are employed for the comparison test to verify the reliability of the ultrasonic test results. Furthermore, since the detection range of the test probe set is roughly 10 mm × 20 mm, considering the detection range of the other two methods, three points are arranged in each ultrasonic detection zone for the measurement of these two methods, and the test results are taken as the average, while the measurement schematic is shown in Figure 6. Finally, the ambient temperature is kept constant at 20 °C during the test. According to the above test requirements, the test results are shown in Figure 7 and Figure 8:
Figure 8a,b shows the test results before and after correction, and it can be seen that there are large differences in the test results. Meanwhile, there are still large deviations if only implementing the correction of stress coefficient K, and this phenomenon also indicates that the differences of the propagation acoustic time in different zones will have a significant impact on the test results. Hence, in practical applications, the correction of K and acoustic time is indispensable. In addition, without the correction or only with the correction of K, the test results obtained in the WZ tend to be lower than the actual results. Meanwhile, the test results obtained in the HAZ are higher than the actual results and with only the correction of K in this zone more errors will be caused. The residual stresses in these zones are measured with large errors, which may lead to the misjudgment of the safety design of important structures. Furthermore, without the correction of K and propagation acoustic time, in the test zone, the maximum detection errors of longitudinal and transverse directions both occur in the HAZ, and the maximum corrected values are 79.4 MPa and 64.9 MPa, respectively; while in the WZ, the maximum corrected values of longitudinal and transverse directions are 40.5 MPa and 25.7 MPa, respectively. Due to the anisotropy of the measured material and the processing process, the key parameters of the LCR wave method have differences in the parallel and perpendicular weld directions, which can also result in certain errors without the correction, and Figure 8b reveals that the maximum transverse residual stress corrected value in BM is 18.5 MPa.
At the same time, as can be seen from Figure 7, with the correction of K and acoustic time, the differences between the test results of the LCR wave method and the hole-drilling and X-ray methods are significantly smaller, and the test results have a better coincidence. Additionally, in the same zone, the residual stresses distributed in the longitudinal direction are mostly higher than the transverse residual stresses, and the test values all show a stable double-peaked state. Furthermore, in the parallel weld direction, the maximum deviations of the LCR wave method from the other two methods in the WZ, HAZ and BM are 24.3 MPa, 19.0 MPa and 13.7 MPa, respectively. Similarly, in the vertical weld direction, the maximum deviations of the LCR wave method from the other two methods in the above-mentioned zones are 13.3 MPa, 29.8 MPa and 15.8 MPa, respectively. Therefore, the accuracy and reliability of the measurement can be effectively enhanced with the employment of the ultrasonic correction detection.
From the above test results and analysis, the reliability of ultrasonic correction detection is determined. Considering the greater residual stresses distributed in the longitudinal direction of the measured material, and in order to intuitively exhibit the longitudinal residual stress distribution in the overall zone of the measured material, the corresponding cloud diagram is drawn according to the test results. Meanwhile, for increasing the smoothness, the adjacent averaging method is utilized for data processing, and the corresponding longitudinal residual stress distribution cloud diagram is shown in Figure 9:
As can be seen from the Figure 9, at different testing distances, the longitudinal residual stress distribution trends of the measured materials also have differences. However, the measured materials exhibit a stable double-peaked state in the overall zone, and the maximum residual stresses are in the zone near the center and all show tensile stresses. Meanwhile, the maximum residual tensile stresses are mainly distributed in the HAZ, while the residual stresses all exhibit a decreasing trend near the edge zones, and there are certain residual compressive stresses distributed in these zones. Furthermore, the maximum peak values of the measured materials in the WZ and HAZ are 93.1 MPa and 133.2 Mpa, respectively. Hence, the technicians can combine the above test results for comprehensive analysis and consideration in the safety design of important structures for high-speed trains.

3.4. Experiment on Penetration Depth of LCR Wave

As can be seen from the previous section, the ultrasonic correction test results at the WZ along the parallel weld direction are mostly lower than those of the other two test methods. Since the ultrasonic testing technology evaluates the average stress magnitude in the detection zone, and the detection zone of the LCR wave method depends on the propagation acoustic distance L, the signal excitation range d and the penetration depth D, this phenomenon may be related to the penetration depth of the LCR wave as well. The LCR wave penetration depth D is related to the excitation frequency of the transducer, and this parameter decreases with the increase of the frequency. With the employment of different frequency LCR waves, the trend of the residual stress of the measured material in different thickness layers can be studied. Therefore, the actual detection zone of the LCR wave is optimized and the corresponding stress gradient model is established, as shown in Figure 10:
As can be seen from Figure 10, to further simplify the model, the detection zone of the LCR is approximated as a rectangle, then the average stress of different thickness layers can be expressed as follows:
σ i - j = σ j D j σ i D i D j D i
where Di [mm] and Dj [mm] denote the penetration depths when the LCR wave frequencies are i and j, respectively; σi [N.mm−2.ns−1] and σj [N.mm−2.ns−1] denote the average stress detected at the penetration depths of Di and Dj, respectively; and σi-j [N.mm−2.ns−1] is the average stress between Di and Dj.
As can be seen from Equation (11), for studying the residual stress trends in different thickness layers of the measured material, the determination of the penetration depth of LCR waves at different frequencies is essential. Since there is no specific theoretical expression for the penetration depth with frequency given in the relevant literature. Therefore, according to the propagation mechanism of the LCR wave, the specimens with different groove depths are prepared, and the LCR wave signal is evaluated by utilizing different frequency probe sets. When the LCR wave signal is isolated, the corresponding groove depth is close to the actual penetration depth D, and the schematic diagram of the LCR penetration depth test is shown in Figure 11. Meanwhile, according to the relevant standard (GB/T32073-2015), the propagation depth of the LCR wave is only related to the frequency and propagation velocity v [km/s], and the effect of the velocity difference between the LCR wave in the WZ and BM on the penetration depth can be ignored; thus, the prepared specimens were obtained from the BM. Moreover, in the test process, the transducer in the excitation signal will create a certain diffusion phenomenon. To prevent the confusion caused by the reflected waves, the prepared specimens have bottom grooving processing, which is used to isolate the propagation path of these reflected waves.
The relevant literature found that the penetration depth of a surface wave approaches its one wavelength, and the expression of the wavelength is shown in Equation (12). According to the actual propagation acoustic velocity of the LCR wave in the measured material, the curve of Equation (11) is plotted by taking the value of velocity as 6.51 km.s−1. Subsequently, the plotted curve is compared with the test results in this section as well as the standard (GB/T32073-2015), as shown in Figure 12:
λ = v / f
where λ [mm] is the wavelength; f [MHz] is the frequency of the wave.
As can be seen from the Figure 12, the test results are in good coincidence with the wavelength curve and the standard. This phenomenon indicates that the penetration depth of a LCR wave approaches its one wavelength as well. However, since the LCR wave and the surface wave are different modes of ultrasound, the reliability of this conclusion needs to be further studied combined with the theory. Meanwhile, the ultrasonic correction detection of the WZ is performed with different frequency probe sets, and Equation (11) and the obtained LCR wave penetration depth data are combined to calculate the average residual stress of the corresponding thickness layer. The corresponding test results are shown in Figure 13:
As can be seen from Figure 13, in the corresponding detection zone, the test results roughly exhibit an increasing trend with the increase in the frequency of the test probe. Combined with the corresponding calculations, it can be obtained that in the range of 0~3 mm, the residual stress in the longitudinal distribution of the WZ increases with the decrease of the depth. Therefore, the test results indicate that the longitudinal residual stresses in the measured material at the WZ are mainly concentrated on the surface. On the other hand, the test results of the ultrasonic correction detection in the WZ along the longitudinal direction are mostly smaller than the other two methods. Considering that the hole-drilling method has a measurement depth of 0.5~2 mm, and the X-ray method has a measurement depth on the order of micrometer, the above conclusion can provide a corresponding theoretical basis for this phenomenon.

4. Conclusions

This paper proposes a specific influence factor correction technology based on the LCR wave method, aiming to enhance the applicability and detection accuracy of ultrasonic technology in rail transportation applications. Subsequently, this method is utilized to measure the residual stresses in the 5083 aluminum alloy welded components of the high-speed train underframe. Combined with the simulation to determine the focused detection zone, and through the calibration experiments to obtain the key parameters, finally, the detection accuracy of this method is verified by employing other measurement methods to compare. Based on the experimental results, the following conclusions are drawn:
(1) Without the correction, the longitudinal and transverse stress measurement results obtained by the LCR wave method at the WZ of the test material are lower than the actual results, with the maximum corrected values of 40.5 MPa and 25.7 MPa, respectively. Meanwhile, those in the HAZ are the opposite, and the largest detection errors occur in this zone, with the maximum corrected values of 79.4 MPa and 64.9 MPa for the longitudinal and transverse stresses, respectively.
(2) The corrections of K and acoustic time are indispensable, and the errors caused by the differences in initial acoustic time are greater relative to K. Furthermore, if only the K is corrected, the test errors in the HAZ will increase instead.
(3) After employing the ultrasonic correction detection, the differences with the hole-drilling and X-ray methods are significantly reduced. In the parallel weld direction, the maximum deviations of the LCR wave method from the other two methods in the WZ, HAZ and BM are 24.3 MPa, 19.0 MPa and 13.7 MPa, respectively. Similarly, the maximum deviations in the vertical weld direction are 13.3 MPa, 29.8 MPa and 15.8 MPa, respectively. Additionally, the maximum peak longitudinal stresses in the measured material are 93.1 MPa and 133.2 MPa in the WZ and HAZ, respectively.
(4) The detection depth of an LCR wave approaches its one wavelength. Combining this characteristic with the corresponding test data, it can be concluded that the longitudinal residual stress of the WZ is mainly concentrated on the surface, which is the reason for the higher test results of the hole-drilling and X-ray methods in this zone.

Author Contributions

Writing—original draft preparation, M.G.; writing—review and editing, G.G.; conceptualization, B.C.; methodology, F.Q.; investigation, Z.Z.; data curation, J.J.; validation, X.W.; supervision, W.G.; software, S.S. All authors have read and agreed to the published version of the manuscript.

Funding

This research was funded by [2020 Chengdu City International Cooperation Funding Program] grant number [No. 2020-GH02-00058-HZ]. And The APC was funded by [Hui Chen].

Informed Consent Statement

Informed consent was obtained from all subjects involved in the study.

Data Availability Statement

Data available on request from the authors.

Acknowledgments

The authors acknowledge the financial support from 2020 Chengdu City International Cooperation Funding Program (No. 2020-GH02-00058-HZ).

Conflicts of Interest

The authors declare no conflict of interest.

References

  1. Prabha, K.A.; Putha, P.K.; Prasad, B.S. Effect of Tool Rotational Speed on Mechanical Properties of Aluminium Alloy 5083 Weldments in Friction Stir Welding. Mater. Today Proc. 2018, 5, 18535–18543. [Google Scholar] [CrossRef]
  2. Li, Z.; Yi, D.; Tan, C.; Wang, B. Investigation of the stress corrosion cracking behavior in annealed 5083 aluminum alloy sheets with different texture types. J. Alloys Compd. 2019, 817, 152690. [Google Scholar] [CrossRef]
  3. Svensson, L.E.; Karlsson, L.; Larsson, H.; Karlsson, B.; Fazzini, M.; Karlsson, J. Microstructure and mechanical properties of friction stir welded aluminium alloys with special reference to AA 5083 and AA 6082. Sci. Technol. Weld. Join. 2000, 5, 285–296. [Google Scholar] [CrossRef]
  4. She, X.; Jiang, X.; Zhang, R. Study on microstructure and fracture characteristics of 5083 aluminum alloy thick plate. J. Alloys Compd. 2020, 825, 153960. [Google Scholar] [CrossRef]
  5. Li, S.; Mi, G.; Wang, C. A study on laser beam oscillating welding characteristics for the 5083 aluminum alloy: Morphology, microstructure and mechanical properties. J. Manuf. Process. 2020, 53, 12–20. [Google Scholar] [CrossRef]
  6. Rao, D.; Huber, J.; Heerens, J.F.; dos Santos, J.F.; Huber, N. Asymmetric mechanical properties and tensile behaviour prediction of aluminium alloy 5083 friction stir welding joints. Mater. Sci. Eng. A 2013, 18, 295–313. [Google Scholar] [CrossRef] [Green Version]
  7. Xiao, R.; Zhang, X. Problems and issues in laser beam welding of aluminum-lithium alloys. J. Manuf. Process. 2014, 16, 166–175. [Google Scholar] [CrossRef]
  8. Javadi, Y.; Sadeghi, S.; Najafabadi, M.A. Taguchi optimization and ultrasonic measurement of residual stresses in the friction stir welding. Mater. Des. 2014, 55, 27–34. [Google Scholar] [CrossRef]
  9. Lu, W.; Ma, C.; Gou, G.; Fu, Z.; Sun, W.; Che, X.; Chen, H.; Gao, W. Corrosion fatigue crack propagation behavior of A7N01P-T4 aluminum alloy welded joints from high-speed train underframe after 1.8 million km operation. Mater. Corros. 2021, 72, 879–887. [Google Scholar] [CrossRef]
  10. Gou, G.; Zhang, M.; Chen, H.; Chen, J.; Li, P.; Yang, Y.P. Effect of humidity on porosity, microstructure, and fatigue strength of A7N01S-T5 aluminum alloy welded joints in high-speed trains. Mater. Des. 2015, 85, 309–317. [Google Scholar] [CrossRef]
  11. Gou, G.; Nan, H.; Hui, C. Analysis on corrosion behavior of welded joint of A6005 aluminum alloy for high-speed train. Trans. China Weld. Inst. 2011, 32, 17–20. [Google Scholar]
  12. Gou, G.; Jinpeng, Y.; Limin, Z. Research of welding residual stress about aluminum alloy carbody. Electr. Weld. Mach. 2011, 41, 35–38. [Google Scholar] [CrossRef]
  13. Schajer, G.S.; Prime, M.B. Residual Stress Solution Extrapolation for the Slitting Method Using Equilibrium Constraints. J. Eng. Mater. Technol. 2007, 129, 227. [Google Scholar] [CrossRef] [Green Version]
  14. Rossin, N.S. Methods of measuring residual stresses in components. Mater. Des. 2012, 35, 572–588. [Google Scholar] [CrossRef] [Green Version]
  15. Rangaswamy, P.; Griffith, M.L.; Prime, M.B. Residual stresses in LENS components using neutron diffraction and contour method. Mater. Sci. Eng. A 2005, 399, 72–83. [Google Scholar] [CrossRef]
  16. Zhu, Q.; Chen, J.; Gou, G.; Chen, H.; Gao, W. Residual Stress Measurement and Calibration for A7N01 Aluminum Alloy Welded Joints by Using Longitudinal Critically Refracted (LCR) Wave Transmission Method. J. Mater. Eng. Perform. 2016, 25, 1–9. [Google Scholar] [CrossRef]
  17. Bonilla, L.; Keller, J. Acoustoelastic effect and wave propagation in heterogeneous weakly anisotropic materials. J. Mech. Phys. Solids 1985, 33, 241–261. [Google Scholar] [CrossRef]
  18. Bray, D.; Tang, W. Subsurface stress evaluation in steel plates and bars using the LCR ultrasonic wave. Nucl. Eng. Des. 2001, 207, 231–240. [Google Scholar] [CrossRef]
  19. Song, W.; Xu, C.; Pan, Q.; Song, J. Nondestructive testing and characterization of residual stress field using an ultrasonic method. Chin. J. Mech. Eng. 2016, 29, 365–371. [Google Scholar] [CrossRef]
  20. Acevedo, R.; Sedlak, P.; Kolman, R.; Fredel, M. Residual stress analysis of additive manufacturing of metallic parts using ultrasonic waves: State of the art review. J. Mater. Res. Technol. 2020, 9, 9457–9477. [Google Scholar] [CrossRef]
  21. Qozam, H.; Hoblos, J.; Bourse, G.; Robin, C.; Walaszek, H.; Bouteille, P.; Cherfaoui, M. Ultrasonic Stress Measurement in Welded Component by Using LCR Waves: Analysis of the Microstructure Effect. Materials Science Forum; Trans Tech Publications: Bäch SZ, Switzerland, 2006; pp. 453–458. [Google Scholar] [CrossRef]
  22. Song, W.T. Study on Technology of Ultrasonic Nondestructive Testing and Regulation of Residual Stress; Beijing Institute of Technology: Beijing, China, 2016. [Google Scholar]
Figure 1. Mechanism of the LCR Wave.
Metals 13 00137 g001
Figure 2. Waveform data before and after the LCR wave is affected.
Metals 13 00137 g002
Figure 3. Diagram of specimen preparation and test.
Metals 13 00137 g003
Figure 4. Calibration of stress coefficient.
Metals 13 00137 g004
Figure 5. Finite element simulation of measured material. (a) Geometry for mesh definition. (b) Simulation result of longitudinal residual stress distribution.
Metals 13 00137 g005
Figure 6. Testing schematic of different methods.
Metals 13 00137 g006
Figure 7. Comparison of ultrasonic correction test method with other test methods. (a) Longitudinal residual stress. (b) Transverse residual stress.
Metals 13 00137 g007aMetals 13 00137 g007b
Figure 8. Comparison of ultrasonic test before and after correction (a) Longitudinal residual stress. (b) Transverse residual stress.
Metals 13 00137 g008
Figure 9. Longitudinal residual stress distribution cloud of measured material.
Metals 13 00137 g009
Figure 10. Simplified model of LCR wave detection zone.
Metals 13 00137 g010
Figure 11. Schematic of LCR wave penetration depth test.
Metals 13 00137 g011
Figure 12. Comparison of test result, standard and wavelength curve.
Metals 13 00137 g012
Figure 13. Ultrasonic testing of residual stresses in different thickness layers of WZ.
Metals 13 00137 g013
Table 1. Compensation acoustic time for each zone of measured material.
Direction
and Zone
Parallel WeldNormal to the Weld
HAZ (∥)WZ (∥)BM (⊥)HAZ (⊥)WZ (⊥)
Compensation value (ns)12.17−5.452.6810.73−3.36
Disclaimer/Publisher’s Note: The statements, opinions and data contained in all publications are solely those of the individual author(s) and contributor(s) and not of MDPI and/or the editor(s). MDPI and/or the editor(s) disclaim responsibility for any injury to people or property resulting from any ideas, methods, instructions or products referred to in the content.

