Article

Penetration Recognition in GTAW Welding Based on Time and Spectrum Images of Arc Sound Using Deep Learning Method

1
School of Information Engineering, Nanchang Hangkong University, Nanchang 330063, China
2
School of Mechanical and Automotive Engineering, Shanghai University of Engineering Science, Shanghai 201620, China
*
Author to whom correspondence should be addressed.
Metals 2022, 12(9), 1549; https://doi.org/10.3390/met12091549
Submission received: 15 August 2022 / Revised: 13 September 2022 / Accepted: 15 September 2022 / Published: 19 September 2022
(This article belongs to the Section Welding and Joining)

Abstract

:
The weld penetration rate is an important evaluation criterion for welding quality. However, it is difficult to identify the weld penetration state during GTAW welding process. This paper presents a new penetration recognition method based on time and spectrum images of arc sound using deep learning for DC GTAW welding. The time domain and spectrum images of the three penetration states from the non-periodic arc sound were used as the dataset for the penetration prediction model. VGG16, AlexNet, and custom convolutional neural network (CNN) were used to extract image features, and softmax was used to classify images for penetration recognition. The influence of image feature extraction networks, input methods, and different sampling methods on the recognition accuracy was deeply analyzed. The results show that the overall validation accuracy of the proposed model is approximately 96.2%. Particularly, the validation accuracy of the model in the excessive penetration state is approximately 100%. This study provides a new and feasible method for the online detection of weld penetration during the GTAW welding process.

1. Introduction

The penetration state of the weld has an important influence on the quality of welded product. Stress concentration is likely to occur inside the weld, resulting in cracks, which ultimately affects the fatigue strength of welded workpiece at a low penetration rate. When the weld is in excessive penetration state, the surface of the weld collapses, the welding contact area decreases, and the mechanical and plastic properties of the welded product may be reduced. Kainuma et al. [1] studied the mechanism of root cracking and believed that penetration rate has an impact on the root cracking direction and fatigue life at the initiation stage and high penetration rate prevents root crack initiation. Dung et al.’s [2] research indicated that 100% penetration increased fatigue resistance of rib-to-deck welded joints compared to 75% penetration. The study of weld penetration has an economic and theoretical value.
Charge-coupled device (CCD), complementary metal oxide semiconductor, and infrared cameras are used to collect weld pool, arc and plasma images during the welding process, and the images are processed to extract their features. Then, the relationship between the features and the penetration state is established. Finally, the penetration state is estimated based on this relationship. Several researchers have used this method to predict penetration states. Yu et al. [3] used a CCD camera to collect the images of the weld pool during pulsed gas tungsten arc welding (GTAW), and then principal component analysis and wavelet transform were used to extract the features of the weld pool. Finally, the relationship between the features and the penetration was established using the fuzzy logic model to estimate the penetration of the weld. Chandrasekhar et al. [4] used an infrared camera to collect the thermal images of the weld pool during tungsten inert gas (TIG) welding. The features extracted from the images were used as the input of the neural network to train the network model. The depth and width of the weld were estimated using the trained model. Chen et al. [5] extracted the surface features of a three-dimensional (3D) weld pool using computer vision technology during GTAW, and calculated the back weld width using the weld pool width, trailing length, and surface height on the top surface of the weld to evaluate the penetration state. Similar to reference [5], Wu et al. [6] and Huang et al. [7] also calculated the backside weld width in variable polarity plasma arc welding (VPPAW) and gas metal arc welding, respectively, and predicted the penetration state of the weld based on this weld width. Liang et al. [8] directly used 3D image sensors to obtain the 3D geometric parameters of the weld pool in GTAW, and predicted the penetration based on the empirical data. Evidently, the images of the weld pool and keyhole can contain abundant welding information, and the image processing method is reliable for penetration recognition.
The image processing method has achieved positive results in predicting penetration. However, the installation of the camera is often difficult, particularly for the camera on the back of the weld, and it is also very susceptible to welding spatter contamination. Therefore, the use of the arc sound signal as a model input to predict weld penetration has attracted considerable attention. Lv et al. [9,10] used a sound sensor to collect the arc sound signal in pulsed GTAW, and filtered the signal. Two different methods were used to estimate the weld penetration. First, the arc length was linearly fitted to the sound signal, and the penetration was estimated according to the arc length. The other was to extract audio signal features using wavelet transform, creating a classification model to estimate the penetration. Zhang et al. [11] proposed a mathematical model with the arc voltage and welding current as the input and the arc sound signal as the output to predict weld penetration in pulsed GTAW. Similar to Lv et al. [10], Chen et al. [12] revealed the generation mechanism of arc sound in pulsed GTAW welding and used the principal component analysis method to extract the features of sound signals under different penetration states. Yusof et al. [13] used the synchrosqueezed wavelet method to extract sound signal features in pulsed laser welding, and a support vector machine (SVM) model to classify penetration. Furthermore, song et al. [14] discovered the distribution structure and formation mechanism of arc sound under different penetration states in VPPAW and used the hidden Markov model to classify weld penetration. Gao et al. [15,16] deeply analyzed the features of the arc sound in GTAW and confirmed that the features extracted from arc sound can be used for penetration recognition. The results of these studies show that it is convenient and feasible to extract the sound features of arc sound signals to identify weld penetration.
In weld penetration recognition, in addition to using a single image or sound sensor, several sensors are simultaneously used. Wu et al. [17] and Zhu et al. [18] used a CCD camera to acquire keyhole images in VPPAW and TIG, and simultaneously used a microphone to collect arc sound. Sound and image features were extracted, and fusion feature data were used as model inputs to achieve penetration classification. Zhang et al. [19] collected three types of data, namely arc sound, arc voltage, and arc spectrum in pulsed GTAW, and used a SVM model to classify the penetration. Similar to Zhang et al. [19], Cui et al. [20] also collected the arc sound, welding current, and arc voltage for penetration recognition in TIG. Chen et al. [21] simultaneously collected the welding current, arc voltage, weld pool image, and arc sound in pulsed GTAW, and input them into the BP network model to classify weld penetration. Butdee et al. [22] used data similar to reference [21] to infer penetration state using the expert system in pulsed GTAW. It is undeniable that the use of multiple sensors has higher accuracy for penetration recognition, but it is not easy to install multiple sensors, and the collected heterogeneous data should be fused.
In recent years, the application of deep learning in image and audio fields has developed rapidly, and weld penetration detection based on deep learning has become a research hotspot. Several researchers have used visual sensors to acquire images of the arc and weld pool and extracted image features using CNN calculations. Then, the relationship between the features and the penetration has been established through model training to accomplish penetration recognition [23,24,25,26] in the welding process. Wu et al. [27] simultaneously collected two-dimensional (2D) molten pool and sound spectrum images in VPPAW and used a convolutional neural network to extract image features. The fused features were then used to predict the weld penetration, and a high accuracy was achieved. Ren et al. [28] transformed a one-dimensional (1D) sound signal from pulsed GTAW into a 2D spectrum signal and used a CNN in deep learning method to process 2D spectrum signal matrix to extract signal features, based on which the penetration was classified. These studies show that arc sound signals contain abundant welding information, and sound sensors are easy to install. Deep learning for image classification and recognition can achieve a much higher accuracy than that of human eye recognition. In addition, earlier studies have mainly focused on penetration recognition in pulsed welding, and few studies exist on penetration recognition in DC GTAW welding. It has important economic and academic value using both advantages to identify weld penetration in welding process.
This paper presented a penetration recognition model in GTAW welding based on time and spectrum images of arc sound using a deep learning method. Input images included: time and frequency spectrum images from the arc sound. VGG16, ResNet and custom CNN models were used to extract the image features of the time and frequency spectrum, and the classification was implemented using fully connected networks. The validation accuracy of the dual-input and single-input models was compared, and the influence of samples on the model accuracy was analyzed. Therefore, the structure of this article is as follows. Section 1 introduces the research background of weld penetration recognition. Section 2 proposes a penetration recognition model using deep learning in GTAW welding. Then, in Section 3, the experiment was carried out, and the factors affecting the accuracy of the model were analyzed. Finally, Section 4 gives conclusions.

2. Penetration Recognition Using Deep Learning Method

In general, the penetration state determines the connection strength of the welded joint, which is generally determined by measuring the weld depth. In a factory, weld penetration can generally be divided into three types: non-penetration, full penetration, and excessive penetration. Non-penetration and excessive penetration lead to an insufficient joint connection strength, and welded parts are generally judged as unqualified products [1,2]. Weld penetration state inspection is an important guarantee of the quality of welding products. In addition, the online inspection of weld penetration is a promising avenue for welding automation. However, previous studies mainly focused on pulsed welding, because of its periodicity and the convenience of the data collection. Combined with the latest developments in deep learning, this study proposed single-input and dual-input penetration recognition models, respectively. Figure 1 shows a two-input model. The model mainly includes dataset, CNNs, full connection (FC), and classification. The dataset is the data that are fed to the model during the training and validation of the model. CNNs are mainly used for feature extraction. The full connection is to flatten the extracted features to facilitate the image classification of these features.

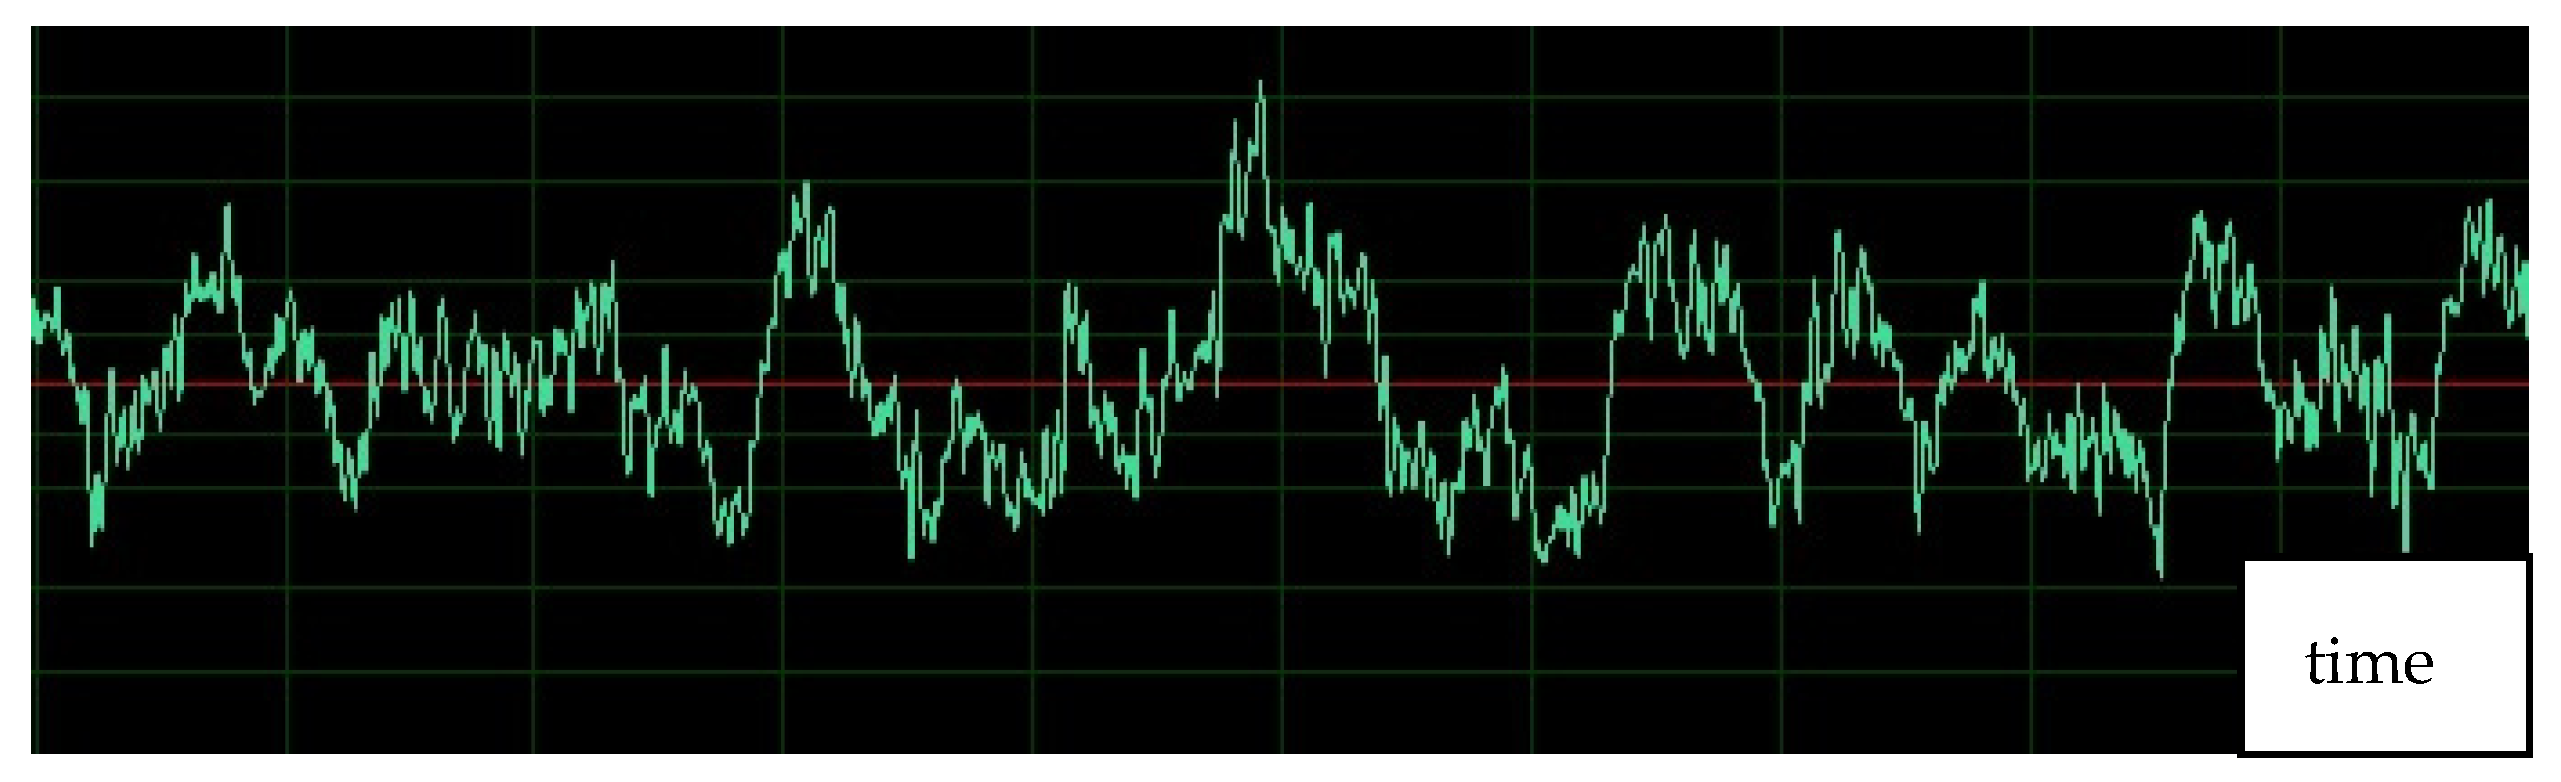
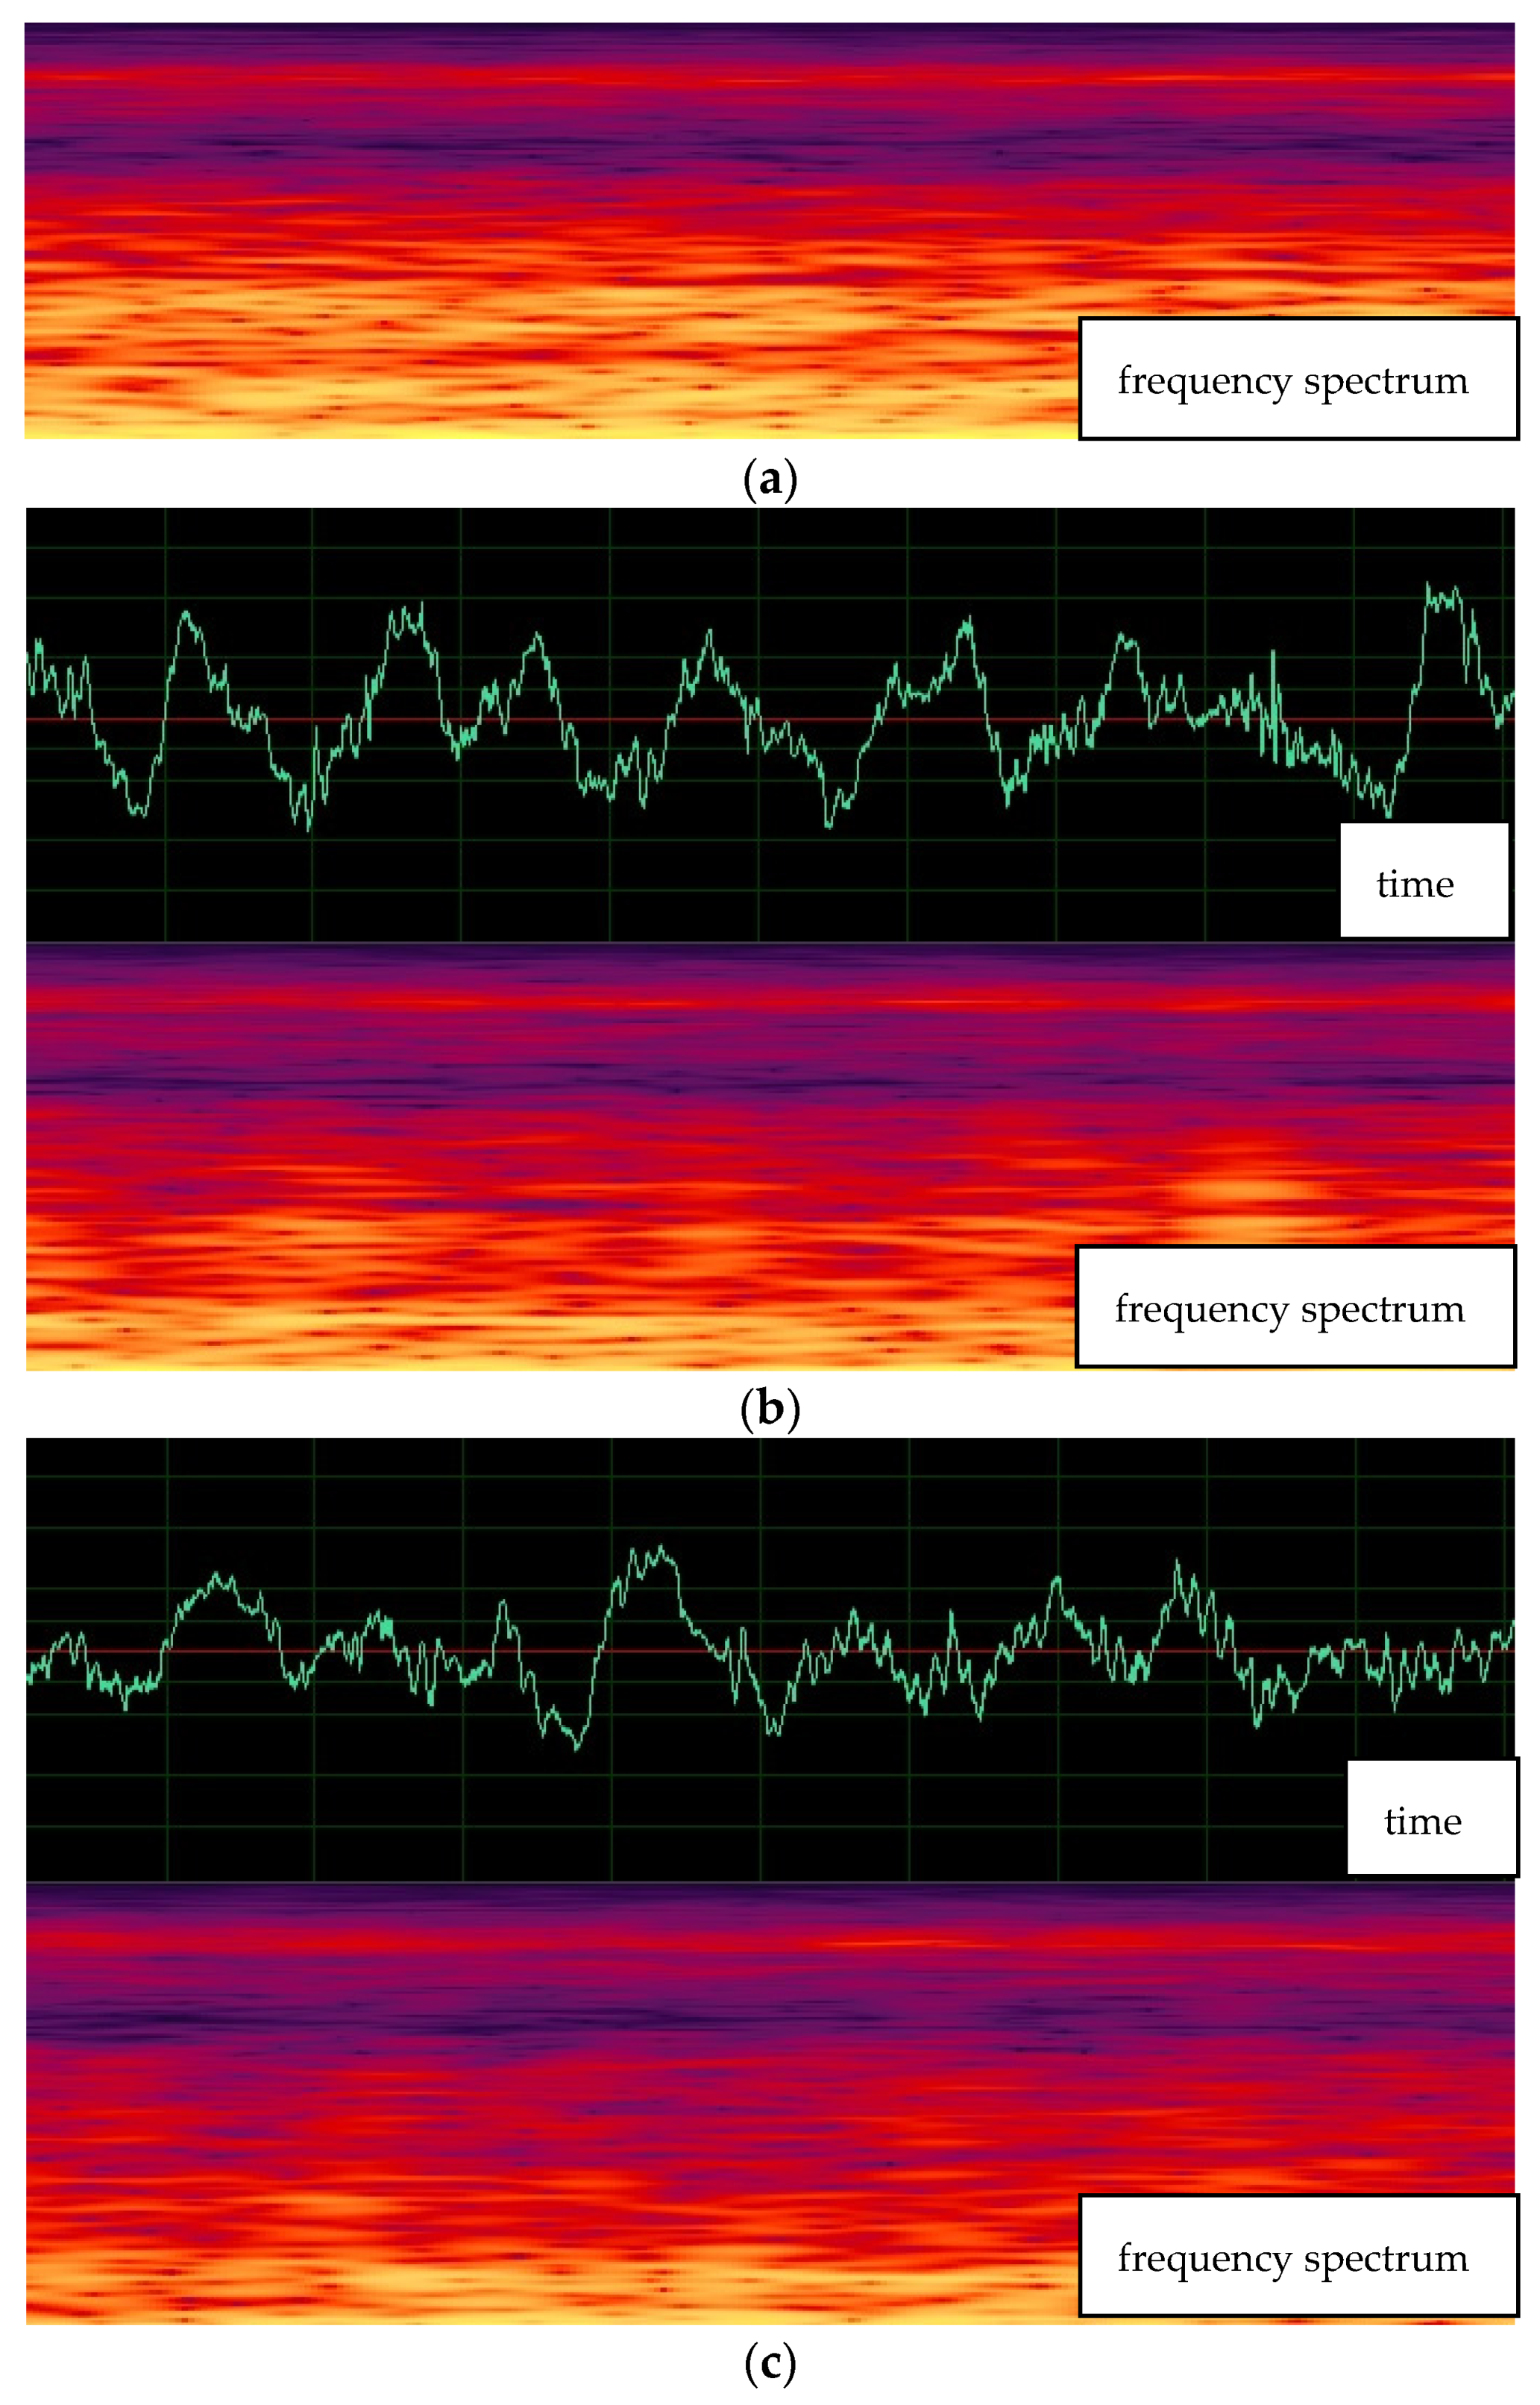
2.1. Time and Spectrum Images of Arc Sound

The original data used in this study were from Reference [16]. TIG300s DC inverter TIG welding machine was used, and the shielding gas was argon in the welding process. The welding torch and sound signal collector remained stationary, and the wire feeding device was not required. Welding was performed by moving the welding material. The welding material was Q235 mild steel with a thickness of 2 mm. The process parameters in three states are shown in Table 1.
When the full penetration weld is achieved, the quality of the welded product is considered qualified in industrial application. The heat-affected zone (HAZ) cannot be seen on the back of the welded workpiece, which is considered a non-penetration state. For full penetration welding, a narrow weld is seen on the back of the welded workpiece. If a large number of collapses occur on the back of the weld, it is considered excessive penetration.
The arc voltage and welding current in pulsed welding generally have a certain periodicity; therefore the collected sound signals also have a specific periodicity, which is easy to extract and analyze. In this study, the DC GTAW welding mode was studied, and the collected sound signal was non-periodic. The extraction of features from the collected sound signals is crucial for penetration classification. The collected sound was a 1D signal, and the time domain and frequency waveforms were displayed using the Adobe Audition software, as shown in Figure 2. Human eye observation revealed that the waveforms were different in the three penetration states.
Figure 2 depicts the time and frequency spectrum images of the arc sound within 100 µs. Notably, the time-intensity signal of the arc sound did not exhibit periodicity in GTAW. Therefore, the sound signal at the peak stage could not be extracted as a classification feature. The training and validation set of the model were intercepted randomly using a 260 × 175 pixels window. Similar to the time domain image, the frequency spectrum image did not exhibit periodicity. The spectrum images were intercepted synchronously with the time domain images. These intercepted images data were converted into 128 × 128 pixels before being sent to the feature extraction module. These images were then used to create a model training and validation dataset. For time images, the amplitude and change rate of the curves were different under the three states. The amplitude and change rate of the curve were the largest, and the sudden change was the most evident in the excess penetration state. The amplitude and change rate of the curve were the smallest in the non-penetration state, whereas they were between the two states in the full penetration state. The differences between time and frequency domain images can be recognized by the human eye, which is also the original basis for using machine vision methods to identify the penetration state. Similarly, it can be observed from Figure 2 that the spectrum images of sound signals in different states are different, but it is difficult to identify the differences between images through human eyes. Therefore, penetration identification using machine vision is a reliable method for GTAW.

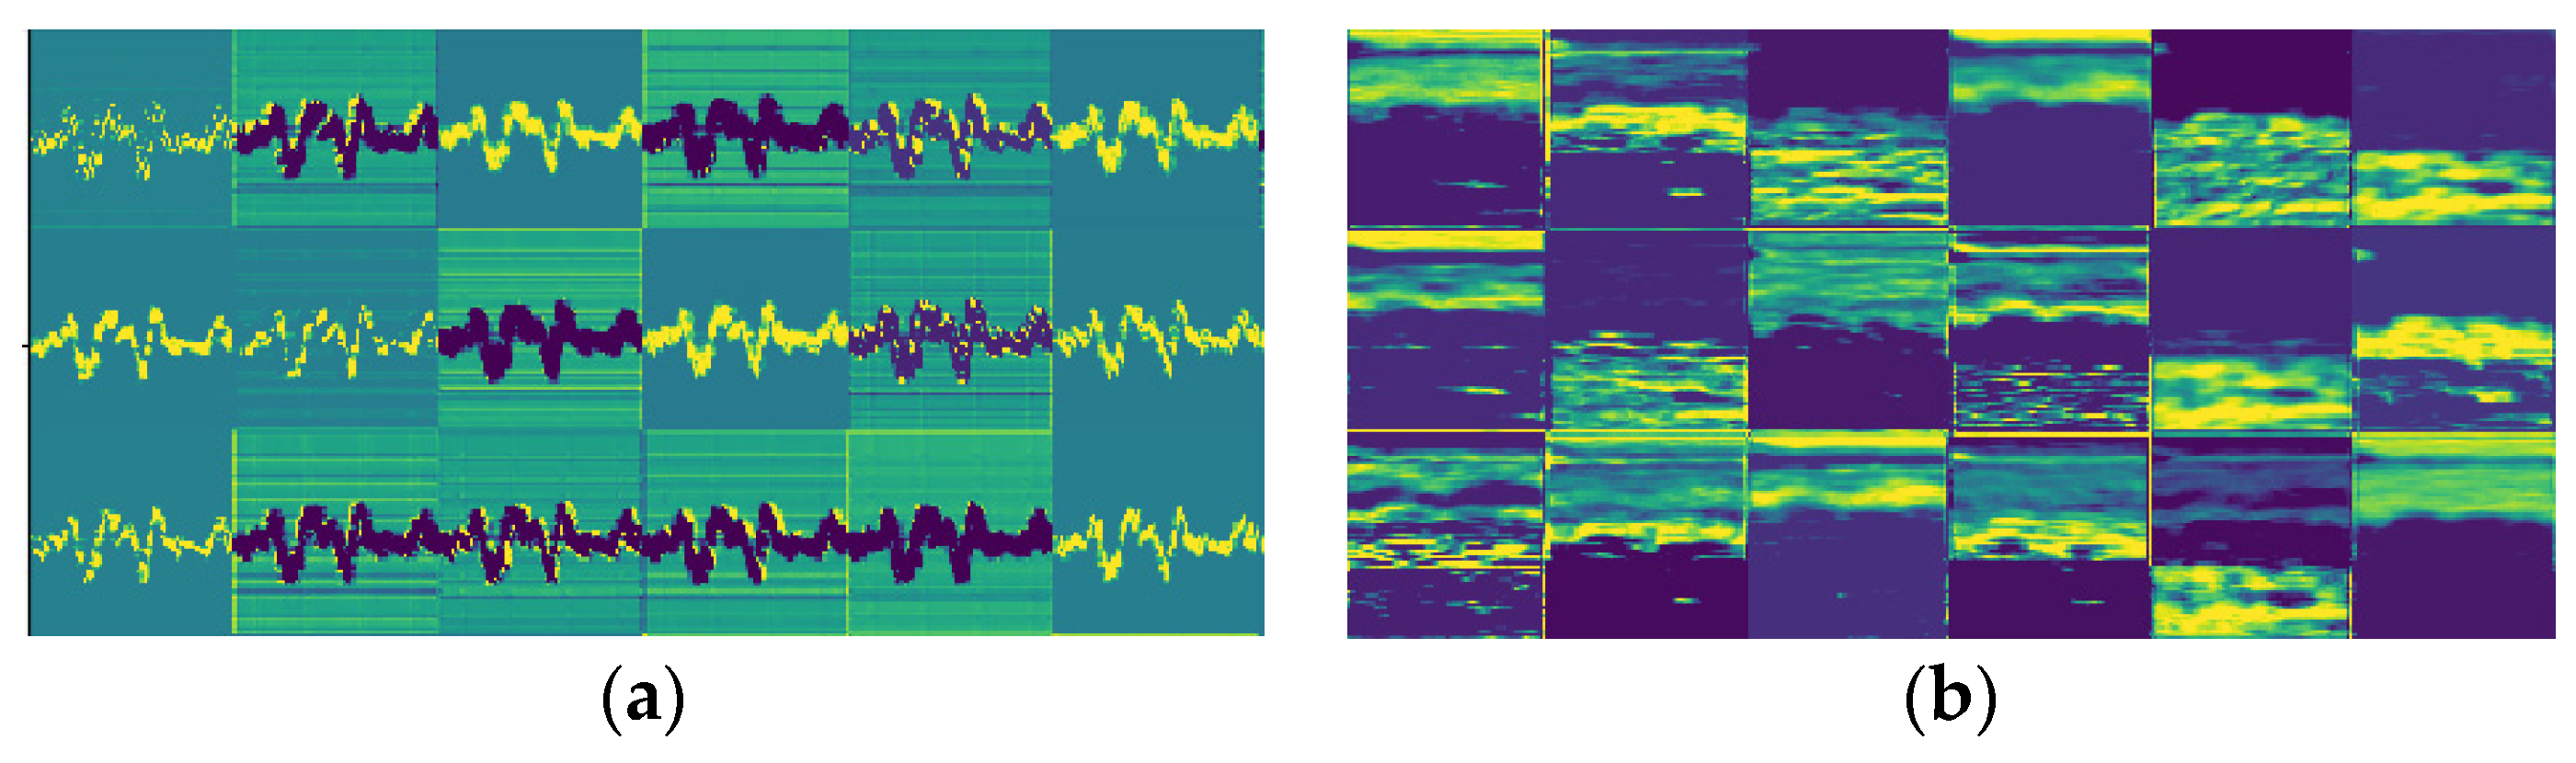
2.2. Image Feature Extraction

The common methods used for image feature extraction include scale-invariant feature transform, histogram of oriented gradient, difference of Gaussian, features from accelerated segment test, and various improved algorithms. These methods extract global and local information from the image and achieve better results in image registration and classification. However, they cannot obtain evident features, and their robustness is poor under different lighting conditions and complex scenes. In the deep learning network model, CNNs are used to extract image features, which effectively overcomes the shortcomings of traditional image feature extraction. The local features of the image are extracted using the CNN method, which can effectively overcome the influence of light changes, and is position-independent. In this study, CNNs such as VGG16, ResNet, and custom CNN were used to extract the time domain and spectral image features. These features were then flattened, and input into fully connected neural networks for penetration classification, as demonstrated in Figure 1. The image feature extraction was described using the CNN method, considering VGG16 as an example.
The CNN in VGG16 exhibits an excellent performance for image feature extraction, although its basic theory is not completely clear. The model obtains various features of the image owing to the use of numerous convolution kernel filters. Figure 3 displays 18 feature images of the model after convolution computation in the first layer (256 in the first layer). In the convolution calculation, numerous feature images were obtained. Owing to the multi-channel convolution operator, different features at the same position were extracted, which is conducive to classification.
The local detail information of the image was also obtained owing to numerous 3 × 3 convolution kernels. Multi-layer convolution calculations expand the receptive field, reduce the number of model parameters, and obtain the high-level abstract information of the image. In particular, the convolution image features extracted by the CNN were flattened and connected to the full connection network to achieve penetration classification. This method made the local features extracted by the CNN position-independent, which is crucial for the image classification. It can be noted from Figure 2 that the time domain waveform shape and peak time in the three penetration states are not regular, which is because the collected arc sound signal has no periodicity in DC GTAW welding process. The use of classification models such as VGG16 for penetration classification can efficiently address this problem.

2.3. Weld Penetration Recognition

As shown in Figure 1, the time domain and frequency image features were extracted using CNN, and 512 feature images were obtained. However, these images could not be used directly for classification purposes. The 1D array was obtained by flattening 512 images, and then the two 1D arrays were merged into a new 1D array to achieve data fusion. The fusion data were connected to three fully connected networks, and three output values were calculated for the last layer. The softmax function was used to calculate the probability density of each state, as shown in Equation (1). The maximum probability was the most possible penetration state.
y i = e z i j = 1 C e z j           i = 1 C
In Equation (1), z represents the output of the previous layer, and yi represents the output probability of class i.

3. Results and Discussion

To verify the universality and practicability of the deep learning method for penetration recognition, this study also used AlexNet and a custom CNN to extract image features. Figure 4 illustrates the structure of a custom CNN. The CNN proposed in this study included three groups of convolution modules, each group included 2D convolution, normalization, maxpool, and dropout. The number of convolution operators in each group was 128, 256, and 128, respectively, with a dimension of 3 × 3. Other parameters were the same as those for VGG16. This paper does not introduce the AlexNet network structure.

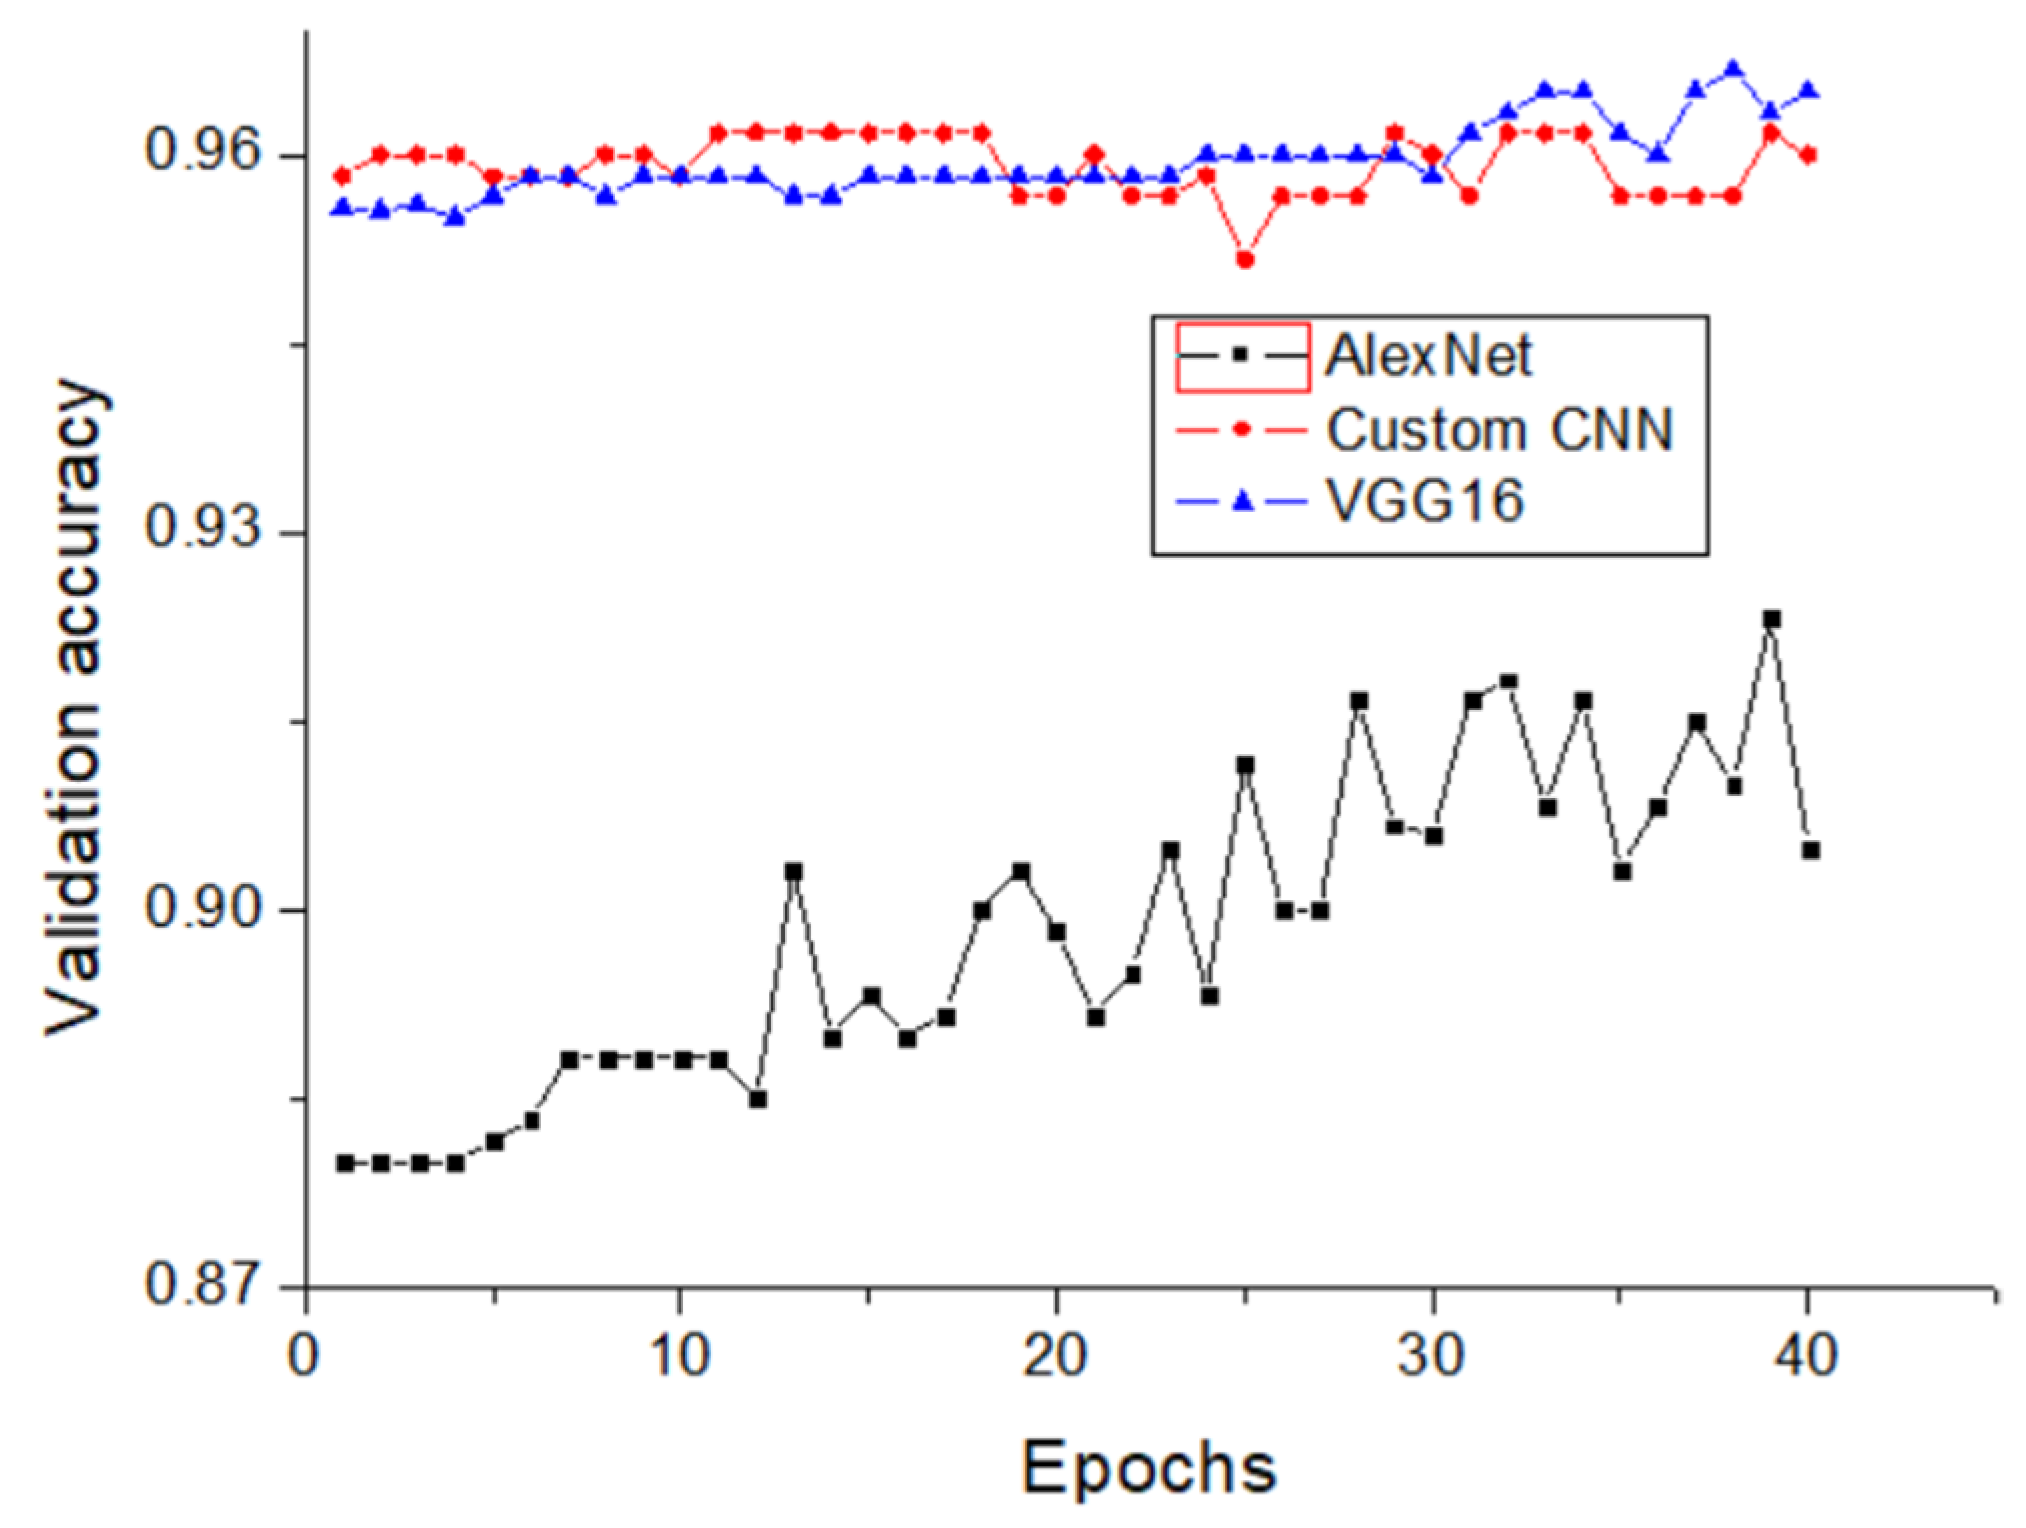
3.1. Validation of Weld Penetration Recognition

The study used opensource framework of Google TensorFlow. Image features were extracted using VGG16, AlexNet, and a custom CNN. The fully connected layer and softmax function were used for penetration classification. Development environment configuration: Windows 10, Intel i7-10750H CPU, Nvidia GeForce 2060 GPU, TensorFlow-gpu 2.1, Python 3.7, CUDA 10.1, and cuDNN 7.6.5. Program training and validation were performed on GPU. When the loss value of training and validation was less than 0.2 and the difference in accuracy value was approximately 0.02, it was considered stable.
The training and validation images were obtained from Reference [16], and the processed image sizes were 128 × 128 pixels. Each penetration state included 800 times images and 800 frequency spectrum images. For time domain images, the training dataset and validation dataset images were 600 and 200, respectively, and the ratio was 3:1. frequency spectrum images were the same.
In the process of model training and validation, the network weight initialization value and optimizer significantly influence the result. Keskar [29] and Cui [30] believed that the choice of optimizer was determined by the characteristics of the sample, and the mixed use of ADAM and SGD optimizers would yield better calculation results. It avoided the local optimal solution, and its stability was good. In the model training, the ADAM optimizer was first used to obtain the weight initialization value, and then the SGD optimizer was used for training, validating and testing.
Figure 5 shows the validation accuracy of the model in AlexNet, VGG16, and the custom neural convolutional network structure. When AlexNet extracted image features, the validation accuracy of the model was the lowest, approximately 91.50%. The validation accuracy of the other two models was approximately 96.20%. This indicated that it was feasible to classify the penetration using deep learning method, which could realize the classification of penetration in GTAW. The higher the accuracy of image feature extraction, the better the classification effect.
In addition, the validation accuracy of the proposed CNN model was similar to that of VGG16. However, compared to VGG16, custom CNN has the advantages of fewer network layers and parameters, which makes the model computationally less expensive and easier to deploy on hardware.
When the weld was excessive penetration or non-penetration, the weldment was determined as unqualified. Therefore, the accuracy of the three penetration states must be calculated separately. Table 2 presents the validation accuracy of the three penetration states in the VGG16 network structure. Notably, the validation accuracy of the excessive penetration state is 100%, and that of the other two states is approximately 94.8%. The original image and high-level feature image in the excessive penetration state are considerably different from that of the other states, particularly high-level feature image shown in Figure 6. It can also be observed from the human eyes that Figure 6a is evidently different from Figure 6b,c. The difference between Figure 6b,c is not evident. The model can fully identify the excessive penetration state. It is difficult to distinguish between non-penetration and full penetration, but the proposed method can efficiently address this problem and can achieve an accuracy of approximately 94.80%.

3.2. Influence of Input Methods on Recognition Accuracy

In contrast to the dual-input model, the single-input model only has time domain or frequency image input. Image features are extracted through a set of CNNs, and data fusion is not required. The single-input and dual-input classification algorithms are the same. Figure 7 shows the validation accuracy of the single-input and dual-input models. The validation accuracy of the time single-input and dual-input models was approximately 96.20%, and the stability of the validation accuracy of the fusion data input model was slightly higher than that of the time single-input model. The validation accuracy of the frequency spectrum single-input model was much lower than those of the aforementioned two models, approximately 91.80%. Comparing to Table 2 and Table 3, notably, the classification accuracy of the three states is similar in time single-input and dual-input models. Furthermore, the time single-input model is simple in structure, requires fewer parameters, and is easy to train and deploy. For fewer requirements, time single-input model may be a better choice for penetration classification.

3.3. Influence of Sampling Methods on Recognition Accuracy

In references [21,22,23,24,25,26], the pulsed welding process was periodic, therefore the samples were collected according to an arc voltage or welding current cycle. However, the DC GTAW welding process considered in this study was non-periodic. Moreover, owing to the complexity of the welding process, the collected arc sound signals were irregular and non-periodic, as depicted in Figure 2. However, the collection of training samples is crucial for penetration classification. The original image samples were randomly collected and divided into training and validation datasets at a ratio of 3:1. Here, we artificially selected 200 images with the peak effect as the validation dataset, and the remaining 600 images as the training dataset. The same network model was used to verify the impact of the sample changes on the validation accuracy of the model.
Figure 8 shows the validation accuracy of the model when the model input is the original sample and the exchanged sample. The validation accuracy of the model was approximately 94.50% when the model input was the exchanged sample, which was slightly lower than that when the sample was freely chosen. In addition, as noted from Table 4, the validation accuracy of the model was 88.64% when the penetration state was non-penetration, which is much lower than the original calculation value of 94.93%. Therefore, for DC GTAW welding, sample selection was the primary issue to be considered.

4. Conclusions

In this study, a novel penetration recognition method for GTAW welding was proposed using a deep learning method. Unlike pulsed GTAW welding, the arc sound signal of DC GTAW welding was non-periodic. The dataset for the recognition model was derived from the time domain and frequency domain spectrum images of the arc sound. According to the different input modes of the model, single-input and double-input classification models were designed separately.
The overall validation accuracy of single-input and double-input classification models was approximately 96%, which met the production requirements. The overall validation accuracy of time single-input and double-input was similar, which was higher than that of frequency single-input. The robustness of the dual-input model was slightly higher than that of the time single-input model; however, the single-input model had the advantages of fewer network parameters and easier deployment to hardware. Furthermore, the recognition accuracy of the excessive penetration and full penetration models was higher than that of non-penetration, which was approximately 96%. The penetration recognition effect was the best in the excessive penetration state. Moreover, due to the non-periodicity of the arc sound during DC GTAW welding, the sampling methods of the time domain and spectrum images would also affect the validation accuracy of the model. Therefore, it was necessary to obtain as many images as possible, and more image features were extracted using CNNs to further improve the model accuracy.
This study investigated the feasibility of using deep learning method for penetration recognition in GTAW welding and achieved good results. With the rapid development of deep learning technology, the recognition accuracy of the model will be gradually improved, and more welding methods such as GMA should be considered. Artificial intelligence technologies such as deep learning have broad prospects in the field of welding.

Author Contributions

Conceptualization, J.W. and Y.G.; methodology, J.W. and S.G.; software, J.S.; validation, J.W., J.S. and Y.G.; formal analysis, J.W.; investigation, J.W. and S.G.; resources, Y.G.; data curation, J.S.; writing—original draft preparation, J.W.; writing—review and editing, J.W., S.G. and Y.G; visualization, J.S.; supervision, J.W.; project administration, Y.G.; funding acquisition, Y.G. and S.G. All authors have read and agreed to the published version of the manuscript.

Funding

This research was funded by National Natural Science Foundation of China, grant number 51465043 and 62061032; Nanchang Hangkong University Doctoral Foundation, grant number EA201904307.

Institutional Review Board Statement

Not applicable.

Informed Consent Statement

Not applicable.

Data Availability Statement

Not applicable.

Conflicts of Interest

The authors declare no conflict of interest.

References

  1. Kainuma, S.; Yang, M.; Jeong, Y.-S.; Inokuchi, S.; Kawabata, A.; Uchida, D. Fatigue Behavior Investigation and Stress Analysis for Rib-to-Deck Welded Joints in Orthotropic Steel Decks. Int. J. Steel Struct. 2018, 18, 512–527. [Google Scholar] [CrossRef]
  2. Dung, C.V.; Sasaki, E.; Tajima, K.; Suzuki, T. Investigations on the effect of weld penetration on fatigue strength of rib-to-deck welded joints in orthotropic steel decks. Int. J. Steel Struct. 2014, 15, 299–310. [Google Scholar] [CrossRef]
  3. Yu, H.; Ye, Z.; Chen, S. Application of arc plasma spectral information in the monitor of Al–Mg alloy pulsed GTAW penetration status based on fuzzy logic system. Int. J. Adv. Manuf. Technol. 2013, 68, 2713–2727. [Google Scholar] [CrossRef]
  4. Chandrasekhar, N.; Vasudevan, M.; Bhaduri, A.K.; Jayakumar, T. Intelligent modeling for estimating weld bead width and depth of penetration from infra-red thermal images of the weld pool. J. Intell. Manuf. 2013, 26, 59–71. [Google Scholar] [CrossRef]
  5. Chen, Z.; Chen, J.; Feng, Z. Welding penetration prediction with passive vision system. J. Manuf. Process. 2018, 36, 224–230. [Google Scholar] [CrossRef]
  6. Wu, D.; Chen, H.; Huang, Y.; Chen, S. Online Monitoring and Model-Free Adaptive Control of Weld Penetration in VPPAW Based on Extreme Learning Machine. IEEE Trans. Ind. Inform. 2018, 15, 2732–2740. [Google Scholar] [CrossRef]
  7. Huang, J.; Xue, L.; Huang, J.; Zou, Y.; Ma, K. Penetration Estimation of GMA Backing Welding Based on Weld Pool Geometry Parameters. Chin. J. Mech. Eng. 2019, 32, 55. [Google Scholar] [CrossRef]
  8. Liang, R.; Yu, R.; Luo, Y.; Zhang, Y. Machine learning of weld joint penetration from weld pool surface using support vector regression. J. Manuf. Process. 2019, 41, 23–28. [Google Scholar] [CrossRef]
  9. Lv, N.; Zhong, J.; Chen, H.; Lin, T.; Chen, S. Real-time control of welding penetration during robotic GTAW dynamical process by audio sensing of arc length. Int. J. Adv. Manuf. Technol. 2014, 74, 235–249. [Google Scholar] [CrossRef]
  10. Lv, N.; Xu, Y.L.; Li, S.C.; Yu, X.W.; Chen, S.B. Automated control of welding penetration based on audio sensing technology. J. Mater. Process. Technol. 2017, 250, 81–98. [Google Scholar] [CrossRef]
  11. Zhang, Z.F.; Wen, G.R.; Chen, S.B. Audible Sound-Based Intelligent Evaluation for Aluminum Alloy in Robotic Pulse GTAW Mechanism, Feature Selection, and Defect Detection. IEEE Trans. Ind. Inform. 2018, 14, 2973–2983. [Google Scholar] [CrossRef]
  12. Chen, C.; Xiao, R.; Chen, H.; Lv, N.; Chen, S. Arc sound model for pulsed GTAW and recognition of different penetration states. Int. J. Adv. Manuf. Technol. 2020, 108, 3175–3191. [Google Scholar] [CrossRef]
  13. Yusof, M.; Ishak, M.; Ghazali, M. Classification of weld penetration condition through synchrosqueezed-wavelet analysis of sound signal acquired from pulse mode laser welding process. J. Mater. Process. Technol. 2019, 279, 116559. [Google Scholar] [CrossRef]
  14. Song, S.; Chen, H.B.; Lin, T.; Wu, D.; Chen, S.B. Penetration state recognition based on the double-sound-sources characteristic of VPPAW and hidden Markov Model. J. Mater. Process. Technol. 2016, 234, 33–44. [Google Scholar] [CrossRef]
  15. Gao, Y.; Wang, Q.; Xiao, J.; Zhang, H. Penetration state identification of lap joints in gas tungsten arc welding process based on two channel arc sounds. J. Mater. Process. Technol. 2020, 285, 116762. [Google Scholar] [CrossRef]
  16. Gao, Y.; Zhao, J.; Wang, Q.; Xiao, J.; Zhang, H. Weld bead penetration identification based on human-welder subjective assessment on welding arc sound. Measurement 2020, 154, 107475. [Google Scholar] [CrossRef]
  17. Wu, D.; Huang, Y.M.; Chen, H.B.; He, Y.S.; Chen, S.B. VPPAW penetration monitoring based on fusion of visual and acoustic signals using t-SNE and DBN. model. Mater. Des. 2017, 123, 1–14. [Google Scholar] [CrossRef]
  18. Zhu, T.; Shi, Y.; Cui, S.; Cui, Y. Recognition of Weld Penetration During K-TIG Welding Based on Acoustic and Visual Sensing. Sens. Imaging 2019, 20, 3. [Google Scholar] [CrossRef]
  19. Zhang, Z.; Chen, S. Real-time seam penetration identification in arc welding based on fusion of sound, voltage and spectrum signals. J. Intell. Manuf. 2014, 28, 207–218. [Google Scholar] [CrossRef]
  20. Cui, Y.; Shi, Y.; Zhu, T.; Cui, S. Welding penetration recognition based on arc sound and electrical signals in K-TIG welding. Measurement 2020, 163, 107966. [Google Scholar] [CrossRef]
  21. Chen, B.; Wang, J.; Chen, S. Prediction of pulsed GTAW penetration status based on BP neural network and D-S evidence theory information fusion. Int. J. Adv. Manuf. Technol. 2009, 48, 83–94. [Google Scholar] [CrossRef]
  22. Butdee, S.; Thanomsin, J. Robotic welding using fuzzy logic to predict penetration for an oil pipeline weldment. Mater. Today Proc. 2020, 26, 2425–2431. [Google Scholar] [CrossRef]
  23. Wang, Q.; Jiao, W.; Zhang, Y. Deep learning-empowered digital twin for visualized weld joint growth monitoring and penetration control. J. Manuf. Syst. 2020, 57, 429–439. [Google Scholar] [CrossRef]
  24. Nomura, K.; Fukushima, K.; Matsumura, T.; Asai, S. Burn-through prediction and weld depth estimation by deep learning model monitoring the molten pool in gas metal arc welding with gap fluctuation. J. Manuf. Process. 2020, 61, 590–600. [Google Scholar] [CrossRef]
  25. Xia, C.; Pan, Z.; Fei, Z.; Zhang, S.; Li, H. Vision based defects detection for Keyhole TIG welding using deep learning with visual explanation. J. Manuf. Process. 2020, 56, 845–855. [Google Scholar] [CrossRef]
  26. Zhang, Z.; Li, B.; Zhang, W.; Lu, R.; Wada, S.; Zhang, Y. Real-time penetration state monitoring using convolutional neural network for laser welding of tailor rolled blanks. J. Manuf. Syst. 2020, 54, 348–360. [Google Scholar] [CrossRef]
  27. Wu, D.; Huang, Y.; Zhang, P.; Yu, Z.; Chen, H.; Chen, S. Visual-Acoustic Penetration Recognition in Variable Polarity Plasma Arc Welding Process Using Hybrid Deep Learning Approach. IEEE Access 2020, 8, 120417–120428. [Google Scholar] [CrossRef]
  28. Ren, W.; Wen, G.; Xu, B.; Zhang, Z. A Novel Convolutional Neural Network Based on Time–Frequency Spectrogram of Arc Sound and Its Application on GTAW Penetration Classification. IEEE Trans. Ind. Inform. 2020, 17, 809–819. [Google Scholar] [CrossRef]
  29. Keskar, N.S.; Socher, R. Improving Generalization Performance by Switching from Adam to SGD. arXiv 2017, arXiv:1712.07628. [Google Scholar] [CrossRef]
  30. Cui, G.; Guo, J.; Fan, Y.; Lan, Y.; Cheng, X. Trend-Smooth: Accelerate Asynchronous SGD by Smoothing Parameters Using Parameter Trends. IEEE Access 2019, 7, 156848–156859. [Google Scholar] [CrossRef]
Figure 1. Dual-input model for weld penetration classification.
Metals 12 01549 g001
Figure 2. Time and frequency spectrum images from arc sound in the three penetration states. (a) Excessive penetration, (b) full penetration, and (c) non-penetration.
Metals 12 01549 g002aMetals 12 01549 g002b
Figure 3. Time and frequency spectrum partly feature images from arc sound using CNN. (a) Time domain and (b) frequency spectrum.
Metals 12 01549 g003
Figure 4. Structure of a custom convolutional neural network.
Metals 12 01549 g004
Figure 5. Validation accuracy in three convolutional networks.
Metals 12 01549 g005
Figure 6. High-level image characteristics of three penetration states. (a) Excessive penetration, (b) non-penetration, and (c) full penetration.
Metals 12 01549 g006
Figure 7. Validation accuracy in three kinds of model.
Metals 12 01549 g007
Figure 8. Validation accuracy in two types of data (VGG16, dual-input).
Metals 12 01549 g008
Table 1. Welding parameters in three penetration states.
ExperimentWelding Current (A)Welding Speed (mm/min)Thickness of Base
Metal (mm)
Penetration States
11101202Excessive penetration
21101252Full penetration
31101302Non-penetration
Table 2. Validation accuracy in three penetration states (VGG16, dual-input).
Number1234567Accuracy (%)
Excessive penetration100.00100.00100.00100.00100.00100.00100.00100.00
Non-penetration96.6796.6793.3394.1794.6795.0094.0094.93
Full penetration96.6796.6795.5694.1793.3393.3393.5094.75
Table 3. Validation accuracy in three penetration states (VGG16, time single-input).
Number1234567Accuracy (%)
Excessive penetration100.00100.00100.0099.1798.6798.8999.0099.39
Non-penetration93.3391.6794.4495.0094.6795.0095.0094.16
Full penetration93.3396.6797.7897.5097.7395.0094.5096.07
Table 4. Validation accuracy in three penetration states (VGG16, dual-input, exchanged data).
Number1234567Accuracy (%)
Excessive penetration100.00100.00100.00100.00100.00100.00100.00100.00
Non-penetration90.0088.3390.0088.3389.1786.6788.0088.64
Full penetration100.0095.0096.6795.8395.3395.5695.5696.28
Publisher’s Note: MDPI stays neutral with regard to jurisdictional claims in published maps and institutional affiliations.

