Article

Improvement of the Fatigue Resistance of Super Duplex Stainless-Steel (SDSS) Components Fabricated by Wire Arc Additive Manufacturing (WAAM)

1
School of Mechanical Engineering, The University of Adelaide, Adelaide, SA 5005, Australia
2
College of Science and Engineering, Flinders University, Adelaide, SA 5001, Australia
*
Author to whom correspondence should be addressed.
Metals 2022, 12(9), 1548; https://doi.org/10.3390/met12091548
Submission received: 7 July 2022 / Revised: 2 September 2022 / Accepted: 7 September 2022 / Published: 19 September 2022
(This article belongs to the Special Issue Wire Arc Additive Manufacturing of Metallic Components)

Abstract

:
This study aimed to improve the overall fatigue properties of WAAM-produced SDSS by changing the interpass temperatures. Micro-computed tomography was used to quantitatively characterise the internal defects, such as porosity, in large-volume WAAM-fabricated SDSS materials. An increase in the interpass temperature led to a reduction in the ferrite phase balance by up to 20%. The fatigue anisotropy was still evident, but the fatigue limit in the weakest (transverse) direction was increased to 250 MPa or by approximately 40%. Meanwhile, the increased interpass temperature had no significant effect on fatigue resistance in the longitudinal direction. This study suggests that the interpass temperature can be critical for both achieving isotropic mechanical properties and increasing fatigue life of structural components fabricated with the WAAM method.

1. Introduction

Super duplex stainless steels (SDSS) are well known for their application as mechanical structures in corrosive and fatigue-prone environments, such as the offshore marine sector [1]. This is because SDSS have impressive mechanical properties, i.e., high strength, fracture toughness, high-corrosion resistance and resistance to stress corrosion cracking, and microstructural characteristics [2,3,4]. The fatigue properties of SDSS, which are manufactured traditionally to form forged, cast, billets, and milled rolled components, are relatively well understood [5]. However, new directed energy deposition production processes described in ISO/ASTM 52900, such as wire arc additive manufacturing (WAAM) of SDSS, are in an early stage of being studied and applied.
The fatigue properties of WAAM-fabricated SDSS components can be considered to be similar to the corresponding properties of the welded structures [6,7,8,9,10]. While there are industry standards for the design against fatigue and fatigue life evaluations [11], these standards still do not provide enough guidance on the design and fatigue life expectancy of additively manufactured, and in particular WAAM-fabricated, components. One of the difficulties in the development of the appropriate industry standards and the design guidelines is the large variety of additive manufacturing methods, consumables, and processes, which can produce materials and structures with very different mechanical properties [12].
In recent years, WAAM has emerged as a low-cost alternative to powder-based additive manufacturing (AM) methods, specifically for medium-to-large-scale structures, which are difficult to fabricate using other AM methods [13]. Other key advantages of WAAM include greater flexibility, consistency, and control in the fabrication process, as well as easy automation of the process. In WAAM, a structure is formed by depositing layer by layer using a plasma arc to melt a wire. As a result, WAAM is a less complicated and more robust process, requiring less maintenance and expensive tooling, and thus it has become the focus of many recent studies. Figure 1 shows a standard WAAM process equipment including a robotic arm and a positioner table.
As mentioned above, due to little research regarding the performance of WAAM-fabricated structures, the fatigue studies on welded SDSS joints are often utilised to assist the understanding of the fatigue behaviour of structures fabricated by WAAM. Previous investigations have shown that the fatigue resistance of welded SDSS structures was superior to those of carbon steel [14,15]. Larsen [15] reported a fatigue improvement in welded super duplex joints compared with carbon steel ones, although the improvement was significantly less than that reported by the present authors [16]. The difference can be attributed to the effect of residual stresses in welded joints, the distribution of manufacturing defects, and to the different consumables and process parameters. This discrepancy indicates that all these factors can potentially greatly affect fatigue performance as well as failure mechanisms.
Outcomes of recent works have demonstrated a significant anisotropy of properties in a high-cycle fatigue regime, despite nearing the isotropic basic mechanical properties related to monotonic loading, e.g., the yield strength and the critical elongation [16]. These findings, in particular, suggest a simple design approach to improve the fatigue life of WAAM-fabricated components by selecting the deposition direction, which has the strongest fatigue resistance, along the maximum principal cyclic stress. This approach will be beneficial to the fatigue life enhancement in certain situations and will generally prolong the fatigue life of structures fabricated with WAAM. However, this approach has its limitations and becomes much less effective for structures working under stress states with a relatively small difference in principal cyclic stresses or for structures in which the direction of principal stresses also changes over time. Therefore, further research is required to address the issue of fatigue anisotropy.
We hypothesise that the improvement in fatigue performance can be achieved by a careful selection of fabrication parameters, which have a significant influence on both the microstructures and the defect-formation mechanisms as highlighted above. In particular, in this study, we have investigated the interpass temperature effect on fatigue properties, which has the same meaning for welded structures, on the fatigue resistance of SSDS fabricated by WAAM. For this purpose, we utilised a range of tools, specifically micro-computed tomography, to demonstrate the effect of the interpass temperature on the formation of manufacturing defects, optical microscopy to identify micro-structural properties, and cyclic testing to quantify the resistance of the material to fatigue loading in the high-cycle fatigue regime.

2. Methods and Materials

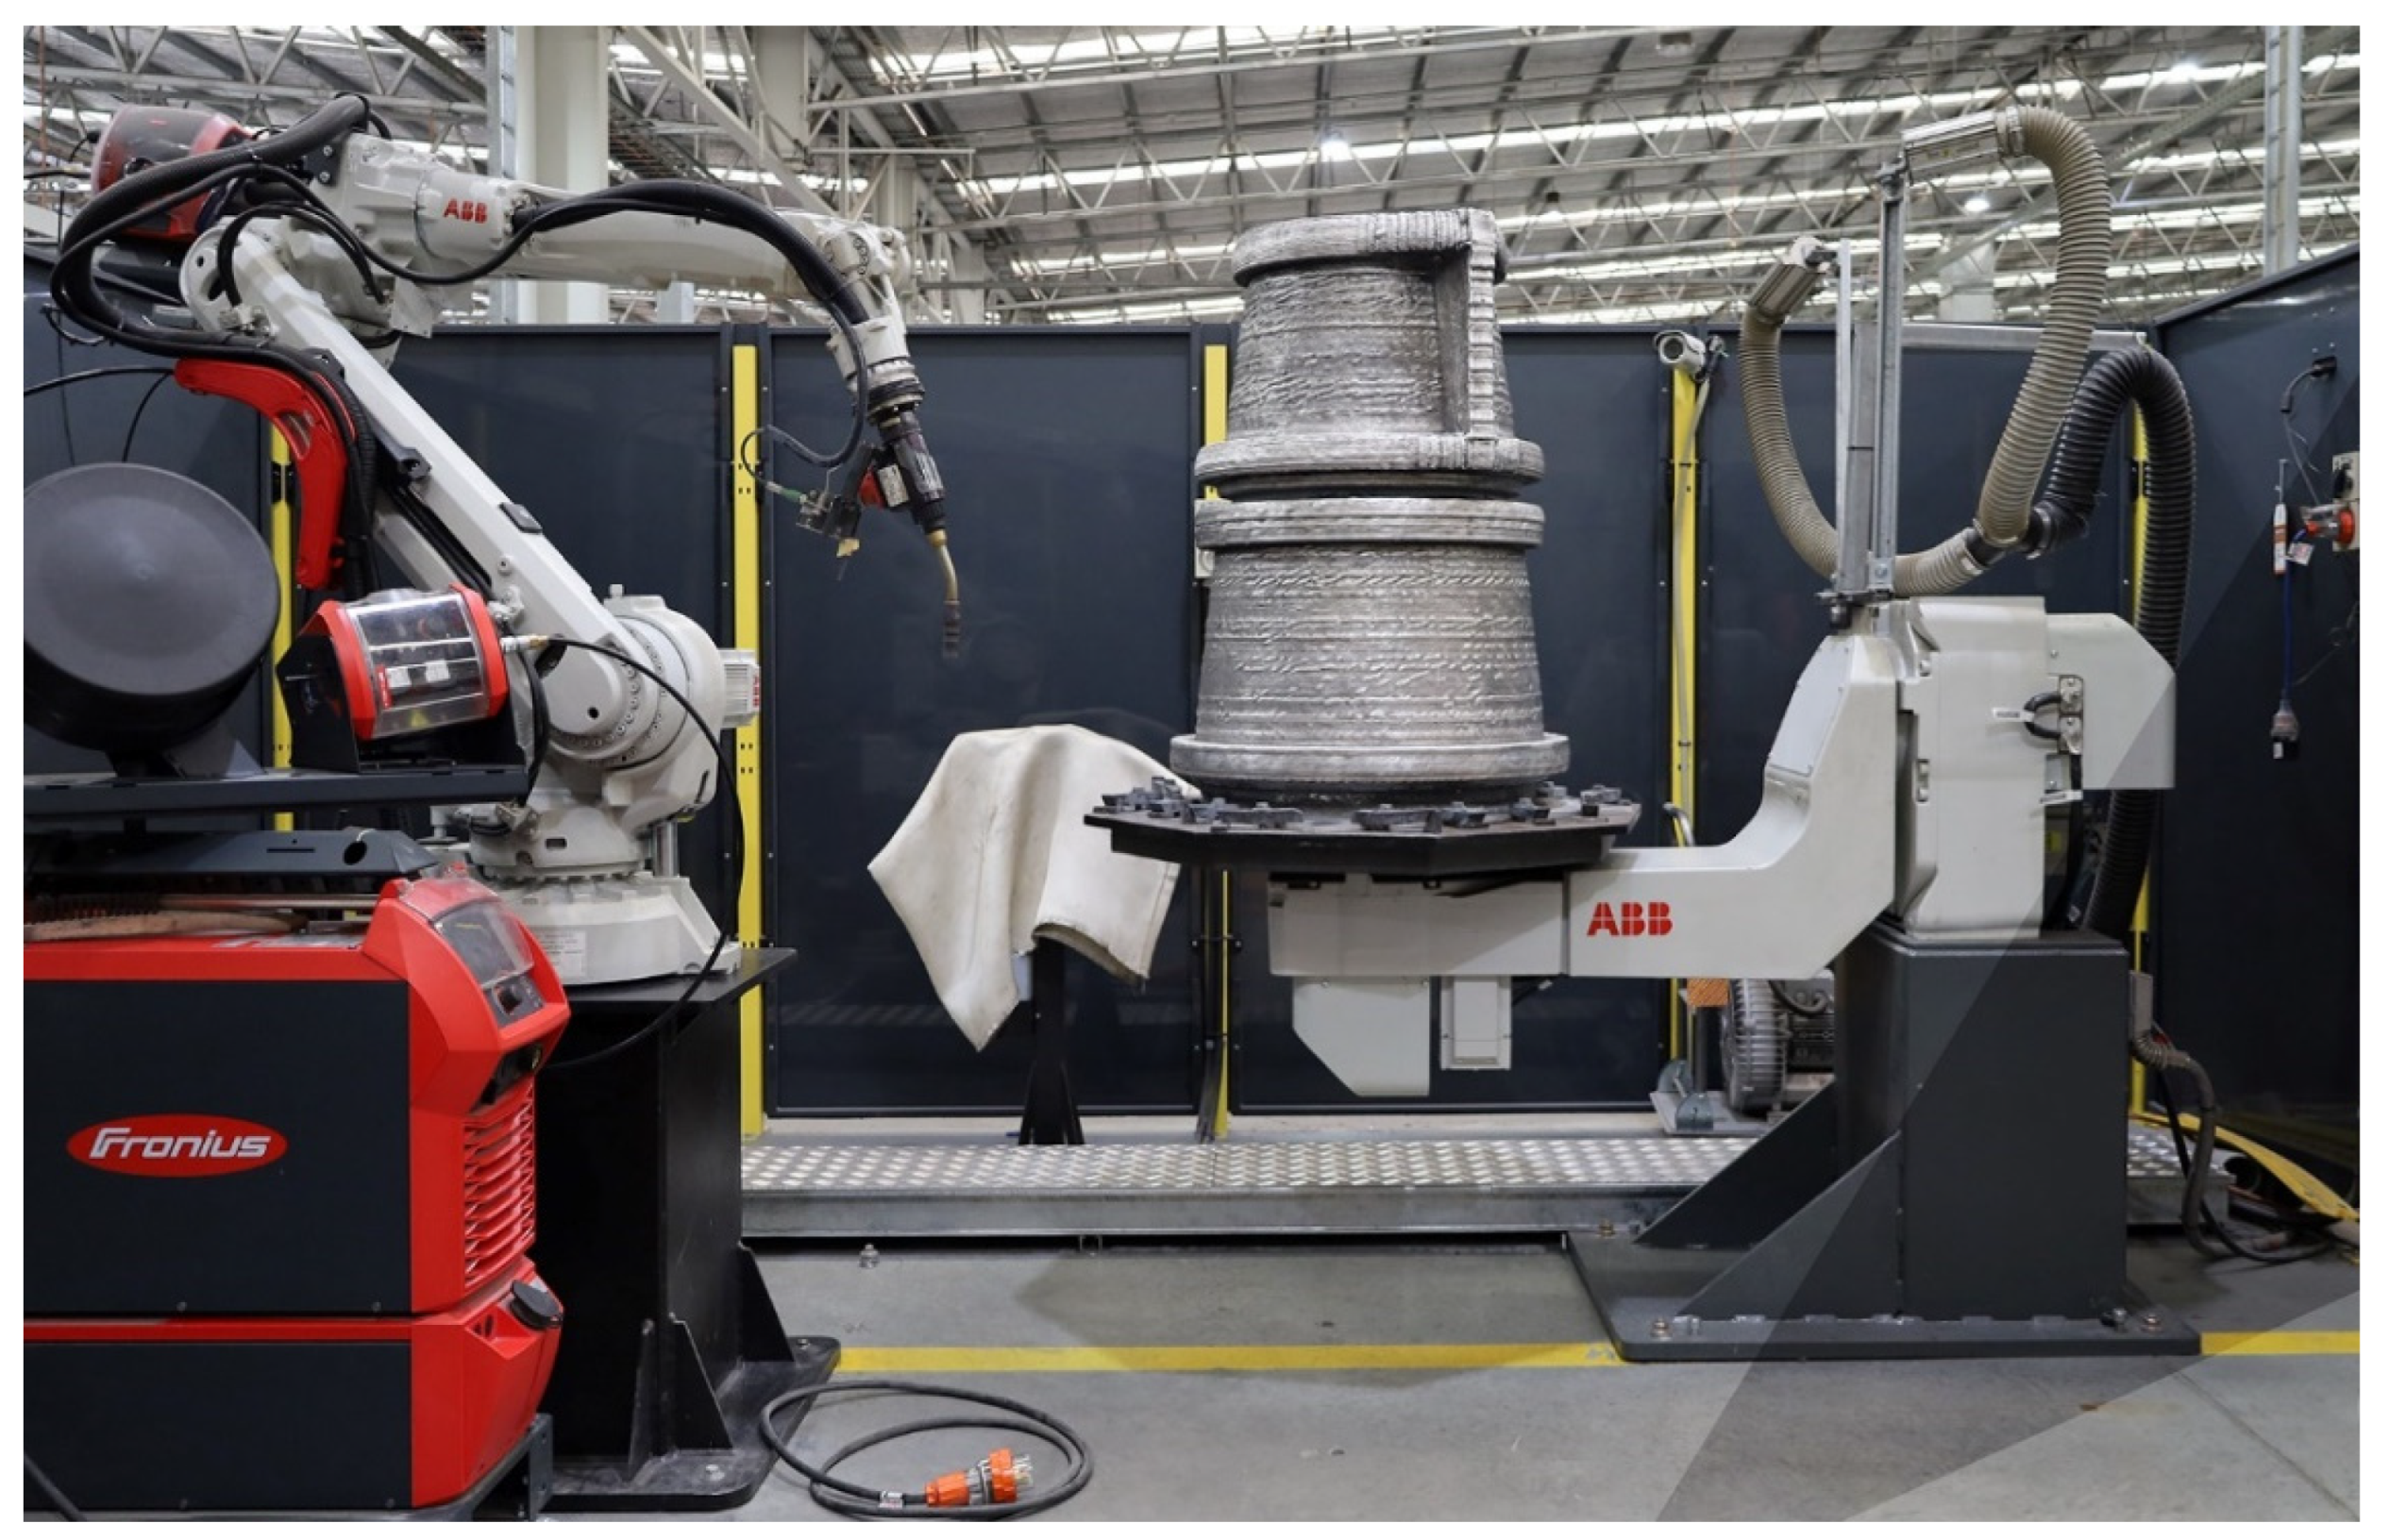
2.1. WAAM Processing

A MiG welding wire of consumable ER2594, from Kuang Tai Mill, Taiwan, with a diameter of 1.2 mm was used in a Fronius welding power source (TransPuls 500 Amp). Test walls with dimensions of 450 mm × 230 mm × 23 mm (Figure 2) were manufactured by WAAM. Three beads were overlapped by 67–70% [16] to produce the test walls of 23 mm thickness. A standard CMT (cold metal transfer) process mode, which is a controlled short-circuit droplet transfer technique, was utilised with a deposition rate of 4.8 kg/h. An ABB robotic system controlled the welding automation using slicing software WAMSoft® (version 3, Adelaide, Australia) to create a path planning for the test walls. The accuracy and consistency of the welding parameters, the placement of beads, and the dwell time between layers were all programmed using the WAMSoft® software package.
Beads were deposited on one side of a super duplex 2507 substrate, which was restrained with clamps to limit distortions using a 1.2 mm diameter super duplex wire feedstock ER2594 SDSS by employing a slight oscillation to the bead layering [16]. Table 1 lists the chemical composition of the ER2594 wire. The deposition was conducted with the torch perpendicular to the workpiece, with an alternating starting point sequence from each end of the test wall length to mitigate any unevenness on the completed height. The shielding gas selected was an Argon mix suited to the GMAW process (Argon + CO2, 75%/25% mix) at a 20 L/min flow rate, measured at the torch end prior to commencing the welding.
Two test walls were fabricated by WAAM with the same welding parameters, but with different interpass temperatures to alter the cooling rates; these are summarised in Table 2. Heat input and cooling rates were selected based on standard welding methods to achieve stable characteristics of the deposition and to additionally achieve an industry-acceptable phase balance of 30–70% ferrite–austenite, based on various literature [2,14,16,17]. An interpass dwell time between layers was set at 150 °C for Test Wall 1 and 100 °C for Test Wall 2, which would allow a variance of the final phase balance. The interpass temperature was measured with a pyrometer by the readings taken immediately prior to the proceeding bead to be deposited. Furthermore, heat input calculations were determined using the following common equation [18,19]:
E = U · I v × 10 3
where E is the arc energy or the heat input in kJ/min, U is the arc voltage measured at the welding source, I is the welding current in A, and v is the travel speed. The heat losses to environment were considered to be negligible [19,20].

2.2. Microstructure Characterisation

Cross-section specimens were cut and etched using both Beraha II and 10% KOH for metallographic examination, using a metallurgical microscope at magnifications up to 1000×. Ferrite and austenite percentages were determined using the point count method according to ASTM E1245 [20], which utilises a grid size of 30 for 30 counts. Additionally, the values were also checked using a Fischer ferrite scope across the entire height of the test walls to gain sufficient readings.

2.3. Micro-Computed Tomography of WAAM Specimens

Manufacturing defects were assessed in three dimensions by micro-computed tomography (micro-CT). Dimensions of the two test samples were 10 mm in diameter and 20 mm in length and taken from the transverse direction of the printed test wall. Scans were performed using a micro-CT system (Nikon XT H 225ST, Nikon Metrology, Tring, Hertfordshire, UK) [21]. Each specimen was scanned at 18 µm isotropic pixel size, 215 kV X-ray tube voltage, and 84 µA (18 W) current, in order to obtain 800 X-ray projection images (2028 × 2028 pixels each, corresponding to 35.5 × 35.5 mm field of view), which were taken over 360° rotation (rotation step 0.45°), 2.83 s exposure time, 1 frame averaging, and with a 0.25 mm tin filter. The cross-section images were reconstructed using a filtered back-projection algorithm (CT Pro 3D, Nikon Metrology, Tring, Hertfordshire, UK) and saved as 8-bit bitmap format images (256 grey-levels). For each specimen, a stack of up to 1200 consecutive cross sections was reconstructed with a slice thickness of one pixel (18 µm), corresponding to 22 mm length. The stack of micro–CT images was then sequentially examined in three orthogonal planes for the presence of defects using DataViewer software (version 1.5.4.0, Skyscan-Bruker, Kontich, Belgium).
From the stack of contiguous micro-CT cross-section images, a volume of interest (VOI) was selected for morphometric analysis, with length 20 mm and diameter 9.9 mm (slightly smaller than the specimen diameter) fully inscribed in the specimen and following the bordering pixels of the specimen (software CT Analyser, V1.17.7.2, Skyscan-Bruker, Kontich, Belgium). The images were binarised by uniform thresholding, with the pores segmented as solid and the metal as background. The pore volume (in mm3) was calculated as the sum of voxels segmented as voids [22] from which the porosity (in %) was computed, as pore volume divided by total volume of the VOI. The pore diameter was calculated in 3D, as the average diameter of the pores as a solid structure using the sphere-filling algorithm [23,24]. Three-dimensional models of the specimens were created and visualised using Paraview open-source software (available at www.paraview.org/, accessed on 5 July 2022, Kitware Inc, Clifton Park, NY, USA).

2.4. Mechanical Testing

Several specimens were machined from both test walls in transverse and longitudinal directions with the dimensions (see Figure 3) following ASTM E8/E8M-16a standard for tension testing, using an Instron machine equipped with a 250 kN computer-controlled load cell. All specimens were polished and then inspected with dye penetrant to detect any surface defects present prior to the testing. Tensile testing was then conducted first to evaluate the monotonic stress–strain diagram at slow strain rates, which complied with the ASTM E8/E8M-16a standard [25], to determine the basic material properties and fracture morphology.
A total of 24 specimens from test wall 1 (TW1) and 12 test specimens from test wall 2 (TW2) were cut and polished to obtain 12 longitudinally deposited and 12 transversely deposited specimens with the same dimensions as described in Figure 3 for fatigue testing using the Instron machine. A minimum of two specimens underwent the same load conditions across all specimens in order to find the fatigue limits and gain consistent data. Specimen identification labels were 26L1-26L6 and 27L1-26L6 for the longitudinal deposition directions and 26T1-26T6 and 27T1-27T6 for the transverse directions, see Figure 2. Of the 12 specimens from TW2, 8 specimens were from the transverse direction with the remaining 4 from the longitudinal direction. Identification labels for TW2 specimens were simply named 21T1-21T8 for transverse direction and 21L1-21L4 for the longitudinal. During the fatigue testing, cyclic loading in a sinusoidal manner was applied with a frequency of 10 Hz and a stress ratio of R = 0.1 for all specimens. All tests were performed under strain control conditions at room temperature.

3. Results and Discussion

3.1. Microstructure and Internal Defect Examination

The microstructural analysis of the ferrite–austenite phase balance revealed significant differences between the weight ferrite percentages of longitudinal and transverse directions; see Figure 4. The increased cooling employed on TW2 with an interpass temperature of 100 °C resulted in a phase balance of 36% ferrite and 64% austenite. This is consistent with previous work stating that increased cooling rates promote austenite, and fast cooling rates through T12/8 increase the ferrite volume fraction content [2,3,4,26,27,28,29,30]. Additionally, these phase balance results for the two test samples quantify well the petroleum industry standards of 30–70% of ferrite–austenite balance based on ER2594.
WAAM-induced internal volumetric defects, such as porosity, are visualised as red and green portions in the 3D micro-CT images in Figure 5 and Figure 6, showing the distribution of these manufacturing defects. Pores were intermittently dispersed in both specimens scanned, and average pore diameters were no greater than ~250 µm. Internal porosity defects of 21T5 were two times that of 21T6 (0.0133% vs. 0.0063%). Generally, across all specimens, the presence of internal defects was considered the main cause for fatigue failures, which often initiated from the interior fatigue specimens rather than from the surfaces as reported by Sales et al. [16]. This finding limits (to some extent) the importance of surface treatment for the improvement of the fatigue resistance of WAAM-fabricated components.

3.2. Mechanical Properties

In tensile testing, both TW1 and TW2 specimens had ductile fractures. The yield and ultimate tensile values were much the same for the two different interpass temperatures. For TW1, the longitudinal specimens obtained 670–672 MPa for yield and 871–875 MPa for the tensile stress, in comparison with the transverse specimens of 645–650 MPa and 836–850 MPa, respectively. Fracture faces of the specimens were inspected and observed as cup and cone features typically seen for ductile materials.
For TW2, the yield and tensile values were very consistent with TW1, achieving the longitudinal direction with 678–680 MPa yield and 882–885 MPa tensile strength, and the transverse direction with 650–652 MPa yield and 843–846 MPa tensile strength. The ductile failures yielded the critical elongations of 21–32% for both TW1 and TW2. These values are in good agreement with the mechanical properties of SDSS published previously.
Fatigue test results for both the original TW1 longitudinal and transverse specimens were compared against the increased cooling time employed for TW2 longitudinal and transverse specimens, and thus presented in Table 3 and Figure 7 and Figure 8. In the table, the maximum cycles N f and the maximum stress load σ a for all test specimens are summarised, noting that Test Wall 1 was from the authors’ previous study [16]. Furthermore, the fatigue results are also presented in the S–N curves in Figure 7 and Figure 8, together with the fatigue data for two SDSS, SAF 2205, and SAF2507 as comparative base materials [5]. Fatigue results presented for TW1 showed strong anisotropic behaviour between longitudinal (along the deposition direction) and transverse (perpendicular to deposition) directions. However, increased cooling rates which saw the ferrite values drop by 20% for TW2 specimens achieved a 43% increase in the maximum stress from 175 MPa to 250 MPa, with the number of cycles increasing up to 2.5 × 10⁶. Three specimens—21T2, 21T4, and 21T5—achieved 2.5 × 10⁶ and did not fracture; these fatigue tests were stopped without failure.
The fatigue limit (the fatigue failure stress at 106 cycles) for longitudinal specimens is almost twice that for transverse specimens for TW1 specimens only. It was previously suggested that the interlayer fusion zone and the presence of secondary austenite due to the reheating between bead layers could have a weakened effect. Maximum stress of 300 MPa to 325 MPa (~46% and 50% of YS, respectively) was achieved for the longitudinal direction with 2 × 10⁶ cycles achieved for specimens in TW1; however, the specimens 21L1-21L4 from TW2 were not significantly more. Higher stress values for 21L1, 21L2, and 21L3 achieved >106 cycles at 325 MPa maximum stress. In fact, 21L3 was subjected to 1.6 × 10⁶ cycles before failure, yet 21L1 obtained 2.4 × 10⁶ cycles without failure or fracture.
Internal defects and phase balance may have contributed to limiting the maximum stress for some specimens. Specimens 26L4 and 26L6 showed notable pores and failed at 25 × 104 and 44 × 104 cycles, respectively, at 325 MPa and 350 MPa. For instance, specimen 26L3 sustained 2.12 × 10⁶ cycles at maximum stress of 350 MPa, yet it had a notable internal pore defect of ~0.35 mm in diameter.
In contrast, the specimens cut in the transverse deposition direction had much lower fatigue limit stress values. Maximum stress values commenced at 400 MPa, but smaller applied stress amplitude values resulted in some confidence that the fatigue limit was around 175 MPa. Specimens 26T5 and 26T6 were sustained of 1.62 × 10⁶ and 2.02 × 10⁶ cycles, respectively. While the latter specimen did not fail after 2.02 × 10⁶ cycles, 26T6 exhibited minor gas pores of >0.1 mm, from which fatigue failure had initiated. 26T1 and 26T4 both failed due to large scattered internal defects at ~2.5 × 10⁵, at the maximum stress of 300 MPa and 250 MPa respectively, indicating that these defects were responsible for early failure. Additionally, 21T5 indicated twice the defect size, or ~0.2 mm, when compared to 21T6, yet the former did not fail during fatigue loading, reaching 2.5 × 10⁶ cycles, while 21T6 failed at 1.0 × 10⁶ cycles under the same stress load of 250 MPa. Although defect size has not shown a consistent relationship to any number of cycles to failure, the results do indicate that evidence of large, imbedded defects >0.25 mm need to be avoided, and therefore volumetric non-destructive testing would be required to detect these types of flaws. Results have shown that smaller dimensioned flaws seen in 26L3 and 21T5 can be tolerated. 26L3 failed at 2.12 × 10⁶ and exhibited a <0.35 mm sized defect; however, 21T5 exhibited a slightly smaller internal defect and reached 2.5 × 10⁶ cycles without failure.
Observations made from the micro-CT scan defects indicated possible multiple internal and external defects throughout TW1 and TW2, which were identified as gas pores and cluster pores, typically seen in gas metal arc (GMA) welding processes. The characteristic size of the non-propagating internal defects (0.2–0.3 mm, see Figure 5 and Figure 6) and the obtained fatigue limits of around 200 MPa correlate well with the fatigue threshold values, which for steels are around 3–7 MPa m [31]. This can be verified using the standard (Griffith) equation for internal defects: K = σ π a , where K is the stress intensity factor, σ is remote stress, and a is the characteristic size (half-size) of the defect. This indicates and explains the crucial role of the manufacturing defects in fatigue performance of WAAM-fabricated components.

4. Conclusions

In this paper, we investigated the effect of the interpass temperature on the mechanical and fatigue properties of SSDS fabricated with the WAAM method. New experimental results have been reported, including the micro-CT 3D reconstruction of a relatively large volume of WAAM-fabricated material describing the internal defect distribution. The following conclusions are summarised as follows:
  • Mechanical properties, such as the critical elongation, yield, and tensile stress values of the SDSS specimens were found with no variance. This suggests that the cooling rates changes and difference in the interpass temperature had little effect on these properties. However, there was a significant difference in the microstructure, specifically in the ferrite–austenite phase balance. TW1 had an interpass temperature of 150 °C, which resulted in 43–45% ferrite, whereas TW2 with an interpass temperature of 100 °C resulted in less ferrite of 35–36%.
  • It is assumed that the reduction of the ferrite weight percentage has greatly enhanced the fatigue resistance, and therefore enhance fatigue life in the WAAM transverse (weakest) direction. In addition, internal defects in the form of porosities in large-volume WAAM-fabricated SDSS materials were for the first time measured using micro-CT. Mechanical properties showed good values in both the longitudinal and transverse directions. Only a difference of 7–8% across the ultimate tensile and yield strength values was evident, indicating an isotropic material property. However, this was not the case with the fatigue behaviour.
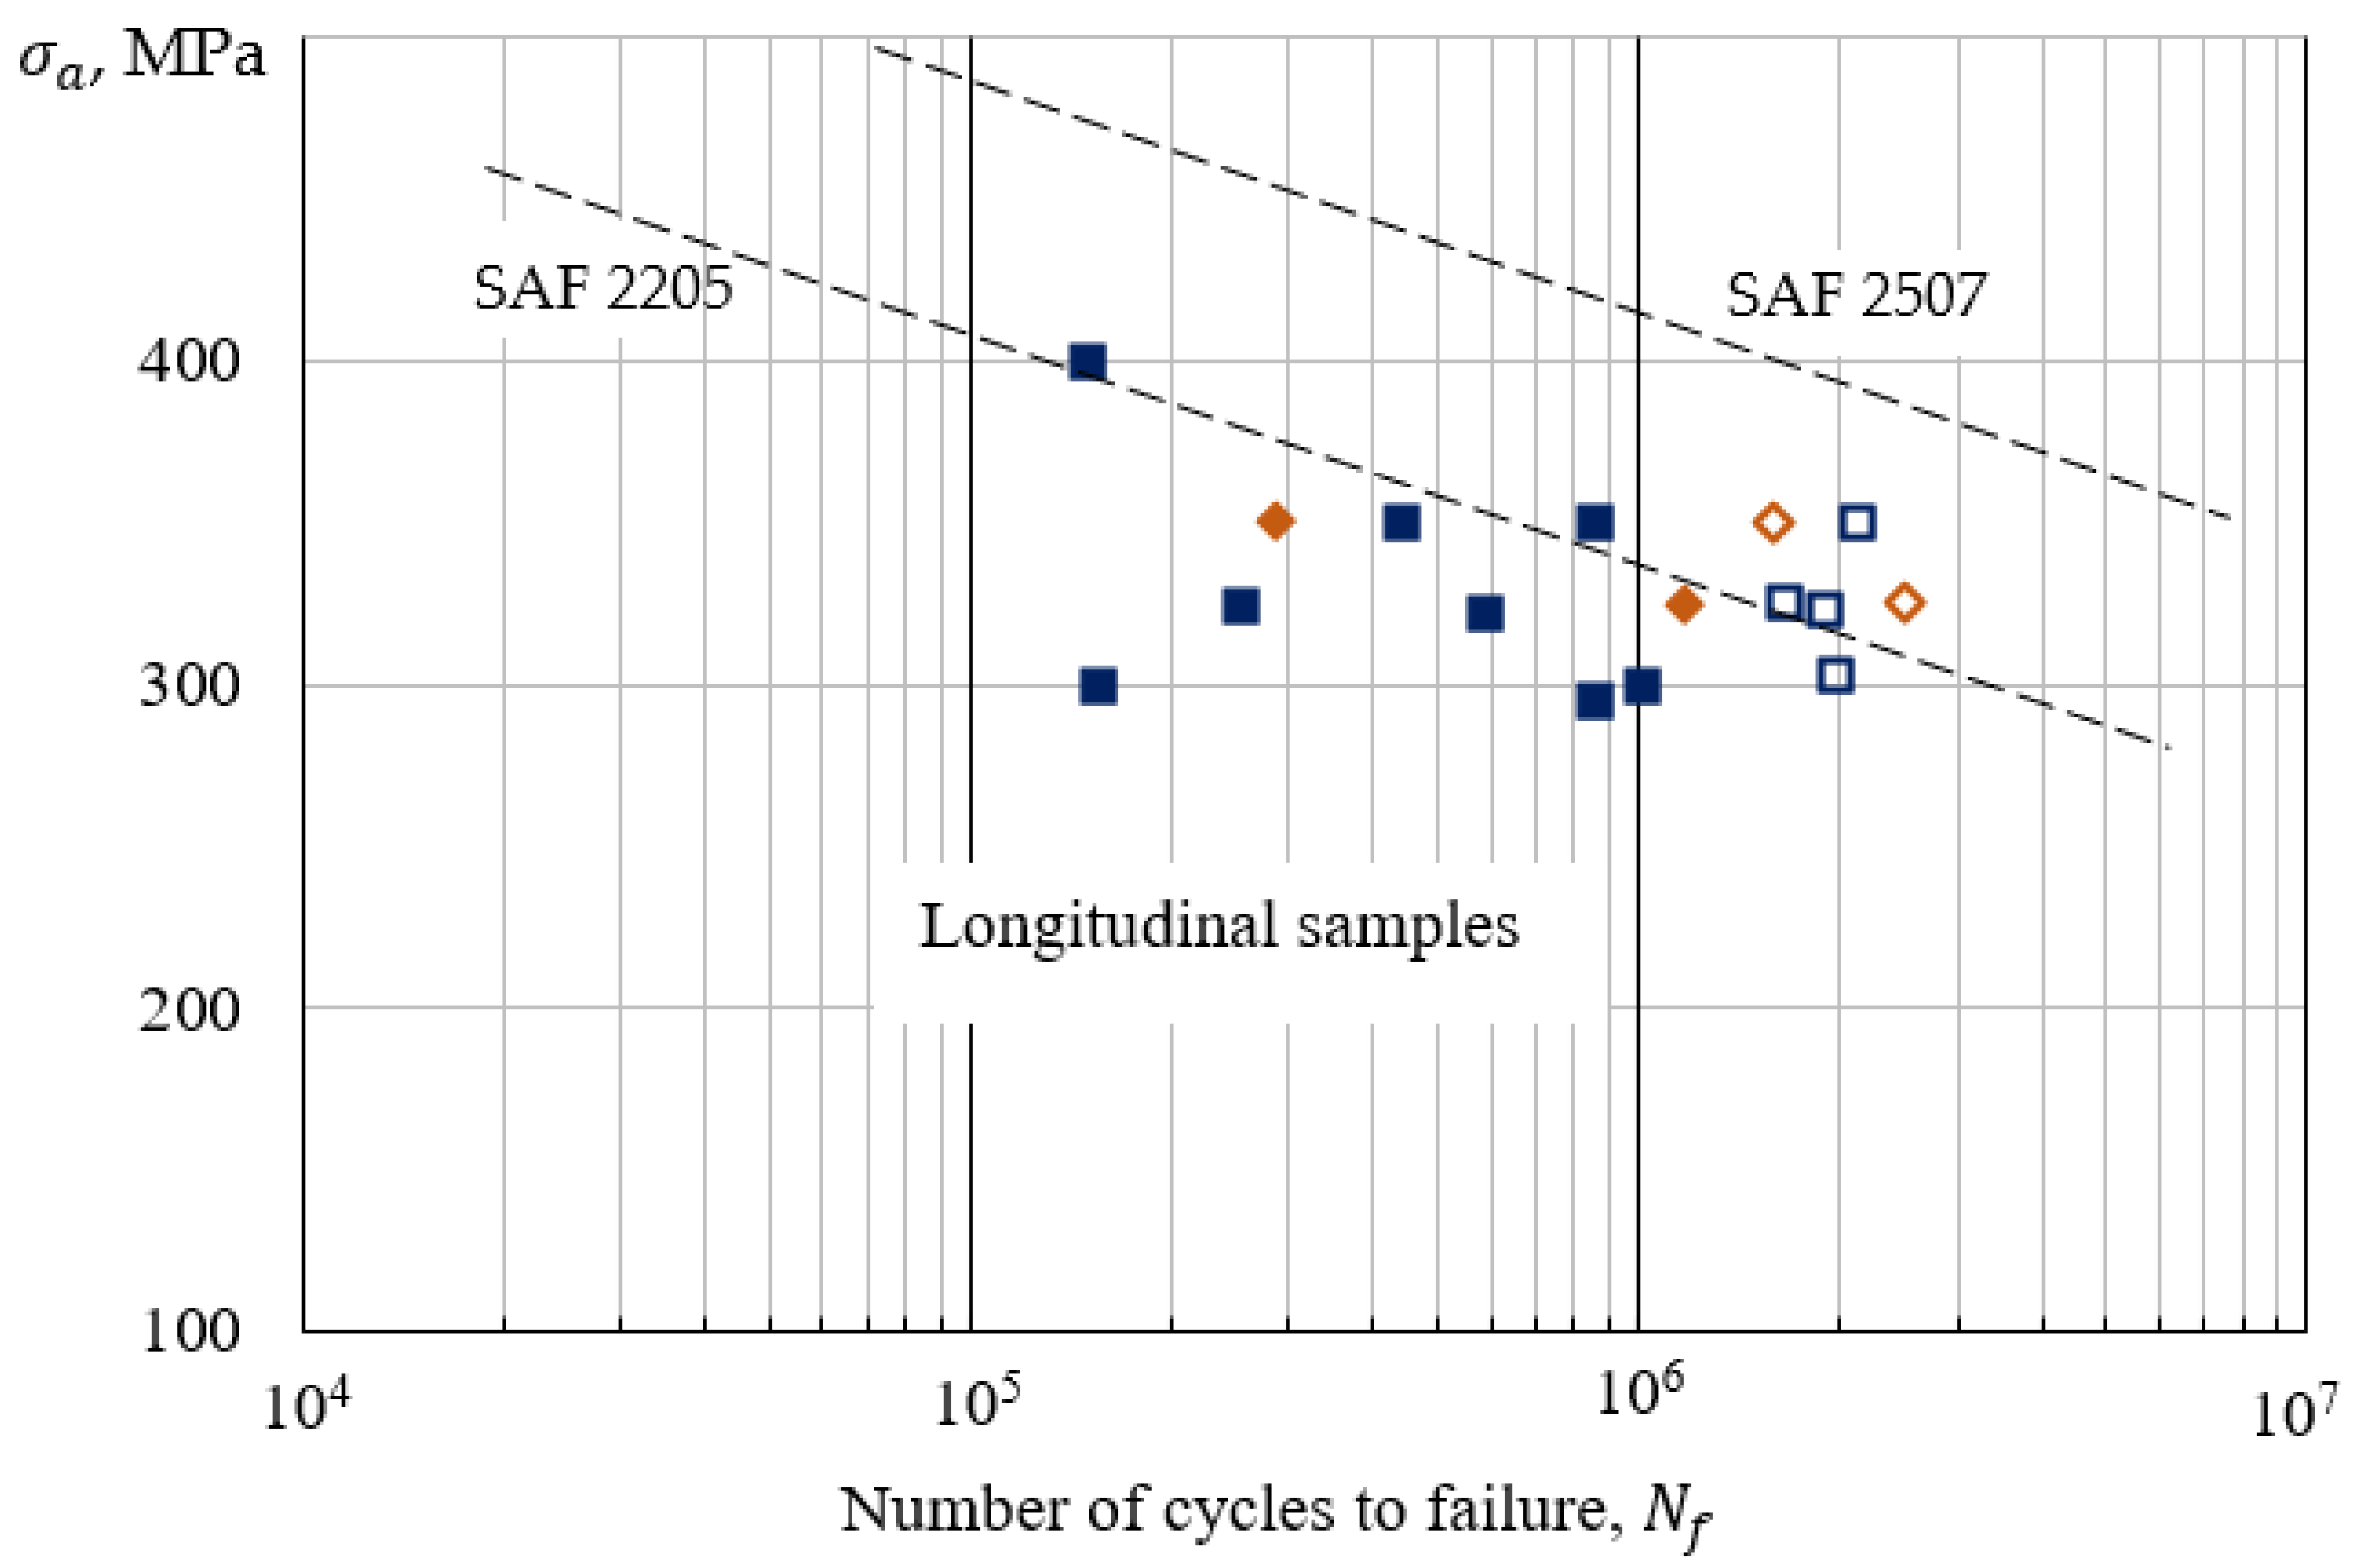
  • The increased interpass temperatures for the second test wall (TW2) resulted in a significant increase to fatigue limit maximum stress in the transverse direction by up to 43%, from 175 MPa to 250 MPa, with >2.45 × 10⁶ cycles to failure, but interestingly had limited effect on the fatigue properties in the longitudinal direction.
Overall, this paper has demonstrated that relatively small changes to process parameters can have a large effect on the manufacturing defects and fatigue behaviour of the fabricated structures. This conclusion agrees well with the outcomes of the previous studies [27,28,29]. Therefore, a better control and consistency of the operation, which are the main features of the WAAM process, could facilitate the use of this manufacturing process for the fabrication of structural components working in challenging environments such as corrosion and fatigue [30,31].
The future studies will investigate the effect of other process parameters, such as the heat input and the deposition speed, on defect formation and fatigue resistance. The ultimate goal of this research is to identify the optimum parameters of this process and facilitate the certification of this process for the fabrication of large-scale structures working under fatigue in the presence of a corrosive environment, which are typical for marine structures.

Author Contributions

Conceptualization, all authors; Investigation, mechanical testing, fractography, interpretation of results and writing of original draft, A.S.; Interpretation of data, all authors; Internal defect examination using CT scan, E.P.; Writing—review and editing, all authors; All authors have read and agreed to the published version of the manuscript.

Funding

This research was funded by the ECMS Strategic Impact Fund 2021 from the Faculty of Engineering, Computer and Mathematical Sciences, The University of Adelaide.

Data Availability Statement

Further additional data may be obtained by request to the corresponding author.

Acknowledgments

The authors would like to acknowledge Flinders Microscopy and Microanalysis (FMMA) for providing access to the large-volume micro-CT system and the Australian Research Council (LE180100136) for the support for its procurement. They are also grateful to the support of the ECMS Strategic Impact Fund 2021 from the Faculty of Engineering, Computer and Mathematical Sciences, The University of Adelaide.

Conflicts of Interest

The authors declare no conflict of interest.

References

  1. Nilsson, J.-O. Super duplex stainless steels. Mater. Sci. Technol. 1992, 8, 685–700. [Google Scholar]
  2. Karlsson, L. Welding duplex stainless steels—A review of current recommendations. Weld. World 2012, 56, 65–76. [Google Scholar] [CrossRef]
  3. Gunn, R. Duplex Stainless Steels: Microstructure, Properties and Applications; Woodhead Publishing: Sawston, UK, 1997. [Google Scholar]
  4. Lippold, J.C.; Kotecki, D.J. Welding Metallurgy and Weldability of Stainless Steels; Wiley: Hoboken, NJ, USA, 2005. [Google Scholar]
  5. Polak, J. Cyclic plastic response and fatigue life of duplex and superduplex stainless steels. Kov. Mater. 2005, 43, 280–289. [Google Scholar]
  6. Comer, A.; Looney, L. Corrosion and fatigue characteristics of positively polarised Zeron 100 base & weld metal in synthetic seawater. Int. J. Fatigue 2006, 28, 826–834. [Google Scholar]
  7. Salo, J. Fatigue Strength of Welded Joints in Super-Duplex Stainless Steel. Master’s Thesis, Lappeenranta University of Technology, Lappeenranta, Finland, 2016. [Google Scholar]
  8. Björk, T.; Mettänen, H.; Ahola, A.; Lindgren, M.; Terva, J. Fatigue strength assessment of duplex and super-duplex stainless steels by 4R method. Weld. World 2018, 62, 1285–1300. [Google Scholar]
  9. Xie, X.-F.; Li, J.; Jiang, W.; Dong, Z.; Tu, S.-T.; Zhai, X.; Zhao, X. Nonhomogeneous microstructure formation and its role on tensile and fatigue performance of duplex stainless steel 2205 multi-pass weld joints. Mater. Sci. Eng. A 2020, 786, 139426. [Google Scholar]
  10. Udo, R.; Numakura, H. Effect of post-weld heat treatment on fatigue reliability of super-duplex-stainless-steel weldments. ISIJ Int. 2017, 57, 1228–1232. [Google Scholar] [CrossRef]
  11. DNV. Recommended practice DNV-RP-C203—Fatigue Design of Offshore Steel Structures. 2020. DnV Høvik. Available online: https://www.dnv.com/oilgas/download/dnv-rp-c203-fatigue-design-of-offshore-steel-structures.html (accessed on 5 July 2022).
  12. Vafadar, A.; Guzzomi, F.; Rassau, A.; Hayward, K. Advances in metal additive manufacturing: A review of common processes, industrial applications, and current challenges. Appl. Sci. 2021, 11, 1213. [Google Scholar] [CrossRef]
  13. Treutler, K.; Wesling, V. The current state of research of wire arc additive manufacturing (WAAM): A review. Appl. Sci. 2021, 11, 8619. [Google Scholar] [CrossRef]
  14. Valiente Bermejo, M.A.; Eyzop, D.; Hurtig, K.; Karlsson, L. Welding of large thickness super duplex stainless steel: Microstructure and properties. Metals 2021, 11, 1184. [Google Scholar] [CrossRef]
  15. Larsen, K.; Nystrom, M.; Mohr, B.; Ames, N.; McGaughy, T. Improved Fatigue Life Through the Use of SAF 2507 Super Duplex Stainless Steel. In Proceedings of the Sixteenth International Offshore and Polar Engineering Conference, San Francisco, CA, USA, 28 May–2 June 2006. [Google Scholar]
  16. Sales, A.; Kotousov, A.; Yin, L. Design against Fatigue of Super Duplex Stainless Steel Structures Fabricated by Wire Arc Additive Manufacturing Process. Metals 2021, 11, 1965. [Google Scholar] [CrossRef]
  17. Ding, D.; Pan, Z.; Cuiuri, D.; Li, H. A multi-bead overlapping model for robotic wire and arc additive manufacturing (WAAM). Robot. Comput. Integr. Manuf. 2015, 31, 101–110. [Google Scholar] [CrossRef]
  18. Norrish, J. Advanced Welding Processes; Springer Science & Business Media: Berlin/Heidelberg, Germany, 1992. [Google Scholar]
  19. Norrish, J. Recent gas metal arc welding (GMAW) process developments: The implications related to international fabrication standards. Weld. World 2017, 61, 755–767. [Google Scholar] [CrossRef]
  20. ASTM E1245-2003; Determining the Inclusion or Second-Phase Constituent Content of Metals by Automatic Image Analysis. ASTM: West Conshohocken, PA, USA, 2003; (reapproved 2016).
  21. Wearne, L.S.; Rapagna, S.; Taylor, M.; Perilli, E. Micro-CT scan optimisation for mechanical loading of tibia with titanium tibial tray: A digital volume correlation zero strain error analysis. J. Mech. Behav. Biomed. Mater. 2022, 134, 105336. [Google Scholar] [CrossRef] [PubMed]
  22. Perilli, E.; Bala, Y.; Zebaze, R.; Reynolds, K.J.; Seeman, S. Regional heterogeneity in the configuration of the intracortical canals of the femoral shaft. Calcif Tiss Int. 2015, 97, 327–335. [Google Scholar] [CrossRef]
  23. Perilli, E.; Baruffaldi, F.; Bisi, M.C.; Cristofolini, L.; Cappello, A. A physical phantom for the calibration of three-dimensional X-ray microtomography examination. J Microscopy 2006, 222, 124–134. [Google Scholar] [CrossRef]
  24. Hildebrand, T.; Rüegsegger, P. A new method for the model-independent assessment of thickness in three-dimensional images. J Microscopy 1999, 185, 67–75. [Google Scholar] [CrossRef]
  25. ASTM E8/E8M-16A; Standard Test Methods for Tension Testing of Metallic Materials. ASTM: West Conshohocken, PA, USA, 2016.
  26. Lervåg, M.; Sørensen, C.; Robertstad, A.; Brønstad, B.M.; Nyhus, B.; Eriksson, M.; Aune, R.; Ren, X.; Akselsen, O.M.; Bunaziv, I. Additive manufacturing with superduplex stainless steel wire by cmt process. Metals 2020, 10, 272. [Google Scholar] [CrossRef]
  27. Jebaraj, A.V.; Kumar, L.A.; Deepak, C. Investigations on anisotropy behavior of duplex stainless steel AISI 2205 for optimum weld properties. Procedia Eng. 2017, 173, 883–890. [Google Scholar] [CrossRef]
  28. Mateo, A. Anisotropy effects on the fatigue behaviour of rolled duplex stainless steels. Int. J. Fatigue 2003, 25, 481–488. [Google Scholar] [CrossRef]
  29. Vázquez, L.; Rodríguez, N.; Rodríguez, I.; Alberdi, E.; Álvarez, P. Influence of interpass cooling conditions on microstructure and tensile properties of Ti-6Al-4V parts manufactured by WAAM. Weld. World 2020, 64, 1377–1388. [Google Scholar] [CrossRef]
  30. Aldalur, E.; Suáreza, A.; Veiga, F. Metal transfer modes for Wire Arc Additive Manufacturing Al-Mg alloys: Influence of heat input in microstructure and porosity. J. Mater. Process. Technol. 2021, 297, 117271. [Google Scholar] [CrossRef]
  31. Liu, Y.; Mahadevan, S. Threshold stress intensity factor and crack growthrate prediction under mixed-mode loading. Eng. Fract. Mech. 2007, 74, 332–345. [Google Scholar] [CrossRef]
Figure 1. A typical WAAM equipment configuration using a robotic arm and a positioner table, and a WAAM bead layering in process (published with permission of AML3D Ltd., Adelaide, Australia).
Metals 12 01548 g001
Figure 2. A test wall produced by WAAM using an ER2594 super duplex wire, 450 mm × 230 mm × 23 mm thick. White specimens indicated the fatigue specimens, and tensile specimens are shown in black.
Metals 12 01548 g002
Figure 3. Fatigue test specimen dimensions.
Metals 12 01548 g003
Figure 4. Microstructures of longitudinal (left) and transverse (right) layered directions showing ferrite volume fraction of ~36%.
Metals 12 01548 g004
Figure 5. Micro-CT 3D reconstruction (18 µm/voxel) of specimen. Cylinder specimen dimensions: 20 mm × 10 mm (length × diameter), red volumes indicate manufacturing defects identified as porosity. X direction represents the longitudinal bead layering direction, Y represents the transverse bead direction.
Metals 12 01548 g005
Figure 6. Micro-CT 3D reconstruction (18 µm/voxel) specimens 21T6 (left) and 21T5 (right). Red and green volumes indicate internal defects identified as intermittent porosity. Pore diameters were found to be 130 ± 59 μm (average ± SD) and 206 ± 94 μm, respectively. X direction represents the longitudinal bead layering direction, Y represents the transverse bead direction.
Metals 12 01548 g006
Figure 7. The maximum stress loads σ a of WAAM fatigue specimens in the longitudinal direction versus the number of cycles to failure N f compared with the values for SAF 2507 and SAF 2205 [5]. Unfilled plotted points represent fatigue specimens that did not fail. Squares correspond to the interpass temperature of 150 °C and rhombus represent results of fatigue testing for the interpass temperature of 100 °C or increased cooling time.
Metals 12 01548 g007
Figure 8. The maximum stress loads σ a of WAAM ER2594 specimens in transverse direction versus the number of cycles to failure N f compared with the values for SAF 2205 and SAF 2507 [5]. Unfilled plotted points represent fatigue specimens that did not fail. Squares correspond to the interpass temperature of 150 °C and rhombus represent results of fatigue testing for the interpass temperature of 100 °C or increased cooling time.
Metals 12 01548 g008
Table 1. Chemical composition of the ER2594 wire (wt.%).
CMnWSiCrNiMoNCuFe
0.0140.57<0.010.3225.369.223.990.250.08Balance
Table 2. Summary of WAAM fabrication parameters.
ParameterTest Wall 1 [16]Test Wall 2
Droplet Transfer ModeCMT
Contact Tip-to-Work Distance (CTWD)15.0 mm
Wire Diameter1.2 mm
Shielding Gas80% Ar + 20% CO2
Flow Rate20 L/min
Interpass Temperature150 °C100 °C
Wire-Feed Speed (WFS)9.0 m/min
Travel Speed (TS)0.6 m/min
WFS/TS15
Layer Height (LH)2.5 mm
Arc Energy0.91–0.93 kJ/mm
Table 3. Fatigue data results for all test specimens.
Specimen IDσa, MPaNfResultSpecimen IDσa, MPaNfResult
LongitudinalTransverse
TEST WALL 1 [16]27L4295850,000fractured27T4174309,230fractured
27L3300154,003fractured27T2175699,281fractured
27L53001,010,003fractured26T3200367,721fractured
27L6323585,003fractured27T3202578,550fractured
26L4325250,000fractured26T4250250,523fractured
26L6350440,000fractured26T1250270,000fractured
26L7350857,000fractured27T1300281,021fractured
26L1400150,000fractured26T635037,854fractured
27L13021,960,000not failed26T535060,000fractured
27L23231,900,995not failed26T240058,358fractured
26L23251,650,000not failed27T61741,620,104not failed
26L33502,120,000not failed27T51762,026,499fractured
TEST WALL 221L4350286,942fractured21T12001,239,003fractured
21L23251,173,042fractured21T3225608,046fractured
21L33501,604,058not failed21T62501,033,327fractured
21L13252,496,604not failed21T7250395,488fractured
21T8275154,172fractured
21T22252,444,000not failed
21T42252,493,647not failed
21T52502,567,136not failed
Publisher’s Note: MDPI stays neutral with regard to jurisdictional claims in published maps and institutional affiliations.

