Article

Thermodynamic Properties and Equation of State for Solid and Liquid Aluminum

by
Nikolay V. Kozyrev
* and
Vladimir V. Gordeev
Laboratory for Physicochemical Fundamentals of Energetic Condensed Systems, Institute for Problems of Chemical and Energetic Technologies, Siberian Branch of the Russian Academy of Sciences (IPCET SB RAS), 659322 Biysk, Russia
*
Author to whom correspondence should be addressed.
Metals 2022, 12(8), 1346; https://doi.org/10.3390/met12081346
Submission received: 15 July 2022 / Revised: 8 August 2022 / Accepted: 9 August 2022 / Published: 13 August 2022
(This article belongs to the Special Issue Thermomechanical Treatment of Metals and Alloys)

Abstract

:
High-temperature equations of state for solid and liquid aluminum were constructed herein using experimental data on thermodynamic properties, thermal expansion, compressibility, bulk modulus and sound velocity measurements, supplemented with phase diagram data (melting curve). The entire set of experimental data was optimized using the temperature-dependent Tait equation over a pressure range of up to 800 kbar and over a temperature range from 20 K to the melting point for solid aluminum and to 3800 K for liquid aluminum. The temperature dependence of thermodynamic and thermophysical parameters was described by an expanded Einstein model. The resultant equations of state describe well the totality of experimental data within measurement errors of individual variables.

1. Introduction

Thermodynamic and thermophysical properties of aluminum are the subject of numerous experimental and theoretical studies. Aluminum has a face-centered cubic (fcc) lattice under normal conditions and transits to a hexagonal close-packed (hcp) structure at a pressure of 2170 ± 10 kbar [1].
Aluminum and its alloys are commonly used in various fields of science and technology. A knowledge of the equation of state (EoS) is required to describe the aluminum behavior adequately and simulate Al-based composites over a wide pressure and temperature range. The currently available data on solid aluminum are limited either by isothermal compression at room temperature or by thermal expansion and elastic moduli measurements at normal pressure. Outside the thermodynamic parameters, only temperature-dependent density and sound velocity have been measured for liquid aluminum, with compressibility data lacking. The equations of state for solid and liquid phases suggested by Baker [2] using empirical power-law equations are not quite accurate in describing the thermal expansion and compressibility of both phases over a wide range of varying pressures and temperatures. That being the case, the way how the equation of state for liquid aluminum had been built was not reported. In this regard, it is worth noting that the existing experimental data for liquid aluminum are not enough for constructing a correct equation of state. However, using a pressure dependence of the melting point allows for an additional limitation on the liquid phase properties, as the chemical potentials of the solid and liquid phases at the point of melting are equal. In that case, an equation of state for the liquid phase can be derived by simultaneously co-processing all the thermodynamic and thermophysical experimental data for both phases. Such an approach offers extra merits. First, it permits thermodynamic and thermophysical data to be mutually agreed for each phase isolatedly and for both phases at a time. Second, it can soundly expand the equation of state for the solid phase towards higher pressures and temperatures, at least through to the highest measured melting point in the phase diagram. Third, it can predict the liquid phase compressibility up to a maximum measured pressure in the melting curve.
It should be noted that finding equations of state by simultaneously co-processing the totality of thermodynamic and thermophysical data for a few phases with a melting curve involved is a challenging task. For instance, the study [3] failed to derive a realistic melting curve for aluminum based on the equality of chemical potentials of the distinct phases. The melting curve calculated in the study [2] at pressures of up to 350 kbar reproduces the experimental data quite inaccurately.
In our previous study [4], the aforesaid approach was employed to find equations of state for solid and liquid lead; however, the pressure range examined was confined to a pressure of 130 kbar (the existence domain of the fcc lead).
Therefore, it is of interest to explore if the said approach can be used for greater pressures. To this end, we chose aluminum whose properties have widely been studied in detail and melting curve measured at pressures up to ~800 kbar [5].

2. Physicochemical Model

Given the recommendations of Chase et al. [6], the thermodynamic variables were optimized herein by using an expanded Einstein model with a multiple function similar to that reported by Voronin et al. [7]. As stated by Jacobson and Stoupin [8], experimental data for a wide array of materials are fitted well by such a functional form with a varied number of terms.

2.1. Thermodynamic Functions

A trinomial Einstein equation with a correction power extra to take account of anharmonic effects was used herein to describe thermodynamic properties of solid aluminum in standard state. The thermodynamic functions of solid aluminum at zero pressure were adopted in the form:
H T H 0 = i = 1 3 Y i θ i exp θ i / T i 1 + h T m
C P = d H T d T = i = 1 3 θ i T 2 Y i exp θ i / T exp θ i / T 1 2 + m h A T m 1
S = Δ S 0 + i = 1 3 Y i θ i T exp θ i / T exp θ i / T 1 ln exp θ i / T 1 + m m 1 h T m 1
where T is the absolute temperature, H is the enthalpy, CP is the isobaric heat capacity, S is the entropy, Yi, θi, h and m are the constants, and ΔS0 is the integration constant.
The heat capacity of liquid aluminum in accord with different literature sources is invariable over a wide temperature range, starting from the melting point [9,10,11,12,13,14]. Therefore, the thermodynamic functions of liquid aluminum were adopted in the following form:
H T H 0 = a T + b
C P = a
S = a ln T + Δ S 0
where a, b and ΔS0 are the constants.
The molar Gibbs free energy (chemical potential μ°) is defined by the common relation:
G m μ = [ H T H 0 ] T S

2.2. Molar Volume

The Tait equation was employed to describe the pressure-dependent molar volume of solid and liquid aluminum [15,16]. The density data for solid and liquid substances are fitted well by this equation at pressures up to a few GPa [16]. The present study adopted the following high-temperature form of the Tait equation:
P = B T n 0 + 1 { exp [ ( n 0 + 1 ) ( 1 V V T ) ] 1 }
where P is the pressure, V is the volume, VT and BT are the molar volume and the bulk modulus at zero pressure and temperature T, respectively, and n0 is the pressure derivative of the bulk modulus. The temperature effect on molar volume V was described via temperature-dependences VT and BT.
The temperature-dependent molar volume of solid and liquid aluminum was described by different equations. To describe the thermal expansion of solid aluminum over a wide temperature range, a dependence similar to that for enthalpy (Equation (1)) was used:
ln ( V T S V 0 S ) = i = 1 3 X i Θ i exp ( Θ i / T i ) 1 + g T k
where VTS and V0S are the molar volumes at zero pressure and temperatures T and T = 0, respectively, and Xi, Θi, g and k are the constants.
An inverse cubic function was employed to describe the temperature-dependent molar volume of liquid aluminum:
V T L = V 0 L 1 + A 1 T + A 2 T 2 + A 3 T 3
where V0L is the “hypothetical” molar volume of liquid aluminum at zero temperature and zero pressure, and A1, A2 and A3 are the constants.
Here, the melting point of aluminum at ambient pressure was assumed equal to 933.473 K [17].

2.3. Isothermal Bulk Modulus

The temperature-dependent isothermal bulk modulus of both solid and liquid aluminum was described by a function suggested by Deffrennes [18] for the estimation of isothermal compressibility:
K T = K 0 + C i a i exp ( θ i T ) 1
where KT and K0 are the isothermal compressibility coefficients at temperatures T and 0 K, respectively; C and αi are the constants contingent on the substance type. This equation was inverted to acquire the bulk modulus, and the analysis showed two terms in summation to be enough for an adequate description of experimental data. The expression in its final form is written as:
B T = B 0 1 + i = 1 2 s i exp ( ω i / T ) 1
where BT and B0 are the bulk moduli at temperatures T and 0 K, respectively; wi and si are the constants. The advantage of this equation over the inverse quadratic dependence normally used [19] is that it adequately describes the measured data at low temperatures. Besides, this equation guarantees the modulus to be non-negative at very high temperatures.

2.4. Melting Curve

The molar Gibbs free energies (chemical potential) for solid (μS) and liquid (μL) phases in the melting plot must be equal [20]:
μ S = μ L
The isothermal variation in the chemical potential as the pressure changes is defined by the adopted equation of state and can be found via the relation [20]:
μ μ = P P V d P
where μ and μ° are the chemical potentials at pressure P and reference pressure , respectively. That variation is found by integration of Equation (8). The melting point at each pressure is estimated by simultaneous solution of Equations (7), (13) and (14) for solid and liquid phases.

3. Selected Experimental Data

3.1. Thermodynamic Properties

The thermodynamic properties of solid and liquid aluminum were overviewed in several reference books and review papers (Table 1).
The heat capacity values at a temperature up to 300 K are well consistent with each other within 1%. The highest data scatter is observed at the melting temperature when the deviation relative to the data reported in [13] attains ±3.4%. It is worth noting that the reference book data [10] at temperatures above 300 K are based on the earlier work [9]. The thermodynamic functions of aluminum quoted in the studies [13,21] are almost coincident and on par with those reported in [11] within 0.5%.
According to all of the studies, the heat capacity of liquid aluminum at temperatures higher than the melting one is invariable and corresponds to the values listed in Table 1. The data are in good agreement with each other, except for the study reported in [14]. The heat capacity mean for liquid aluminum is 31.752 ± 0.004 J/(mol∙K) according to the quoted studies (with disregard of [14]). Here, for liquid aluminum, we used the data from [13,21].

3.2. Thermodynamic Properties of Solid Aluminum

The experimental data on thermal expansion, isothermal compressibility and adiabatic bulk modulus were employed herein to construct an equation of state for solid aluminum. The isothermal bulk modulus included in the equation of state is defined by the common relation [22]:
B T = ( 1 B S + T V α 2 C P )
where BS is the adiabatic bulk modulus and α is the volumetric thermal expansion coefficient.

3.2.1. Molar Volume

Given that some studies report relative values of sample length or size rather than the absolute ones, it is required that a reference value be set for the molar volume of aluminum at standard temperature. Here, the molar volume of 9.996 ± 0.001 cm3/mol (2.6992 g/cm3 density) at 293.15 K, as calculated by Ablaster [23] who critically evaluated 46 experimental measurements from different literature sources, was taken as the reference value. The recalculation using the same thermal expansion coefficient as in [23] furnished a molar volume of 9.999 ± 0.001 cm3/mol at standard temperature (298.15 K).

3.2.2. Thermal Expansion

An exhaustive literature overview and data treatment are provided in the studies reported in [23,24,25], wherein nearly all the references (more than 70) pertaining to the thermal expansion of solid aluminum can be found. The data on the thermal expansion coefficient given in those studies considerably differ between each other. The difference comes up to 6.5% in the low-temperature domain (50 K) and then declines to 1.2% at room temperature, and further rises again to reach 5.1% at 900 K. It should be noted herewith that the temperature-dependent molar volume data agree very well. The maximum difference is not in excess of 0.05% over the entire temperature range between 0 K and the melting point. Therefore, solely the molar volume data [23] were used herein, with the thermal expansion coefficient data left out of the optimization.

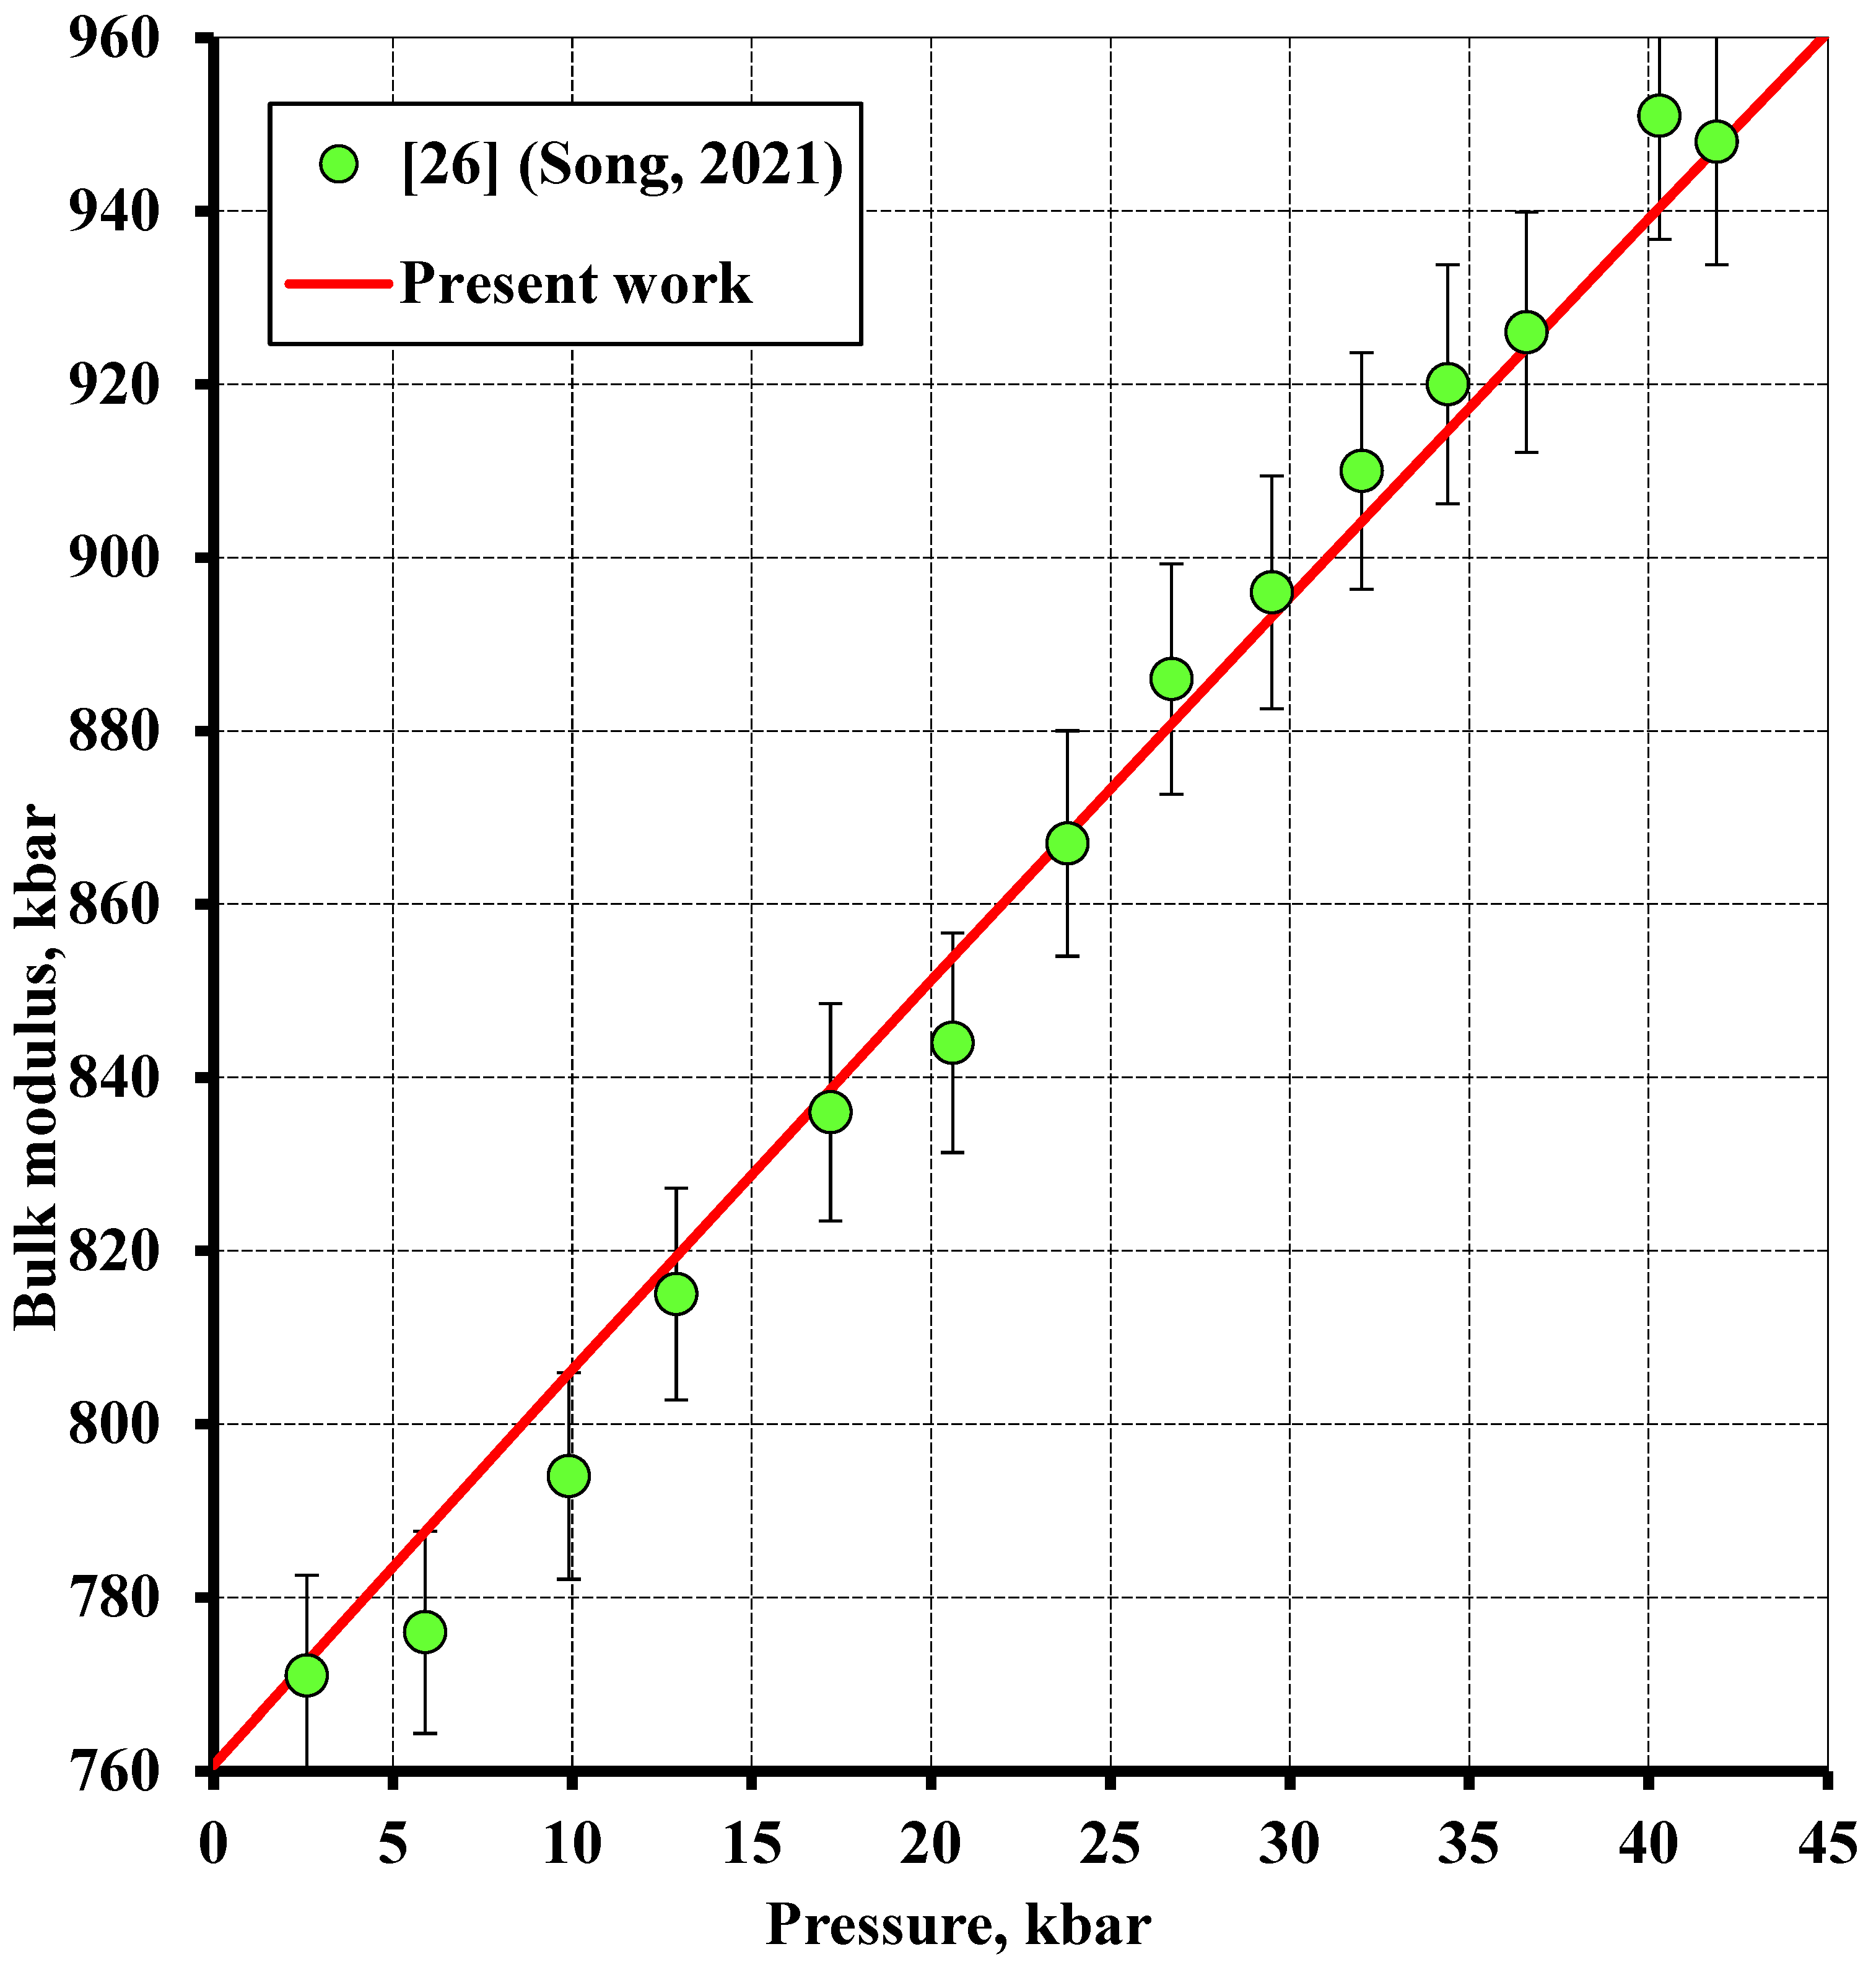
3.2.3. Isothermal Compressibility

The isothermal compressibility of aluminum under static compression at room temperature has experimentally been explored at pressures up to 41.9 kbar [26], 45 kbar [27], 70 kbar [28], 120 kbar [29], 200 kbar [30], 493 kbar [31], 1530 kbar [32], 2200 kbar [33], 2220 kbar [34], 3330 kbar [1] and 3680 kbar [35]. A fairly great spread of the data from different authors bears mention. For instance, in line with Greene et al. [33] and Akahama et al. [1], the same compression ratio of V/V0 = 6.0 is achieved at pressures that differ by more than 8%, even despite the fact that both of the studies employed the same pressure calibration against the equation of state for platinum [36].
A series of studies were focused on estimating the normal isotherm of aluminum by restoring the shock-wave data at pressures up to 800 kbar [37] and 4000 kbar [38].
All the abovelisted studies in the original form were used herein for calculations at pressures up to 1000 kbar, except for the study by Dewaele et al. [35], who calibrated the pressure in their own way. The data from that study were recalculated using a more precise pressure calibration [39].

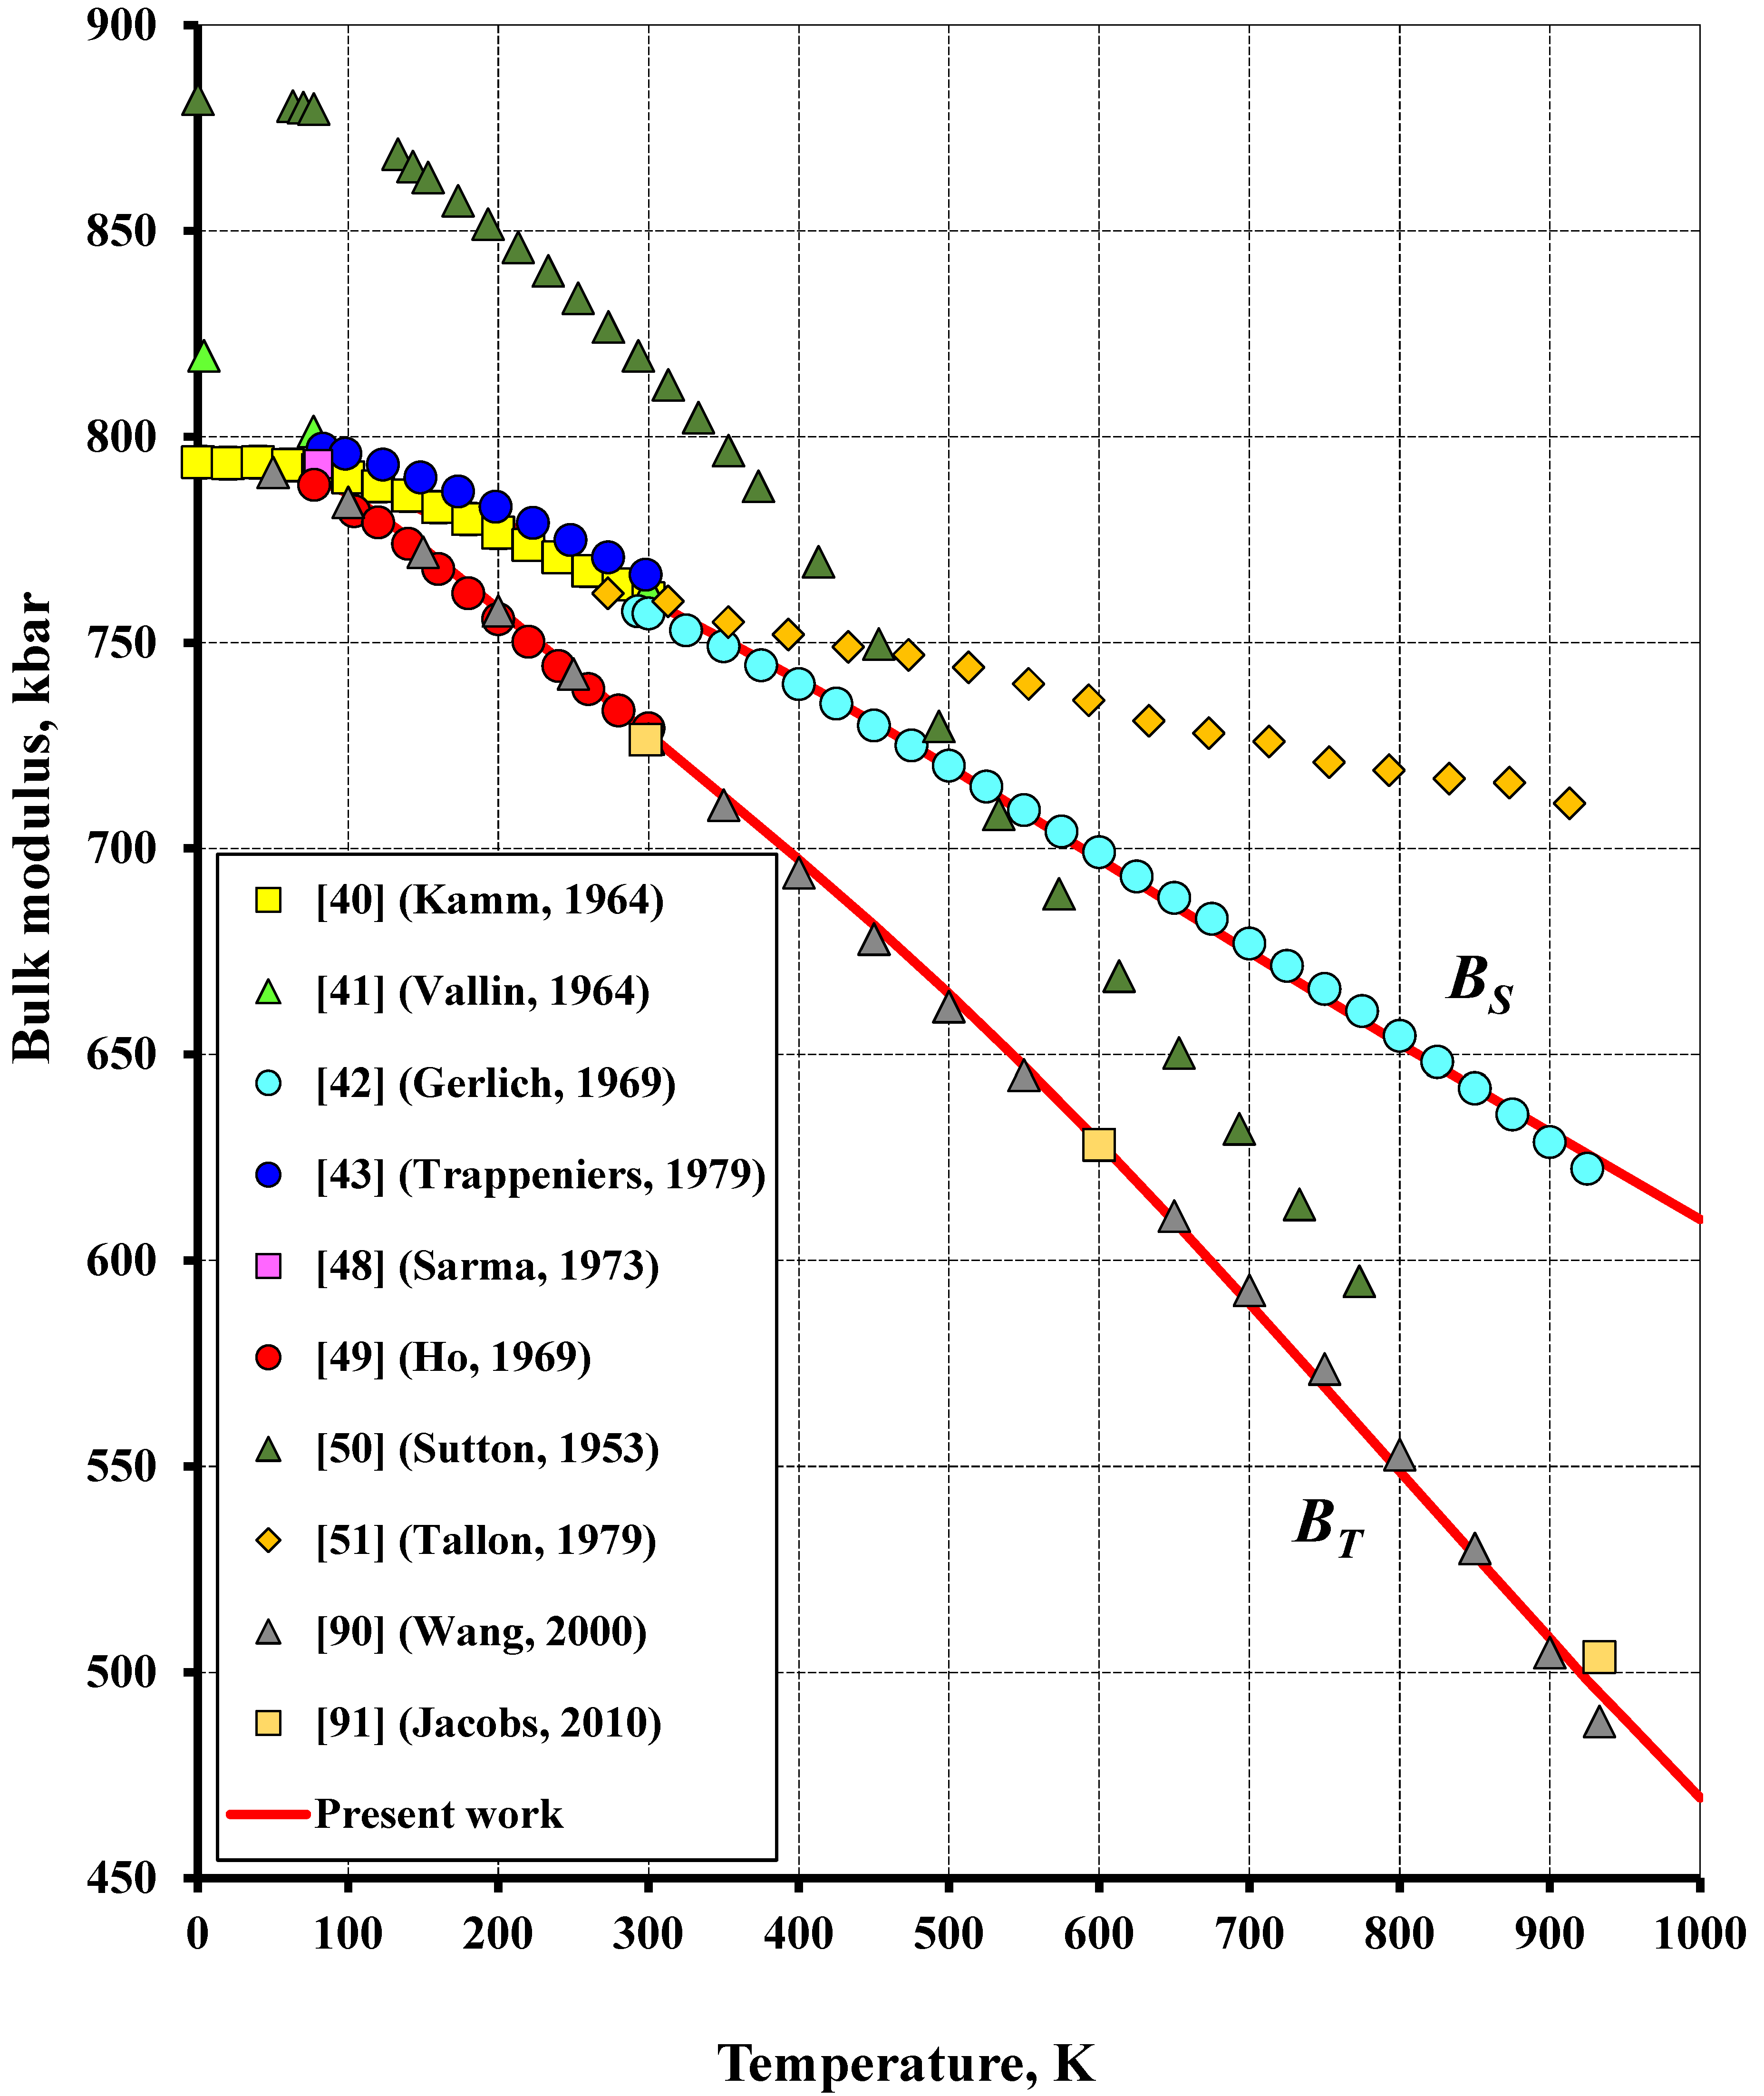
3.2.4. Adiabatic Bulk Modulus

The adiabatic bulk modulus was estimated from the elastic moduli measured over a temperature range of 4–300 K [40,41], 293–925 K [42] and 83–298.15 K [43]. Some studies performed measurements at room temperature only [44,45,46,47] and at 80 K [48]. Ho and Ruoff [49] estimated the isothermal bulk modulus using the elastic moduli measured at between 77 and 300 K. The data from all the studies agree well with each other. The adiabatic bulk modulus mean at 300 K calculated from all the measurement data is 762.0 ± 8.0 kbar (±1.0%). Sutton [50], and Tallon and Wolfenden [51], performed measurements over a wide temperature range of 63–773 K and 273–913 K, respectively. However, the reported data considerably differ from those of the other authors and were disregarded in the calculation. Apart from the said studies, the results from pressure-dependent adiabatic bulk modulus measurements in a range of 2.6–41.9 kbar were also factored in when performing the optimization herein.

3.3. Thermophysical Properties of Liquid Aluminum

There are no directly measured data on isothermal compressibility and bulk modulus of liquid aluminum in the literature. Therefore, we used measurement results of thermal expansion and sound velocity. The adiabatic bulk modulus was calculated by the common relation [52]:
B S V ( d P d V ) S = ρ u S 2
where ρ is the density and us is the sound velocity. The isothermal bulk modulus included in the equation of state was estimated by Equation (15).

3.3.1. Thermal Expansion

The studies on thermal expansion of liquid aluminum were reviewed in [53,54]. In both papers, a linear temperature-dependence of density was used. However, these review papers left aside most of the literature sources numbering more than 40. Therefore, we performed a critical overview and selected the most reliable studies that are listed in Table 2.
The average density of liquid aluminum at the melting temperature, calculated from all the measured data, was 2.375 ± 0.005 g/cm3.

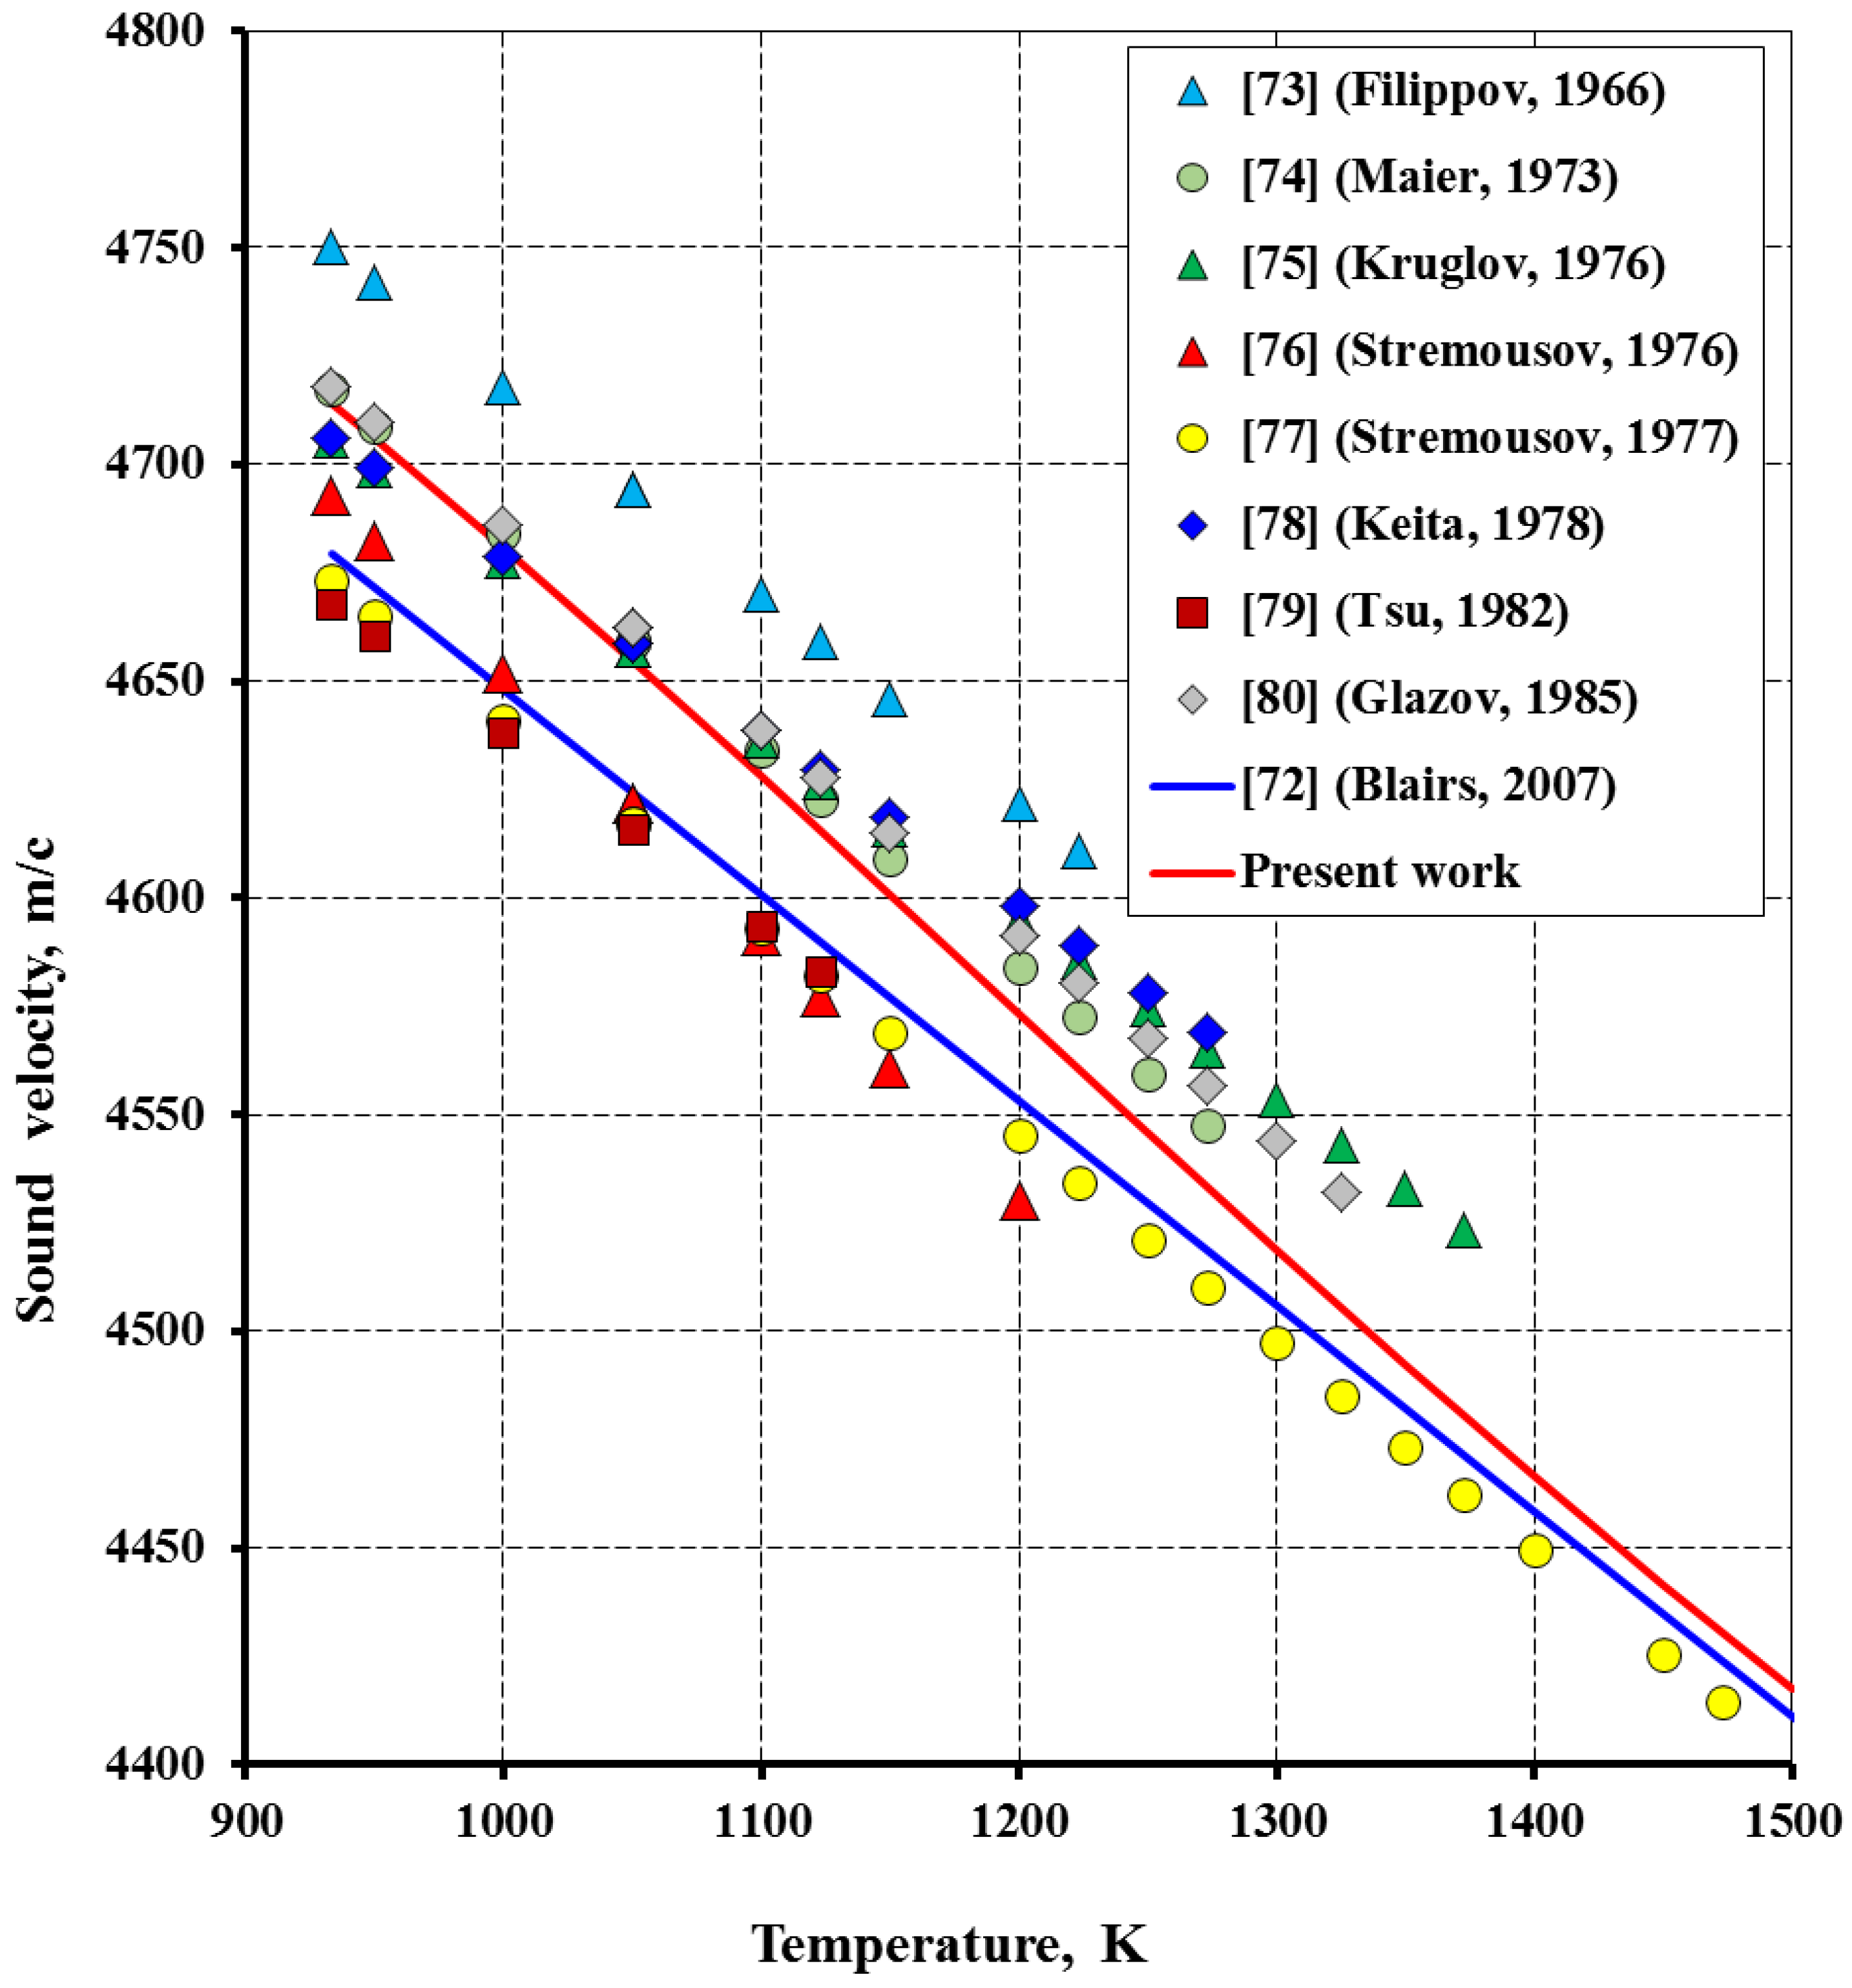
3.3.2. Sound Velocity

The studies on sound velocity measurements in liquid aluminum were reviewed by Blairs [72]. Here, we employed the sound velocity measurement results reported in [73,74,75,76,77,78,79,80].

3.4. Melting Curve

The aluminum melting curve has experimentally been examined at pressures up to 14 kbar [81], 50 kbar [22], 100 kbar [82], 493 kbar [31] and 770 kbar [5]. Hanstrom [31] fitted experimental data by the Simons formula [83].
The aluminum melting curve was theoretically modelled by different techniques in a range of studies. In most studies, the estimated data were only represented graphically. References to the theoretical studies can be found elsewhere [84,85,86,87], where the melting curve was modelled at pressures not above 2000–5000 kbar, and the calculation results were tabulated [84] or fitted by the Simons formula [85,86,87].

4. Calculation Procedure

The error function representing a weighted root-mean-square deviation was adopted as an optimization criterion:
R = 1 N [ i = 1 N w i 2 ( D i c D i m D i m ) 2 ]
where N is the total number of experimental points; Di is the values of different parameters (enthalpy, heat capacity, molar volume, etc.); and wi is the weighting coefficients of these parameters. Indices c and m are the calculated and measured properties, respectively. The weighting coefficients were evaluated using relative measurement errors of different parameters. At each specified (experimental) pressure, a temperature at which the given chemical potentials (chemical potential divided by temperature) of solid and liquid phases differed at most by 10–8 J/(mol·K) was taken as the melting one.
The function was minimized via the Nelder–Mead simplex method for multidimensional minimization [88].

5. Results and Discussion

All the parameters resulted from the optimization are summarized in Table 3 for solid aluminum and in Table 4 for liquid aluminum. A comparison with the measured data is displayed in Figure 1, Figure 2, Figure 3, Figure 4, Figure 5, Figure 6, Figure 7 and Figure 8.
Figure 1 compares the calculated heat capacity of solid aluminum with that from the other literature sources. The dependence obtained herein approximates well the data reported in [21]. The average root-mean-square (RMS) deviation between the calculated and measured data over a temperature range between 20 K and the melting point was 0.7%. The deviations were lower for the enthalpy: RMS = 0.25% for the entire temperature range.
Figure 2 depicts the molar volume of solid aluminum plotted against temperature. The experimental data are fitted well by the calculated dependence. The mean absolute deviation was 0.0017 cm3/mol (RMS = 0.022%). The calculated molar volume at 298.15 K was 9.999 cm3/mol and is not different from the reference value. At 0 K, the calculated molar volume of 9.871 cm3/mol is distinct by 0.02% from that reported in [89].
Figure 3 illustrates the molar volume of aluminum plotted against pressures up to 1000 kbar. The experimental points totaled 113. The mean absolute deviation between the calculation and experiment over the entire pressure range was 0.018 cm3/mol, RMS = 0.30%. Table 5 compares the Tait equation of state parameters obtained herein with those from the literature. The calculated isothermal bulk modulus at 298.15 K was 728.6 kbar and is on par with the literature data listed in Table 5.
The bulk modulus of solid aluminum is plotted against temperature in Figure 4 and against pressure in Figure 5. The temperature dependence of adiabatic bulk modulus obtained herein reproduces the experimental data [40,42,43] within a measurement error. The calculated isothermal bulk modulus almost matches the data from [49] and is well consistent with the calculation results reported in [90,91]. The pressure dependence of adiabatic bulk modulus is in agreement with the experiment [26] within a measurement error (Figure 5).
The temperature-dependent density of liquid aluminum is depicted in Figure 6. The calculated density of 2.373 g/cm3 for liquid aluminum at the melting temperature is different by 0.08% from the experimental average.
The sound velocity in liquid aluminum as a function of temperature is shown in Figure 7. The deviation between the calculated sound velocities and the data reported in [72] is 0.7% at the melting temperature and diminishes to 0.15% at 1500 K.
The aluminum melting curve calculated in the present study is compared with the experimental and theoretical data in Figure 8. The calculated curve reproduces the measured data within an error and is well consistent with the theoretical modelling results reported in [85,86]. The calculated curves lie below the experimental data. The calculated temperature at a pressure of 0.1 MPa is 933.470 K and is almost coincident with the measured value of 933.773 K [17].

6. Conclusions

The findings from this study demonstrate that the model used herein enables the description of experimental data for solid and liquid aluminum over a wide pressure and temperature range within an experimental error of measurement. That said, the thermodynamic and thermophysical variables for solid aluminum have been mutually agreed with each other by using common thermodynamic relations over a pressure range up to 800 kbar and over a temperature range from 10 K to the melting point. An equation of state for liquid aluminum has been constructed that can be used to predict the aluminum behavior at temperatures up to 3800 K in the specified pressure range. Moreover, all the thermodynamic and thermophysical parameters of solid and liquid aluminum have been harmonized with each other through the use of the melting curve in the co-optimization. The prediction accuracy can be enhanced and the applicability limits of the equations of state constructed against pressure and temperature can be broadened considerably by refining and expanding the melt curve data.

Author Contributions

Conceptualization, investigation, software, writing—original draft preparation, writing—review and editing, supervision: N.V.K.; investigation: V.V.G. All authors have read and agreed to the published version of the manuscript.

Funding

This research was supported by the Ministry of Science and Higher Education of the Russian Federation (under agreement No. 075-15-2020-803 with the Zelinsky Institute of Organic Chemistry RAS).

Institutional Review Board Statement

Not applicable.

Informed Consent Statement

Not applicable.

Data Availability Statement

The data that support the findings of this study are available from the corresponding author upon reasonable request.

Conflicts of Interest

The authors declare no conflict of interest.

References

  1. Akahama, Y.; Nishimura, M.; Kinoshita, K.; Kawamura, H.; Ohishi, Y. Evidence of a fcc-hcp Transition in Aluminum at Multimegabar Pressure. Phys. Rev. Lett. 2006, 96, 045505. [Google Scholar] [CrossRef]
  2. Baker, E.L.; Capellos, C.; Stiel, L. JAGUAR Procedures for Detonation Properties of Aluminized Explosives. In Proceedings of the 12th International Symposium on Detonation, San Diego, CA, USA, 11–16 August 2002; pp. 195–202. [Google Scholar]
  3. Baker, E.L.; Stiel, L.I. JAGUAR Calculations of Detonation Properties for Aluminized Explosives. In Proceedings of the Insensitive Munitions & Energetic Materials Technology Symposium, San Antonio, TX, USA, 27–30 November 2000; pp. 265–272. [Google Scholar]
  4. Kozyrev, N.V.; Gordeev, V.V. Thermodynamic characterization and equation of state for solid and liquid lead. Metals 2022, 12, 16. [Google Scholar] [CrossRef]
  5. Boehler, R.; Ross, M. Melting curve of aluminum in a diamond cell to 0.8 Mbar: Implications for iron. Earth Planet. Sci. Lett. 1997, 153, 223–227. [Google Scholar] [CrossRef]
  6. Chase, M.W.; Ansara, I.; Dinsdale, A.; Eriksson, G.; Grimvall, G.; Hoglund, H.; Yokokawa, H. Group 1: Heat capacity models for crystalline phases from 0 K to 6000 K. CALPHAD 1995, 19, 437–447. [Google Scholar]
  7. Voronin, G.F.; Kutsenok, I.B. Universal method for approximating the standard thermodynamic functions of solids. J. Chem. Eng. Data 2013, 58, 2083–2094. [Google Scholar] [CrossRef]
  8. Jacobson, P.; Stoupin, S. Thermal expansion coefficient of diamond in a wide temperature range. Diam. Relat. Mat. 2019, 97, 107469. [Google Scholar] [CrossRef]
  9. Buyco, E.H.; Davis, F.E. Specific heat of aluminum from zero to its melting temperature and beyond. J. Chem. Eng. Data 1970, 15, 518–523. [Google Scholar] [CrossRef]
  10. Glushko, V. Termodinamicheskie Svoistva Individual’nykh Veshchestv [Thermodynamic Properties of Individual Substances], 3rd ed.; Nauka: Moscow, Russia, 1981; Volume 3, Book 2. (In Russian) [Google Scholar]
  11. Desai, P.D. Thermodynamic properties of aluminum. Int. J. Thermophys. 1987, 8, 621–638. [Google Scholar] [CrossRef]
  12. Barin, I. Thermochemical Data of Pure Substances, 3rd ed.; VCH Verlagsgesellschaft mbH: Weinheim, Germany, 1995. [Google Scholar]
  13. Chase, M.W. NIST-JANAF Thermochemical Tables, 4th ed.; In Journal of physical and chemical reference data, American Chemical Society: Washington, DC, USA, 1998; Volume 9, pp. 1–1951. [Google Scholar]
  14. Mills, K.C. Recommended Values of Thermophysical Properties for Selected Commercial Alloys; Woodhead Publishing Ltd.: Cambridge, UK, 2002. [Google Scholar]
  15. MacDonald, J.R. Review of some experimental and analytical equations of state. Rev. Modern Phys. 1969, 41, 316–349. [Google Scholar] [CrossRef]
  16. Dymond, J.H.; Malhotra, R. The Tait equation: 100 years on. Int. J. Thermophys. 1988, 9, 941–951. [Google Scholar] [CrossRef]
  17. Preston-Thomas, H. The international temperature scale of 1990 (ITS-90). Metrologia 1990, 27, 3–10. [Google Scholar] [CrossRef]
  18. Deffrennes, G.; Oudot, B. A self-consistent model to describe the temperature dependence of the bulk modulus, thermal expansion and molar volume compatible with 3rd generation CALPHAD databases. Calphad 2021, 74, 102291. [Google Scholar] [CrossRef]
  19. Dinsdale, A.T. SGTE data for pure substances. Calphad 1991, 15, 317–425. [Google Scholar] [CrossRef]
  20. Chang, Y.; Oates, W. Materials Thermodynamics; Wiley Series on Processing of Engineering Materials; Wiley: New York, NY, USA, 2010. [Google Scholar]
  21. Ditmars, D.A.; Plint, C.A.; Shukla, R.C. Aluminum. I. Measurement of the relative enthalpy from 273 to 929 K and derivation of thermodynamic functions for Al(s) from 0 K to its melting point. Int. J. Thermophys. 1985, 6, 499–515. [Google Scholar] [CrossRef]
  22. Grigoriev, I.S.; Meilikhov, E.Z. Handbook of Physical Quantities; CRC Press: Boca Raton, FL, USA, 1996. [Google Scholar]
  23. Ablaster, J.W. Selected Values of the Crystallographic Properties of the Elements; Materials Park-ASM International: Cleveland, OH, USA, 2018. [Google Scholar]
  24. Touloukian, Y.S.; Kirby, R.K.; Taylor, R.E.; Desai, P.D. Thermal Expansion Metallic Elements and Alloys. In Thermophysical Properties of Matter; The TPRC Data Series; IFI/Plenum: New York, NY, USA, 1975. [Google Scholar]
  25. Nakashima, P.N.H. The Crystallography of Aluminum and Its alloys. In Encyclopedia of Aluminum and Its Alloys; Totten, G.E., Tiryakioğlu, M., Kessler, O., Eds.; CRC Press: Boca Raton, FL, USA, 2018; pp. 488–586. [Google Scholar]
  26. Song, W.; Tang, Q.; Su, C.; Chen, X.; Liu, Y. Ultrasonic experimental study on the elasticity of aluminum to 4.1 GPa in multi-anvil apparatus. Physica B 2021, 609, 412891. [Google Scholar] [CrossRef]
  27. Vaidya, S.N.; Kennedy, G.C. Compressibility of 18 metals to 45 kbar. J. Phys. Chem. Solids 1970, 31, 2329–2345. [Google Scholar]
  28. Senoo, M.; Mii, H.H.; Fujishiro, I. Lattice compression of Al in hydrostatic environment up to 70 kbar. Jpn. J. Appl. Phys. 1976, 15, 1617–1618. [Google Scholar] [CrossRef]
  29. Syassen, K.; Holzapfel, W.B. Isothermal compression of Al and Ag to 120 kbar. J. Appl. Phys. 1978, 49, 4427–4430. [Google Scholar] [CrossRef]
  30. Ming, L.C.; Xiong, D.; Manghnani, M.H. Isothermal compression of Au and Al to 20 GPa. Physica B C 1986, 139–140, 174–176. [Google Scholar] [CrossRef]
  31. Hanstrom, A.; Lazor, P. High pressure melting and equation of state of aluminium. J. Alloy. Compd. 2000, 305, 209–215. [Google Scholar] [CrossRef]
  32. Dewaele, A.; Loubeyre, P.; Mezouar, M. Equations of state of six metals above 94 GPa. Phys. Rev. B 2004, 70, 094112. [Google Scholar] [CrossRef]
  33. Greene, R.G.; Luo, H.H.; Ruoff, A.L. Al as a simple solid: High-pressure study to 220 GPa (2.2 Mbar). Phys. Rev. Lett. 1994, 73, 2075–2078. [Google Scholar] [CrossRef] [PubMed]
  34. Nishimura, N.; Kinoshita, K.; Akahama, Y.; Kawamura, H. Volume Compression of Mg and Al to Multimegabar Pressure. In Proceedings of the 20th AIRAPT International Conference. Mineralogical Soc. America, Karlsruhe, Germany, 27 June–1 July 2005; T10–P054. p. 278. Available online: http://www.airapt.org/proceedings/Karlsruhe-2005/html/book-of-abstracts.pdf (accessed on 15 July 2022).
  35. Dewaele, A.; Loubeyre, P.; Occelli, F.; Marie, O.; Mezouar, M. Toroidal diamond anvil cell for detailed measurements under extreme static pressures. Nat. Commun. 2018, 9, 2913. [Google Scholar] [CrossRef] [PubMed]
  36. Holmes, N.C.; Moriarty, J.A.; Gathers, R.G.; Nellis, W.J. The equation of state of platinum to 660 GPa (6.6 Mbar). J. Appl. Phys. 1989, 66, 2962–2967. [Google Scholar] [CrossRef]
  37. Gray, D.E. American Institute of Physics Handbook, 3rd ed.; McGraw-Hill: New York, NY, USA, 1972. [Google Scholar]
  38. Al’tshuler, L.V.; Brusnikin, S.E.; Kuz’menkov, E.A. Isotherms and Gruneisen functions for 25 metals. J. Appl. Mech. Tech. Phys. 1987, 28, 129–141. [Google Scholar] [CrossRef]
  39. Dorogokupets, P.I.; Oganov, A.R. Ruby, metals, and MgO as alternative pressure scales: A semiempirical description of shockwave, ultrasonic, x-ray, and thermochemical data at high temperatures and pressures. Phys. Rev. B 2007, 75, 024115. [Google Scholar] [CrossRef]
  40. Kamm, G.N.; Alers, G.A. Low temperature elastic moduli of aluminum. J. Appl. Phys. 1964, 35, 327–330. [Google Scholar] [CrossRef]
  41. Vallin, J.; Mongy, M.; Salama, K.; Beckman, O. Elastic constants of aluminum. J. Appl. Phys. 1964, 35, 1825–1826. [Google Scholar] [CrossRef]
  42. Gerlich, D.; Fisher, E.S. The high temperature elastic moduli of aluminum. J. Phys. Chem. Solids 1969, 30, 1197–1205. [Google Scholar] [CrossRef]
  43. Trappeniers, N.J.; Klooster, P.; Biswas, S.N. Pressure effect on compressibility of aluminum single crystal from −196 to 25 °C. High Press. Sci. Technol. 1979, 1, 108–113. [Google Scholar]
  44. Lazarus, D. The variation of the adiabatic elastic constants of KC1, NaCl, CuZn, Cu, and Al with pressure to 10,000 bars. Phys. Rev. 1949, 76, 545–553. [Google Scholar] [CrossRef]
  45. Schmunk, R.E.; Smith, C.S. Pressure derivatives of the elastic constants of aluminum and magnesium. J. Phys. Chem. Solids 1959, 9, 100–112. [Google Scholar] [CrossRef]
  46. Thomas, J.F. Third order elastic constants of aluminum. Phys. Rev. 1968, 175, 955–962. [Google Scholar] [CrossRef]
  47. Du, X.; Zhao, J.C. Facile measurement of single-crystal elastic constants from polycrystalline samples. NPJ Comput. Mater. 2017, 17, 1–8. [Google Scholar] [CrossRef]
  48. Sarma, V.P.N.; Reddy, P.J. Third-order elastic constants of aluminium at 80 K. J. Phys. Chem. Solids 1973, 34, 1593–1596. [Google Scholar] [CrossRef]
  49. Ho, P.S.; Ruoff, A.L. Pressure dependence of the elastic constants for aluminum from 77 to 300 K. J. Appl. Phys. 1969, 40, 3151–3156. [Google Scholar] [CrossRef]
  50. Sutton, P.M. The variation of the elastic constants of crystalline aluminum with temperature between 63 K and 773 K. Phys. Rev. 1953, 91, 816–821. [Google Scholar] [CrossRef]
  51. Tallon, J.L.; Wolfenden, A. Temperature dependence of the elastic constants of aluminum. J. Phys. Chem. Solids 1979, 40, 831–837. [Google Scholar] [CrossRef]
  52. Kinsler, L.E.; Fray, A.R.; Coppens, A.B.; Sanders, J.V. Fundamentals of Acoustics, 4th ed.; John Wiley & Sons, Inc.: New York, NY, USA, 2000. [Google Scholar]
  53. Assael, M.J.; Kakosimoset, K.; Banish, R.M.; Brillo, J.; Egry, I.; Brooks, R.; Quested, P.N.; Mills, K.C.; Nagashima, A.; Sato, Y.Y.; et al. Reference data for the density and viscosity of liquid aluminum and liquid iron. J. Phys. Chem. Ref. Data 2006, 35, 285–300. [Google Scholar] [CrossRef]
  54. Iida, I.; Guthrie, R.I.L. The Thermophysical Properties of Metallic Liquids; Oxford University Press: Oxford, UK, 2015; Volume 2. [Google Scholar]
  55. Glazov, V.M.; Chistyakov, Y.D. On the temperature dependence of aluminum viscosity. Izvestyia Akad. Nauk. USSR. Otd. Tekhnicheskikh Nauk. 1958, 7, 141–142. (In Russian) [Google Scholar]
  56. Goltsova, E.I. Experimental density measurement of liquid aluminum up to 1500 °C. High Temp. 1965, 3, 483–486. Available online: http://www.mathnet.ru/php/archive.phtml?wshow=paper&jrnid=tvt&paperid=4140&option_lang=eng (accessed on 10 May 2022). (In Russian).
  57. Ayushina, G.D.; Levin, E.S.; Gel’d, P.V. The effects of temperature and composition of densities and surface energies of Fe-Al alloys. Russ. J. Phys. Chem. A 1968, 42, 2799–2804. (In Russian) [Google Scholar]
  58. Yatsenko, S.P.; Kononenko, V.I.; Sukhman, A.L. Experimental studies on temperature-dependent surface tension and density of tin, indium, aluminum and gallium. High Temp. 1972, 10, 66–71. Available online: http://www.mathnet.ru/links/aa952e995c272bcdeb3b8cff537ed076/tvt10586.pdf (accessed on 15 April 2022). (In Russian).
  59. Bykova, N.A.; Shevchenko, V.G. Density and Surface Tension of Copper, Aluminum, Gallium, Indium and Tin. In Physicochemical Research on Liquid Metals and Alloys; Ural Research Center of Academy of Sciences USSR: Sverdlovsk, Russia, 1974; pp. 42–46. (In Russian) [Google Scholar]
  60. Drotning, W.D. Thermal expansion of molten tin, lead, and aluminum to 1300 K. High Temp. Sci. 1979, 11, 265–276. [Google Scholar]
  61. Makeev, V.V.; Demina, E.L.; Popel, P.S.; Arkhangelsky, E.L. Research on metals density by the gamma transmission method over a temperature range of 290–2100 K. High Temp. 1989, 27, 701–706. Available online: http://www.mathnet.ru/links/eec257fb71c0d5c9bca9f88ce5d1908d/tvt4037.pdf (accessed on 8 March 2022). (In Russian).
  62. Smith, P.M.; Elmer, J.W.; Gallegos, G.F. Measurements of the density of liquid aluminum alloys by an X-ray attenuation technique. Scripta Mater. 1999, 40, 937–941. [Google Scholar] [CrossRef]
  63. Sarou-Kanian, V.; Millot, F.; Rifflet, J.C. Surface tension and density of oxygen-free liquid aluminum at high temperature. Int. J. Thermophys. 2003, 24, 277–286. [Google Scholar] [CrossRef]
  64. Khairulin, R.A. Density, Thermal Expansion and Phase Transformations of Liquid Metals and Rare-Earth Element-Based Compounds. In Habilitation Thesis (Phys.-Maths.); Kutateladze Institute of Thermophysics SB RAS: Novosibirsk City, Russia, 2003; Available online: https://static.freereferats.ru/_avtoreferats/01002614075.pdf (accessed on 23 February 2022). (In Russian)
  65. Srirangam, P.; Jeyakumar, M.; Kramer, M.J.; Shankar, S. Partial pair correlation functions and viscosity of liquid Al–Si hypoeutectic alloys via high-energy X-ray diffraction experiments. Philos. Mag. 2011, 91, 3867–3904. [Google Scholar] [CrossRef]
  66. Schmitz, J.; Hallstedt, B.; Brillo, J.; Egry, I.; Schick, M. Density and thermal expansion of liquid Al-Si alloys. J. Mater. Sci. 2012, 47, 3706–3712. [Google Scholar] [CrossRef]
  67. Kurochkin, A.R.; Popel’, P.S.; Yagodin, D.A.; Borisenko, D.A.; Okhapkin, A.V. Density of copper-aluminum alloys at temperatures up to 1400 °C determined by the gamma-ray technique. High Temp. 2013, 51, 197–205. [Google Scholar] [CrossRef]
  68. Leitner, M.; Leitner, T.; Schmon, A.; Aziz, K.; Pottlacher, G. Thermophysical properties of liquid aluminum. Metall. Mater. Trans. A 2017, 48, 3036–3045. [Google Scholar] [CrossRef]
  69. Wessing, J.J.; Brillo, J. Density, molar volume, and surface tension of liquid Al-Ti. Metall. Mater. Trans. A 2017, 48, 868–882. [Google Scholar] [CrossRef]
  70. Rusanov, B.A.; Baglasova, E.S.; Popel, P.S.; Sidorov, V.E.; Sabirzyanov, A.A. Gamma-densitometer for studies of high-temperature metal melts. High Temp. 2018, 56, 439–443. [Google Scholar] [CrossRef]
  71. Gancarz, T.; Jourdan, J.; Gasior, W.; Henein, H. Physicochemical properties of Al, Al-Mg and Al-Mg-Zn alloys. J. Mol. Liq. 2018, 249, 470–476. [Google Scholar] [CrossRef]
  72. Blairs, S. Review of data for velocity of sound in pure liquid metals and metalloids. Int. Mater. Rev. 2007, 52, 321–344. [Google Scholar] [CrossRef]
  73. Filippov, S.I.; Kazakov, N.B.; Pronin, L.A. Ultrasound velocity, liquid metals compressibility and association thereof with various physical properties. Izv. Vyssh. Ucheb. Zaved. Chern. Met. 1966, 9, 8–14. Available online: http://www.mathnet.ru/links/792bad5d6dbd07dffc8f570059f6e1fd/tvt9059.pdf (accessed on 11 January 2022). (In Russian).
  74. Maier, U.; Steeb, S. Sound velocity in molten alloys of the systems Al-Mg, Al-Sn, Mg-Sn, and Fe-C. Phys. Cond. Matter 1973, 17, 1–10. [Google Scholar] [CrossRef]
  75. Kruglov, L.D. Sound velocity, compressibility and Gruneisen parameter of molten Al, Mg, Zn, Sn, Sb and Cd. Russ. J. Phys. Chem. 1976, 50, 1481. (In Russian) [Google Scholar]
  76. Stremousov, V.I.; Tekuchev, V.V. Ultrasound velocity in Al-Sn and Al-Zn binary liquid metals. Russ. J. Phys. Chem. 1976, 50, 1418. (In Russian) [Google Scholar]
  77. Stremousov, V.I.; Tekuchev, V.V. Ultrasound velocity in Al-based binary liquid alloys. Russ. J. Phys. Chem. 1977, 51, 206. (In Russian) [Google Scholar]
  78. Keita, N.M.; Steinemann, S. Compressibility and structure factors at zero wave vector of liquid aluminium-silicon alloys. J. Phys. C 1978, 11, 4635–4641. [Google Scholar] [CrossRef]
  79. Tsu, Y.; Suenaga, H.; Takano, K.; Shiraishi, Y. The velocity of ultrasound in molten bismuth, aluminum, silver and copper. T. Jpn. I. Met. 1982, 23, 1–7. [Google Scholar] [CrossRef]
  80. Glazov, V.M.; Pavlova, L.M.; Kim, S.G. A study on acoustic properties of Al-Sb melts. High Temp. 1985, 23, 564. (In Russian) [Google Scholar]
  81. Barbier, P.; Gelon, J.L.; Robert, J. Melting curves of Bi, Pb and Al using microdifferential thermal analysis up to 1.4 GPa. High Pressure Res. 1992, 10, 465–468. [Google Scholar] [CrossRef]
  82. Errandonea, D. The melting curve of ten metals up to 12 GPa and 1600 K. J. Appl. Phys. 2010, 108, 033517. [Google Scholar] [CrossRef]
  83. Simon, F.; Glatzel, G. Bernerkungen zur schmelzdruckkurve. Z. Anorg. Allg. Chem. 1929, 178, 309–316. [Google Scholar] [CrossRef]
  84. Sharma, S.K.; Sharma, B.K. Volume dependence of the melting temperature for aluminium. Solid State Commun. 2010, 150, 1367–1369. [Google Scholar] [CrossRef]
  85. Liu, Z.; Zhang, X.; Cai, L. Shock melting method to determine melting curve by molecular dynamics: Cu, Pd, and Al. J. Chem. Phys. 2015, 143, 114101. [Google Scholar] [CrossRef] [PubMed]
  86. Xiang, M.; Jiang, S.; Chen, J. Theoretical investigations on melting/crystallization kinetics in overheated/overcooled aluminum at high pressures. J. Appl. Phys. 2019, 126, 125113. [Google Scholar] [CrossRef]
  87. Pu, C.; Yang, X.; Xiao, D.; Cheng, J. Molecular dynamics simulations of shock melting in single crystal Al and Cu along the principle Hugoniot. Mater. Today Commun. 2021, 26, 101990. [Google Scholar] [CrossRef]
  88. Nelder, J.A.; Mead, R. A simplex method for function minimization. Comput. J. 1965, 7, 308–313. [Google Scholar] [CrossRef]
  89. Young, D.A.; Cynn, H.; Söderlind, P.; Landa, A. Zero-Kelvin compression isotherms of the elements 1 ≤ Z ≤ 92 to 100 GPa. J. Phys. Chem. Ref. Data 2016, 45, 043101. [Google Scholar] [CrossRef]
  90. Wang, K.; Reeber, R.R. The perfect crystal, thermal vacancies and the thermal expansion coefficient of aluminium. Philos. Mag. A 2000, 80, 1629–1643. [Google Scholar] [CrossRef]
  91. Jacobs, M.H.G.; Schmid-Fetzer, R. Thermodynamic properties and equation of state of fcc aluminum and bcc iron, derived from a lattice vibrational method. Phys. Chem. Miner. 2010, 37, 721–739. [Google Scholar] [CrossRef]
Figure 1. Isobaric heat capacity of solid aluminum.
Metals 12 01346 g001
Figure 2. The molar volume of solid aluminum plotted versus temperature.
Metals 12 01346 g002
Figure 3. Volume compression of aluminum at 25 °C.
Metals 12 01346 g003
Figure 4. The adiabatic (BS) and isothermal (BT) bulk moduli of aluminum plotted against temperature.
Metals 12 01346 g004
Figure 5. The adiabatic bulk modulus of aluminum plotted against pressure.
Metals 12 01346 g005
Figure 6. Density of liquid aluminum plotted versus temperature.
Metals 12 01346 g006
Figure 7. Sound velocity in liquid aluminum.
Metals 12 01346 g007
Figure 8. The calculated melting curve of aluminum as compared to experimental [5,22,31,81,82], calculated [2] and theoretical data [84,85,86,87].
Metals 12 01346 g008
Table 1. Data on thermodynamic properties of solid and liquid aluminum (CP, J·mol−1·K−1) taken from reference books and review papers.
ΔT, KSolidLiquidRefs
CP (298.15)CP (Tm)CP (Tm)
0.1–170024.33933.86731.756[9] (Buyco 1970)
100–450024.35433.88131.750[10] (Glushko 1981)
0–933.4524.20932.959[21] (Ditmars 1985)
0.1–280024.22533.10731.757[11] (Desai 1987)
298.15–279124.29633.99431.748[12] (Barin 1995)
0–300024.20932.95931.751[13] (Chase 1998)
298.15–127324.41831.83831.838[14] (Mills 2002)
Table 2. A list of selected studies on thermal expansion of liquid aluminum.
ΔT, KPurity, %Form aΔρ b, %Refs
933–117399.998P[55] (Glazov 1958)
1264–173399.99T, P, E0.5[56] (Goltsova 1965)
933–175099.99P, E±1[57] (Ayushina 1968)
933–125099.99P, E1.5[58] (Yatsenko 1972)
933–147399.99E±0.5[59] (Bykova 1974)
933–134099.999P, E0.2[60] (Drotning 1979)
933–207099.999T, E0.2[61] (Makeev 1989)
973–117399.99P, E[62] (Smith 1999)
1639–236099.99P, E1.5[63] (Sarou-Kanian 2003)
933.6–1200P, E[64] (Hairulin 2003)
938–111399.999T, P [65] (Srirangam 2011)
933–167399.999P, E1[66] (Schmitz 2012)
933–164399.999P, E0.2[67] (Kurochkin 2013)
933–168099.999E±3.8[68] (Leitner 2017)
933–182399.999P, E±1[69] (Wessing 2017)
933–1270P, E0.2[70] (Rusanov 2018)
1356–174399.999P, E1[71] (Gancarz 2018)
a Form of data: D—individual measurements; E—equation; P—plot; T—Table. b Reported error (%).
Table 3. A summary of optimized variables of the EoS for solid aluminum.
EquationParameterValue
Thermodynamic functions (1)–(3)Υ1, J·mol–1·K–10.4307400
Υ2, J·mol–1·K–111.46590
Υ3, J·mol–1·K–114.01224
θ1, K64.9599
θ2, K208.0659
θ3, K392.5907
ΔS 0, J·mol–1·K–10.015206
h, J·mol–1·Km5.346947 × 10–7
m3.227389
EoS (8)n04.69557
Bulk modulus (12)B0, kbar795.69
s10.10356
s25.3621
ω1, K225.08
ω2, K3980.5
Thermal expansion (9)V0, cm3/mol9.87109
X12.4646 × 10–5
X24.5046 × 10–5
X31.5699 × 10–4
Θ1, K191.6603
Θ2, K368.4523
Θ3, K4244.7220
g, Kk2.4407 × 10−8
k1.840799
Table 4. A summary of optimized variables of the EoS for liquid aluminum.
EquationParameterValue
Thermodynamic functions (4)–(6)a, J·mol–1·K–131.75
b, J·mol–1·K–13755.104
ΔS 0, J·mol–1·K–1−145.7490
EoS (8)n05.22253
Bulk modulus (12)B0, kbar538.96
s10.14097
s22.5298
ω1, K676.33
ω2, K2668.4
Thermal expansion (10)V0L, cm3/mol10.20834
A1, K–1−1.0952 × 10⁻⁴
A2, K–2−1.0672 × 10⁻¹⁰
A3, K–33.5504 × 10⁻¹³
Table 5. Equation of state parameters for aluminum.
V0 *1, cm3/molB0 *1, kbarn0EoS *2Refs
9.993778.974.26Mur[27] (Vaidya 1970)
7304.1Mur[28] (Senoo 1976)
9.998727 (30)4.30 (8)BM3[29] (Syassen 1978)
717 (36)4.79 (37)BM3[30] (Ming 1986)
9.973743 (11)4.47 (6)Vinet[32] (Dewaele 2004)
7274.14BM3[33] (Greene 1994)
9.995727 (20)4.446 (83)BM3[34] (Nishimura 2005)
760 (20)4.6 (7)Vinet[1] (Akahama 2006)
9.987304.54 (2)Vinet[35] (Dewaele 2018)
9.871 *3795.69 *34.696TaitPresent work
*1 At 298 K. *2 Mur: Murnaghan EoS; BM3: third-order Birch–Murnaghan EoS; Vinet: Rydberg–Vinet EoS. *3 At 0 K.
Publisher’s Note: MDPI stays neutral with regard to jurisdictional claims in published maps and institutional affiliations.

