Article

In-Production Rheometry of Semi-Solid Metal Slurries

1
Materials and Manufacturing, School of Engineering, Jönköping University, P.O. Box 1026, 511 11 Jönköping, Sweden
2
Comptech AB, Fabriksgatan 49-51, 568 31 Skillingaryd, Sweden
*
Author to whom correspondence should be addressed.
Metals 2022, 12(7), 1221; https://doi.org/10.3390/met12071221
Submission received: 17 May 2022 / Revised: 15 July 2022 / Accepted: 18 July 2022 / Published: 19 July 2022
(This article belongs to the Section Metal Casting, Forming and Heat Treatment)

Abstract

:
Semi-solid aluminium alloy processing (SSM) has advanced into a more mature process with many applications. The current paper aims to investigate the in-process behaviour of a production slurry using an engineering approach to estimate the properties. A method to assess the rheological properties of a semi-solid metal slurry was tested and found capable of producing meaningful measurements. The foundations of this were to use a Rushton turbine setup for the assessment through a model to optimize the factors included in the slurry rheology. In the analysis of the static and dynamic part of the viscosity, it was concluded that the slurry turns increasingly into a solid with increasing solid fractions where the static shear strength dominates the rheology more and more compared to the dynamic components. The static yield strength was also found significantly more dominant with increasing solid fraction, suggesting that the industrial-scale analysis using models based on Ostwald–de Waale and Carreau modelling is far from sufficient for a process, such as the RheoMetal process, with a very rapid slurry generation.

1. Introduction

Semi-solid aluminium alloy processing (SSM) has advanced into a more mature process with many applications [1,2]. SSM processing was introduced by Spencer [3], and it was initially identified as a fundamental discovery leading to a strong development of research into the rheology of SSM slurries behaviour [4,5,6]. The behaviour includes primarily shear thinning, and even yield points [6,7] and shear thickening [8] have been discussed.
Since Einstein’s [9] work on suspensions, the solid fraction has been important. The shear history, the shape of the particles, and the slurry viscosity are essential [10]. Alexandrou and Georgiou [10] concluded that the SSM slurry behaviour could be described as a Hershel–Bulkley fluid with a complex yield behaviour, including a static and dynamic yield component, Equation (1). This was described as
τ = τ 0 f s , λ + τ s f s , γ ˙ + K f s , γ ˙ γ ˙ n f s , γ ˙
Equation (1) consists of three terms, where the first term is the slurry strength and the other terms on the right-hand side are steady-state flow properties. The structural parameters, λ , allows for a dynamic behaviour describing the effects of both particle shape and the nature of particle–particle contact status in the slurry. Transient behaviour is captured by changes in the structural parameter, λ . Transient behaviour is beyond the scope of the current paper that targets the characterization of a slurry and its state just before pouring it into the shot sleeve and injecting it into the die cavity in Rheocasting. An approach to model static, steady-state properties was devised by Ma et al. [11], starting with the introduction of the concept of the maximum packing density, ϕ m . The factor ϕ m was described by Mueller et al. [12] who developed a phenomenological model for arbitrarily shaped particles having an aspect ratio of r P as:
ϕ m = 2 0.321 r P + 3.02
Ma et al. [11] used the notion of maximum packing density, ϕ m , and Equation (1) and developed an approach to include both the consistency index, K, and the shear thinning coefficient, n, following the work of Maron and Pierce [13] for Equations (3) and (6).
K η 0 = 1 1 f s ϕ m 2
where η 0 is the liquid viscosity. This relationship results in K becoming too small to produce the measured viscosity, using the actual viscosity of liquid aluminium in the range of 1–1.4 mPa s [14]. Ma et al. [11] pragmatically forced the liquid viscosity to 0.59 Pa s instead of the actual 1–1.4 mPa s without giving any strong physics reasoning behind this change of apparent viscosity. In work by Faroughi and Huber [15], the various regions for both the capillary number C a = v η 0 d P / σ (where d P is particle size, v is speed and σ is surface tension) and relative viscosity ratio, λ = η p / η 0 , between deforming particles viscosity, η p , and the base liquid viscosity, η 0 , was discussed. The Eiler fit had the broadest range in the description of the slurry structural behaviour
η η 0 = 1 + B E f s 1 f s ϕ m 2
where B E is a phenomenological fitting parameter. Faroughi and Huber [15] collated a number of models for both hard-sphere models and deformable particles. B E as a phenomenological coefficient can be used to compensate for the obvious discrepancy between the liquid aluminium viscosity assessed by Dinsdale and Quested [14] and that fitted by Ma et al. [11], which are incompatible and lack a physics explanation. The work made by Faroughi and Huber [15] and by Maron and Pierce [13] only pertains to the dynamic response of the slurry and through identification it may be assumed that Equation (4) can be rewritten as Equation (5)
K η 0 = 1 + B E f s 1 f s ϕ m 2
It should be noted that Equations (4) and (5) are valid for any viscosity ratio λ = η p / η 0 being the ratio between the particles and the liquid matrix fluid. It should also be noted that Equations (4) and (5) requires that that the capillary number C a 1 , following the work by Faroughi and Huber [15].
The shear-thinning exponent was devised as
n = 1 a r P f s ϕ m b
where a and b are fitting constants. Ma et al. [11] concluded that since r P = 1 in their study a condition on the product, a r P , was fixed and set to, a r P   = 1, as n = 0 was set necessary since flow was required at f s = ϕ m , leading to that a = 1 / r P in the current study. The constant, b , was determined through a fitting process to b = 0.725 by Ma et al [11]. A similar procedure will be used in the current paper.
Ma et al. [11] also used the approach by Heymann et al. [16] for the yield strength, as shown in Equation (5)
τ y = τ 0 1 1 f s ϕ m 2 1
here τ y is the effective yield strength and τ 0 is the yield strength at the solid fraction given by Equation (6). The factor inside the bracket that is used to multiply with τ 0 to get τ y should be seen as a structural correction factor for a slurry with a particular solid fraction and particle shape.
f s = ϕ m 1 2 2
Ma et al. [11] used measurements and regression modelling to describe the shear strength, τ 0 . In the current study, the yield properties baseline for A356 assessed by Pan et al. [7] will be used. Pan et al. [7] found that slurries with a solid fraction below 50% obeyed an expression, such as Equation (7).
τ P A = 1000 c + d f s 2
where c and d are fitting parameters.
Pan et al. [7] studied A356 under two different conditions. Firstly, grain refined (GR A356) where c = −0.12 and d = 0.03. Secondly, Pan et al. [7] found that magnetohydrodynamically stirred A356 (MHD A35, c = −1.87 and d = 0.43) resulted in a slightly lower value shear strength. These two conditions represent two different morphological states of the particles in the slurry with equiaxed dendritic features for GR A356 and rounded globular particles for MHD A356). In the current investigation τ y = τ P A at the solid fraction given by Equation (8) using the data for the GR A356.
Actual measurements of the viscosity of A356 are plentiful, as shown by Modigell et al. [6]. More recent measurements by Das et al. [17] also show similar behaviour, with data assessed with a Searle type or rotating bob type of rheometer. Das et al. [17] clearly illustrated that a high cooling rate increases the viscosity compared to a low cooling rate. At the onset of solidification, the viscosity increased from the fully molten state with just below 0.04 Pa s and steadily increased to just below 5 Pa s near the eutectic temperature at a shear rate of 100 1/s, which is approximately a factor twice as high than what was presented by Modigell et al. [6]. Even though Das et al. [17] used dynamic measurements, time scales may fit a process, such as the SEED process, but are far too long compared to GISS and the RheoMetal process [2].
In all studies involving rheological characterization, precision instruments are used, and results are obtained with high precision. The main issue in industrial practice is that the slurry structure and grain formation and properties are far from the particle sizes and time scales found in industrial processing, where the range of treatments is from a few seconds up to just below 300 s [2]. Transient behaviour has been studied, but the initial creation of slurries for the precision rheometers inhibits a one-to-one match of the slurry structures [6]. The current paper aims to investigate the in-process behaviour of a production slurry using an engineering approach to estimate the properties.

2. Materials and Methods

2.1. Slurry Making

The material used in the current study was an Al7Si0.3Mg alloy commonly used for SSM processing and Rheocasting. The process used to make the slurry was the RheoMetalTM process, and the casting equipment was an 800 t Buhler high-pressure die-casting (HPDC) machine. The RheoMetalTM process is illustrated in Figure 1. The slurry is generated directly in the ladle by first pouring off a small amount to be used as an enthalpy exchange material (EEM); this is step 2. A previously cast EEM is reintroduced for remelting, generating the slurry. In the current study, a secondary stirring was used for the viscosity measurement, and samples were taken by quenching them in a copper mould before doing a microstructural analysis. The choice of parameters was made such that the size of the EEM conformed to production practice concerning the ladle size and shot weight. The stirring speed for the EEM addition and EEM amount was varied. These two factors affect viscosity. The stirring time was chosen such that the EEM always wholly disintegrated into the ladle. The secondary stirring speed and timing were chosen to have a difference in viscosity and shear history, allowing for varying slurry particle shape and shear history. It should be noted that the effect of the processing parameters is not the target here and that they are only means to vary the solid fraction. The parameters varied are collated in Appendix A, Table A1.

2.2. Viscosity Measurement

The viscosity measurement was based on the power required for the secondary stirrings. The power was calculated based on the voltage measures using a Hewlett-Packard voltmeter, and the current was measured using a Fluke amperemeter. Based on the results, the viscosity parameters were fitted, assuming that the system behaved as a Rushton turbine. The relationship between power and the properties of a Hershel–Bulkley fluid, based on the work by Torrez and André [18], can be described as
P = k P N 2 d 3 K k s N n 1 + τ y k s N
where kp and ks are geometric constants for the Rushton turbine, and N is the rotation rate (1/s). The geometry of the Rushton turbine is shown in Figure 2, where the geometric factors are defined as
k P = 4 π 3 N h L d t / d 2 t / d 2 1
and
k s = 2 π l n t / d
It should here be noted that the effective shear rate in a Rushton turbine is given by
γ e ˙ = k s N = 2 π N l n t / d
The geometry functions are collated with the results in Appendix A, Table A2.

2.3. Microstructural Characterization

The microstructure was studied from samples quenched from step 5 in Figure 1 immediately after the secondary stirring into a copper mould to establish the solid fraction in the slurry at the end of the two stirring operations. These samples were cross-sectioned and polished using conventional metallographic procedures. In order to reveal the actual particle fraction in the slurry, Weck’s reagent was used, a colour etching technique revealing the Si distribution in the cross-section to reveal the solid fraction before quenching. Weck’s reagent consisted of 4 g KMnO4 and 1 g NaOH in 95 mL distilled water. For each experimental condition, 10 samples were produced, resulting in 410 samples.

3. Results

3.1. Microstructural Characterization

The microstructure analysis revealed a typical microstructure from a RheoMetal processed material. The microstructure shown in Figure 3 is similar to an equiaxed gravity die-cast microstructure and does not display the typical globular microstructure commonly found in semi-solid processed materials [1,2,3]. The RheoMetal process is signified by a rapid slurry generation to a high fraction, where the trade-opp to productivity is a less globular microstructure. A microstructure with a more equiaxed appearance would typically tend to have a higher viscosity than a perfectly globular microstructure, as well as a tendency towards developing networks promoting a static shear strength.
Shape measurements of the particles would not provide useful data due to significant variations. The dendrite envelope would have a similar role as the globular particle shape. The standard deviations would render all measurements inconclusive.
The evaluated solid fractions and the associated uncertainties are collated in Appendix A, Table A2.

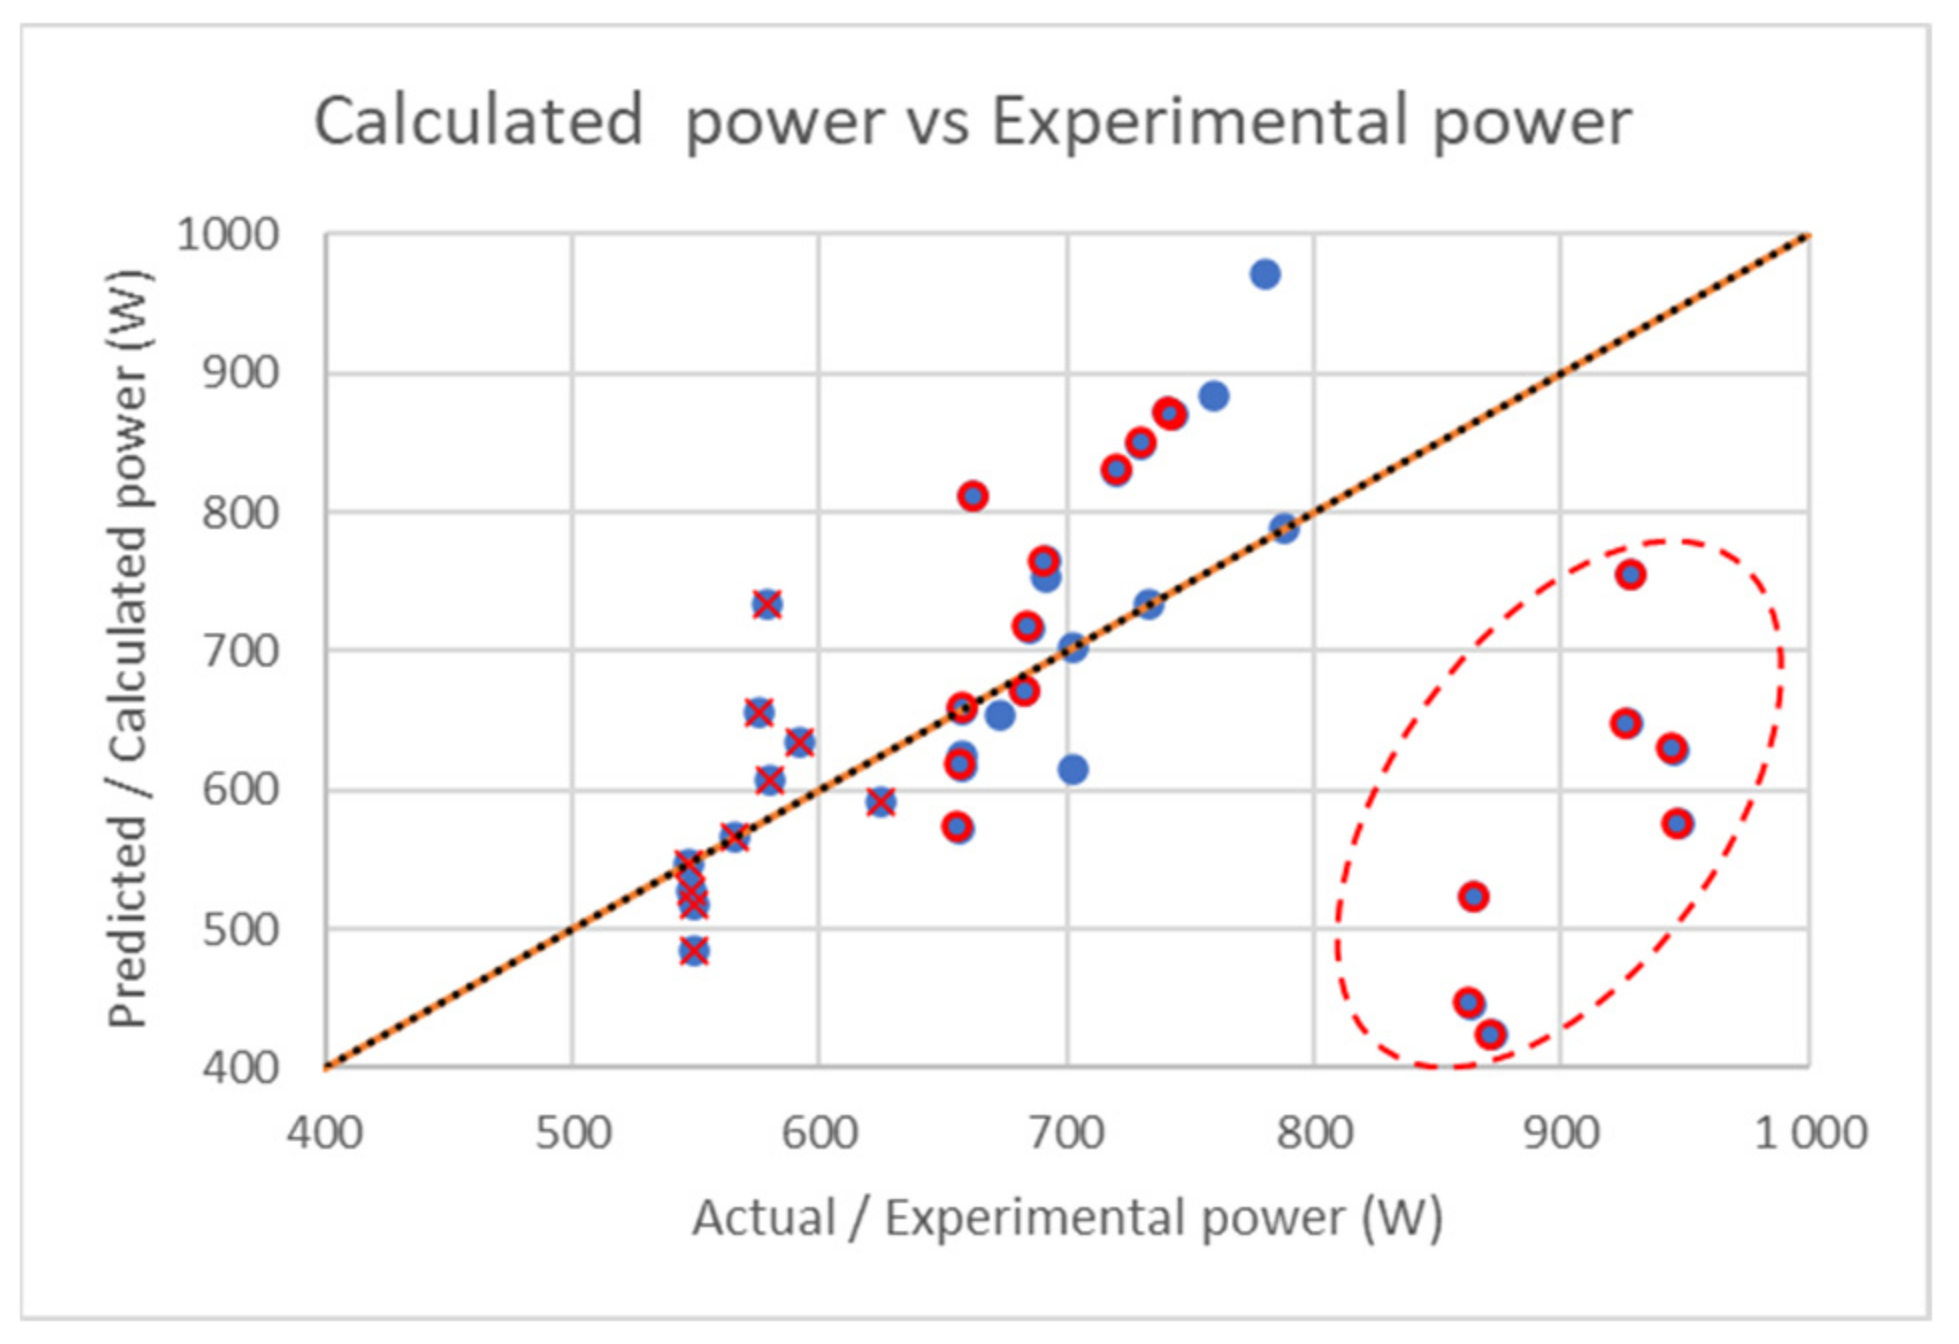
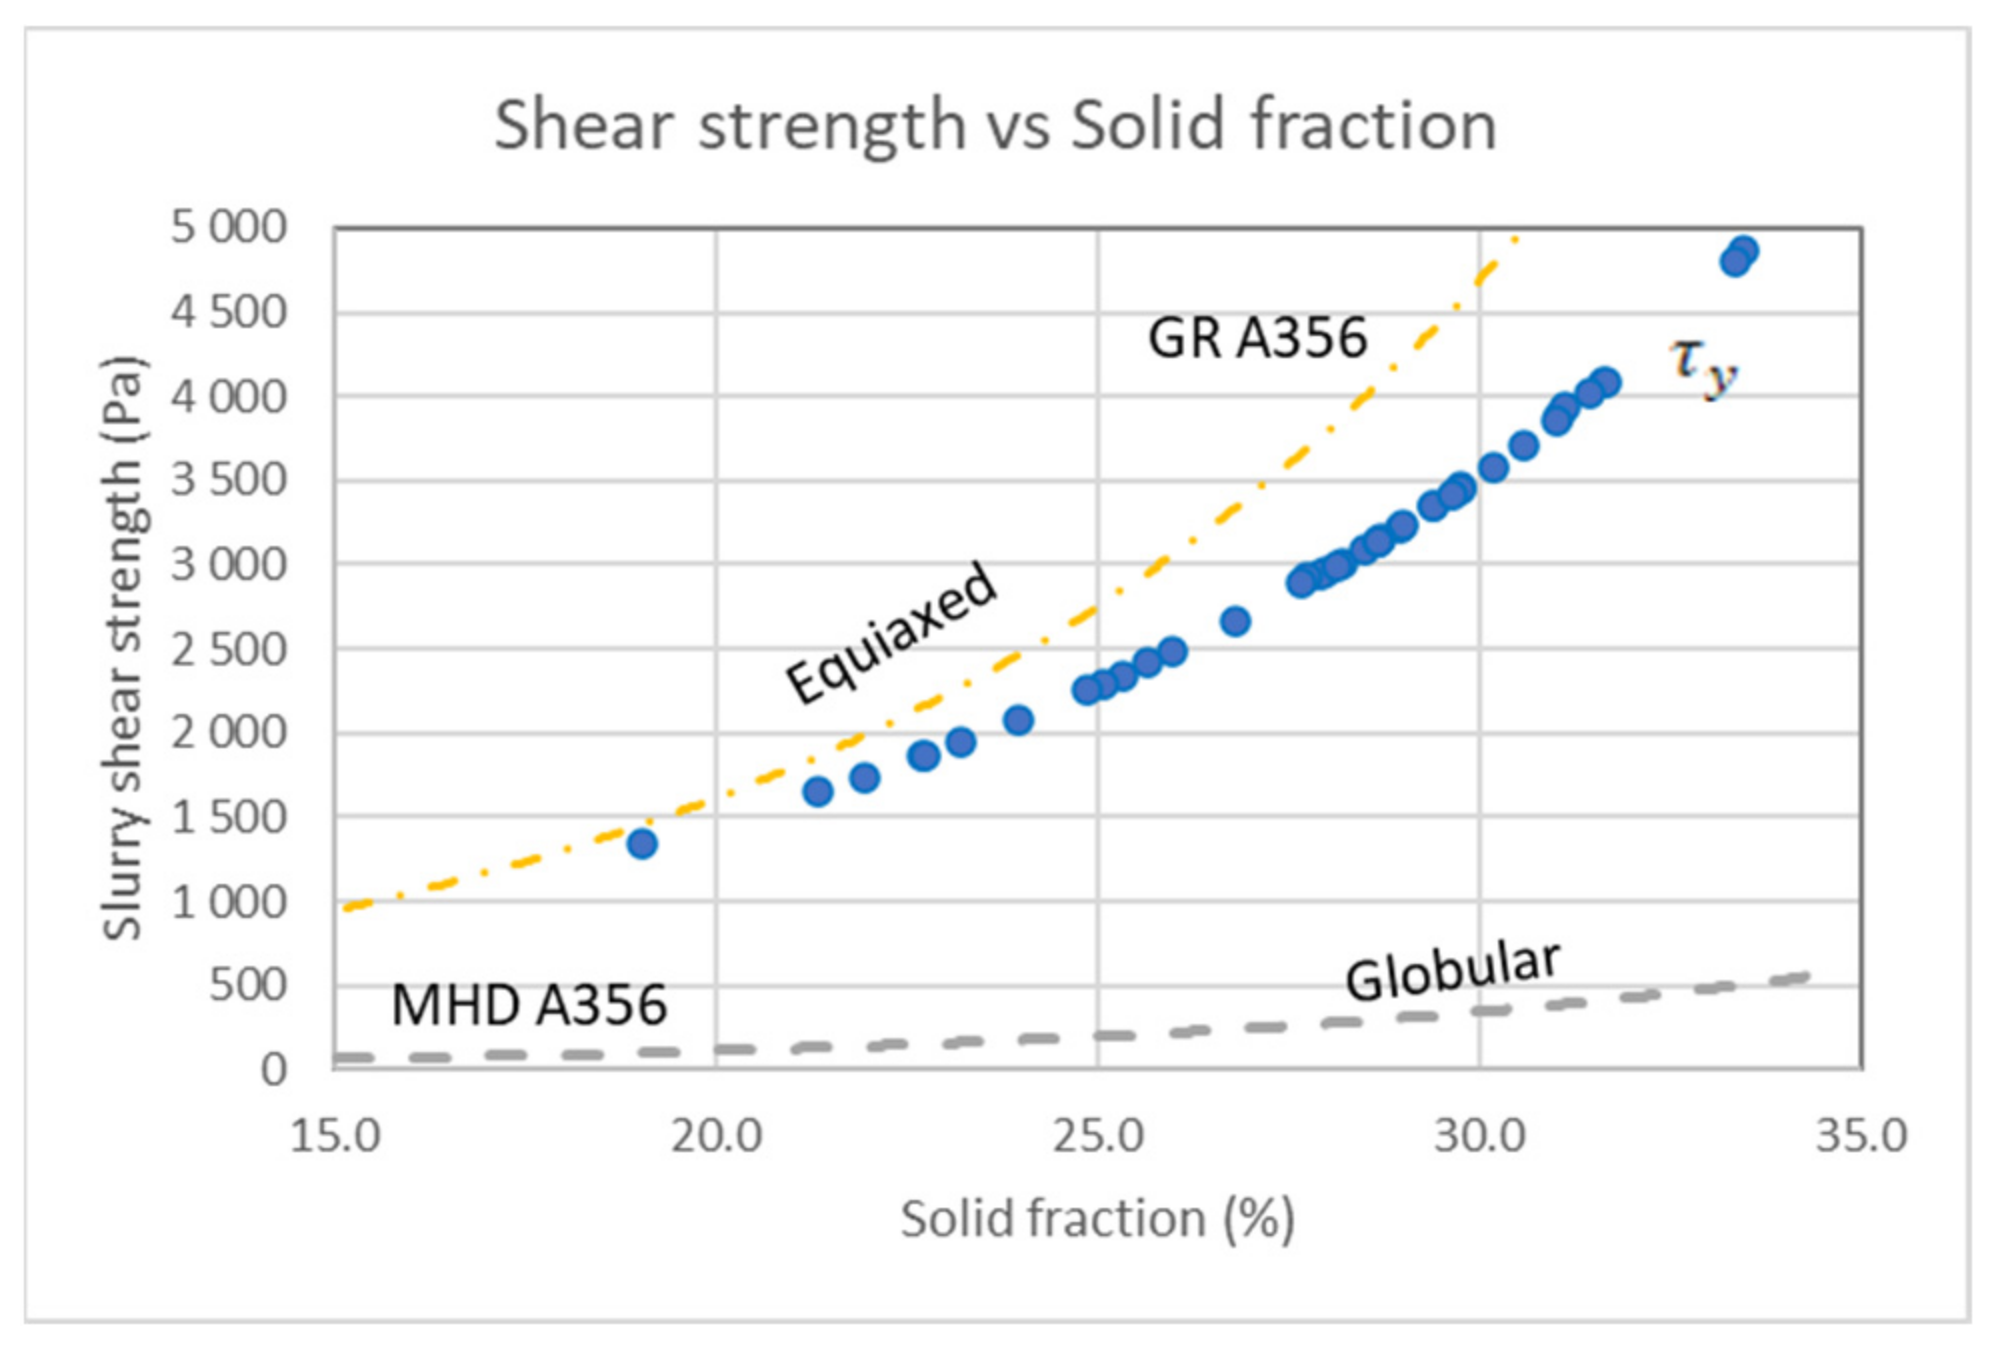
3.2. General Results and Parameter Fitting

The results from the experiments are collated in Appendix A, Table A2, together with the geometric factors kp and ks for the Rushton turbine. It should first be mentioned that the idealization of the stirring process with the Rushton turbine is a limitation in validity, and the use of different-sized ladles in the stirring process illustrated this fact to show the full volumetric engagement of the location of the stirrer relative to the wall is not fixed, and a slight variation is seen. The fitting process revealed sensitivity to starting values for the optimization forcing the optimization to be made in steps. The first step was to assume that r P = 1 and perform a first stage fit of B E and b. Following this r P was optimized. This allowed a final adjustment, optimizing all three parameters together.
In Figure 4, the general fit is illustrated. The largest shot weight with the highest temperatures generated a deviation in the fit. This is likely because to achieve total volumetric engagements, both the EEM stirring phase and the secondary stirring involved a slight motion of the stirrer, causing a deviation in the actual geometry, partially invalidating the Rushton turbine idealization. This only became effective for the largest shot weight and the highest temperatures. A similar deviation was not seen for smaller shot weights and higher temperatures.
In order to get the best possible fit, it was required to do an individual fit for each shot weight. The outcome of the fitting is seen in Table 1.
Another matter to take note of is that Equation (3) dictates a relationship between the consistency index, K, and the liquid phase viscosity, η 0 . Using the data for the liquid viscosity under general acceptance as proposed by Dinsdale and Quested [14] will not allow the calculation of a suitable consistency index, K. Ma et al. [11] used a pragmatic approach for estimating it in their experiments, essentially making it a fitting parameter. The main conclusion on this expression is that the seen consistency indexes can never be achieved with the liquid phase viscosities. Equation (5) allows taking into account the effects of deformable particles. The particle in semi-solid processing deformed was shown by Esmaily et al. [19] using EBSD and revealing that the low angle grain boundaries numbers were higher in semi-solid processed material than high-pressure die-cast material, increased with the flow length of the slurry, adding plastic deformation to the apparent viscosity in addition to the hard-sphere modelling. No clear evidence of deformation similar to Esmaily et al. [19] could be found in the samples investigated. From the aggregate size difference between the microstructural constituents in Figure 3a,b, aggregate fragmentation is likely to occur during stirring. Since the material was quenched using gravity only and not injected into a die cavity, the level of shearing would be less than what was observed by Esmaily et al. [19]. Nevertheless, fragmentation would require plastic deformation of the aggregates, justifying using a deformable particle model, as is the case in Equation (5), to describe viscosity. The fitted parameters for the different shot weights are found in Table 1.

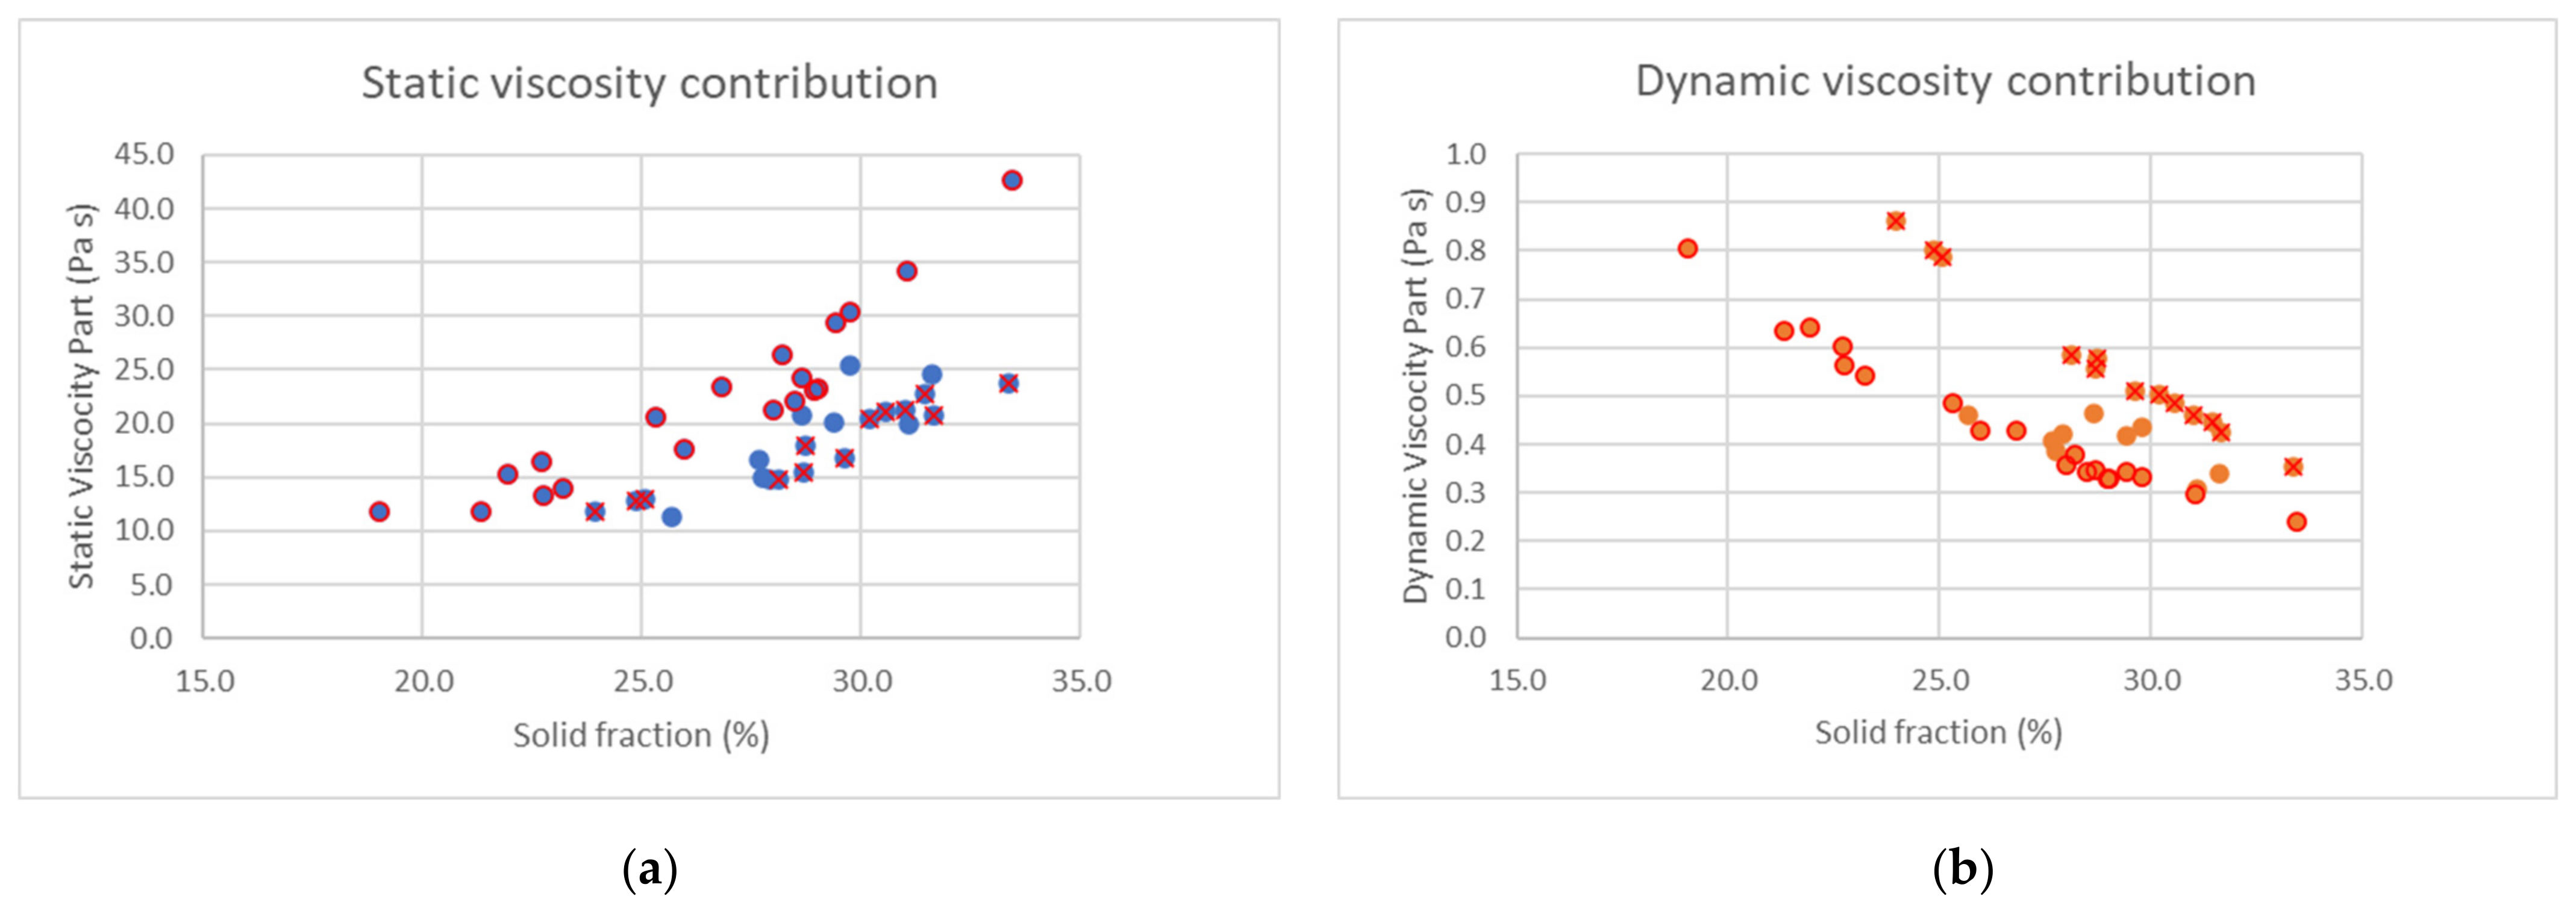
3.3. Viscosity Analysis

The apparent viscosity was determined based on the models and fitted data for the different conditions. In Figure 5a, the apparent viscosity is shown as a function of the solid fraction, and in Figure 5b, the influence of shear rate is shown. The spread is was caused by the concurrent variation of the solid fraction and shear rate.
The deviation is not random, and the process parameters affect the outcome. The upper bound of viscosities was generated by the large shot weight settings of 20 kg for the apparent viscosity. The lower bound consist of the smaller shot weights of 5 and 7 kg. This implies that there are influences from both thermal conditions and experimental geometry. In terms of shear thinning, the spread is reduced with increasing shear rate, as expected from the results found by Rheomenters, Modigell et al. [6], and Das et al. [17]. This is also seen in Figure 5b. In addition, as viscosity is reduced with increasing shear rate, the actual spread is also reduced.
The geometry of the Rushton turbine is characterized primarily by the factor, k s , that in the current test becomes greater for the smaller shot weights. The effect of the geometric factor representing the gap between the blades and the wall is seen in Figure 5c. This is consistent with the effect of shear rate, and the smaller shot weight has generally experienced a higher shear rate and a higher degree of total shear. This fact is important as the resulting viscosity is dependent the on shear history [6].
The apparent viscosity has two contributions in the current model, one from the dynamic behaviour signified by the consistency factor, K, and the shear exponent, n, and one based on the static shear strengths of the slurry and its structure with a resulting shear strength, τ y . The relative contribution from each part is shown in Figure 6a,b for the static and dynamic contributions, respectively, as a function of the solid fraction. The relative contribution from the static part increases with the solid fraction, illustrating that a more solid-like behaviour is developing. In Figure 3a, it is, furthermore, seen that the aggregates are smaller and more sound in the 2 kg shots, compared to the 20 kg shots, as shown in Figure 3b. The irregular shapes would generate a more solid-like behaviour, since more irregular particles would entangle more efficiently, resulting in a more solid-like behaviour. This was also confirmed through a larger static viscosity contribution for the 20 kg shots compared to the 2 kg shots, as shown in Figure 6a. Similarly, the dynamic portion decreases based on the influence on both the consistency index and the shear thinning exponents with an increasing solid fraction. As a consequence of geometry, the influence of the shear history can also be seen since the dynamic contribution is higher from the smaller shot weight that has experienced a greater total accumulated shear.
Similarly, the higher the shear strength material is dominated by, the larger the shot weight, which suggests a more coherent structure at the same solid fraction. This suggests a breakdown of a solid, more coherent structure into a more dispersed structure. The dispersion results in more particles moving, resulting in a higher number of particle interactions and hence a higher dynamic contribution. This can also be seen in the microstructure, Figure 3a,b.
Taking a closer look at the static component, τ y . The variation originates from variations in the shear rates at which the apparent viscosity was established. The modelling outcome for τ y is shown in Figure 7. As a reference for the behaviour of the shear strength, τ y , the data from Pan et al. [7] details both the unstirred GR A356 material and the heavily stirred MHD A356 material. The value for τ y ends up relatively close to the the strength of GR A356, suggesting that the structure is not fully globular, which fits well with the microstructural observations shown in Figure 3a,b. It should be noted here that this, furthermore, explains the relatively large contribution from the static properties of the slurry to the apparent viscosity. This is a direct contrast to what has been argued based on viscosimetry studies [6]. It also suggests that the static slurry properties would dominate the flow and filling properties in industrial-scale processing with a rapid high solid fraction slurry.
The dynamic properties of the slurry, the consistency index (Figure 8a) and the shear thinning coefficient (Figure 8b) are directly impacted by the solid fraction, both in measurement and in modelling. The consistency index is similar to the stiffness or strength of the dynamic portion. This factor is hard to compare to others because it highly depends on the slurry structure and the models intimately connected to the liquid viscosity. In the current study, each shot weight was given its evaluation of the consistency index. The model predicts an increased stiffness of resistance with increasing solid fractions. This behaviour is compatible with the expected behaviour with an increasing fraction, even without a yield point, which should increase the resistance to flow. Based on experiments modelled without a yield point, the yield point contribution is implicitly compensated for by a higher value of the consistency index illustrated by data in, for instance, Modigell et al. [6], where the consistency indexes are from 166 up to 789 Pa sn and 1 to 20 Pa sn from Ma et al. [11].
The shear-thinning exponent, n, is perhaps the most different factor. The fact that it decreases with the solid fraction is not unexpected, dictated by the modelling approach. The absolute nature is, on the other hand, different. The measurement was made in production under a short duration compared to all other measurements made using rheometers that use isothermal conditioning as in the work by Modigell et al. [6] or undercooling [17]. In common for all these studies is that the time frame and microstructure and chemical shifts, including solid sphere behaviour, are very different from this found in rapid slurry on-demand methods, such as GISS and RheoMetal processing. The iso-thermal assessments result in a range of values from 0.08 down to −0.3. Ma et al. [11] made short-duration dynamic measurements, resulting in shear exponents above zero and approximately 0.2 to 0.3 lower than the current study.

4. Conclusions

A method to assess the rheological properties of a semi-solid metal slurry was tested and found capable of producing meaningful measurements. The foundations of this were to use a Rushton turbine setup for the assessment through a model to optimize the factors included in the slurry rheology. The current study took a Herschel–Bulkley fluid approach inspired by Ma et al. [11] but with a different approach to shear thinning and static yield strength.
In the analysis of the static and dynamic part of the viscosity, it was concluded that the slurry turns increasingly into a solid with increasing solid fractions where the static shear strength progressively dominates the rheology compared to the dynamic components. When comparing the properties to literature, it was found that the resulting slurry properties were more similar to a grain refined material (GR A356) than a heavily stirred materials (MHD A356).
One of the previously suspected drawbacks of rheometer testing for semi-solid metal slurries was that the timeframe of the measurements did not fit the actual structures. The outcome of this discrepancy is that understanding slurry behaviour in processes, such as GISS and RheoMetal, will be significantly flawed. This discrepancy was confirmed and revealed through a significant difference in the shear-thinning exponent that for short-term measurements, as in this study, and for non-isothermal testing, well-suited for cooling slope processing was higher than for rheometer-tested materials. The static yield strength was also found significantly more dominant with increasing solid fractions, suggesting that the industrial-scale analysis using models based on Ostwald–de Waale and Carreau modelling is far from sufficient for a process, such as the RheoMetal process, with a very rapid slurry generation.

Author Contributions

Conceptualization, A.E.W.J. and P.J.; methodology, A.E.W.J., M.J. and M.A.; investigation, M.J., M.A. and P.L.; resources, P.J. and P.L.; writing—original draft preparation, A.E.W.J.; writing—review and editing, all authors together; supervision, A.E.W.J. All authors have read and agreed to the published version of the manuscript.

Funding

This research received no external funding.

Institutional Review Board Statement

Not applicable.

Informed Consent Statement

Not applicable.

Data Availability Statement

All data used are contained within the publication.

Acknowledgments

The technical staff at Materials and Manufacturing at the School of Engineering, Jönköping University, and the staff at Comptech are acknowledged for the support given to make this investigation possible.

Conflicts of Interest

The authors declare no conflict of interest.

Appendix A

Appendix A contains the parameter settings used and the measured data from the experiments.
Table A1. Experimental planning based on statistical design of experiments using a D-Optimal design.
Run NoShot Weight
(kg)
Melt Temp.
(°C)
EEM Add.
(%)
EEM Diam.
(mm)
EEM Height
(mm)
EEM Stirring Speed
(rpm)
Secondary Stirring Time
(s)
Secondary Stirring Speed
(rpm)
120678670115110681106
22063857010090011900
32064057010090020900
42063157010011008900
52063357010011008900
62068067011589620896
7206445701001100161020
8206875701008968896
920681570100110620896
102063867011511008900
1120642570100110081100
122068567011511068896
132065757010090081100
14206356701151100201100
1520642670115101081100
1620686670115110681106
1720687570100896201106
18206886701151106131106
1920655670115100020900
201064797090110020900
21106817707090081000
221064797090900121100
2310656570501100201100
247644640421000141020
257640540117990141020
2656448404090081010
2756469404611008900
28568797046980201100
29265584053.5108020670
3026485403510008600
312667940609008690
3226429406090020620
332675940609008600
34267094060110020600
35264554035110020600
3626549406011008690
3726945403590020600
3826945403590019600
3926845403511008600
4026457404690020690
41267654035110020690
Table A2. Experimental results as solid fraction, f s and associated error from metallographic analysis, the calculated Rushton Turbine geometry factors, kp and ks, and the measured and calculated power for stirring.
Run No f s
(%)
Error
(±%)
kpksPExp
(W)
PCalc
(W)
126.02.4613.537.601929755
226.82.2613.537.601656573
328.23.0613.537.601657617
429.40.6613.537.601658658
529.82.0613.537.601683670
625.31.6613.537.601865523
728.71.7613.537.601691764
822.70.5613.537.601863446
921.91.4613.537.601872424
1031.12.5613.537.601685717
1128.00.9613.537.601720830
1219.03.4613.537.601860343
1328.51.9613.537.601730850
1429.01.9613.537.601743870
1529.04.0613.537.601741872
1623.21.2613.537.601927648
1722.71.9613.537.601945629
1821.31.1613.537.601948575
1933.52.1613.537.601662812
2029.82.1661.479.065673655
2128.72.1661.479.065733733
2229.41.4661.479.065760883
2331.61.8661.479.065781971
2427.92.9644.5611.657703616
2531.12.1644.5611.657703703
2627.71.2590.8411.657692753
2727.70.7590.8411.657658624
2825.73.7590.8411.657788788
2931.60.8694.8217.616575656
3031.51.7694.8217.616547547
3133.41.6694.8217.616579734
3231.00.9694.8217.616565565
3330.63.4694.8217.616548527
3430.21.2694.8217.616550518
3528.72.2694.8217.616549484
3629.61.6694.8217.616592634
3725.11.7694.8217.616591399
3824.92.0694.8217.616583394
3923.91.7694.8217.616558372
4028.71.7694.8217.616580608
4128.11.8694.8217.616625592

References

  1. Jarfors, A.E.W.; Zheng, J.C.; Chen, L.; Yang, J. Recent Advances in Commercial Application of the Rheometal Process in China and Europe. Solid State Phenom. 2019, 285, 405–410. Available online: https://www.scientific.net/SSP.285.405 (accessed on 3 May 2022). [CrossRef]
  2. Jarfors, A.E.W. A comparison between semi-solid casting methods for aluminium alloys. Metals 2020, 10, 1368. [Google Scholar] [CrossRef]
  3. Spencer, D.B.; Mehrabian, R.; Flemings, M.C. Rheological behavior of Sn-15 pct Pb in the crystallization range. Metall. Mater. Trans. B 1972, 3, 1925–1932. [Google Scholar] [CrossRef]
  4. Kirkwood, D.; Kapranos, P.; Suéry, M.; Atkinson, H.V.; Young, K.P. Semi-Solid Processing of Alloys; Springer Series in Materials Science; Springer: Berlin/Heidelberg, Germany, 2010; pp. 1–169. [Google Scholar]
  5. Atkinson, H.V. Modelling the Semi-solid Processing of Metallic Alloys. Prog. Mater. Sci. 2005, 50, 341–412. [Google Scholar] [CrossRef] [Green Version]
  6. Modigell, M.; Pola, A.; Tocci, M. Rheological Characterization of Semi-Solid Metals: A Review. Metals 2018, 8, 245. Available online: https://www.mdpi.com/2075-4701/8/4/245 (accessed on 3 May 2022). [CrossRef] [Green Version]
  7. Pan, Q.Y.; Apelian, D.; Alexandrou, A.N. Yield behavior of commercial Al-Si alloys in the semi-solid state. Metall. Mater. Trans. B 2004, 35, 1187–1202. Available online: http://link.springer.com/10.1007/s11663-004-0073-x (accessed on 3 May 2022). [CrossRef]
  8. Atkinson, H.V.; Favier, V. Does Shear Thickening Occur in Semi-solid Metals? Metall. Mater. Trans. A Phys. Metall. Mater. Sci. 2016, 47, 1740–1750. [Google Scholar] [CrossRef] [Green Version]
  9. Einstein, A. Eine Neue Bestimimmung Der Moleuldimensionen. Ann. Physik 1906, 19, 230–247. [Google Scholar]
  10. Alexandrou, A.N.; Georgiou, G. On the early breakdown of semi-solid suspensions. J. Non-Newton. Fluid Mech. 2007, 142, 199–206. [Google Scholar] [CrossRef]
  11. Ma, Z.; Zhang, H.; Fu, H.; Fonseca, J.; Yang, Y.; Du, M.; Zhang, H. Modelling flow-induced microstructural segregation in semi-solid metals. Mater. Des. 2022, 213, 110364. [Google Scholar] [CrossRef]
  12. Mueller, S.; Llewellin, E.W.; Mader, H.M. The rheology of suspennsions of solid particles. Proc. R. Soc. A 2010, 466, 1201–1228. [Google Scholar] [CrossRef] [Green Version]
  13. Maron, S.H.; Pierce, P.E. Application of ree-eyring generalized flow theory to suspensions of spherical particles. J. Colloid Sci. 1956, 11, 80–95. [Google Scholar] [CrossRef]
  14. Dinsdale, A.T.; Quested, P.N. The viscosity of aluminium and its alloys—A review of data and models. J. Mater. Sci. 2004, 39, 7221–7228. [Google Scholar] [CrossRef]
  15. Fahroughi, S.A.; Huber, C. A generalized equation for rheology of emulsions and suspensions of deformable particles subjected to simple shear at low Reynolds number. Rheol. Acta 2015, 54, 85–108. [Google Scholar] [CrossRef]
  16. Heymann, L.; Peukert, S.; Aksel, N. On the solid-liquid transition of concentrated suspensions in transient shear flow. Rheol. Acta 2002, 41, 307–315. [Google Scholar] [CrossRef]
  17. Das, P.; Samanta, S.K.; Dutta, P. Rheological Behavior of Al-7Si-0.3Mg Alloy at Mushy State. Metall. Mater. Trans. B Process. Metall. Mater. Process. Sci. 2015, 46, 1302–1313. [Google Scholar] [CrossRef]
  18. Torrez, C.; André, C. Simulation of a Rushton turbine mixing yield stress fluids: Application of the Metzner-Otto concept. Chem. Eng. Technol. 1999, 22, 701–706. [Google Scholar] [CrossRef]
  19. Esmaily, M.; Shahabi-Navid, M.; Mortazavi, N.; Svenssona, J.E.; Halvarsson, M.; Wessén, M.; Jarfors, A.E.W.; Johansson, L.G. Microstructural characterization of the Mg–Al alloy AM50 produced by a newly developed rheo-casting process. Mater. Charact. 2014, 95, 50–64. [Google Scholar] [CrossRef]
Figure 1. A Schematic illustration of the RheoMetalTM process with (1) scooping up metal from the furnace, (2) casting the EEM around the steel rod, (3) first stirring disintegrating the EEM, (4) the secondary stirring using an impeller for slurry conditioning and (5) the slurry ready for pouring into the shot sleeve.
Metals 12 01221 g001
Figure 2. Schematic of a Rushton turbine.
Metals 12 01221 g002
Figure 3. Microstructural illustration from (a) 2 kg shot volume and (b) 20 kg shot weight, etched using Weck’s reagent. Dark areas were solid in the slurry before quenching. Lighter areas were liquid, contained higher Si contents, and solidified during quenching.
Metals 12 01221 g003
Figure 4. Illustration of the general fit. The line is the ideal fitting. The markers with a red circle are results from the 20 kg shot weight, and those indicated with a red cross are the 2 kg shot weight experiments. The points within the dashed circle are the deviating points arising from the largest shot weight of 20 kg, with melt temperatures above 768 °C.
Metals 12 01221 g004
Figure 5. The apparent viscosity as a function of (a) fraction solid where the solid line shows the upper bound for the 20 kg shot weight and the lower bound generated by shot weighs 7 kg and below, (b) shear rate dependence and (c) the influence of geometry.
Metals 12 01221 g005
Figure 6. The relative contributions to the apparent viscosity from (a) static and (b) dynamic components in the Herschel–Bulkley model. The 20 kg shot weight dominates the higher range of static viscosity contribution (markers with a red circle) compared to the 2 kg shot samples (markers with the red cross). The higher dynamic contribution arises from the 2 kg shot weights (markers with a red cross), and the 20 kg shot dynamic contribution is shown with the red circled markers.
Metals 12 01221 g006
Figure 7. Illustration of the factors influencing the static behaviour with the shear strength, τ y , and the structure corrected shear strength compared to the data from Pan et al. [7] for the equiaxed GR A356 (dash-dotted line) and the more globular MHD A356 (dashed line) microstructures.
Metals 12 01221 g007
Figure 8. Factors included in the dynamic portion of the viscosity with: (a) the consistency index as a function of the solid fraction with the 10 and 7 kg shot weight experiments circled and (b) the shear-thinning exponent with data from Ma et al. [11] (dashed line) and Modigell et al. [6] (red dots) for comparison. Note that the orange markers are the experimental measurements, and the solid lines are the model predictions for the different shot weights with the colour-coding in the figure legend.
Metals 12 01221 g008
Table 1. Fitted parameters and comparison to literature.
ParameterCurrent StudyLiterature
Shot weight (kg)2010752-
a0.941.000.830.6711 [11]
b1.261.511.491.471.750.725 [11]
c−0.12−0.12−0.12−0.12−0.12−0.12 1, −1.87 2 [7]
d0.030.030.030.030.030.03 1, 0.43 2 [7]
r P 1.061.001.201.511 [11]
B E 523439434523516-
η 0 (Pa s)0.0010.0010.0010.0010.0010.59 [11], 0.001–0.0014 3 [16,17]
1 Grain refined A356 (GR A356), 2 Magnetohydrodynamically stirred A356 (MHD A356), 3 Above the melting point.
Publisher’s Note: MDPI stays neutral with regard to jurisdictional claims in published maps and institutional affiliations.

