Article

A Study on the Development of an Optimization Algorithm and Determination Procedure for Toughness Deterioration Characteristics through Flux Core Arc Heat Input Control of ASTM A553-1 (9% Nickel Steel)

1
Research Institute of Medium & Small Shipbuilding, Yeongam 58457, Korea
2
Automotive Materials & Components R&D Group, Korea Institute of Industrial Technology, Gwangju 61012, Korea
*
Authors to whom correspondence should be addressed.
Metals 2022, 12(7), 1213; https://doi.org/10.3390/met12071213
Submission received: 10 June 2022 / Revised: 6 July 2022 / Accepted: 13 July 2022 / Published: 18 July 2022
(This article belongs to the Special Issue Welding Metallurgy)

Abstract

:
The International Maritime Organization has adopted the reduction of carbon dioxide emissions from ships as an important priority, and is continuously strengthening its regulations on marine air pollution. By 2035, it is expected that LNG-powered ships will account for more than 50% of the available ships. Accordingly, the demand for equipment related to LNG-fueled ships is expected to grow as well, requiring the development of a lot of equipment. However, the characteristics of LNG-powered ships mean that they require a high level of reliability and long history of operating reliably. Even when a product is developed, numerous demonstrations and quality assurance measures are needed to reach the technological level ship owners and customers require. Therefore, an optimization procedure to determine the welding quality for 9% Ni steel is necessary. In this study, the heat input criteria that induce brittle fracture characteristics were analyzed to optimize the flux core arc welding process for 9% Ni steel used in the manufacture of LNG storage tanks. We developed an optimization algorithm (Welding Current, Arc Voltage, Welding Speed) that can select a group of fracture conditions by examining the tendency of the tissue to brittle fracture due to excessive heat input among potential quality issues of cryogenic steel. Capable of selecting the range in which quality deterioration occurs, determining quality of a weld and avoiding the range in which toughness degradation occurs, through which a process to derive high quality 9% Ni welds is proposed.

1. Introduction

The International Maritime Organization (IMO) has adopted the goal of reducing ship carbon dioxide emissions by 40% by 2030, and by 70% by 2050, compared to 2008 levels. If this is achieved, it is expected that more than 80% of the ships currently in operation will not be in compliance with these regulations. For this reason, there is an increased number of orders for eco-friendly ships, and it is expected that LNG ships will become dominant in the market for a while; furthermore, the development of ships and equipment that can reduce the emission of pollutants or increase energy efficiency is being accelerated to comply with emission regulations. An eco-friendly ship is one that uses eco-friendly energy as a power source, or that is equipped with marine pollution reduction technology or energy efficiency improvement technology. Of the eco-friendly ships, the ship type with the greatest carbon dioxide reduction effect and the greatest impact on the shipbuilding industry, which is focused on the construction of large ships for exports of goods, is eco-friendly energy propulsion ships that are propelled using eco-friendly fuels such as LNG, LPG, and hydrogen. Among these eco-friendly energy propulsion ships, LNG dual fuel propulsion ships are currently the most dominant type and are expected to account for more than 50% of the available ships by around 2035 [1,2,3,4]. LNG fuel ship equipment is largely categorized into fuel tanks and fuel supply system components, and the characteristics of LNG carriers mean that a high level of reliability and accumulated track record is required of such equipment. Even when a product is developed, it will not gain a track record if ship owners or customers do not purchase it. A product that is not verified or has low reliability cannot be used for an expensive LNG carrier. The only way to accumulate a track record is to install the equipment on an LNG carrier for verification, and to operate it on a test bed that simulates an actual marine environment. In the LNG ship industry, the shipowner’s preferences are a very important factor. Additionally, it is necessary to consider that equipment commercialization takes a long time, and the quality of related equipment must be secured first. An LNG fuel tank should operate continuously during its design lifetime without maintenance once its operation starts as announced by the current regulations and laws, and it is recommended to supply LNG stably according to the KGS AC 115 standard [5,6].
9% Ni steel, the material used for LNG storage tanks, is similar in strength to 680Mpa class high tensile steel, and is usually used in the range of −160~−170 °C after QT treatment has been applied due to the characteristics of an LNG tank. 9% Ni steel has high strength and excellent weldability. It has high impact toughness at cryogenic temperatures, and has a lower cost than stainless steel, so it is often used in manufacturing LNG tanks. Although the impact toughness standards of 9% Ni steel differ depending on the regulations applied in the process of manufacturing LNG storage tanks, most of them regulate Charpy impact absorption energy of 34 J or more. However, the EEMUA (Engineering Equipment and Materials Users Association) regulates a minimum absorbed energy of 100 J at −196 °C and at least 35 J for the welding metal. The toughness of tempered martensite, which is the characteristic of 9% Ni steel, is very good, but the heat-affected resistance of a weld during welding deteriorates as heat input increases. This, in turn, causes a decrease in the strength of a welding metal, and thus heat input needs to be limited [7,8].
Recently, flux core arc welding (FCAW) materials have also been developed, and applied for roof frame welding. MIG welding is currently excluded because of its limited welding workability, and the latest welding methods, such as laser or plasma welding, may be applied depending on the welding area. Consequently, process optimization studies are required to improve product reliability [9,10,11]. Various arc welding methods are widely applied for many industries, especially for the shipbuilding industry.
Looking at earlier studies on LNG storage tanks, Kim studied laser welding as a new welding process for manufacturing the TGZ MARK III membrane tank made of STS304L, as an alternative to the GTAW process that has been used thus far [12,13]. Baba reviewed the applicability of a new ultrasonic flaw detection method TOFD (Time of Flight Diffraction) as a non-destructive inspection method for a weld of an A5083-O spherical tank for an LNG carrier. He developed a multi-channel TOFD device that is capable of record-based aged deterioration observation or maintenance inspection [14]. Through finite element analysis and measurement of welding residual stress during the welding of Invar steel, Zhao found that there is a residual stress that cannot be ignored in the fatigue life of an LNG carrier during a sloshing impact for an Invar forced LNG tank, due to the maximum tensile residual stress of 200 MPa or more in the welding area [15,16,17,18]. As seen above, the welding technology research applied to an LNG tank has mostly dealt with welding technology to manufacture the membrane TGZ MARK III tank using STS304L, Al5083-O, Invar steel, etc. Furthermore, it is biased towards weldability research as well as research on improving bead shape to prevent fatigue cracks. Of course, while research into improving existing processes to further the productivity of a cryogenic steel weld has very important academic significance, basic research to upgrade the LNG storage tank-related industry must become a priority, as the current process optimization R&D to apply a new welding process is lacking.
In particular, brittle fracture characteristics are common for welding defects that can be created in a fusion zone when welding 9% Ni steel, due to the reduced welding quality caused by an excessive heat input. For the welds of most offshore structures, the amount of heat is limited to reduce the probability of brittle fracture. When the amount of heat input is outside the standard range, post-heat treatment is required. While there have been many previous studies on alloying elements as well as on the effect of cooling rate and texture on weld toughness, there is little basic research on the cryogenic welding steels developed so far, as well as on welding conditions such as high efficiency and high adhesion. Considering the recent increase in demand for the 9% Ni steel used in the production of LNG storage tanks, basic research on the possibility of brittle fracture due to excessive welding heat input is required.
Therefore, in this study, the brittle fracture characteristics that may occur during the flux core arc welding process (FCAW) for 9% Ni cryogenic steel used to manufacture an LNG storage tank were analyzed. This study establishes the brittle effect and quality degradation criteria related to excessive heat input and suggests the optimal process variables to derive the appropriate range of heat input.

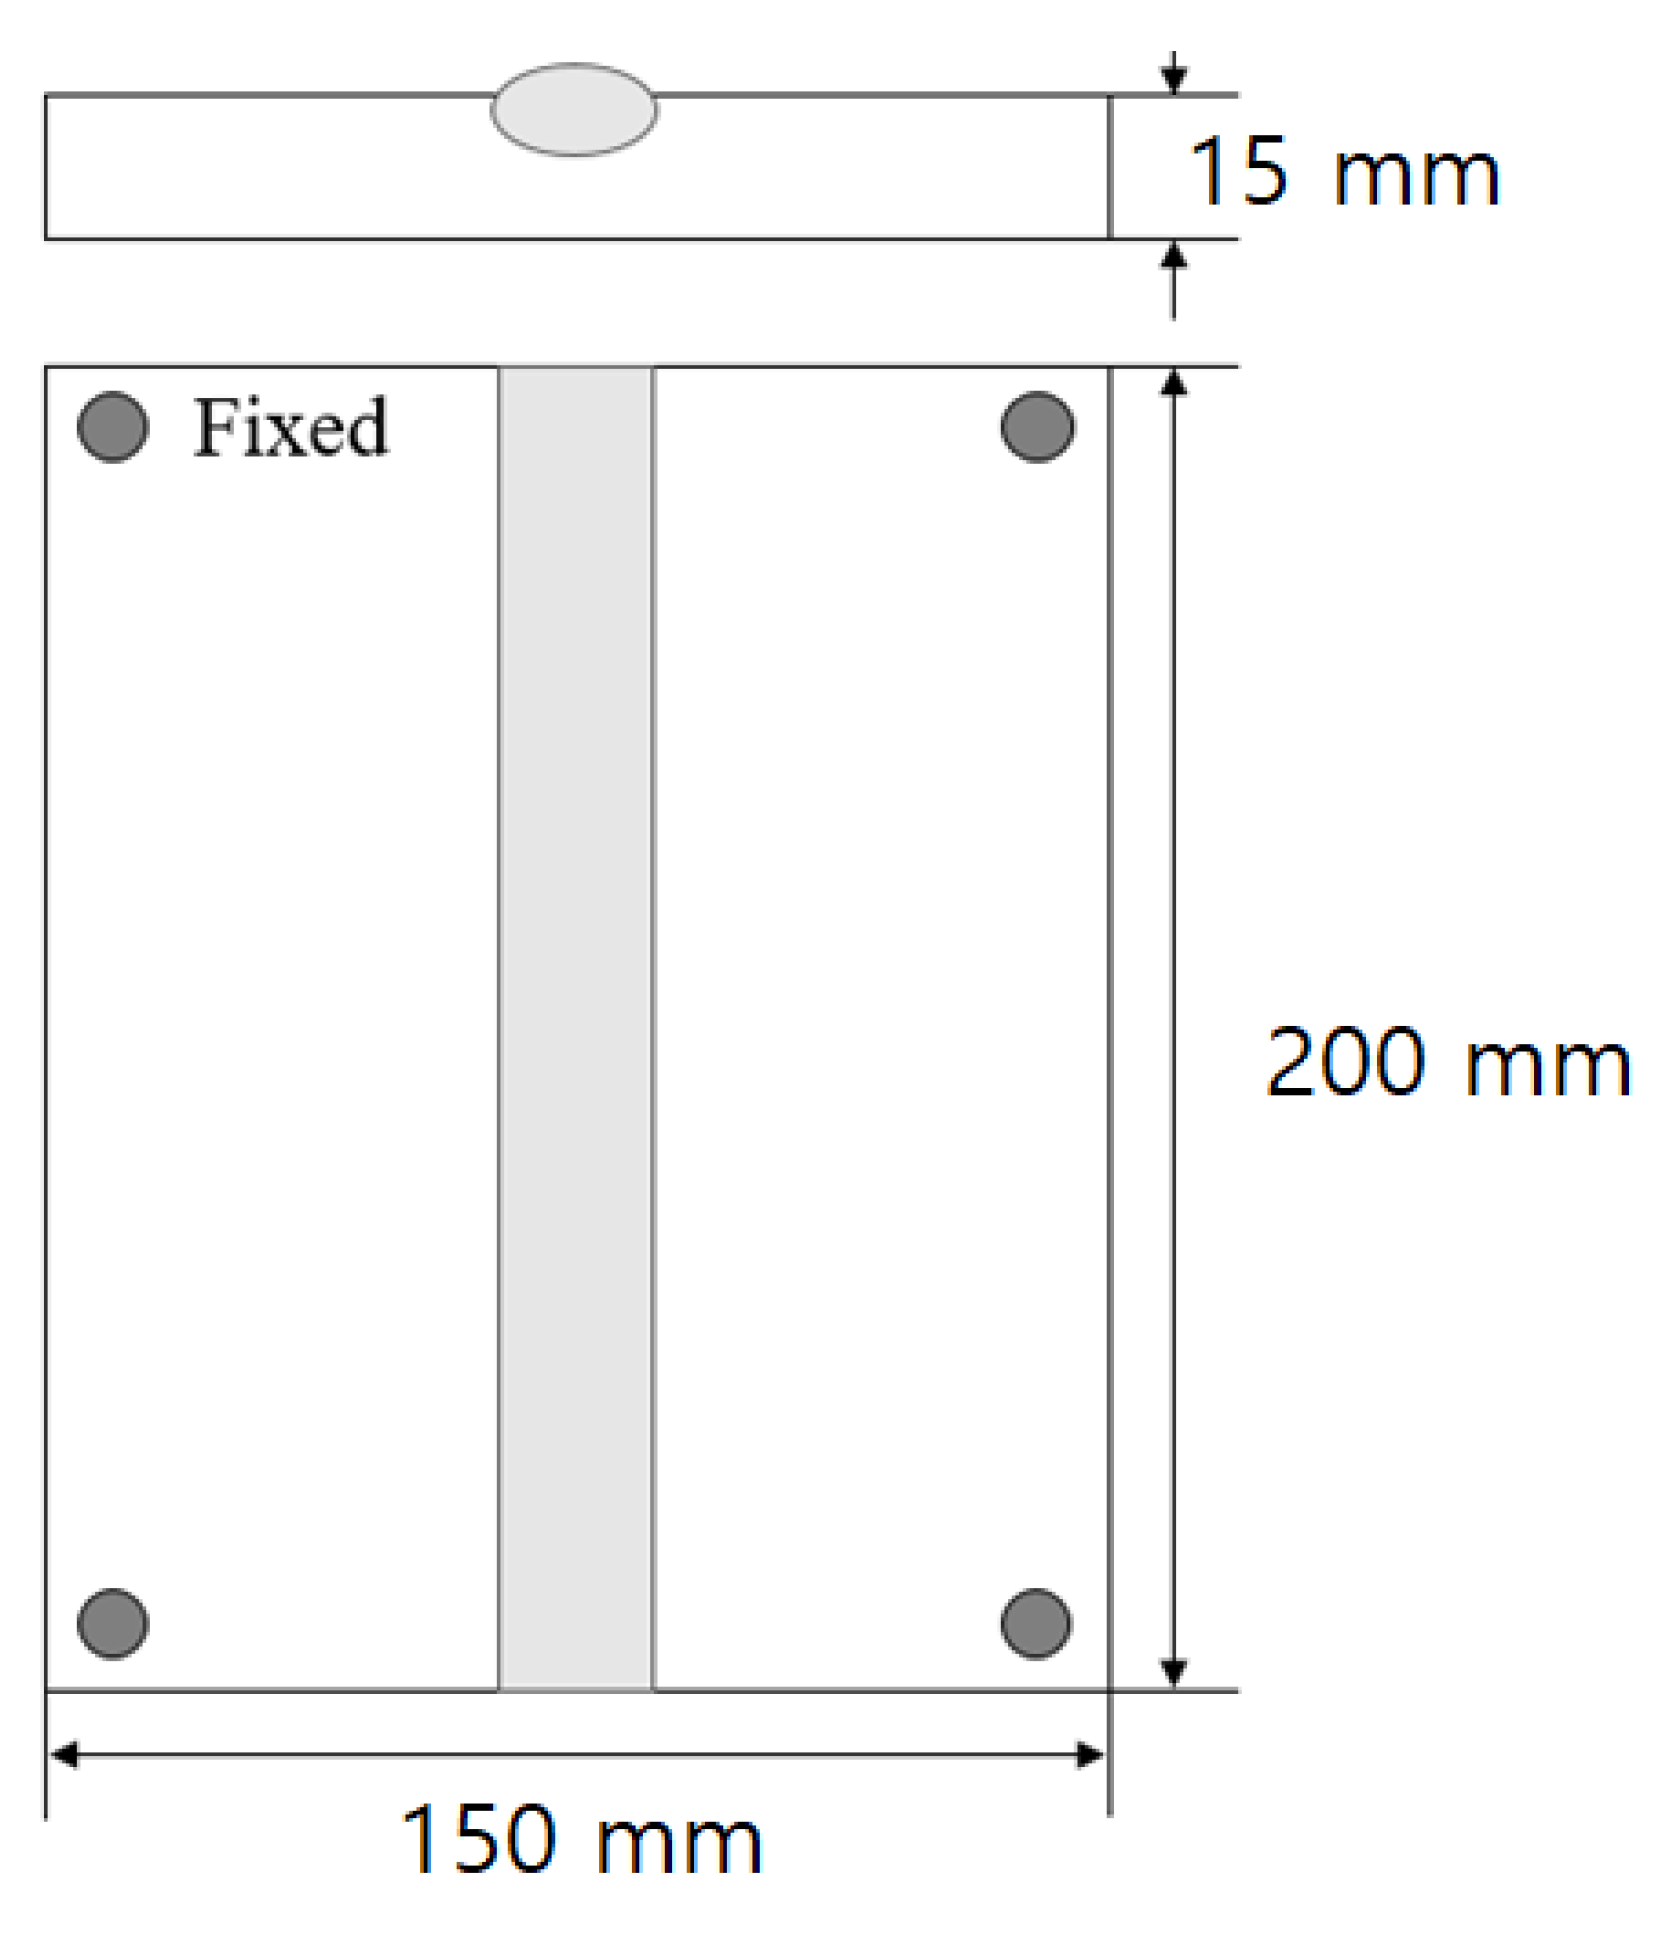
2. Experimental Works

The steel used in this study was A-553-1, a 9% Ni steel, and a rolled plate with a tensile strength of 651 MPa and a thickness of 15 mm was used. Table 1 shows the chemical composition of the 9% Ni cryogenic steel used in this experiment, and the mechanical properties obtained from the tensile and hardness tests are shown in Table 2.
In this study, the amount of heat input generated during welding was calculated after welding a 9% Ni cryogenic steel specimen, and the resulting bead shape and mechanical properties were measured. For welding experiments, bead-on-plate welding was carried out by following the method shown in Figure 1, and welding was performed by applying the constraint conditions of four points. The welding method was flux core arc welding, and it was welded from the bottom up according to the welding conditions of a test piece. The welding rod was made of the same material as the base material, and a flux core wire with a diameter of Ø1.2 mm was used. If impurities adhere to the base material, it will adversely affect the welding. Therefore, the entire welding surface was cleaned with ethyl alcohol and sandpaper before welding.
In this experiment, 100% CO2 was used as a shielding gas for welding, and the FCAW equipment diagram is shown in Figure 2. The equipment used in the experiment are a 600 A class welding machine (ProPAC, HYOSUNG, Mapo-gu, Seoul, Korea), torch, welding feeder, direct welding carriage and rail.
FCA welding is an improved welding method that allows more efficient welding while utilizing the advantages of existing GMA (Gas Metal Arc) welding. Therefore, welding current, arc voltage, and welding speed, which are the same welding parameters as GMAW, were selected as the main variables. The input conditions for the flux core arc welding experiment are the welding current, arc voltage, and welding speed, which can directly affect the bead height/width and the quality of a weld. The output conditions were selected as the bead shape, impact amount, and the fracture surface that can be used to judge the weldability. Figure 3 shows a schematic diagram to measure the bead shape of a weld [19]. The Full Factorial Design, which can estimate all factor effects of the measured data response for each of the input conditions and maximize the interaction effect of higher orders, was applied as a plan for this experiment. As the input variables, based on preliminary experiments a welding current of 150~170 A, an arc voltage of 21~25 V, and a welding speed of 0.3~0.4 m/min were selected as appropriate. A total of 18 (9 × 2) experimental conditions were created. Table 3 shows the experimental conditions of flux core arc welding.

3. Results of Flux Core Arc Welding

3.1. Measurement of Weldment Geometry

It was found that welding was performed properly on the surface of a test piece for each process parameter, and there were no pores or defects in the 9% Ni steel, a cryogenic steel. To measure the cross-sectional shape of the weld, an etching solution (90% Ethanol 10% Nitric) was mixed and the shape of the weld was measured using an optical microscope system after the etching solution was sprayed on the cross-section. Table 4 shows the welding shape and measurement results obtained from the optical microscope.

3.2. Measurement of Impact Energy

A Charpy impact test was performed on each specimen to understand the deformation and fracture process of the weld as well as to apprehend its quality and fracture characteristics based on the measured toughness. Factors affecting the impact value of a material are the material type, the grain of microstructure, and the impact speed. The material toughness was evaluated by opening a notch in the heat-affected zone of the Charpy specimen. For the measurement, a length of 55 mm and a square cross-section of 10 mm × 10 mm were made, the notch angle was 45° and a V-shaped notch with a depth of 2 mm was applied according to ASTM E 23-02. Figure 4 shows a schematic diagram of the specimen for the Charpy impact test.
In the Charpy impact test, the specimen is fractured under a momentary load from 1 × 10⁻³ to 5 × 10⁻⁵ s and the material strength is calculated based on the amount of energy required for this failure. The impact tester used in this experiment can hit a maximum impact energy up to 300 J, and the height of a weight that rises to the opposite side is determined by the energy excluding the energy used to destroy the specimen. Using this, it is possible to calculate the impact energy per unit area used to break the specimen. Therefore, the impact amount was calculated by multiplying the energy per unit area used for the fracture of this Charpy impact specimen by the fracture area of the specimen.
The impact toughness of a heat-affected zone in the specimen welded by following each process was monitored, and the impact amount of 34 J or more, which is the standard condition for a cryogenic steel, was confirmed, validating that it has weldability appropriate for a product operating at cryogenic temperatures. Table 5 and Table 6 show the results.

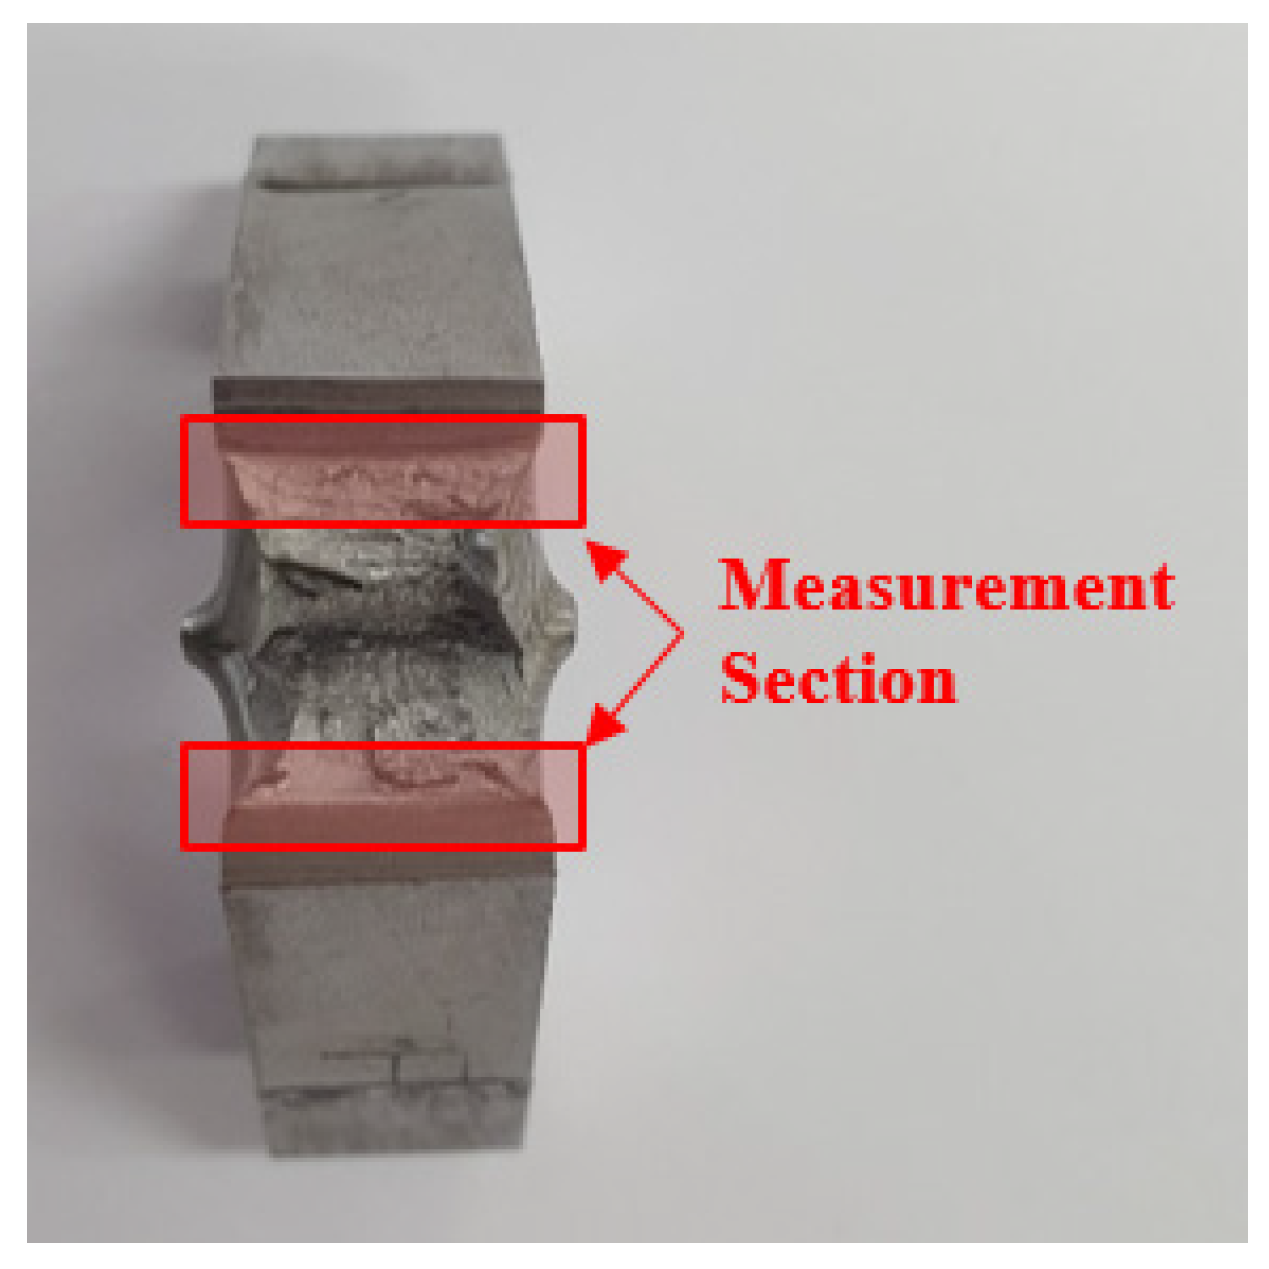
3.3. Analysis of Brittle Fracture of Heat-Affected Zone

A brittle fracture occurs even under a typically acceptable low load and develops a crack instantaneously, often leading to catastrophic damage to the structure. Of the various destruction phenomena, this one is the most dangerous as it can cause destruction of structural machinery and equipment and even produce a large-scale accident [20,21]. In steel, the propagation speed of a brittle crack can be as fast as 2000 m per second. For this reason, it is of critical importance to determine whether or not a brittle force is at work depending on the mechanical properties or chemical composition of a weld. The important information that can be obtained immediately from the fracture surface of the Charpy impact test in the heat-affected zone is largely classified into two types. The first is whether the fracture is a ductile fracture or a brittle fracture, and the second is information on where a crack starts and propagates. In this study, the analysis of crack initiation was excluded because crack initiation induces fractures by opening a notch. As shown in Figure 5, in a ductile fracture, a fracture surface is formed like a tear, and a brittle fracture includes the characteristics of a flat fracture surface, so the ductility and brittle influence were determined based on such a fracture surface.
The plastic deformation formed on a fracture surface has the form of brittle cleavage because the structure is hardened by the generation of impurities in the form of fine particles, such as oxides, carbides, nitrides, etc., inherent in the material, and also by excessive heat input. Therefore, in this study, as shown in Figure 6, the influence of brittle fracture under each of the welding process variables and heat input was analyzed after confirming the fracture type using a SEM (scanning electron microscope) at the analysis location where the cracking of a fractured impact specimen begins.
The shape in which a fracture progresses can be broadly categorized as either a cleavage fracture or a dimple fracture. When a cleavage fracture is created based on the two fracture shapes, it is called a brittle fracture characteristic. It is called a ductile fracture characteristic when a dimple fracture is created. These are named in the prior studies and used as a theory to predict a fracture behavior. Table 7 shows the fracture behavior of a heat-affected zone of 9% Ni steel, a cryogenic steel, based on such fracture surface determination criteria. As for the criteria for classifying the fracture toughness group by the amount of Sharpy impact, the tendency of brittle fracture was confirmed by selecting the range for the amount of Sharpy impact of the test piece in which cleavage occurs in the fracture surface.

4. Discussion

4.1. Brittle Fracture Behavior

There have been many studies on alloying elements, as well as on the effect of cooling rate and texture on weld toughness. However, basic research on cryogenic welding steel developed so far and the welding conditions such as high efficiency and high adhesion are insufficient. Given the recent increase in demand for the 9% Ni steel used to produce LNG storage tanks, it is required to conduct basic research on the possibility of brittle fracture due to excessive welding heat input.
To analyze the brittleness of 9% Ni steel as basic research, the Charpy impact test was performed based on the welding process and process variables to cause a fracture to a specimen. In order to define an appropriate range of heat input, the correlation between the cross-section of the fractured specimen and the amount of heat input from the welding was determined. To check the brittleness of the weld, the fracture behavior results collected from the fractured section obtained from the heat-affected zone impact test were used, while the following Formula (1) was used for the amount of heat applied to each weld.
Hi = 60∙EI (wv)−1
Hi is the heat input of flux core arc welding, E is arc voltage (V), I is welding current (A), w is bead width (mm), and v is torch speed (cm/min). Table 8 shows the heat input results according to the welding process and process variables, and includes the factors necessary for heat input calculation and the fracture behavior results.
To analyze the brittle force of 9% Ni steel, a cryogenic steel, the distribution between the Charpy impact test result and the welding heat input was reviewed to determine an appropriate range of heat input applied to the weld. Through the analysis, it was confirmed that the heat input was between (2.66 × 10¹²~4.67 × 10¹²) J/cm2. Although the heat input range of flux core arc welding includes a sufficient amount of impact compared to the base material, it can be verified that brittle force in the form of cleavage fracture was applied due to the reduction in toughness that resulted from an excessive heat input and tissue hardening. As can be seen from Figure 7, when the arc heat input is in the range of (3.75 × 10¹²~4.29 × 10¹²) J/cm2, it was confirmed that the shock amount started at 49.97 J and decreased to 42.13 J, indicating there was a brittle force in the form of cleavage fracture. The fracture surface analysis can determine the brittle action on the weld and heat-affected zone in advance according to the process variables, and can be used as data to avoid the suggested range and secure the weld toughness.
The criterion for the amount of heat input (3.75 × 10¹²~4.29 × 10¹²) J/cm2 of the brittle fracture characteristic mentioned above is a quality degradation determination score. It can be used to assess the weldability of a welding process, and is an indicator of whether a brittle fracture can occur when the heat input is located within a specific range, leading to the brittle fracture determination criteria shown in Table 9. These quality degradation determination scores can be used as learning data to determine the brittle effect and fracture caused by heat input, and can serve as important data that enable us to avoid the problem of toughness degradation due to an excessive welding residual stress in 9% Ni steel weld where flux core arc welding is applied.

4.2. Discriminant Analysis

The 9% Ni steel welding quality determination system to be applied in this study uses a technique to determine a group through quantitative evaluation of data by making a mathematical model based on the collected data and learning the characteristic data between groups. Therefore, the goal is to define a criterion that can help determine the quality of the process by learning the welding quality results between the input and output variables obtained. Generally, the welding process is a complex process with a number of multivariate interactions, such as mechanical strength and fracture characteristics depending on the process variables, so a high accuracy discrimination method that applies a range of techniques must be used. Here, the accuracy is an index that can quantitatively confirm how much the actual group and the group classified by the model match when classifying data using the discriminant analysis [22,23,24]. To determine the quality of the process, the process data was learned using the SVM technique. SVM (Support Vector Machine) is an algorithm created by Vapnik in 1995. Based on the VC (Vapnik–Chervonenkis) theory, it originated from the problem of finding the hyperplane w∙x + b = 0 that differentiates two classes that support linear separation and maximize the margin [25].
Here, w is a weight vector, x is an input vector, b is a reference value, and the SVM technique sequentially performs minimal optimization of complex calculations in the QP (Quadratic Programming) process. Essentially, the SVM is a classifier specialized in classifying two categories. The closest data of each group is called a support vector, and an optimal separation boundary is set at the point where the distance between the support vectors of each group is maximized to classify the belonging group.
The variables used for learning in the brittle fracture characteristics determination model are welding process parameters (Welding Current, Arc Voltage, Welding Speed), bead shape (Top-Bead Width, Top-Bead Height), heat input, impact energy, and fracture behavior. A total of 144 data were entered with 8 variables. As a group to determine the brittle fracture characteristics, the Cleavage Group was defined as 1 and the Dimple Group was defined as 0. The accuracy was verified by reviewing whether the group predicted by the SVM method was discriminated identically to the actual group.
The training data to discriminate the brittle fracture characteristics is shown in Table 10. Table 11 and (Figure 8) quantitatively show the discrimination performance of the fracture characteristics groups predicted by the data learned in the SVM technique.

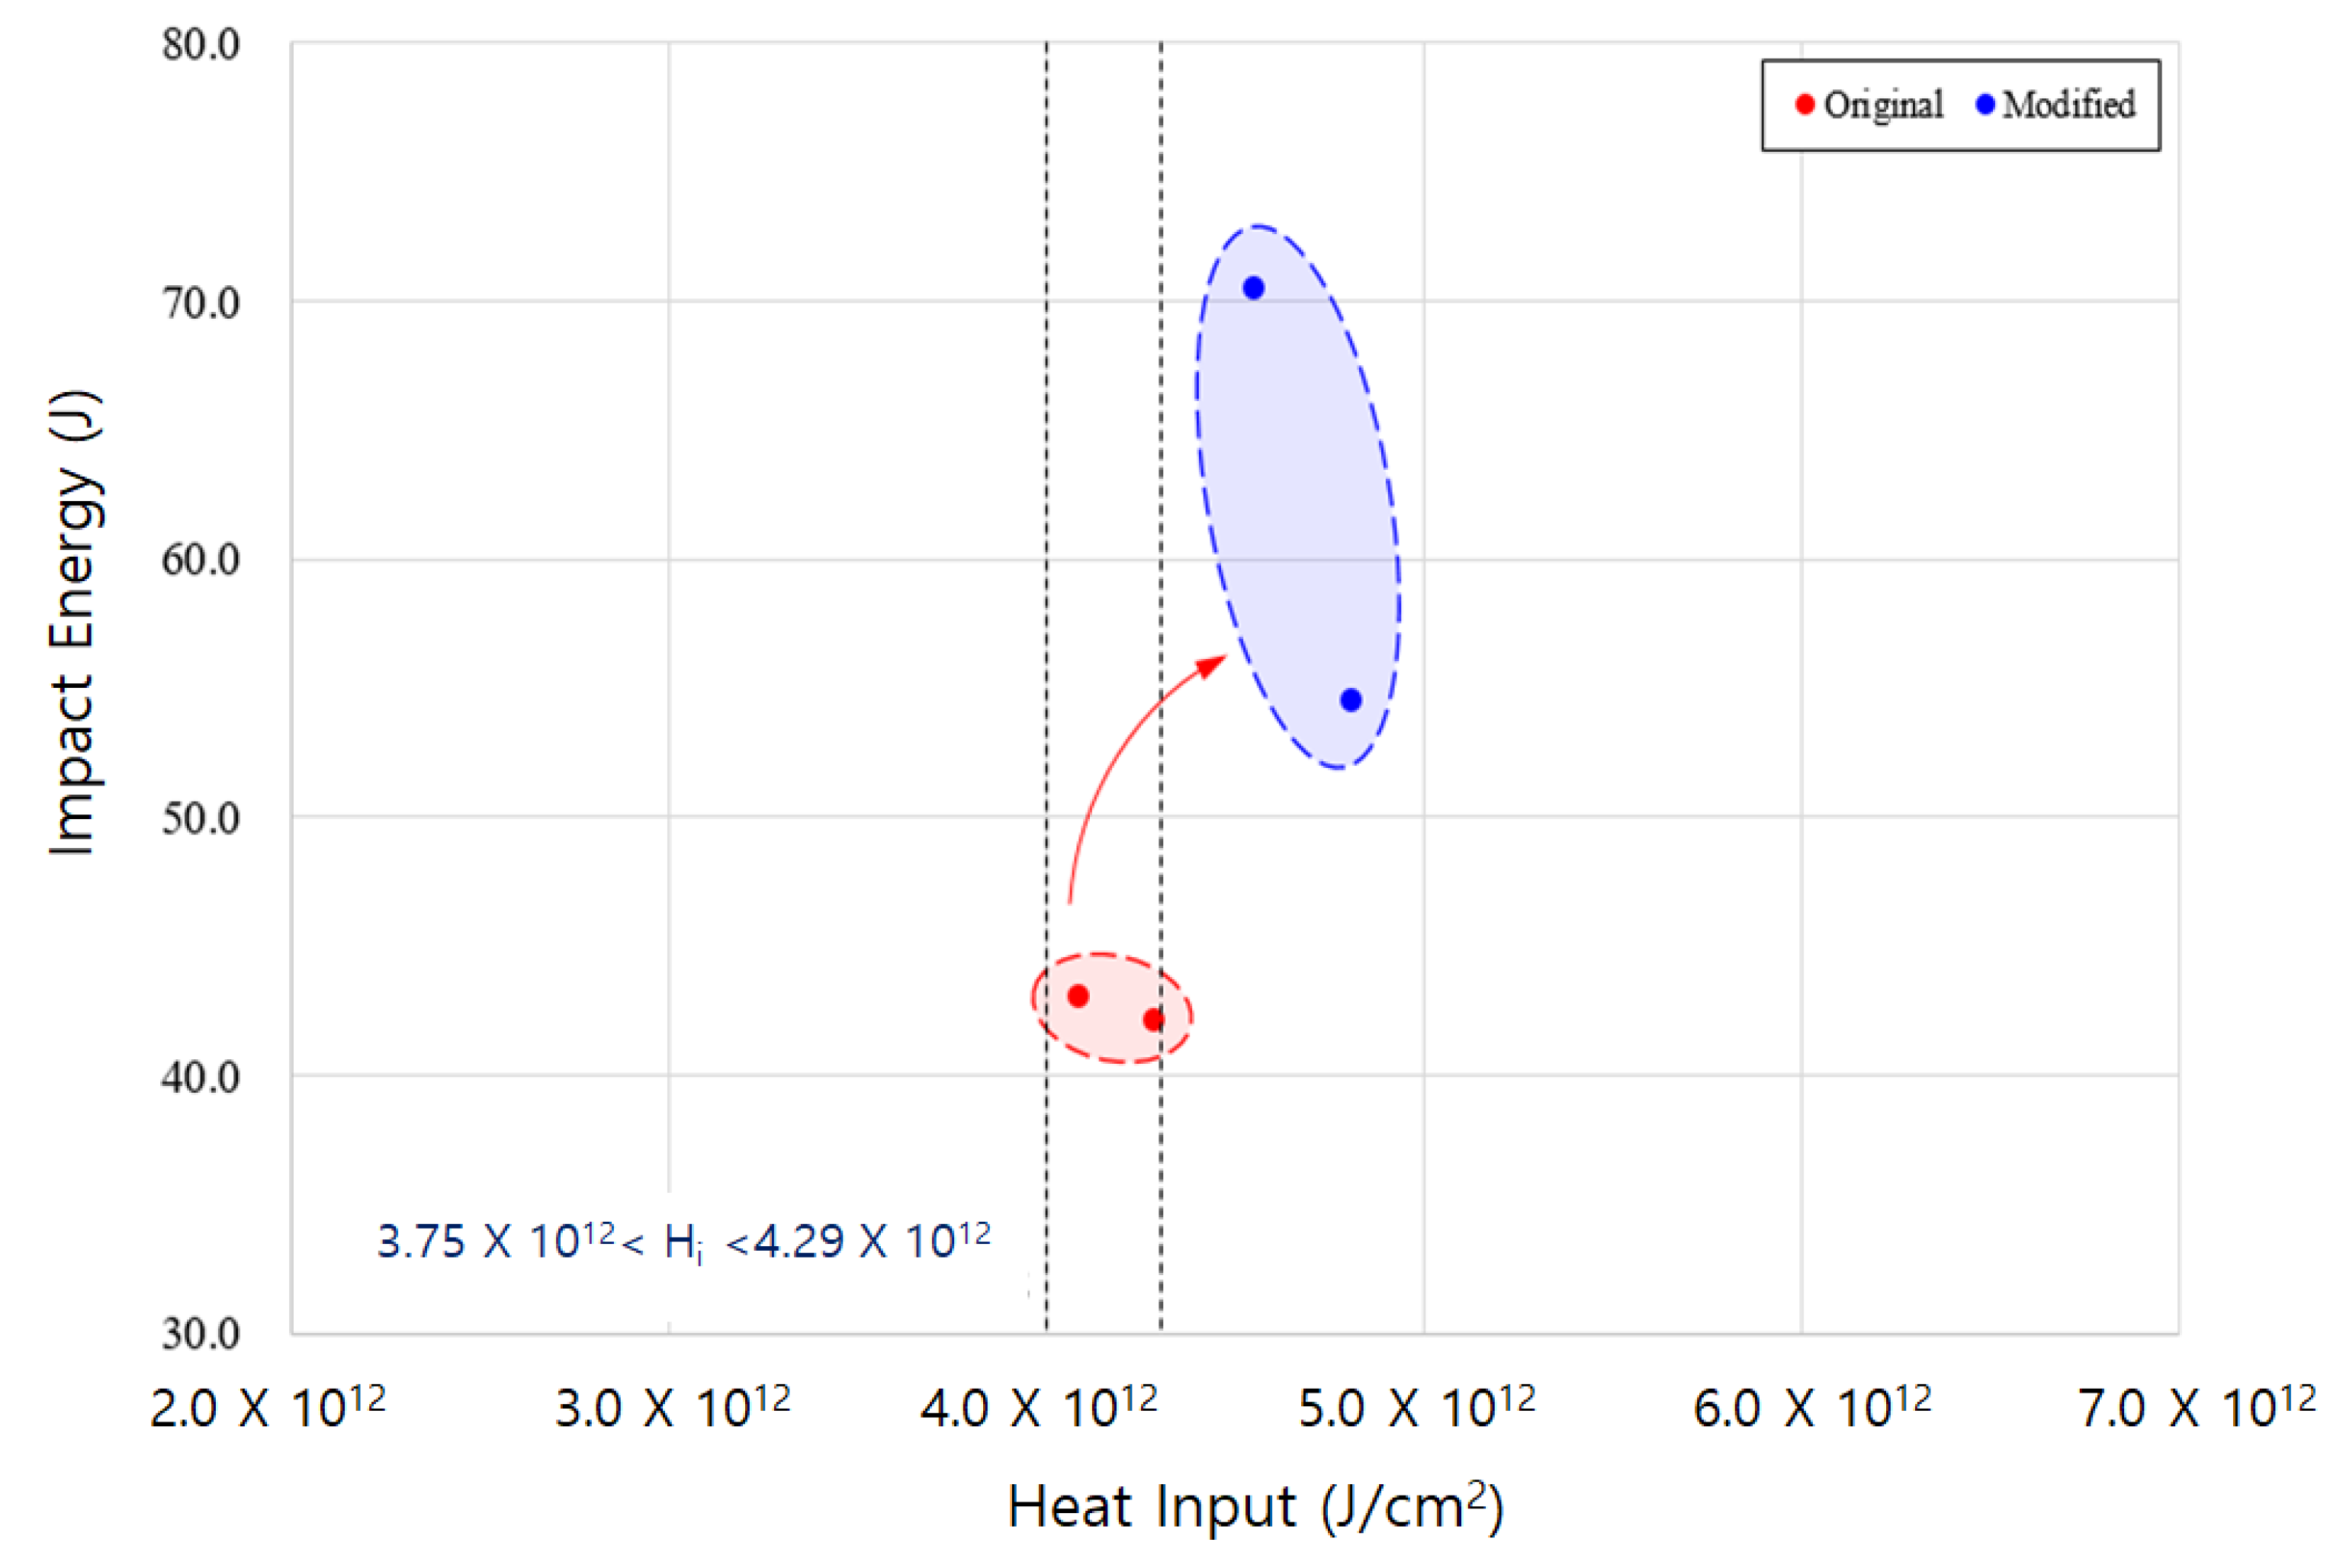
5. Optimization of Flux Core Arc Welding of 9% Ni Steel

5.1. Development of Mathematical Model Welding Parameters

Regression analysis is one of the analysis methods used to verify the quantitative relationship between cause-and-effect or effect-and-effect. As the welding process variables have a great influence on welding quality, it is an analysis method that can mathematically explain the correlation between input and output factors. When welding quality is affected by several factors in a complex manner, several independent variables x 1 ,   x 2 , x 3 ,   x k are prepared, and one dependent variable—i.e., welding quality y—can be explained with a regression equation, which is formulated as Equation (2). The predicted values of welding factors can be expressed as a second-order linear regression model by assuming their linear relationship with the input variables after reflecting the factor calculation capability of linear and nonlinear models.
Y i = β 0 + i = 1 k β i k i + i j k β i j x i x j + ϵ
Equation (2) can be rearranged as Equation (3) using the least squares method.
Y i ^ = β i ^ + i = 1 k β i ^ k i + i j k β i j ^ x i x j + c
In this study, Equation (3) can be expanded as Equation (4) since there are three input variables (k = 3).
Y i ^ = β 0 ^ + β 1 ^ x 1 + β 2 ^ x 2 + β 3 ^ x 3 + β 11 ^ x 1 2 + β 22 ^ x 2 2 + β 33 ^ x 3 2 + β 12 ^ x 1 x 2 + β 13 ^ x 1 x 3 + β 23 ^ x 2 x 3
Here, Y i ^ is the predicted quantity of welding factors, x i is the code unit of welding process variables and mechanical strengths, β 0 ^ ,   β i ^ ,   β i j ^ is the least-squares estimator of β 0 ,   β i ,   β i j and ϵ represents the error. To develop a second-order regression model, data must be collected from many experiments. However, there could be numerous experimental errors, and time and economic loss. Thus, the response surface analysis method was used to supplement this.
The mathematical prediction model of the bead shape (Top-Bead Width, Top-Bead Height) and impact energy developed using the regression coefficient and Equation (4) can be expressed using Equations (5)–(7).
W = 4.0366 0.1264 C + 0.0546 V 8.5917 S + 0.0004 C 2 0.0115 V 2
+ 0.0058 C V + 0.1333 C S 0.4250 V S
H = 2.1259 0.0802 C + 0.3100 V + 8.3833 S + 0.0004 C 2 0.0021 V 2
0.0007 C V 0.0283 C S 0.1500 V S
I   = 58.627 + 34.773 C 50.065 W + 6.724 H + 16.172 C 2 152.033 W 2
105.96 H 2 + 86.96 C W 152.2 C H + 313.473 W
To verify the performance of the mathematical model to predict quality factors derived from the welding process, the error range is shown in (Figure 9) by comparing the average value of welding factors actually measured in each test with the predicted welding factors. Table 12 shows the quantitative performance evaluation for the mathematical model. The ANOVA of the mathematical model showed the highest coefficient of determination for Top-Bead Width with a coefficient of determination of 98.9%, and the minimum coefficient of determination of 72.0% was found with the impact energy of the heat-affected zone. This result for the coefficient of determination can predict welding quality close to the coefficient of determination for the changes in welding process variables, and reflects the independence and interaction of factors affecting the regression model.

5.2. Optimization for Welding Process of 9% Ni Steel

Multi-objective optimization, a technique used in this study, searches for a non-dominant solution in an optimization problem with multiple objectives by mimicking the evolutionary process of an organism. By comparing and evaluating non-dominant solutions derived from multi-purpose genetic algorithms, trade-offs between objective functions can be understood, and ultimately, an optimal solution can be effectively derived. Due to these advantages, the multi-purpose genetic algorithm has been in the spotlight as a technique to deal with multi-purpose optimization problems in engineering, natural science, business administration, and social science [26]. The main purpose of an optimization algorithm is to find various excellent solutions, and this means convergence to the Pareto optimal solution set and diversity that indicates a uniform distribution of solutions. To use the multi-purpose algorithm widely, the weight and population of multi-objective functions are variously operated to evaluate the fitness, and the selection operation is performed to repeat the generation. Performance is determined by the number of iterations and convergence time. Based on this theorem, the schematic diagram of the MOO optimization method is shown in (Figure 10).
The multipurpose optimization problem can be defined as in Equation (8) below.
y   = f x = f 1 x , f 2 x , f n x e x = e 1 x , e 2 x , e m x 0 x = x 1 , x 2 , x m X ,   y = y 1 , y 2 , y m Y  
The multipurpose optimization problem can be described as a vector function mapping m parameters to n objectives. In Equation (8), x is a decision vector, X is a parameter space, y is an objective vector, and Y is an objective space. Additionally, e(x) is a constraint. The set of solutions to the multi-objective optimization problem consists of the objective vectors that cannot improve the value of any other function without decreasing the value of an objective function and also all corresponding decision vectors. These vectors are called the Pareto optimal solution. The mathematical definition of Pareto domination is as follows. Assuming a minimization problem and assuming that there are two decision vectors, it can be arranged as in Equation (9) [27,28,29]:
i { 1 ,   2 ,   3 ,   ,   n } : f i a f i b j 1 ,   2 ,   3 ,   ,   n : f i a f i b    
A program was constructed based on the multi-purpose optimization theory described above, and MATLAB (2019, The MathWorks Inc., Natick, MA, USA), a commercial numerical analysis program, was used to apply and modify the optimization technique. To optimize the welding process parameters for which brittle fracture characteristics were confirmed, the same 144 data in Table 10 learned in discriminant analysis were used. Table 13 shows the variables and levels that drive the multi-purpose optimization algorithm.
A range from the minimum (150 A, 21 V, 0.3 m/min) to the maximum (170 A, 25 V, 0.4 m/min) was chosen as the range of welding process variables in the multi-purpose optimization algorithm. Additionally, the brittle fracture characteristics were derived to have an index, within the selected process variables, that can be utilized to evaluate the quality deterioration characteristics for 9% Ni steel weld. The objective function is a mathematical model (Top-Bead Width, Top-Bead height, Impact energy) of the problem of an optimization system, and the constraint (Heat Input) provides a guide that ensures quality in a range that the system must avoid. Therefore, Equations (10)–(12) represent the objective function f(x) of an arbitrary system having x as a learning variable and the range of constraints required for the function [30].
O p t i m i z e   f C ,   V ,   S  
g C ,   V ,   S  
H i 4.29 × 10 12   J / cm 2 ,   H i 3.75 × 10 12   J / cm 2    
Based on the multi-purpose optimization algorithm defined as described above, Test No. 5 and 6 were selected to go through the optimization procedure, and to satisfy the limits according to the algorithm flow chart. Table 14 shows the welding process parameters that have been corrected in the optimization procedure, as well as the expected welding factors and groups.
Figure 11 shows the change in the quality characteristics of a weld according to the modified process variables. This shows that it is possible to secure the rigidity of a weld in the vicinity of a process area through the optimization algorithm function that improves the existing process variables that may cause brittle fracture characteristics, and that has the ability to avoid quality deterioration. In addition, the two raw data selected from the flux core arc welding process met all of the heat input limiting conditions that can cause brittle fracture characteristics, and the quality degradation characteristics found in the existing process variables were resolved by the modified process variables.

6. Conclusions

This study optimizes the flux core arc welding process for 9% Ni steel, which is mainly used to manufacture LNG storage tanks. Through experimental research, the following conclusions could be obtained by improving the process variables that caused quality deterioration after analyzing the heat input criteria that cause brittle fracture characteristics and learning it in the discrimination system.
(1).
An appropriate weldability was confirmed by measuring the bead shape, impact energy, and fracture surface of a weld obtained from the flux core arc welding experiment, and it was found that a decrease in toughness occurred due to excessive heat input. Therefore, the criteria of heat input at which the brittle fracture surface is created is (3.75 × 10¹²~4.29 × 10¹²) J/ cm2 and the impact energy started from 49.97 J and decreased to 42.13 J, which is selected as the criteria for quality deterioration.
(2).
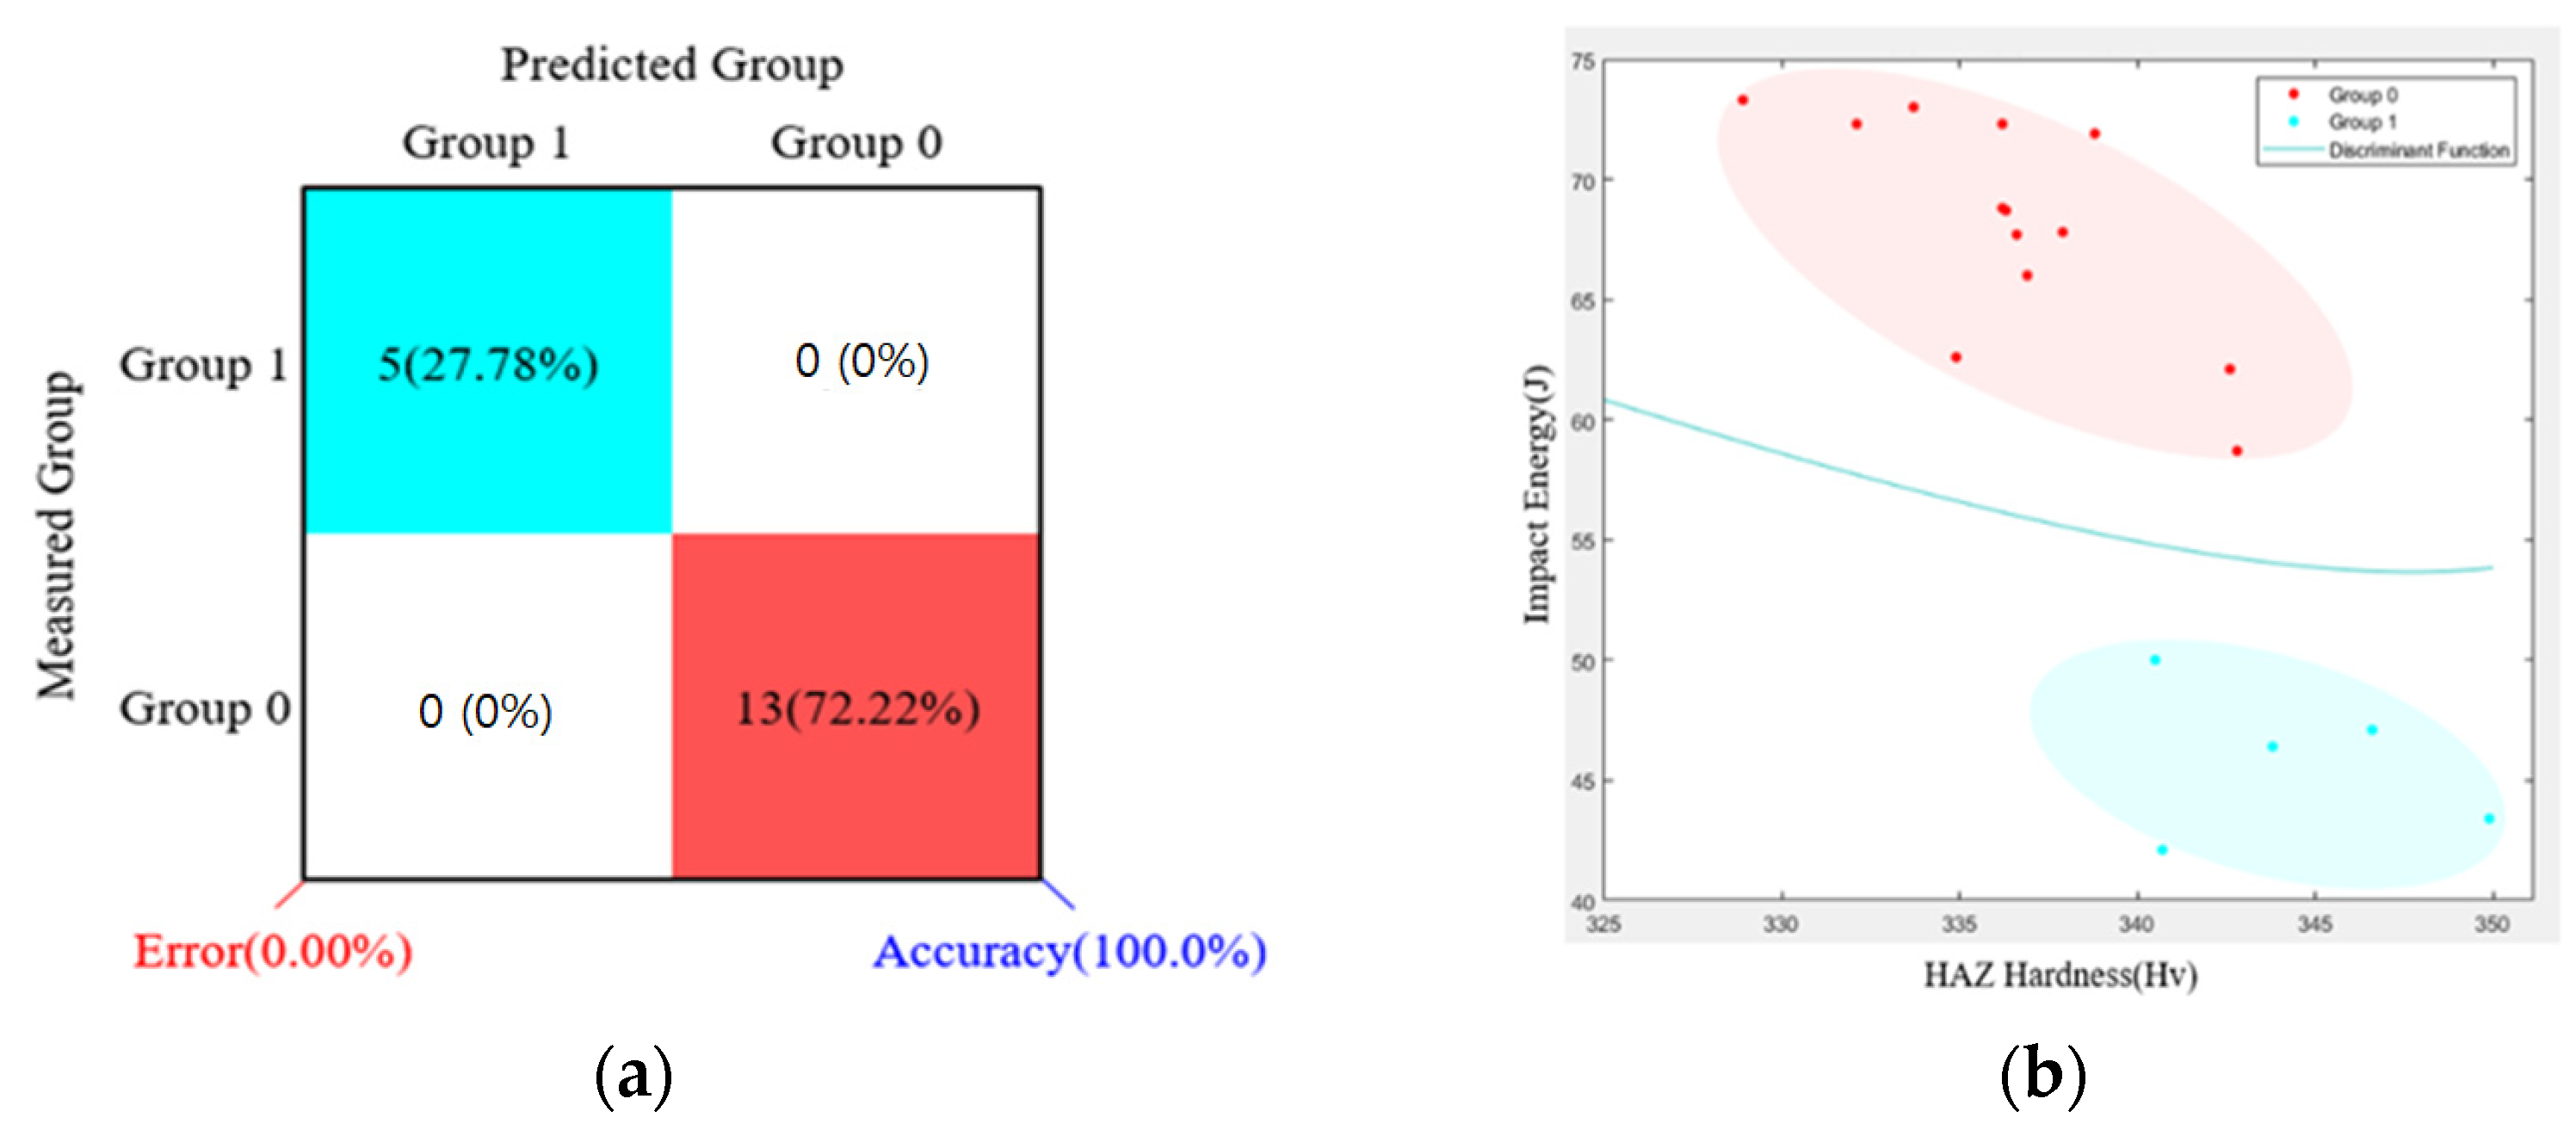
To determine the brittle fracture characteristics of 9% Ni steel according to the welding process variables and the amount of heat applied by a bead shape, the data of the input and output variables of welding process were learned in the SVM technique, and it was determined whether a brittle fracture group with deteriorated quality was accurately identified. When the input variables for a welding experiment were entered into the learned system, it was found that the group in which the quality deterioration occurred was predicted with 100% accuracy. This discrimination function was used in a system to determine the deterioration of a weld and improve the process.
(3).
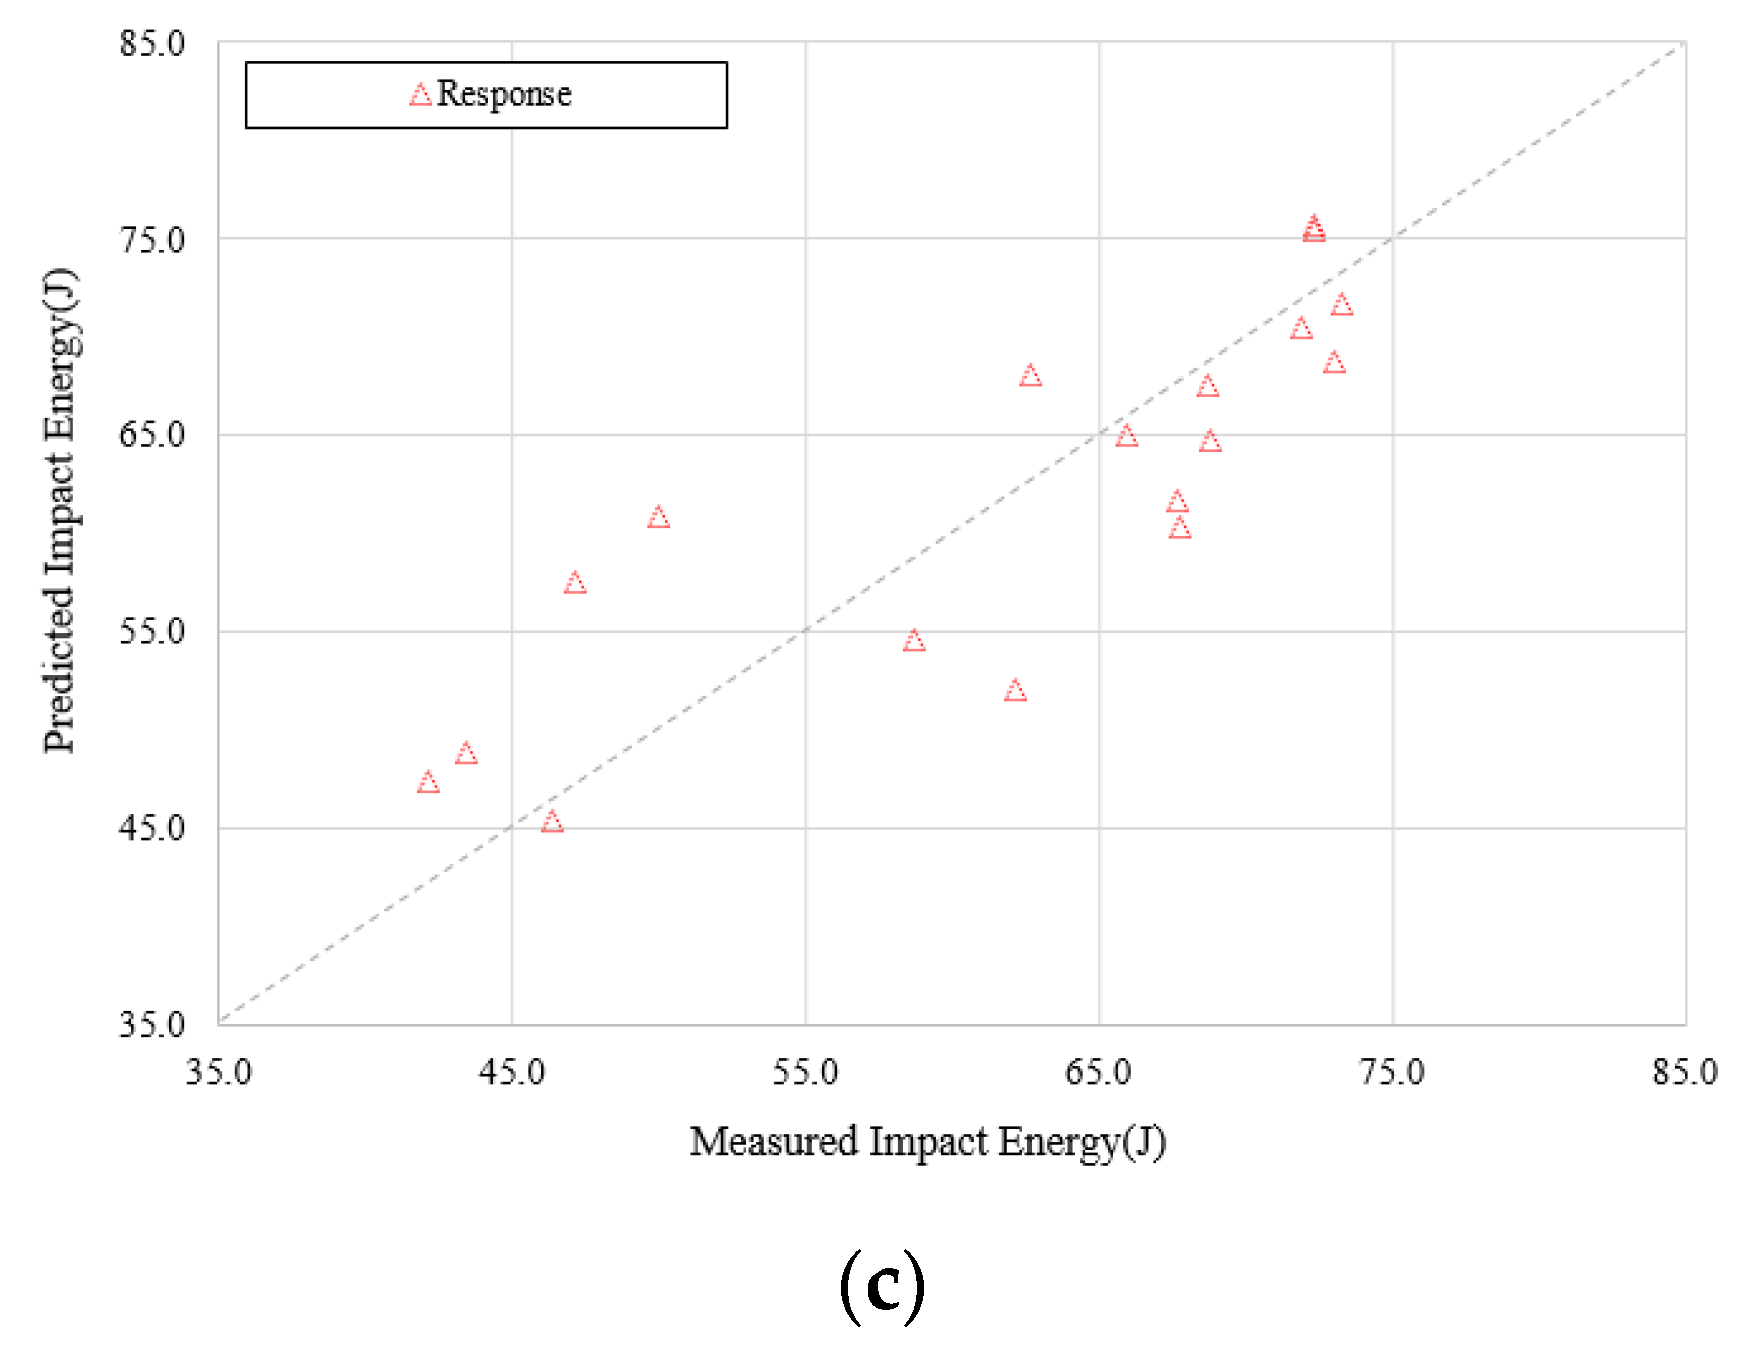
To optimize the specific welding process parameters where brittle fracture characteristics occur, an objective function was first developed. By using the response surface method, a mathematical model that can predict the bead shape and impact energy was developed and applied to a multi-purpose optimization algorithm. By entering the raw data that generates brittle fracture characteristics into the algorithm program created by the objective function and limiting conditions, the process variables were corrected to avoid quality deterioration intrinsic in the process variables.
(4).
A predicted welding result was calculated by entering the input variables supplemented with the quality degradation characteristics into the mathematical model that can predict the welding factors. Through re-entering the output variables into the discrimination system, it was found that the possibility of occurrence of toughness deterioration was eliminated in all the raw data where there may be brittle fracture characteristics.

Author Contributions

Conceptualization, M.P.; methodology, M.P.; software, C.P.; validation, J.K.; formal analysis, M.P.; investigation, M.P.; resources, J.K.; data curation, M.P.; writing—original draft preparation, M.P.; writing—review and editing: J.K. and C.P.; visualization, C.P.; supervision, J.K.; project administration, J.K.; funding acquisition, J.K.; All authors have read and agreed to the published version of the manuscript.

Funding

This study was conducted with the support of the Korea Institute of Industrial Technology as “The dynamic parameter control based smart welding system module development for the complete joint penetration weld (KITECH EH-21-0003)”.

Institutional Review Board Statement

Not applicable.

Informed Consent Statement

Not applicable.

Data Availability Statement

The data presented in this study are available on request from the corresponding author.

Conflicts of Interest

The authors declare no conflict of interest.

References

  1. Assche, R. LNG Bunkering in Europe. Port of Rotterdam Authority. In Proceedings of the 3rd Annual LNG Bunkering Conference, Singapore, 29–31 July 2015. [Google Scholar]
  2. Schinas, O.; Butler, M. Feasibility and commercial considerations of LNG-fueled ships. Ocean Eng. 2016, 122, 84–96. [Google Scholar] [CrossRef]
  3. IMO. IMO Regulations to Reduce Air Pollution from Ships and the Review of Fuel Oil Availability; IMO: London, UK, 2016. [Google Scholar]
  4. Azzara, A.; Rutherford, D.; Wang, H. Feasibility of IMO annex VI Tier III implementation using selective catalytic reduction. Int. Counc. Clean Transp. 2014, 4, 1–9. [Google Scholar]
  5. Kim, J.H.; Shim, K.T.; Kim, Y.K.; Ahn, B.W. Fatigue Crack Growth Characteristics of 9% Ni Steel Welded Joint for LNG Storag Tank at Low Temperature. J. Weld. Join. 2010, 28, 537–542. [Google Scholar]
  6. Lee, S.H.; Lee, S.R.; Lee, Y.S. Interpretation for Band-Type Indication on Radiography of 9% Ni Steel Welds for LNG Storage Tanks. J. Korean Soc. Nondestruc. Test. 2010, 30, 479–483. [Google Scholar]
  7. Chang, W.S.; Kim, K.C.; Kim, Y.C.; Kim, S.R.; Kim, W.S. Ni alloy welding consumables for 9% Nickel steel. J. Weld. Join. 1998, 16, 25–37. [Google Scholar]
  8. ASTM E23. Standard Test Methods for Notched Bar Impact Testing of Metallic Materials. Am. Soc. Test. Mater. 2007, 7, 1–6. [Google Scholar]
  9. Yun, T.J.; Oh, W.B.; Lee, B.R.; Lee, C.W.; Na, H.H.; Choi, J.S.; Kim, I.S. A Study on Optimization of Fillet in Laser Welding Process for 9% Ni Steel Using Gradient-Based Optimization Algorithm. J. Weld. Join. 2020, 38, 485–492. [Google Scholar] [CrossRef]
  10. Park, T.U.; Jung, D.H.; Park, J.H.; Kim, J.H.; Han, I.W. Changes in the Mechanical Properties and Microstructure of High Manganese Steel by High Heat Input Welding and General Welding Processes. J. Weld. Join. 2020, 40, 33–39. [Google Scholar] [CrossRef]
  11. Ko, D.H.; Park, Y.I.; Shin, Y.T. Pitting Corrosion Characteristic Depending on Welding Pass and Heat Input of GTA Weldment on Superaustenitic Stainless Steel (UNS S32654). J. Weld. Join. 2020, 38, 528–534. [Google Scholar] [CrossRef]
  12. Kim, J.D.; Lee, J.B.; Lee, C.J.; Song, M.K.; Nam, G.J. Weldability of STS316L for LNG carrier by fiber laser. J. Adv. Mar. Eng. Technol. 2012, 36, 1061–1068. [Google Scholar] [CrossRef] [Green Version]
  13. Kim, J.D.; Lee, C.J.; Song, M.K. Characteristics of fiber laser welding on STS304L for GTT MARK III membrane. J. Adv. Mar. Eng. Technol. 2012, 36, 1069–1075. [Google Scholar] [CrossRef] [Green Version]
  14. Baba, O.; Okumoto, Y.; Abe, A. Improvement of butt welding for aluminum alloy tank of SPB LNG carrier. J. Mar. Sci. Technol. 2007, 5, 91–97. [Google Scholar]
  15. Zhao, D.S.; Liu, Y.J.; Wang, X.D.; Ji, Z.S. The calculation and measurement of welding residual stress for invar steel of a liquefied natural gas carrier’s containment system. J. Ship Prod. Des. 2015, 31, 43–48. [Google Scholar]
  16. Caruso, S.; Umbrello, D. Numerical and experimental validation of gas metal arc welding on AISI 441 ferritic stainless steel through mechanical and microstructural analysis. Int. J. Adv. Manuf. Technol. 2022, 120, 7433–7444. [Google Scholar] [CrossRef]
  17. Li, J.Y.; Zhang, Z.; Ren, D.X.; Zhang, W.; Tan, Z.J. The experimental and numerical studies on load bearing capacity in lamellar tearing of friction stir lap weld. Eng. Fract. Mech. 2022, 271, 108609. [Google Scholar] [CrossRef]
  18. Penga, Q.; Wu, H.; Wang, D.W.; He, Y.J.; Chen, H. Numerical simulation of aircraft crash on large-scale LNG storage tank. Eng. Fail. Anal. 2019, 96, 60–79. [Google Scholar] [CrossRef]
  19. Welding and Bonding Handbook–Process and Thermal Processing. Int. J. Korean Weld. Soc. 2007, 3, 26–33.
  20. El-Shabasy, A.; Lewandowski, J. Effects of load ratio, R, and test temperature on fatigue crack growth of fully pearlitic eutectoid steel (fatigue crack growth of pearlitic steel). Int. J. Fatigue 2004, 26, 305–309. [Google Scholar] [CrossRef]
  21. Yoon, Y.K.; Kim, J.H.; Shim, K.T. Mechanical Characteristics of 9% Ni Steel Welded Joint for LNG Storage Tank at Cryogenic. Int. J. Mod. Phys. Con. Ser. 2012, 6, 355–360. [Google Scholar] [CrossRef]
  22. Kim, Z.H. A Comparative Study of Classification Techniques Using Forest Cover Type Data: Discriminant Analysis, Logistic Regression, Neural Network, Decision Tree. Unpublished. Master’s Thesis, Chung-Ang University, Seoul, Korea, 2012. [Google Scholar]
  23. Amrine, D.E.; White, B.J.; Larson, R.L. Comparison of classification algorithms to predict outcomes of feedlot cattle identified and treated for bovine respiratory disease. Comput. Electron. Agric. 2014, 105, 9–19. [Google Scholar] [CrossRef] [Green Version]
  24. Knowles, J.D.; Corne, D.W. Approximating the nondominated front using the pareto archived evolution strategy. Evol. Comput. 2000, 8, 149–172. [Google Scholar] [CrossRef]
  25. Vapnik, V.N. The Nature of Statistical Learning Theory; Springer: Berlin/Heidelberg, Germany, 1999. [Google Scholar]
  26. Kim, Y.G. Evolutionary Algorithms; Chonnam National University Press: Gwangju, Korea, 2011. [Google Scholar]
  27. Deb, K.; Agrawal, S.; Pratap, A.; Meyarivan, T. A fast elitist non-dominated sorting genetic algorithm for multi-objective optimization: NSGA-II. Lect. Notes Comput. Sci. 2000, 1917, 849–858. [Google Scholar]
  28. Zitzler, E.; Deb, K.; Thiele, L. Comparison of multiobjective evolutionary algorithms: Empirical results. Evol. Comput. 2000, 8, 173–195. [Google Scholar] [CrossRef] [Green Version]
  29. Veldjuizen, D.A.V.; Lamont, G.B. On measuring multiobjective evolutionary algorithm performance. Evol. Comput. 2000, 1, 204–211. [Google Scholar]
  30. Deb, K.; Pratap, A.; Agarwal, S.; Meyarivan, T.A. A fast and elitist multi objective genetic algorithm: NSGA-II. IEEE Trans. Evol. Comput. 2002, 6, 182–197. [Google Scholar] [CrossRef] [Green Version]
Figure 1. Welding specimen and constraint a schematic diagram.
Metals 12 01213 g001
Figure 2. Flux core arc welding equipment.
Metals 12 01213 g002
Figure 3. Schematic diagram of weldment geometry.
Metals 12 01213 g003
Figure 4. A schematic diagram of Charpy impact test.
Metals 12 01213 g004
Figure 5. Typical fracture surface according to ductile and brittle. (a)Ductile fracture. (b)Brittle fracture.
Metals 12 01213 g005
Figure 6. Definition of measurement section for impact specimens.
Metals 12 01213 g006
Figure 7. Impact energy distributions according to heat input in flux core arc welding.
Metals 12 01213 g007
Figure 8. Brittle fracture behavior discriminant in flux core arc welding: (a) performance evaluation for SVM and (b) discriminant graph for SVM.
Metals 12 01213 g008
Figure 9. Comparison between measured and predicted welding factors according to mathematical model: (a) Top-Bead width, (b) top-Bead height, and (c) impact energy.
Metals 12 01213 g009aMetals 12 01213 g009b
Figure 10. A flow chart for MOO method to predicting welding parameters.
Metals 12 01213 g010
Figure 11. Brittle fracture behavior distributions using modified input parameters.
Metals 12 01213 g011
Table 1. Chemical composition of steels used (wt. %).
SteelCSiMnSPNiFe
A553-10.050.670.0040.0030.259.02Bal.
Table 2. Mechanical properties of steels used.
SteelYield Strength (MPa)Tensile Strength (MPa)Elongation (%)Hardness (HV)
A553-1651.6701.126.6243
Table 3. FCAW parameters and experimental conditions.
Test
No.
Welding
Current
(A)
Arc Voltage
(V)
Welding Speed
(m/min)
Test
No.
Welding
Current
(A)
Arc Voltage
(V)
Welding Speed
(m/min)
1150210.310150210.4
2150230.311150230.4
3150250.312150250.4
4160210.313160210.4
5160230.314160230.4
6160250.315160250.4
7170210.316170210.4
8170230.317170230.4
9170250.318170250.4
Fixed ParameterWelding Wire: ∅1.2 Flux Wire
Contact Tip Work Distance: 15 mm
Shielding Gas Flow Rate: 18 L/min, (L/min)
Table 4. Results of weldment geometry through welding experiment.
Test No.Top-Bead Width (mm)Top-Bead Height (mm)Bead Geometry
1st2nd3rdAverage1st2nd3rdAverage
18.468.478.468.462.582.612.592.59 Metals 12 01213 i001
28.918.858.888.882.832.822.842.83 Metals 12 01213 i002
39.649.639.639.632.852.832.882.86 Metals 12 01213 i003
410.2510.2510.2810.262.822.802.772.80 Metals 12 01213 i004
510.8210.8110.8110.812.942.962.922.94 Metals 12 01213 i005
611.1911.1811.1811.183.093.103.103.10 Metals 12 01213 i006
711.4311.4411.4311.433.123.113.093.11 Metals 12 01213 i007
812.0912.1312.1412.123.173.143.193.17 Metals 12 01213 i008
913.2813.3113.3013.303.263.263.243.25 Metals 12 01213 i009
108.578.588.568.572.752.762.742.75 Metals 12 01213 i010
119.569.539.459.512.852.862.902.87 Metals 12 01213 i011
129.709.719.649.682.892.912.912.90 Metals 12 01213 i012
1310.3210.3510.3810.352.882.892.872.88 Metals 12 01213 i013
1410.8810.8410.8110.842.892.922.942.92 Metals 12 01213 i014
1511.3811.3511.3211.353.093.093.083.09 Metals 12 01213 i015
1612.0612.0512.0912.073.133.123.113.12 Metals 12 01213 i016
1712.9712.9612.9412.963.213.193.173.19 Metals 12 01213 i017
1813.4213.4013.4113.413.273.283.313.29 Metals 12 01213 i018
Table 5. Results of Charpy impact test according to flux core arc welding.
Test No.1st (J)2nd (J)3rd (J)Average (J)
173.5174.5471.8473.30
274.0873.4871.5673.04
367.2165.0265.6865.97
474.6271.2071.1172.31
550.1248.6951.1149.97
640.4743.6042.3342.13
747.6547.1144.3846.38
843.4141.1145.6543.39
948.9745.0747.3747.14
1073.7972.0971.1272.33
1169.1467.6569.3668.72
1264.1262.5661.2062.63
1372.3670.5872.6871.87
1468.1467.2467.9267.77
1562.1461.0563.2062.13
1670.6269.2266.4868.77
1770.4266.2166.4867.70
1859.1460.9056.1458.73
Table 6. Results of fracture geometry of the heat-affected zone according to the Charpy impact test.
Test No.
Facets
123456
Metals 12 01213 i019 Metals 12 01213 i020 Metals 12 01213 i021 Metals 12 01213 i022 Metals 12 01213 i023 Metals 12 01213 i024
789101112
Metals 12 01213 i025 Metals 12 01213 i026 Metals 12 01213 i027 Metals 12 01213 i028 Metals 12 01213 i029 Metals 12 01213 i030
131415161718
Metals 12 01213 i031 Metals 12 01213 i032 Metals 12 01213 i033 Metals 12 01213 i034 Metals 12 01213 i035 Metals 12 01213 i036
Table 7. Results of fracture geometry of the heat-affected zone according to the Charpy impact test.
Test No.
Facets
123456
DimpleDimpleDimpleDimpleCleavageCleavage
Metals 12 01213 i037 Metals 12 01213 i038 Metals 12 01213 i039 Metals 12 01213 i040 Metals 12 01213 i041 Metals 12 01213 i042
789101112
CleavageCleavageCleavageDimpleDimpleDimple
Metals 12 01213 i043 Metals 12 01213 i044 Metals 12 01213 i045 Metals 12 01213 i046 Metals 12 01213 i047 Metals 12 01213 i048
131415161718
DimpleDimpleDimpleDimpleDimpleDimple
Metals 12 01213 i049 Metals 12 01213 i050 Metals 12 01213 i051 Metals 12 01213 i052 Metals 12 01213 i053 Metals 12 01213 i054
Table 8. Results of fracture behavior according to heat input in flux core arc welding.
Test No.Welding Current
(A)
Arc Voltage
(V)
Welding Speed
(m/min)
Top-Bead Width
(mm)
Top-Bead Height
(mm)
Heat Input
(J/cm2)
Impact Energy
(J)
Fracture Behavior
1150210.38.462.594.47 × 101273.30Dimple
2150230.38.882.834.66 × 101273.04Dimple
3150250.39.632.864.67 × 101265.97Dimple
4160210.310.262.803.93 × 101272.31Dimple
5160230.310.812.944.09 × 101249.97Cleavage
6160250.311.183.104.29 × 101242.13Cleavage
7170210.311.433.113.75 × 101246.38Cleavage
8170230.312.123.173.87 × 101243.39Cleavage
9170250.313.33.253.84 × 101247.14Cleavage
10150210.48.572.753.31 × 101272.33Dimple
11150230.49.512.873.26 × 101268.72Dimple
12150250.49.682.903.49 × 101262.63Dimple
13160210.410.352.882.92 × 101271.87Dimple
Table 9. Brittle fracture behavior data for discriminant analysis in flux core arc welding.
Test No.Heat Input
(J/cm2)
Impact Energy (J)Fracture BehaviorTest No.Heat Input
(J/cm2)
Impact Energy (J)Fracture Behavior
14.47 × 101273.30Dimple103.31 × 101272.33Dimple
24.66 × 101273.04Dimple113.26 × 101268.72Dimple
34.67 × 101265.97Dimple123.49 × 101262.63Dimple
43.93 × 101272.31Dimple132.92 × 101271.87Dimple
54.09 × 101249.97Cleavage143.06 × 101267.77Dimple
64.29 × 101242.13Cleavage153.17 × 101262.13Dimple
73.75 × 101246.38Cleavage162.66 × 101268.77Dimple
83.87 × 101243.39Cleavage172.72 × 101267.70Dimple
93.84 × 101247.14Cleavage182.85 × 101258.73Dimple
Table 10. Learning data for discriminant of welding quality.
Test No.Input DataOutput Data
CVSWHHiIGroup
1150.021.00.38.462.594.47 × 101273.30Dimple
2150.023.00.38.882.834.66 × 101273.04Dimple
3150.025.00.39.632.864.67 × 101265.97Dimple
4160.021.00.310.262.803.93 × 101272.31Dimple
5160.023.00.310.812.944.09 × 101249.97Cleavage
6160.025.00.311.183.104.29 × 101242.13Cleavage
7170.021.00.311.433.113.75 × 101246.38Cleavage
8170.023.00.312.123.173.87 × 101243.39Cleavage
9170.025.00.313.303.253.84 × 101247.14Cleavage
10150.021.00.48.572.753.31 × 101272.33Dimple
11150.023.00.49.512.873.26 × 101268.72Dimple
12150.025.00.49.682.903.49 × 101262.63Dimple
13160.021.00.410.352.882.92 × 101271.87Dimple
14160.023.00.410.842.923.06 × 101267.77Dimple
15160.025.00.411.353.093.17 × 101262.13Dimple
16170.021.00.412.073.122.66 × 101268.77Dimple
17170.023.00.412.963.192.72 × 101267.70Dimple
18170.025.00.413.413.292.85 × 101258.73Dimple
C: Welding Current (A); V: Arc Voltage (V); S: Welding Speed (m/min); W: Top-Bead Width (mm); H: Top-Bead Height (mm); Hi: Heat Input (J/cm2); I: Impact Energy (J).
Table 11. Results of group discriminant for brittle fracture behavior according to SVM.
Test No.Measured GroupPredicted GroupTest No.Measured GroupPredicted Group
100 (0.00)1000 (0.00)
200 (0.00)1100 (0.00)
300 (0.00)1200 (0.00)
400 (0.00)1300 (0.00)
511 (1.00)1400 (0.00)
611 (1.00)1500 (0.00)
711 (1.00)1600 (0.00)
811 (1.00)1700 (0.00)
911 (1.00)1800 (0.00)
Table 12. Analysis of variance tests for predicted model for welding factors.
Design ParameterPredicted ModelSE (Standard Error)R2 (Coefficient of Determination, %)
WResponse Surface Analysis0.22198.9
HResponse Surface Analysis0.04696.9
IResponse Surface Analysis8.56372.0
Table 13. Multi-objective optimization algorithm parameters and their values.
Optimal MethodMOO (Multi-Objective Optimization)
Range of Local ParametersC (Welding Current)[−5 ≤ Input ≤ +5] A
V (Arc Voltage)[−1 ≤ Input ≤ +1] V
S (Welding Speed)[−0.05 ≤ Input ≤ +0.05] m/min
Range of ConstraintsHi (Heat Input)Hi ≥ 4.29 × 10¹² J/cm2, Hi ≤ 3.75 × 10¹² J/cm2
Fitness FactorPopulation Size50, 60, 70, 80, 90, 100
SolverConstrained nonlinear minimization
AlgorithmTrust region reflective algorithm
DerivativesGradient supplied
Table 14. Results of welding parameters modified by optimization process.
Test No.OriginalModifiedWelding FactorsGroup
CVSCVSWHHiI
5160.023.00.3164.9822.140.25411.13.04.55 × 101270.5Dimple
6160.025.00.3164.9924.000.25111.83.14.81 × 101254.5Dimple
Publisher’s Note: MDPI stays neutral with regard to jurisdictional claims in published maps and institutional affiliations.

