1. Introduction
Rare earth elements (REEs) have been widely employed in diverse industrial materials, owing to their unique magnetic, phosphorescent, physical and catalytic properties [
1]. They became important ingredients in various compounds, and consequently, global demand for rare earth products increased exponentially, particularly in energy-efficient functional materials, such as neodymium–iron–boron (NdFeB) magnets [
2,
3]. From the viewpoint of sustainability, in the coming decades, with the push towards cleaner and greener future, supply channels will evidently face difficulties in meeting the growing demand for REEs [
4,
5].
Continuous growth of solid waste containing rare earth elements is generating a lot of interest in recycling and recovery technologies for these elements from used industrial materials. Development and implementation of such technologies are expected to assume a very important role in supplementing virgin REE production in supply chains. Electrochemical deposition has proven to be a capable alternative in selective recovery of a desired element from an electrolyte containing mixed rare earth ions [
3,
6,
7,
8,
9]. The ability to monitor and control the deposition process, composition, morphology and especially the purity of the final products are some of the advantages attributed to the electrolytic production method.
The electrochemical behaviour of selected metal ions in an electrolyte system were studied to achieve energy-efficient recovery of rare earth metals [
10]. These fundamental studies were aimed at providing a basis for REE electrolytic production and refining from relevant secondary resources. Selective electrolytic production of RE elements (RE = Nd, Pr or Dy) alone or RE alloys using an appropriate working substrate by electrolysis from fluoride or chloride molten salts system have been studied to some extent [
2,
5,
11,
12,
13,
14,
15,
16]. Significant work has been done concerning the electrochemistry of each element separately or as part of a group in the corresponding molten salt mixture using molten salt electrochemistry [
6,
7,
11,
17,
18,
19,
20]. However, there has been little related research conducted on selective neodymium/praseodymium electrochemical deposition from oxide-fluoride electrolytes [
6,
7,
8,
21,
22,
23]. Currently, industrial production of Nd-Pr alloys is mostly based on the electrochemical processes of oxide-fluoride electrolytes, using PrF
3-NdF
3-LiF as the base electrolyte and Nd and Pr oxides as a feedstock. Therefore, experiments have been continuously conducted to improve knowledge of these processes. For example, a study on the solubility of Pr and Nd oxides in their corresponding LiF–REF electrolytes was conducted by online monitoring of the oxide concentration during rare earth metal electrowinning [
8]. Recently, relationships between conductivity of molten PrF
3-NdF
3-LiF-Pr
6O
11-Nd
2O
3 salt and varied temperature, LiF content or REO concentration were identified in the system [
22].
Data concerning the potential environmental risk associated with the RE production via electrodeposition from molten salts are rather scarce. A study was conducted on the electrode reactions on the carbon anode in fluoride based molten salts containing RE oxides. The authors reported that during the electrolysis of didymium from oxide-fluoride molten salts, emission of carbon oxides and perfluorocarbon gasses depended on oxide concentration and deposition current density [
24].
Despite the efforts made to date, there are still a number of remaining challenges, such as the melting temperature of the electrolyte, the effect of LiF and/or REO addition to the electrolyte composition, parameters that play an important role in controlling the entire rare earth element electrolysis process. Phase diagrams are a useful tool for understanding the investigated system and the present phases, as well as their states and melting temperatures. Studies addressing the phase diagrams of neodymium and praseodymium fluoride salts as base electrolytes in the molten salt electrolysis process for REE production are scarce. The binary phase diagrams of NdF
3-LiF and PrF
3-LiF were reported by Thoma [
25], as well as Berkani and Gaune-Escard [
26], whereas the ternary phase diagram was reported by Liu [
27]. Liu used previously available binary system data, and combined it with limited experimental results for liquidus temperature measured by differential scanning calorimetry (DSC).
Recently, we successfully employed a fluoride based molten PrF
3-NdF
3-LiF bath as a solvent for neodymium and praseodymium oxides and as an electrolyte for the electrodeposition of Nd and Pr metals on an inert working substrate [
6,
7,
17]. Our study was focused on the fundamentals underlying the electrochemical reduction of both Nd(III)/Nd(0) and Pr(III)/Pr(0) cations that occurs in the oxide-fluoride melt using a glassy carbon counter electrode (anode), W reference electrode and W (or Mo) working electrode. The anode gas composition during electrolysis in the NdF
3 + PrF
3 + LiF + Nd
2O
3 + Pr
6O
11 electrolyte at 1050 °C was also analysed [
6,
7,
17]. By applying different electrochemical techniques, we succeeded in obtaining solid Nd metal and Nd-Pr metal composition on the cathodes used from the oxide-fluoride electrolyte at 1050 °C [
6,
7,
17].
Continuing the series on fundamental studies on selective Nd and Pr electrodeposition, with this work, we build on experiments and theory, allowing us to construct a ternary phase diagram for the liquidus temperatures of the chosen fluoride based molten salts (NdF3 + PrF3 + LiF). This step was necessary to obtain an improved prediction of the optimal electrolyte constitution. To address the efficiency of the electrolyte system composition, as well as the optimal process conditions, the concentration of the REO added to the fluoride based NdF3 + PrF3 + LiF electrolyte was varied in order to precisely incorporate adjustable parameters, which should favour more deposited neodymium and praseodymium metal remaining on the inert working substrate. Finally, we chose low-deposition overpotential to suppress greenhouse gas emissions and to achieve high-purity Nd and Pr metal production.
3. Results and Discussion
In an effort to develop a more efficient electrochemical technique to obtain Nd and Pr metals from a fluoride electrolyte system, a ternary diagram of the liquidus temperatures of the NdF
3-PrF
3-LiF system was constructed. To confirm and expand these scarce findings regarding the NdF
3-PrF
3-LiF ternary system, the system was modelled in well-known and available thermodynamical software,
FactSage. The main challenge in creating ternary phase diagrams is the lack of thermodynamic data and databases. Because the activities of these compounds are not known, an ideal liquid solution was created as a private database through the
Solution module. This private database was then used for construction of the phase diagram via the
Phase Diagram module. All three compounds and their data for the liquid phase were added to the newly created solution as functions. Based on these data, a solution was created using the
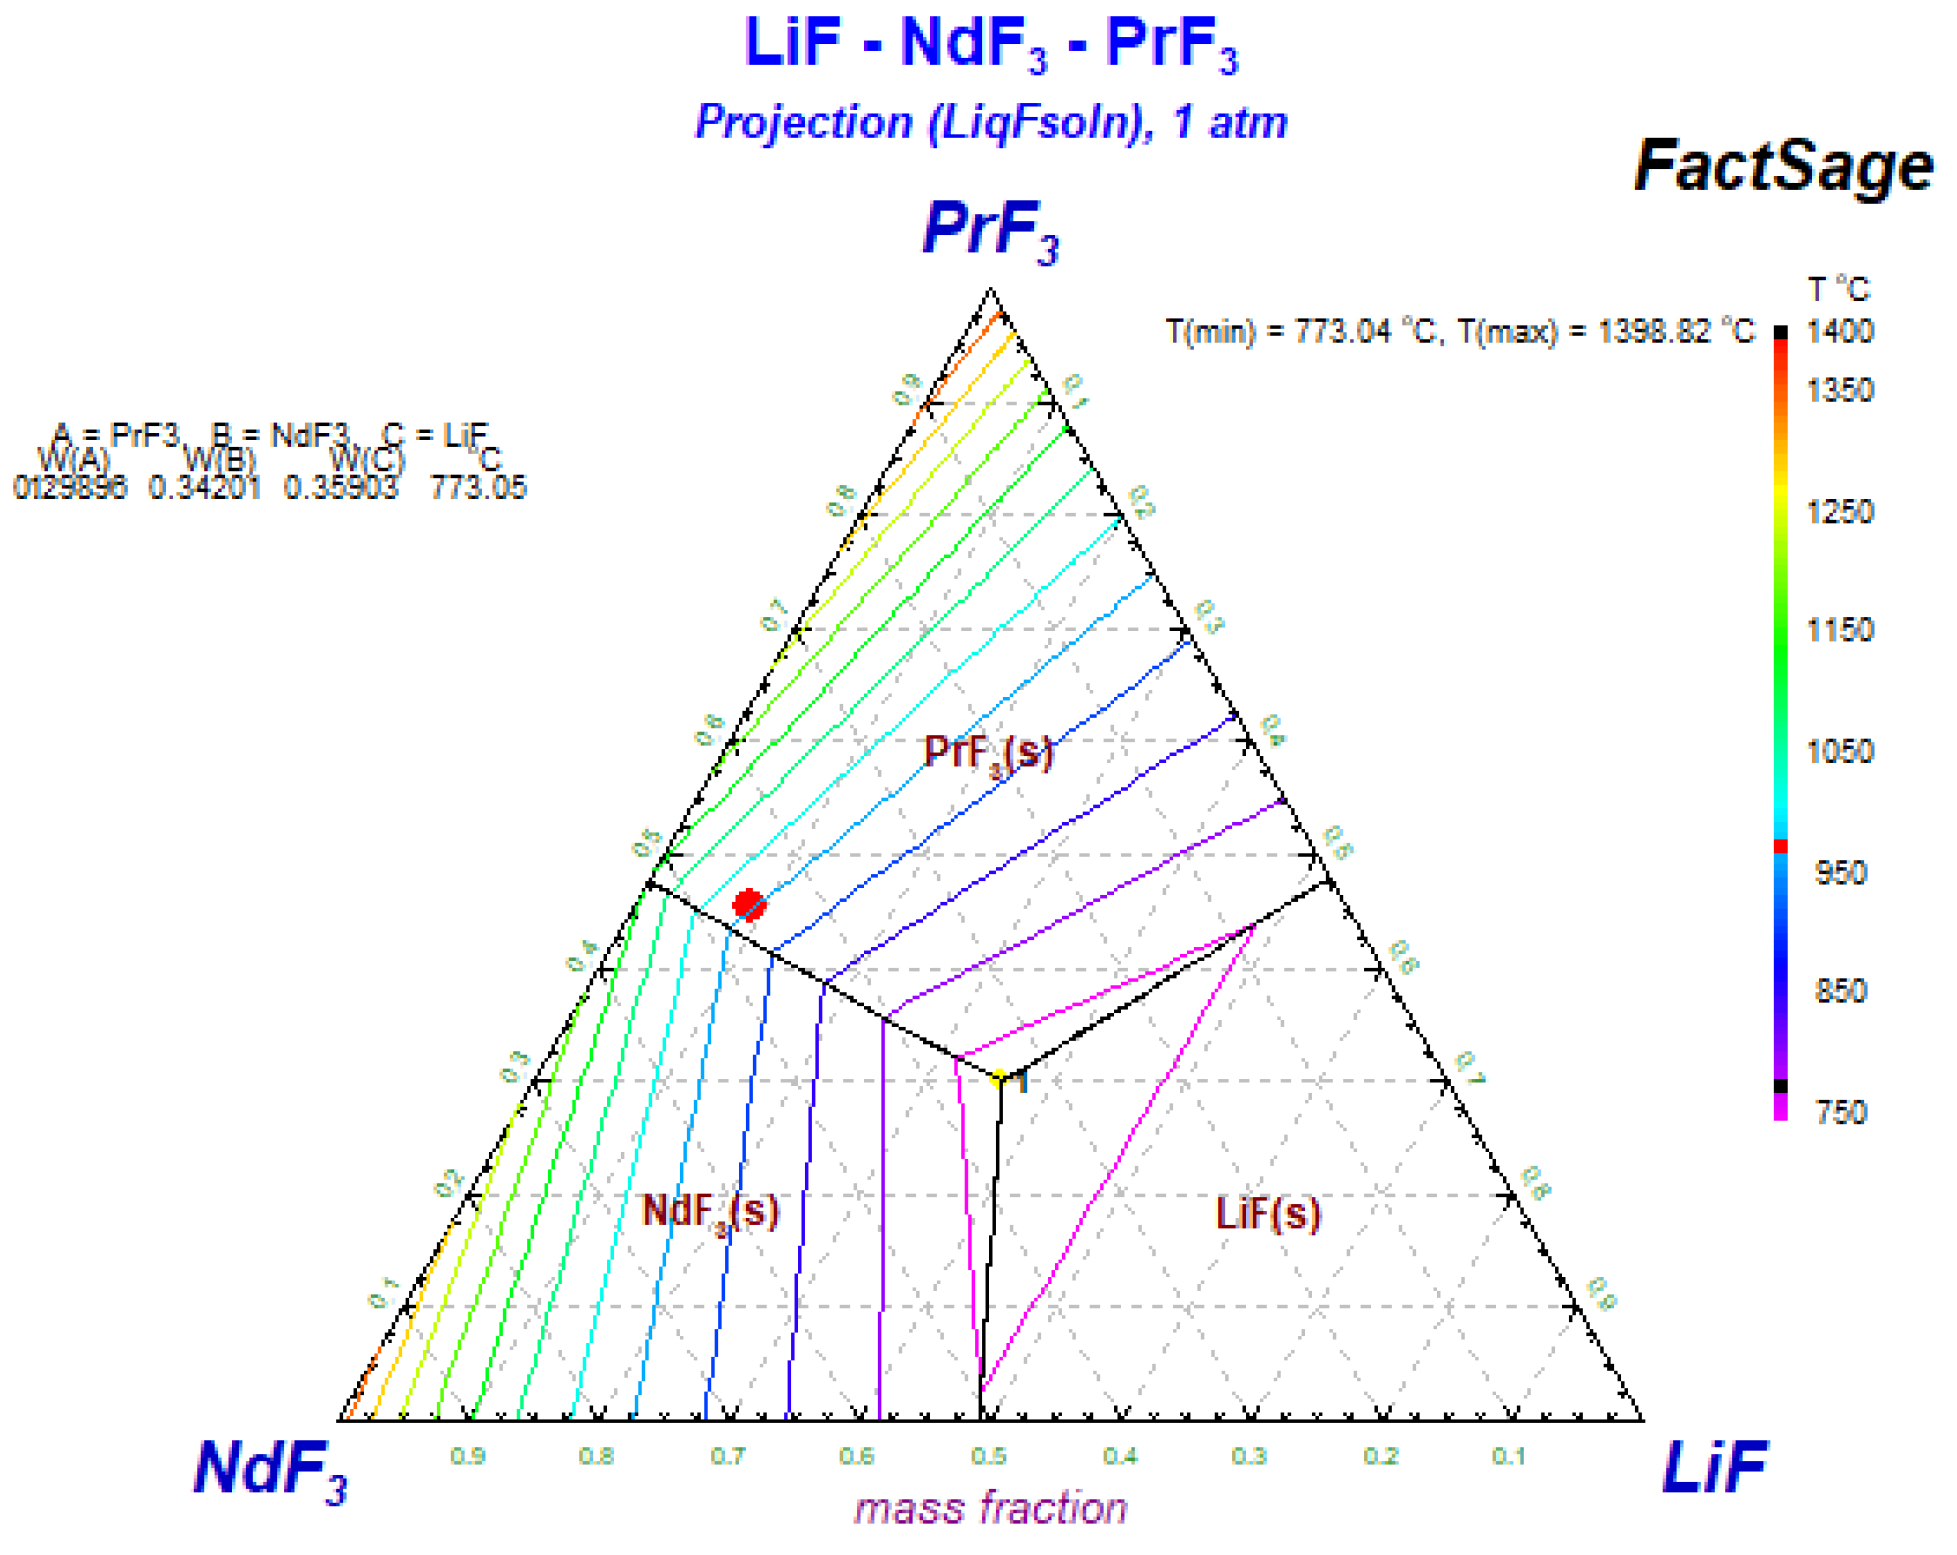
One-lattice R-K/Muggianu only model, followed by inclusion of the end members. The resulting database was used to generate the phase diagram, as shown in
Figure 1.
The chosen composition for experimental work consisting of 45.5 wt.% NdF
3, 45.5 wt.% PrF
3 and 9 wt.% LiF is marked by a red circle in
Figure 1. It clearly shows that the melting temperature of this electrolyte is approximately 970 °C, which is also in agreement with the work of Liu [
27]. The phase diagram modelled here can serve as a useful first insight into system behaviour and choice of electrolyte composition. Herewith, the issues related to inappropriate composition and high mixture melting temperatures of the mixture required for process realization can be avoided.
It is generally agreed that the rare earth oxide (REO) concentration in fluoride electrolyte is important for smooth operation during electrolysis processes. However, in the electrodeposition of Nd and Pr, modelling of the oxide-fluoride based molten salt electrolyte composition is becoming increasingly important. An base electrolyte composition of 45.5 wt.% NdF3 + 45.5 wt.% PrF3 + 9 wt.% LiF and a melting temperature of 1050 °C were chosen, as suggested by the constructed ternary phase diagram. At the working temperature of 1050 °C, the system is in a liquid state, making it suitable for the molten salt electrolysis process.
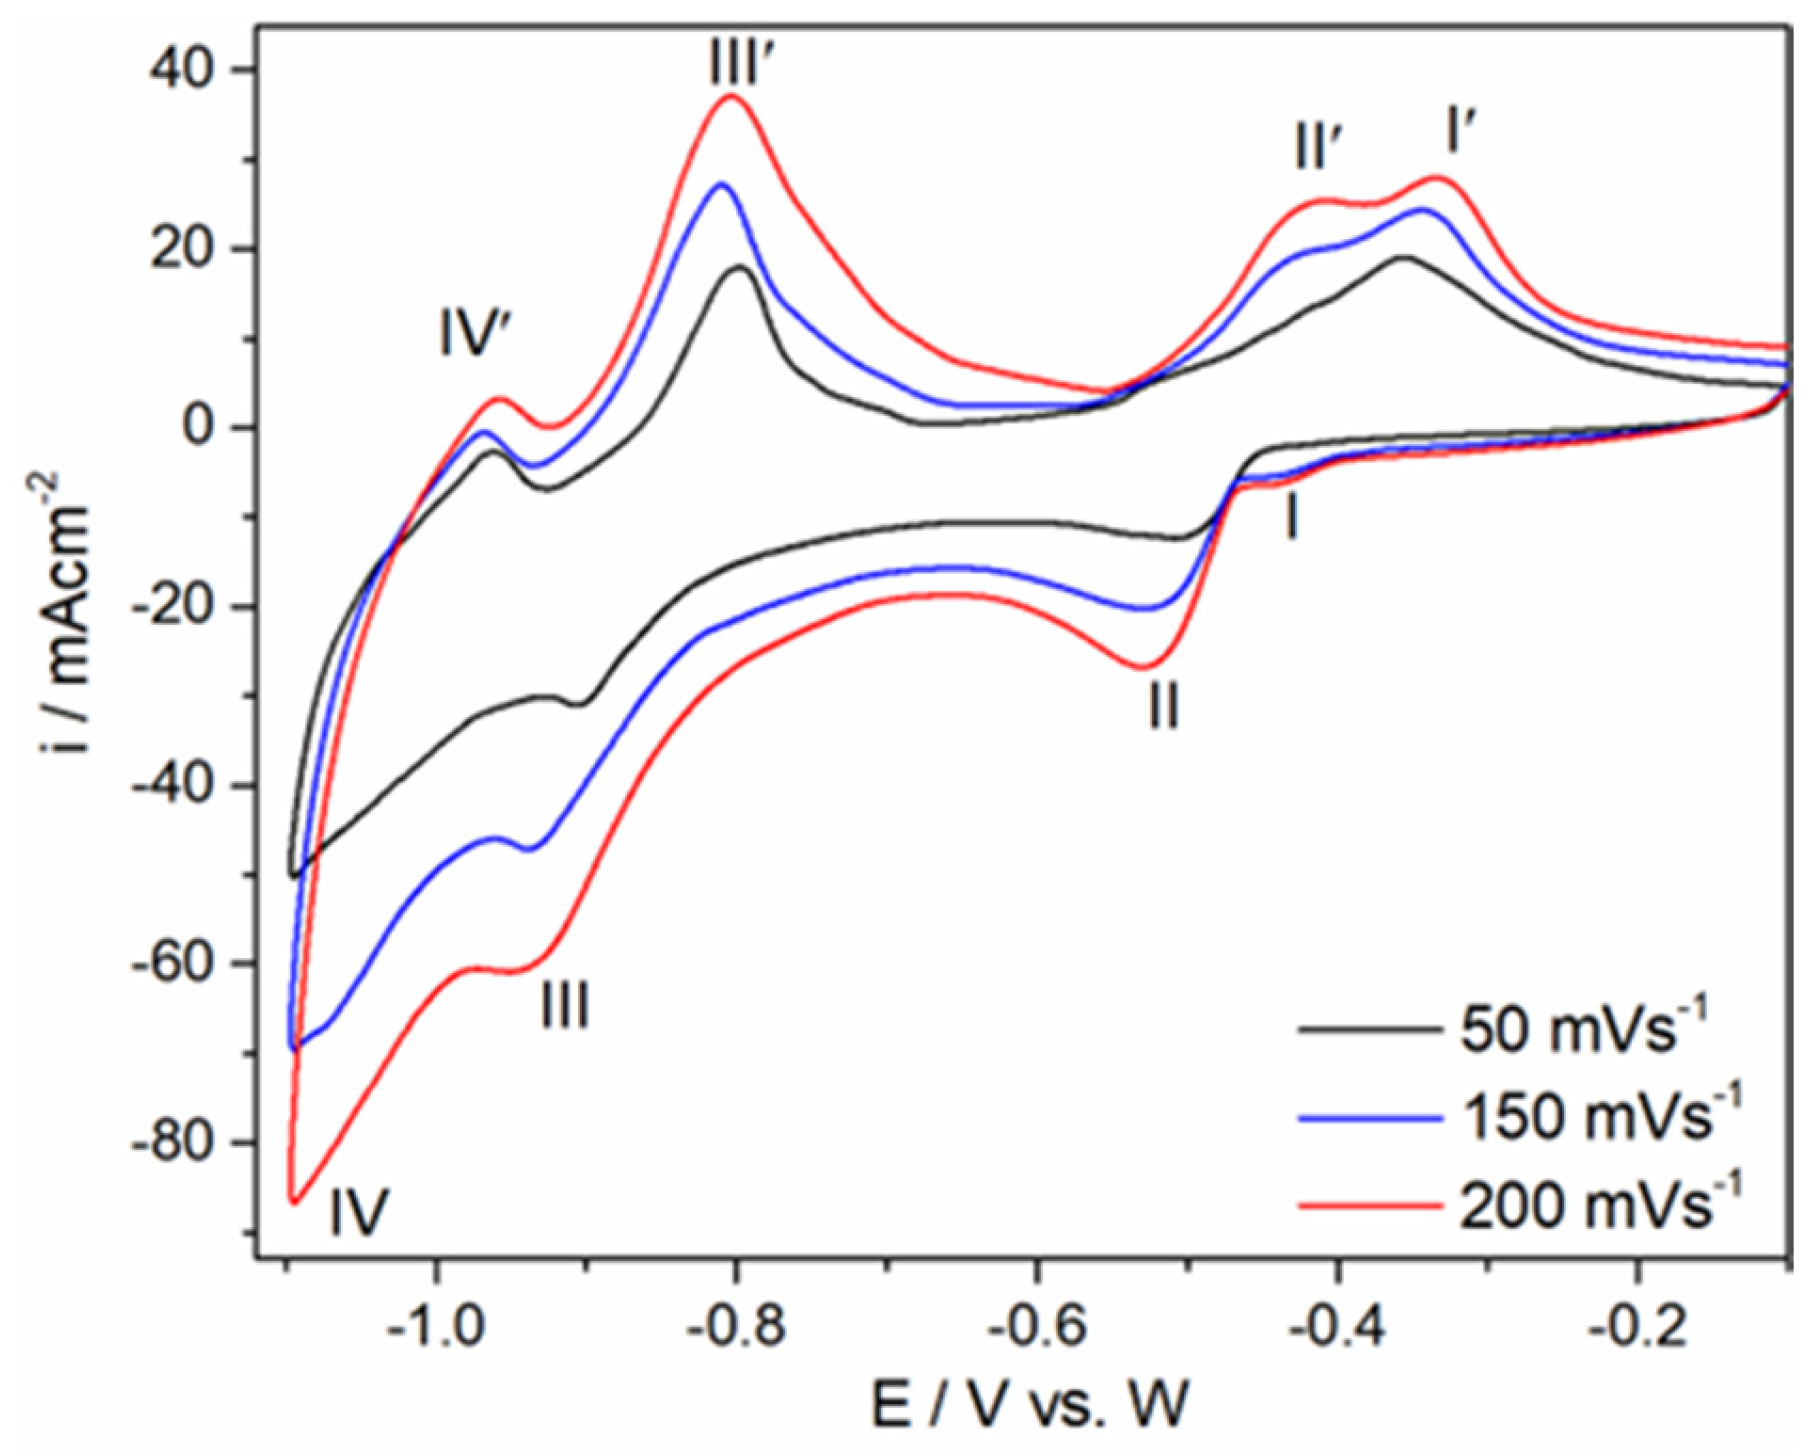
To gather general information on the reduction processes of the Nd(III) and Pr(III) cations, cyclic voltammetry was performed with different sweep rates on W working substrate in the chosen fluoride melt composition at 1050 °C (
Figure 2). Clear indications of four distinct regions of cathodic/anodic activities were observed in the potential range up to 1.000 V negative to the open circuit potential of the W working electrode (I/I’, II/II’, III/III’ and IV/IV’), with each cathodic current wave as a prerequisite for its anodic counterpart. Similar results were observed under the same conditions in our previous studies on the electrodeposition of neodymium and praseodymium from fluoride melts of similar composition [
6,
7]. Both cathodic and anodic peak currents increased with increasing sweep rates, but the peak potentials did not change substantially, indicating that the results obtained from this electrolyte are in agreement with those reported previously [
6,
7,
17]. This suggests that data provided by the constructed ternary phase diagram achieve satisfactory prediction for selection of melt composition.
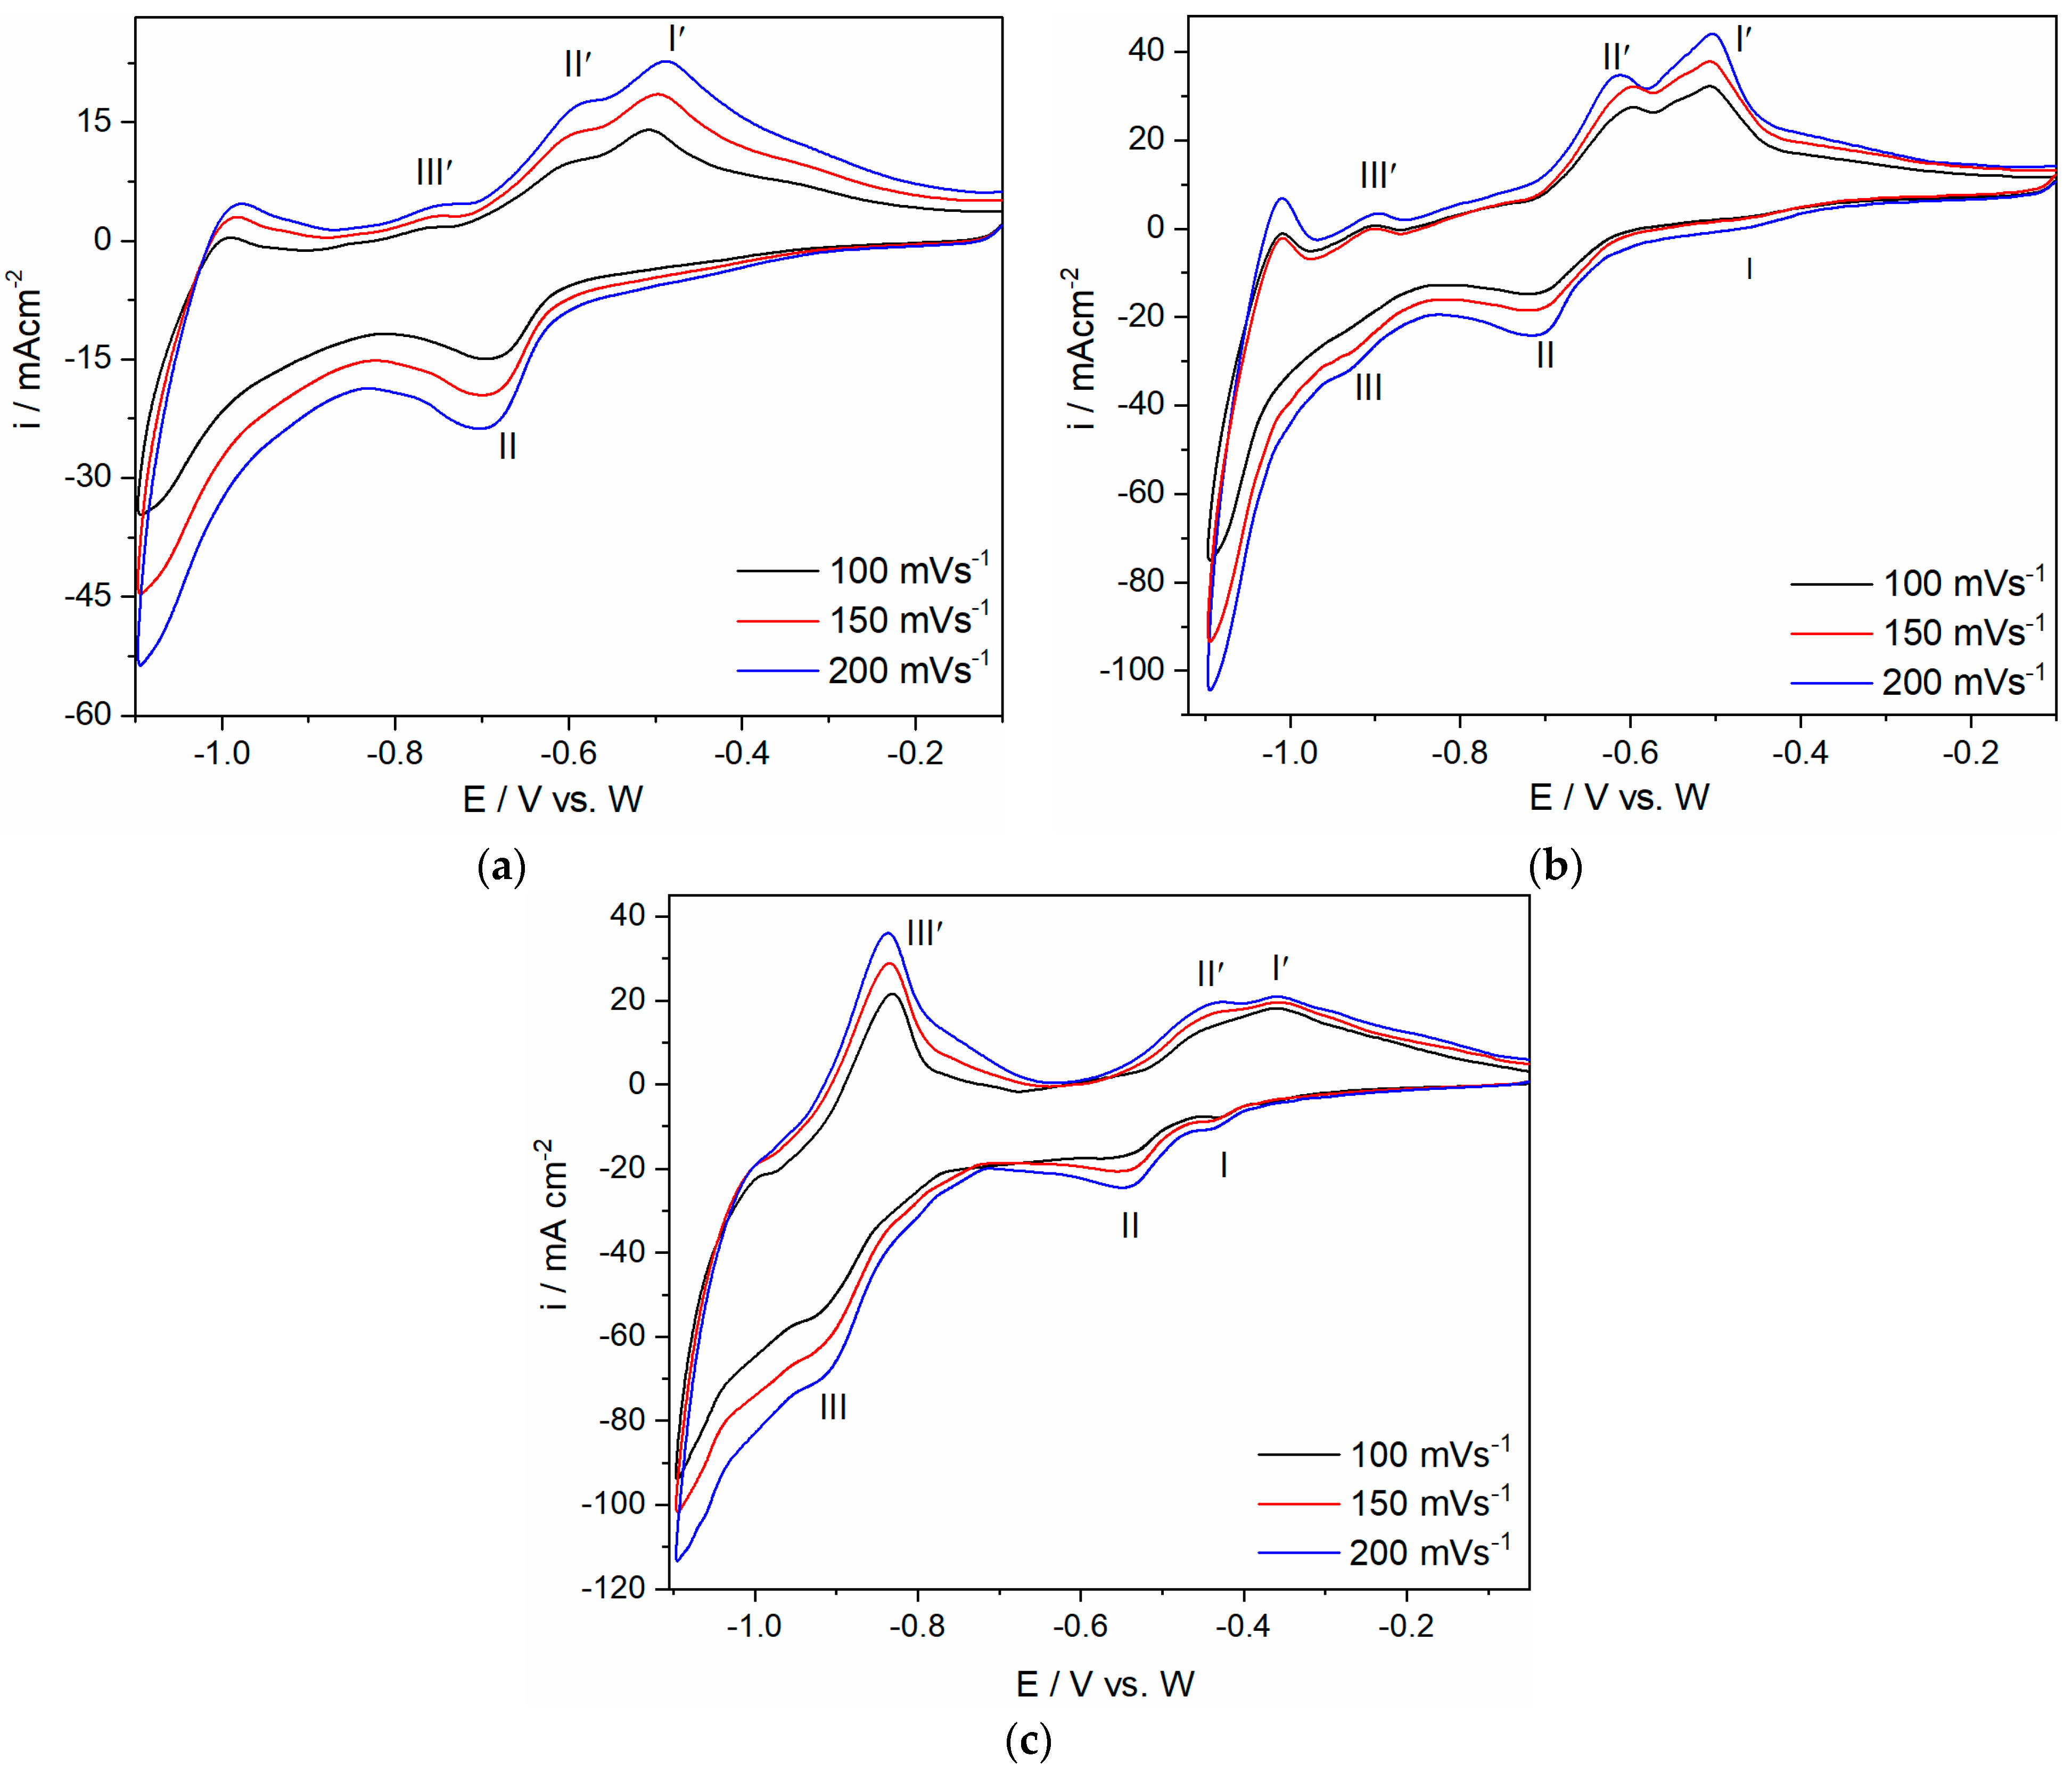
In order to provide further insight into the Nd-Pr co-deposition process and increase its efficiency, cyclic voltammetry was performed with varying REO concentrations and scanning rates in the used electrolytes. Experiments were conducted with the W working electrode immersed in the 45.5 wt.% NdF
3 + 45.5 wt.% PrF
3 + 9 wt.% LiFbased electrolyte at 1050 °C with different REO concentrations added (
Figure 3). Again, the cathodic/anodic current waves (I/I’) reflected Nd
3+/Nd
2+ ion redox transitions, cathodic current wave (II) and its anodic counterpart (II’) deposition/dissolution of neodymium metal, as well as current wave (III/III’) electrochemical deposition/dissolution of Pr(III)/Pr(0). A steep increase in the current observed at potentials more negative than −0.950 V in the cathodic region should correspond to Li deposition. The current wave observed in the reverse scan counterpart should correspond to Li anodic dissolution.
Details regarding electrochemical steps of Nd and Pr cations to metals at the working cathode in the molten fluoride salts are much more complex and are discussed elsewhere [
6,
7,
17]. Square-wave voltammetry (SWV) was employed to confirm the redox transitions of Nd and Pr cations to their metal forms during electrodeposition in fluoride based molten salt enriched with REO (
Supplementary Materials Figure S1 shows the SWV results obtained on W working electrode from the fluoride melt enriched with REO). It was established that within the applied electrochemical potential range, voltammograms obtained on the same working electrodes in the molten neodymium/praseodymium fluoride based electrolytes with REO added should be qualitatively similar, whereas the currents can vary appreciably. However, some of the reduction peaks (cathodic peaks I and III), especially in the electrolytes with 0.5 wt.% Nd
2O
3 + 0.5 wt.% Pr
6O
11 added to the base electrolyte, were not well pronounced. For example, cathodic peak (I) is not well pronounced, probably because the next process (represented by reduction current wave II) started while the previous process (described by current wave I) was still fading away. Due to close values of the reduction potentials for reactions Nd(III) → Nd(II) and Nd(II) → Nd(0), the cathodic current wave (II) partially masks current wave (I). This is in accordance with previous literature reports [
11]. It was also reported that in order to obtain ideally shaped individual current waves by cyclic voltammetry in molten salt systems, as in the case of redox transitions of Nd and Pr cations, interactions must be separated by at least 177 mV in the potential scans [
11]. In our study, the reduction potentials of Nd(II) ions into Nd metal and the reduction potential of the redox process of Pr(III) ions were closer. This is consistent with the results reported in the literature on molten fluorides [
5,
6,
7].
In the CV results recorded at various sweep rates (100–200 mVs
−1) in the chosen basic electrolyte with different concentrations of Nd
2O
3 and Pr
6O
11 at 1050 °C (
Figure 3), the peak potentials did not exhibit a strong dependence on the applied sweep rates, which is an indication of reversible system behaviour, as previously reported [
6,
7].
These cyclic voltammograms are consistent with those recorded under the same conditions in the molten fluoride electrolyte composed of 63.17 wt.% NdF
3 + 20.96 wt.% PrF
3 + 12.02 wt.% LiF + 1 wt.% Pr
6O
11 + 1 wt.% Nd
2O
3 [
6,
7]. Comparison of the presented voltammograms suggests that the observed redox couples associated with the above cited electrochemical reactions are in agreement with those recorded in our previous studies [
6,
7]. With respect to electrolyte composition, it should be noted that the experimentally recorded current densities of the redox processes obtained by CV under the same conditions in the previously reported electrolyte with higher LiF concentration (NdF
3 + PrF
3 + 12.02 wt.% LiF) were substantially lower than those in the electrolyte with a lower concentration of LiF (NdF
3 + PrF
3 + 9 wt.% LiF). This can be attributed to the LiF content in the electrolyte used to dissolve REO because the content of different salts in molten fluoride determines the solubility of REO [
8,
21,
22,
28,
29,
30]. In the basic electrolyte, mass exchange takes place among the added oxides and existing rare earth fluorides; as a result, an equilibrium chemical composition is formed in the molten electrolyte [
8]. Therein, LiF acts as a dilution agent for the melts, but an increase in LiF concentration above a certain value was observed to reduce the REO solubility [
28,
31,
32]. It seems that LiF acts as a donor of F¯, which should improve the electrolyte conductivity and help reduce the electrolyte’s viscosity while simultaneously reducing the solubility of rare earth oxides in the electrolyte [
28]. It was suggested that the solubility of rare earth oxides in the electrolyte is limited (approximately 3–5%) and that the optimal LiF concentration in fluoride based baths is up to 12.5 wt.% [
28]. Upon entering the molten salt, Nd
2O
3 dissolves in the presence of NdF
3 and excess F
¯; as a result, neodymium oxyfluoride is formed [
6,
21]. Neodymium oxyfluoride then reacts to form NdO
+ and Nd
3+, which are converted to metallic Nd at the cathode [
6,
21,
23]. In addition, Nd(III) ions with a surplus of F¯
- ions form a neodymium fluoride complex. The neodymium fluoride complexes also participate at the cathode as a source of Nd metal during electrolysis. Which of the corresponding species are predominantly involved as a source of neodymium metal on the working electrode substrate is determined by the applied electrode potential, current density and molar ratio of neodymium oxyfluoride ions/neodymium fluoride complexes [
6,
7]. Relatively similar solubility of praseodymium oxide in fluoride based electrolyte is closely related to the similarities in the atomic structure of Pr and Nd [
8]. When praseodymium oxide is dissolved in neodymium fluoride or corresponding praseodymium fluoride electrolyte, solubility is not significantly affected [
8]. The addition of REO to the fluoride based melt at a certain melt temperature after dissolution induces the formation of various Re-O-F or/and Re-F complex groups [
22,
33]. This means that the increase in cathodic/anodic current peaks related to Nd and Pr redox transitions is due to the presence of a number of neodymium/praseodymium complexes in the melt, leading to rare earth metals deposited on the cathode.
In order to obtain higher quantities of neodymium and praseodymium metals from Nd and Pr oxyfluoride melts, potentiostatic deposition was performed at −0.950 V and −0.900 V vs. W. In the initial investigation performed with 45.5 wt.% NdF
3 + 45.5 wt.% PrF
3 + 9 wt.% LiF + 0.5 wt.% Nd
2O
3 + 0.5 wt.% Pr
6O
11 electrolyte on W cathode, we showed that CV and SWV behaviour can reliably predict the Nd and Pr redox transitions, as well as Nd-Pr co-deposition [
34]. CV experiments (
Figure 2 and
Figure 3) have proven that such a cathodic end potential is negative enough to sustain praseodymium and neodymium electrodeposition but not negative enough to induce lithium deposition. The chronoamperometric
i = f (
t) responses to the constant potential applied to the W working electrode for the same time at 1050 °C in the fluoride based electrolyte 45.5 wt.% NdF
3 + 45.5 wt.% PrF
3 + 9 wt.% LiF with different REO contents varied (
Figure 4). For example, deposition from the electrolyte with total of 2 wt.% RE oxides maintained a descending deposition current density, with an average value of ≈ −12 mAcm
−2 (
Figure 4a). In the electrolyte with a total of 4 wt.% RE oxides added, the deposition current density increased to an average value of ≈ −16 mAcm
−2 (
Figure 4b). After two hours of deposition, with all other conditions held constant, the value of the deposition current used in the electrolyte with 4 wt.% REO added was ≈ 33% greater than that in the electrolyte with a lower REO concentration.
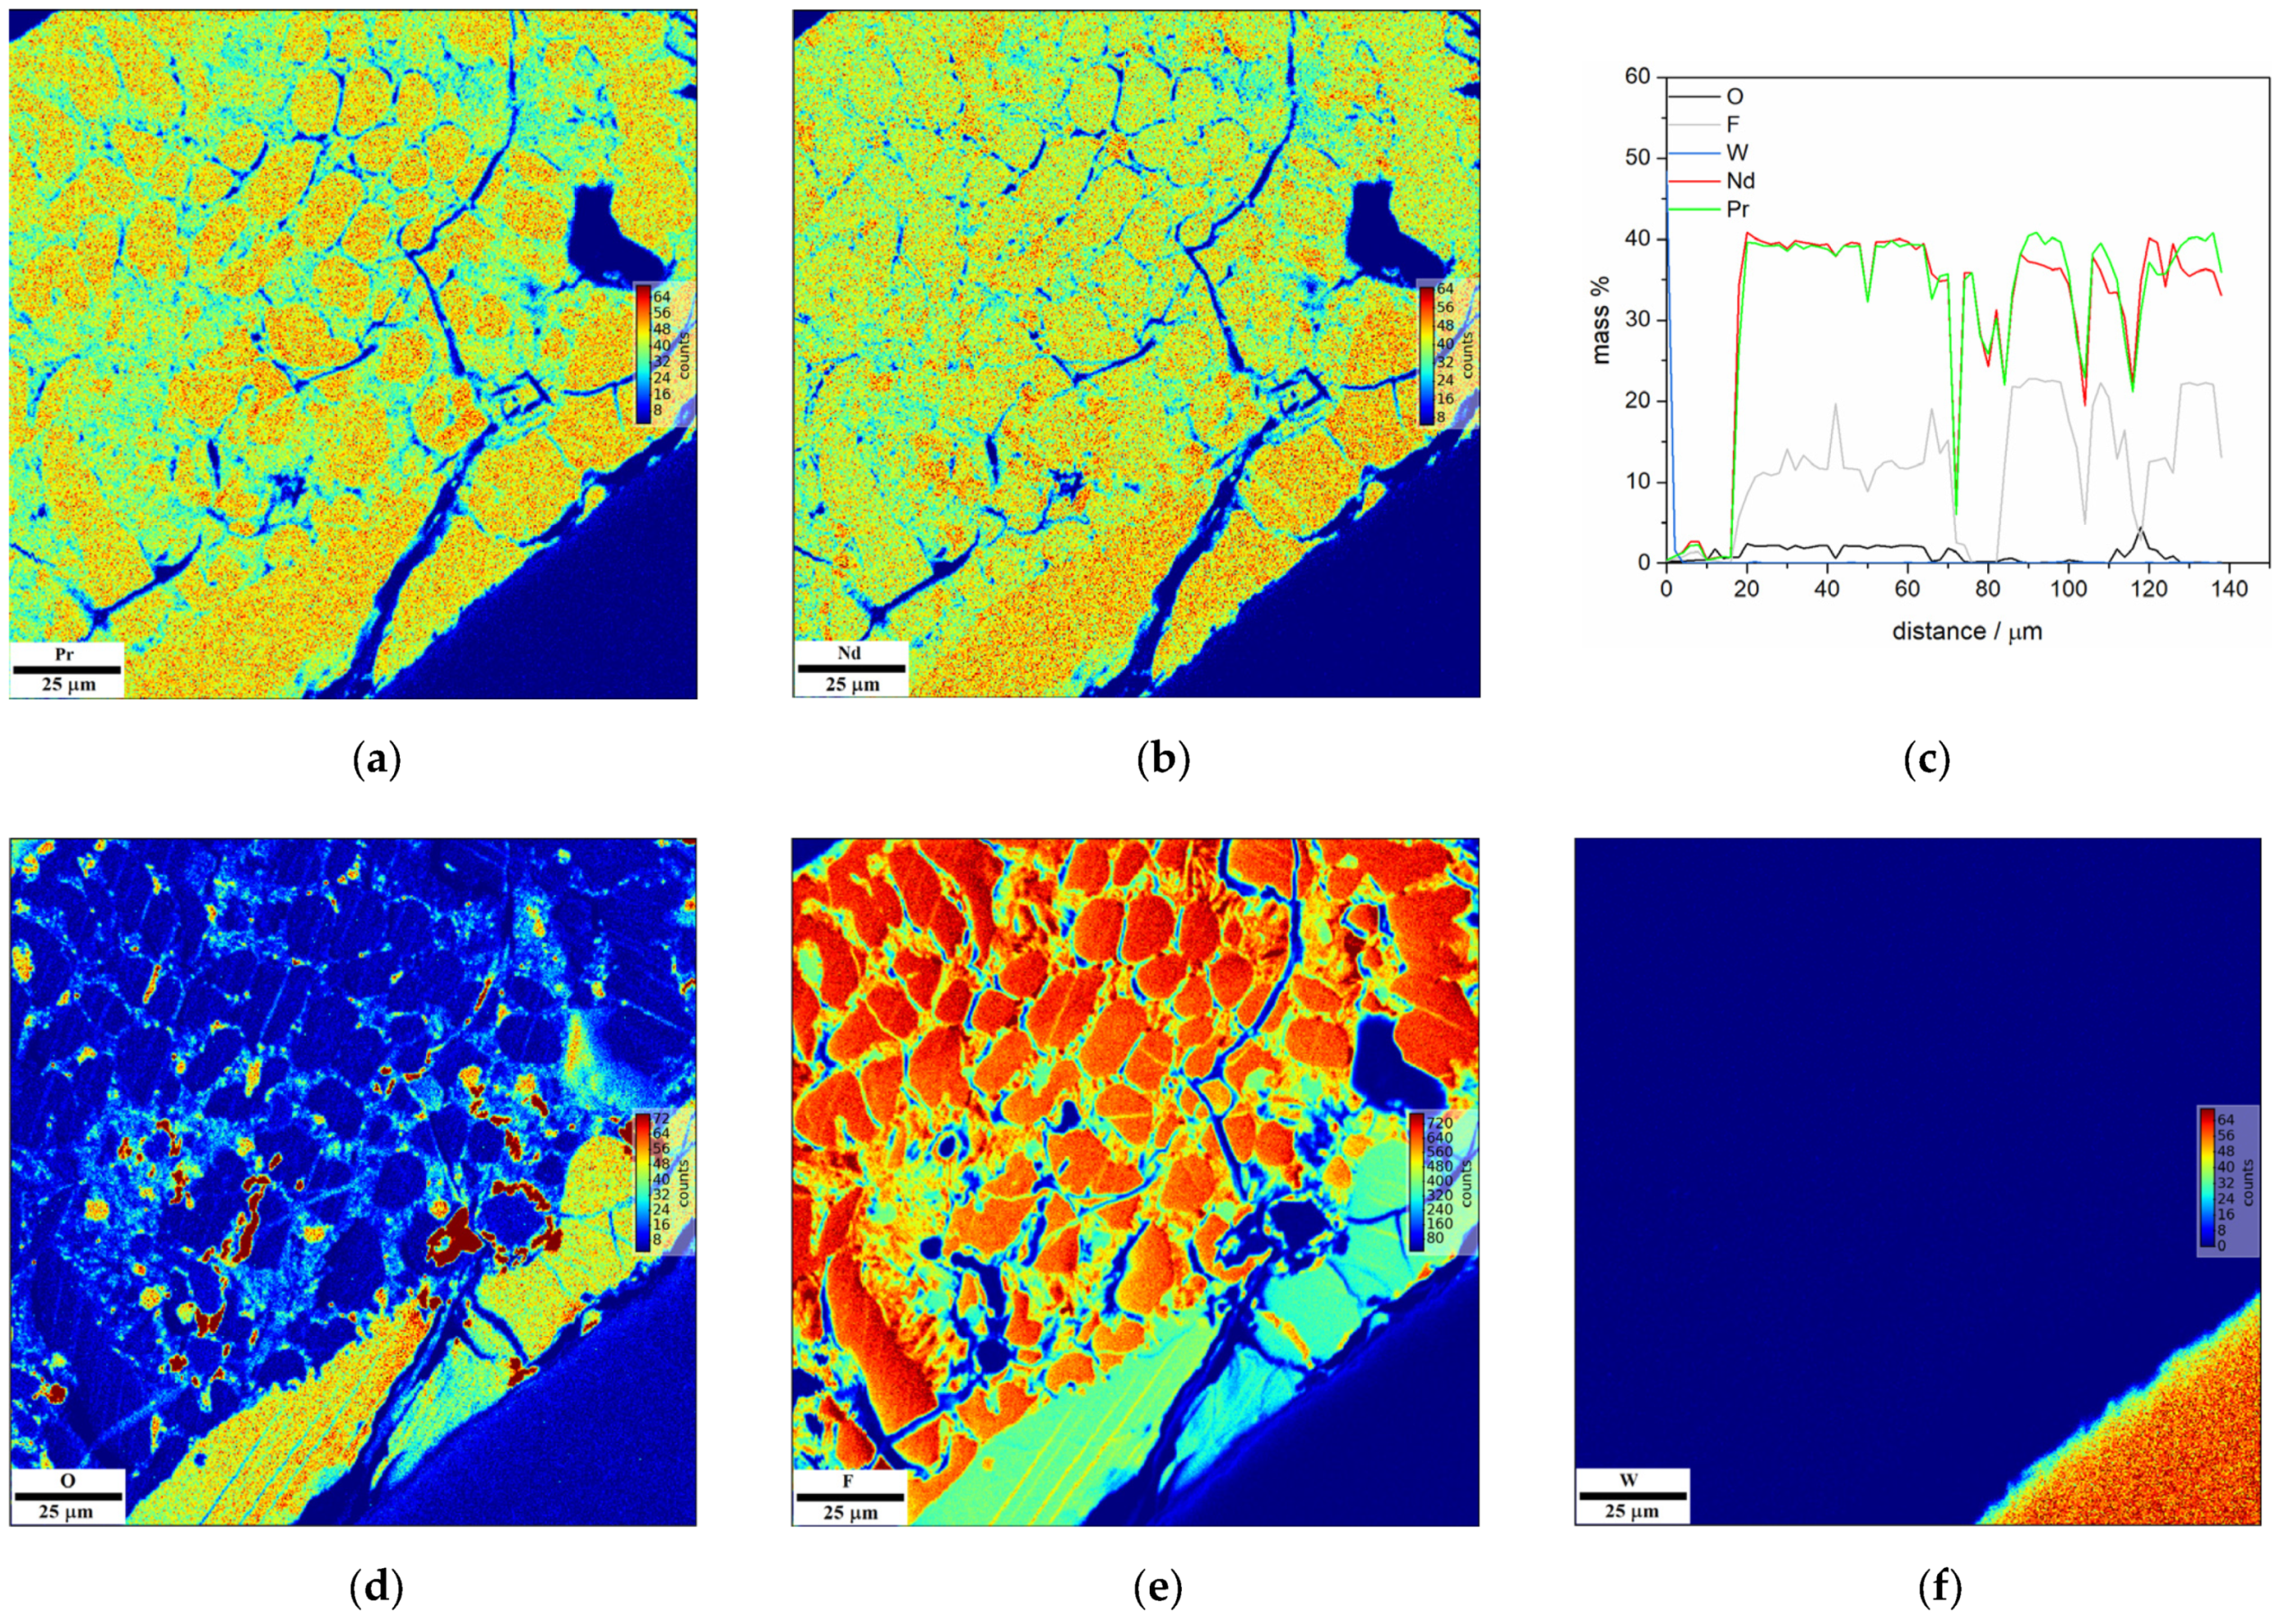
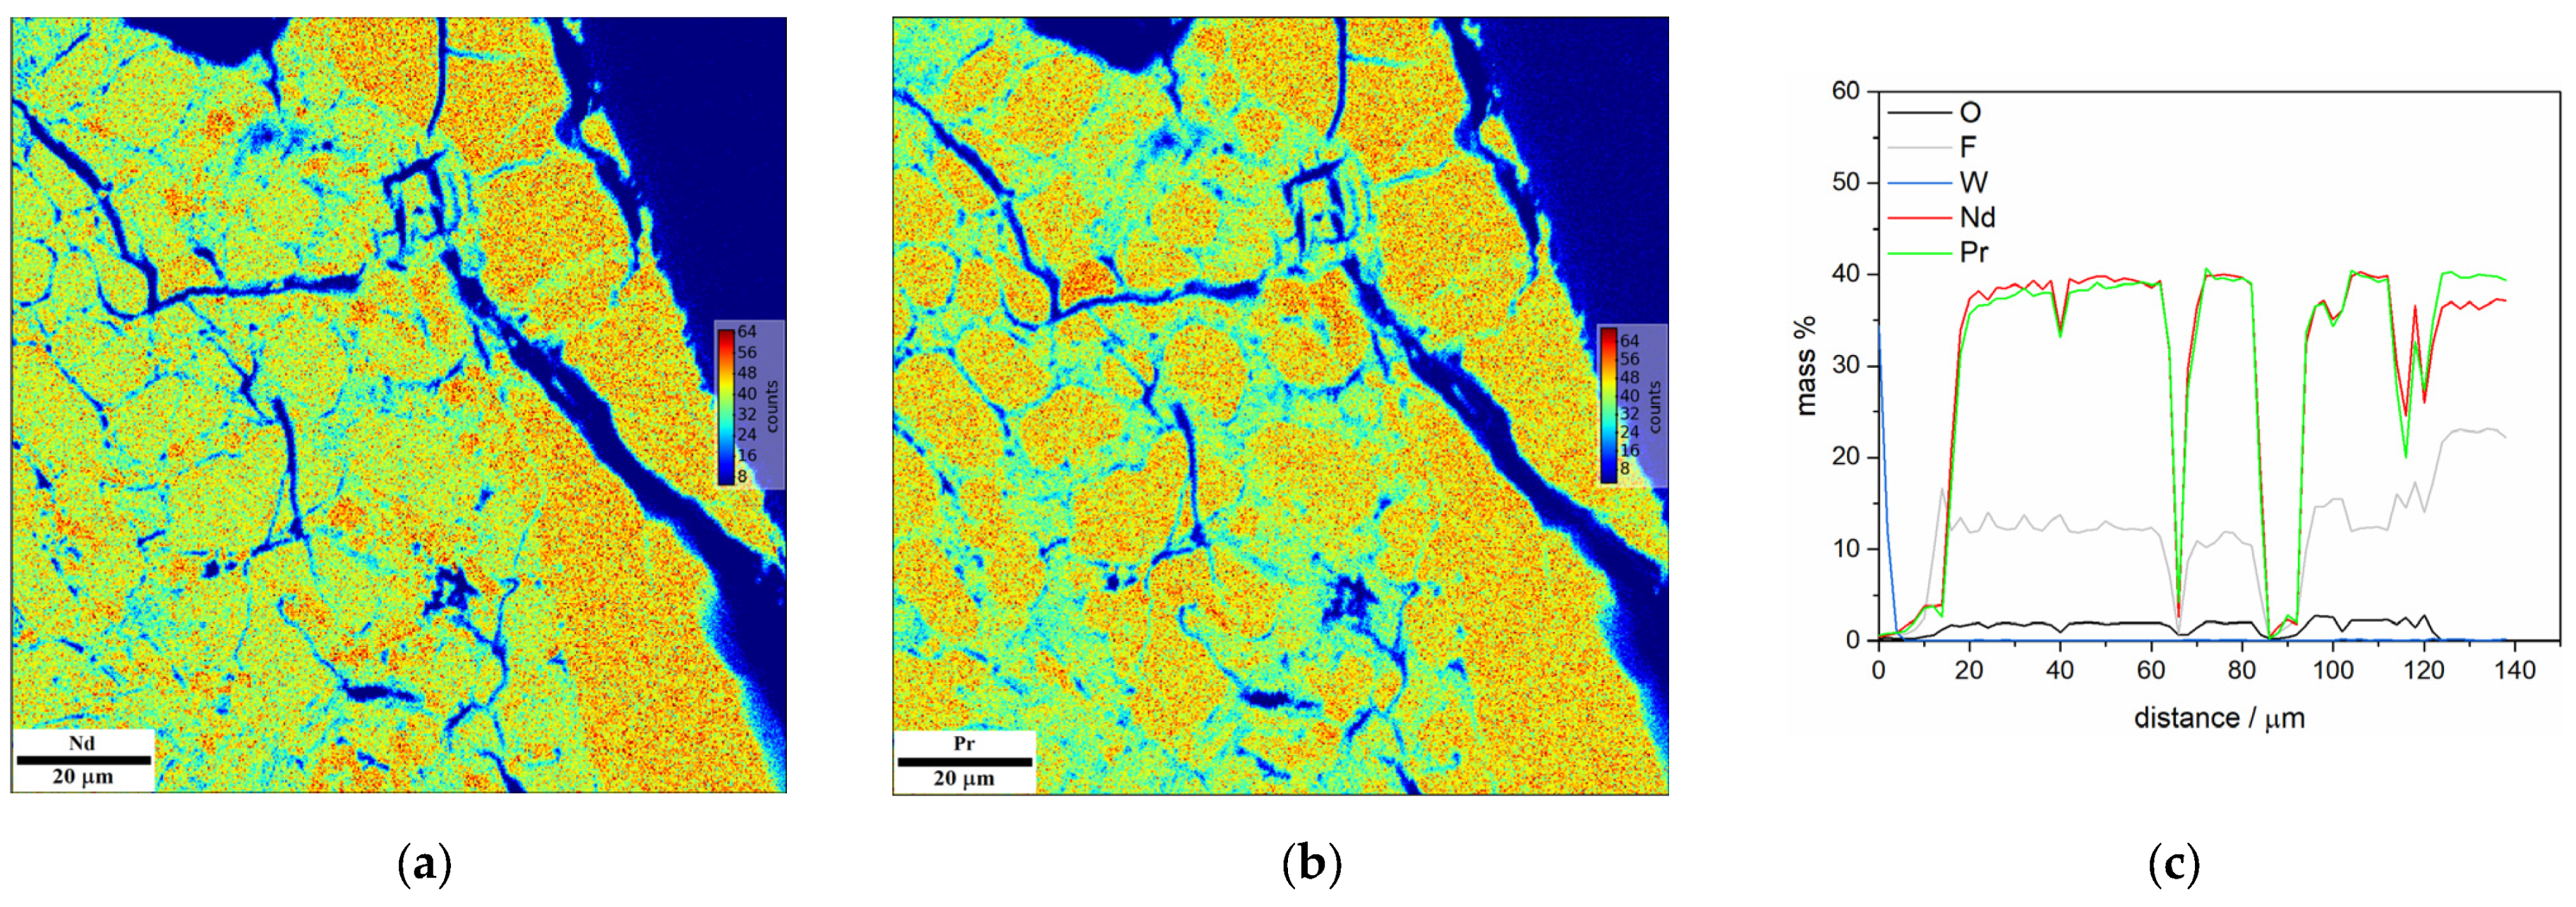
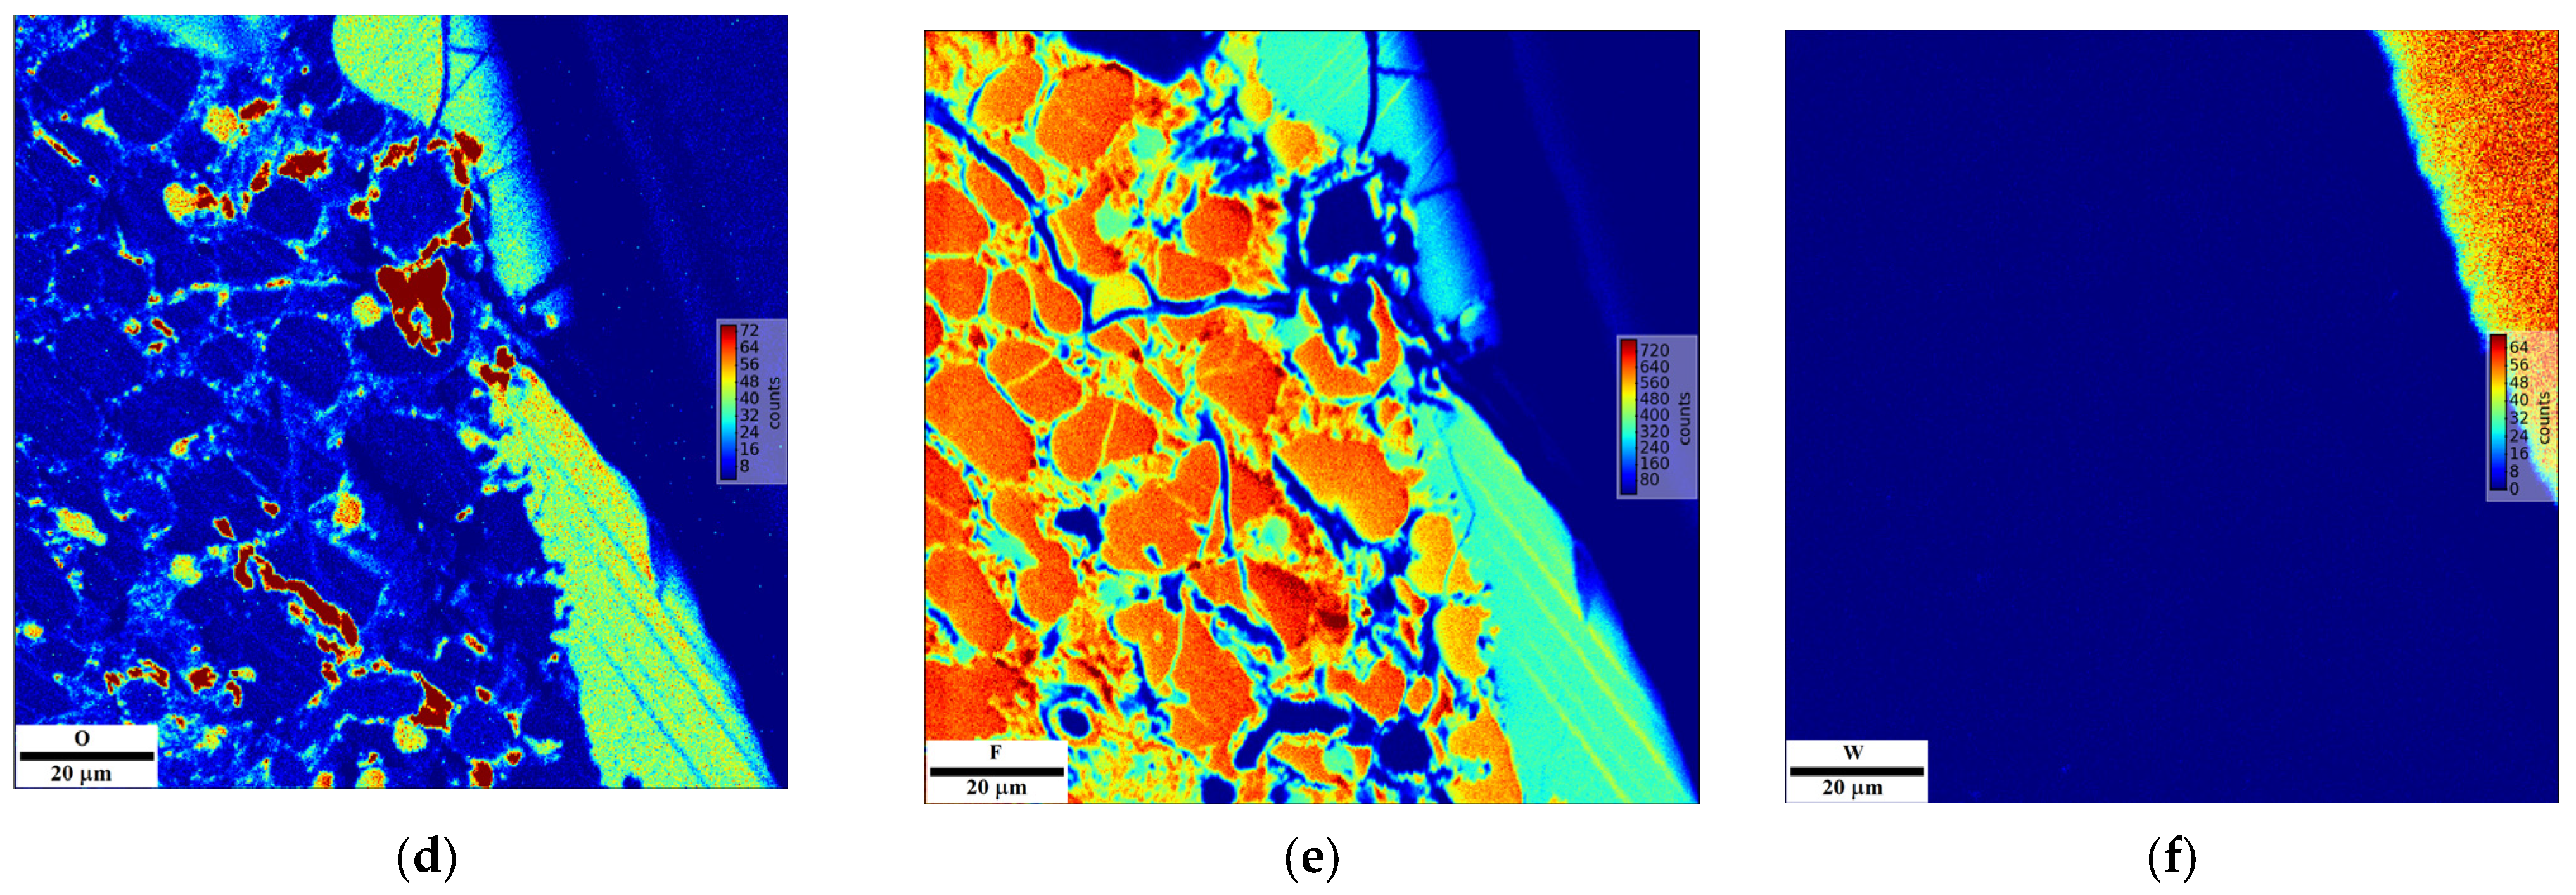
EPMA mapping of the samples after deposition from the fluoride based electrolyte enriched with REO is shown in
Figure 5 and
Figure 6. Neodymium and praseodymium metal deposits on W cathode were confirmed (
Figure 5 and
Figure 6). Most of the neodymium and praseodymium metal is distributed in the area close to the working electrode substrate (
Figure 5a,b and
Figure 6a,b). This area represents a thin layer of Nd and Pr metallic phase deposited on the electrode surface. Oxygen and fluoride are present in the lowest recorded concentrations in these areas (
Figure 5d and
Figure 6d), which suggests that large fractions of the oxyfluorides complexes formed by either oxide or fluoride exchange with available fluorides or oxides in the electrolyte were converted into metallic neodymium or/and praseodymium. EPMA quantification results (
Figure 5c and
Figure 6c) showing the area from the cathode surface up to the bulk solution indicate a high concentration of Nd and Pr metals (approximately 40 mass% neodymium and 40 mass% Pr), suggesting that the metals were deposited at the cathode.
The area with the highest concentration of fluoride corresponds to the melt residue phase, as it was shown in
Figure 5e and
Figure 6e. The EPMA analysis data show that the oxygen is mainly situated in the electrolyte (
Figure 5d and
Figure 6d).
It is apparent that the distance between the cathode surface and the beginning of the melt residue shown in
Figure 5a,b and
Figure 6a,b is different (in
Figure 5, it is ≈ 60 μm, and in
Figure 6, it is ≈ 80 μm). This suggests that neodymium and praseodymium metal yields increased slightly as the percentage of Pr
6O
11 and Nd
2O
3 added was increased in the base electrolyte from 2 to 4 wt.% REO.
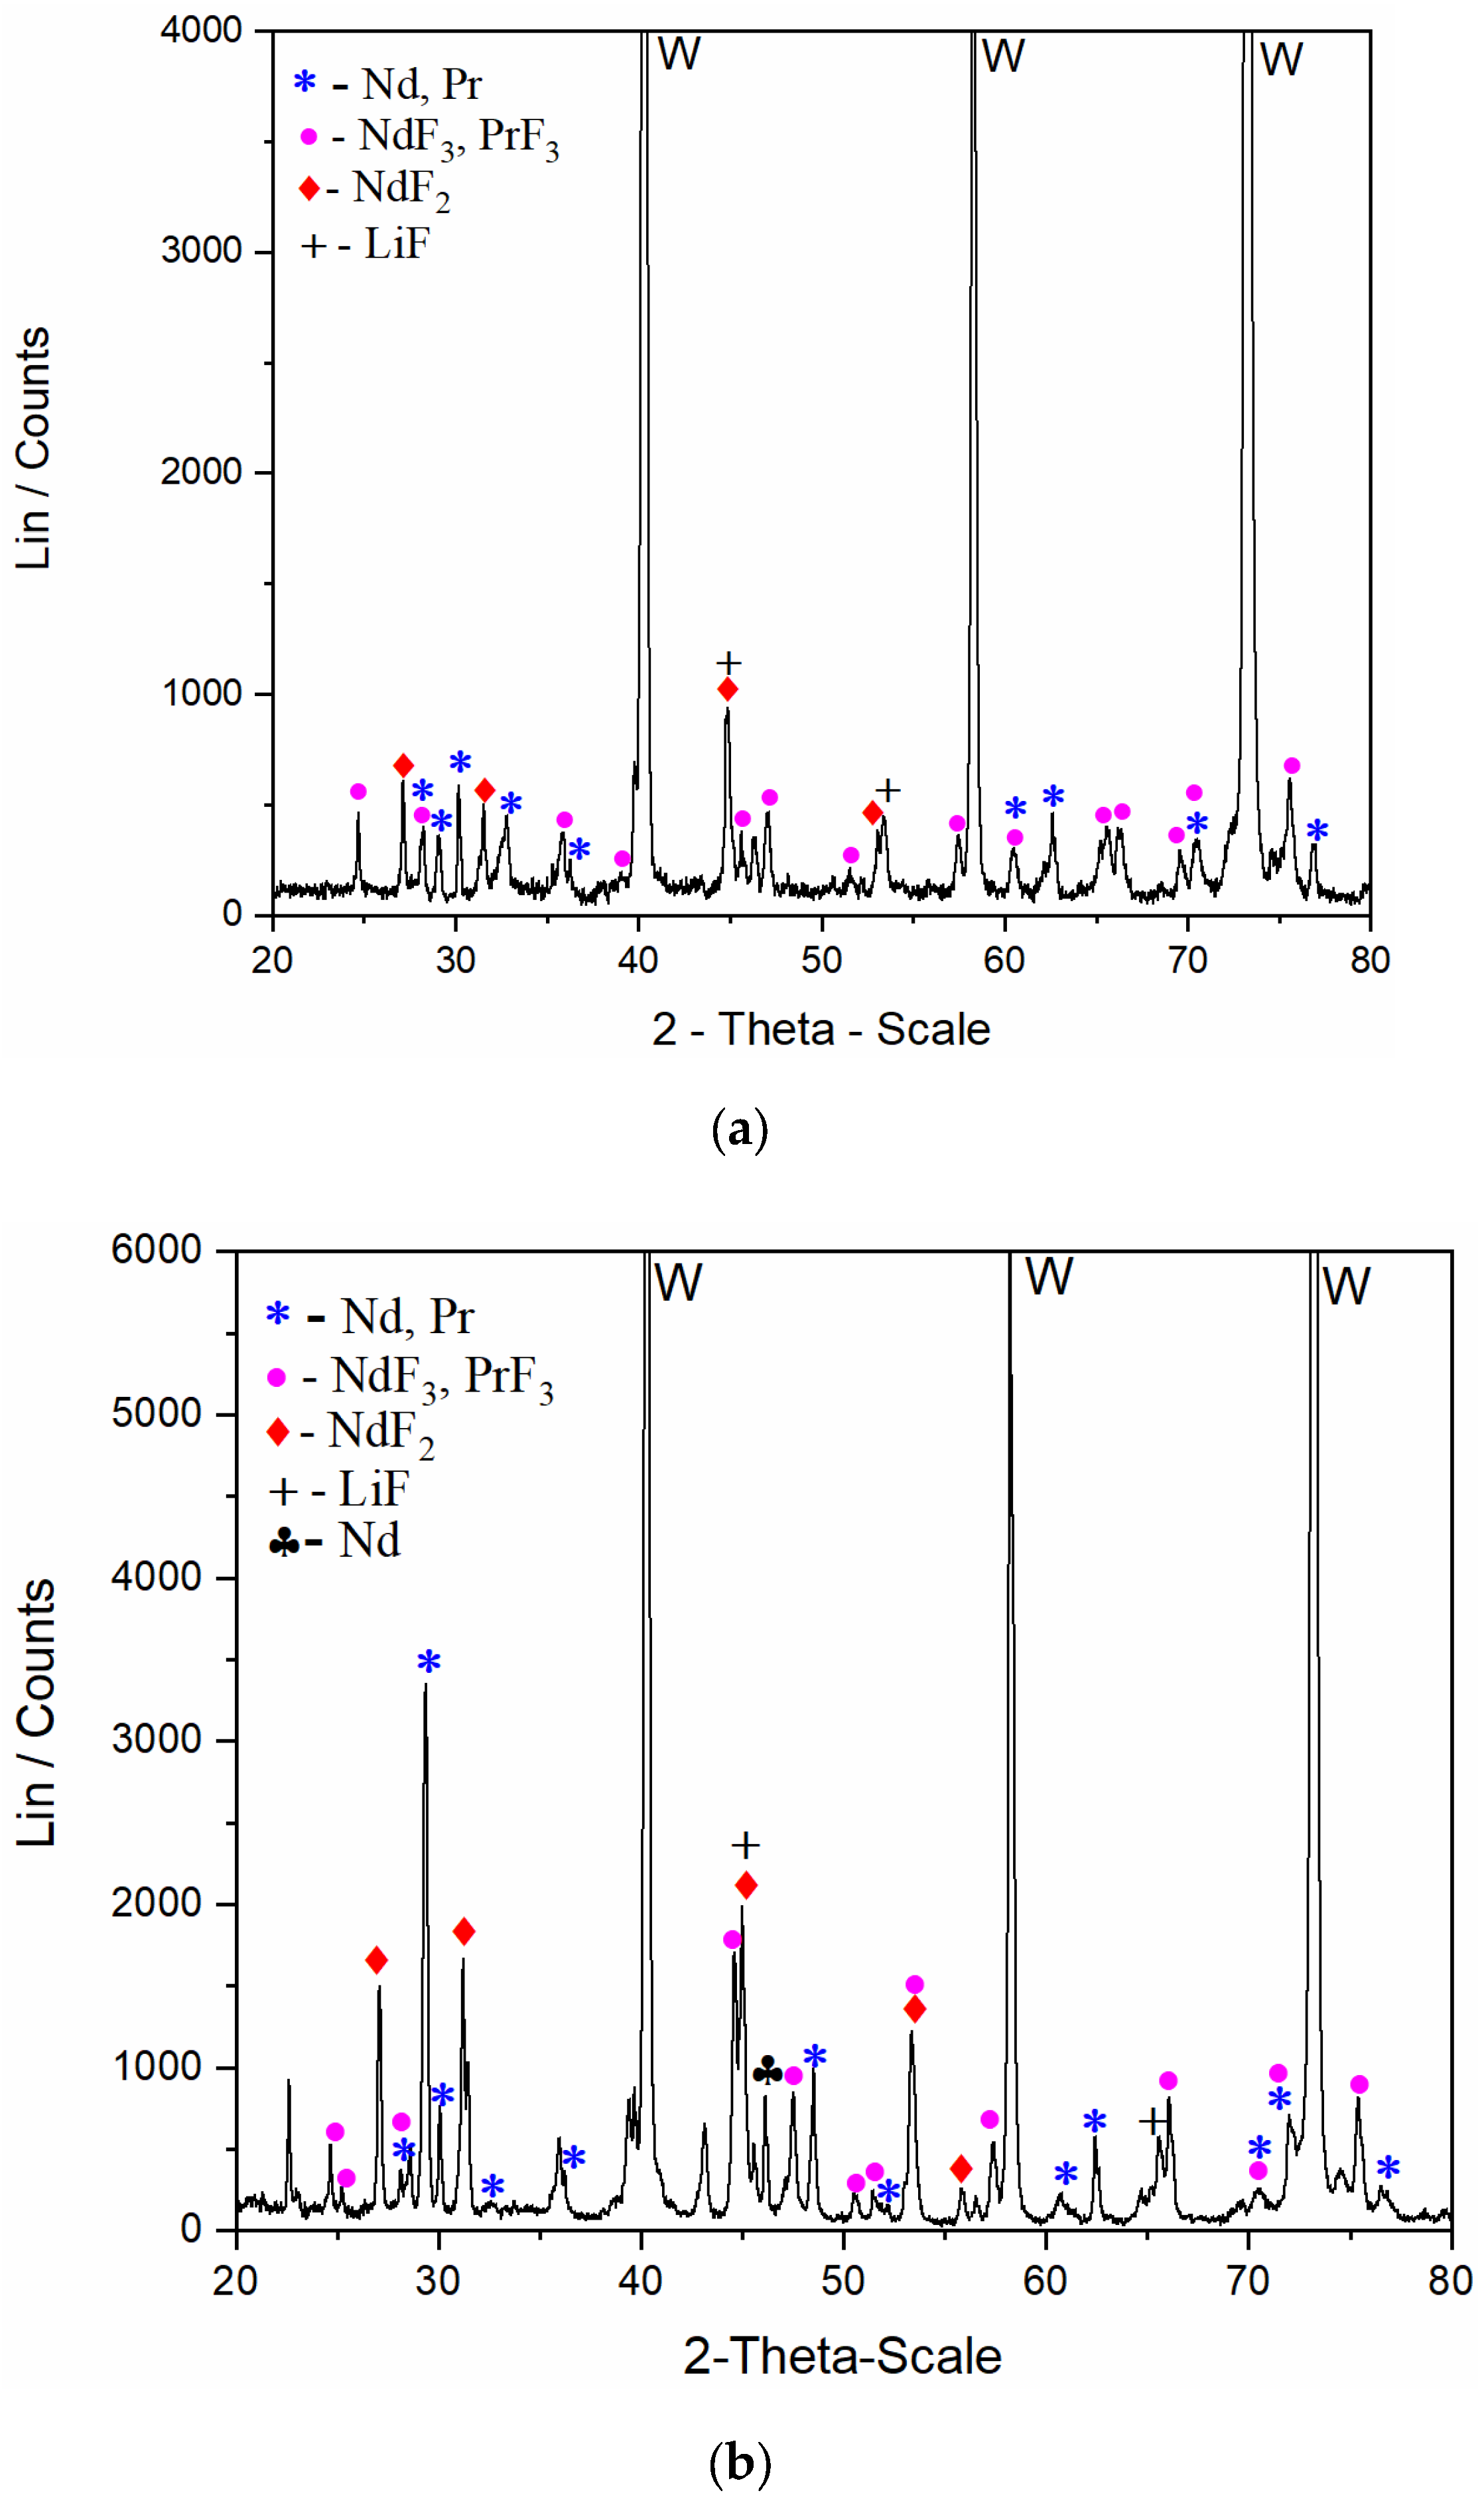
In order to apply XRD analysis to the working electrode after prolonged deposition, the solidified electrolyte was mechanically removed from the working electrode surface. The samples were then analysed by XRD (
Figure 7a,b).
Figure 7a shows an XR diffractogram of the sample obtained on a W cathode in potentiostatic mode at −0.950 V vs. W in molten NdF
3 + PrF
3 + LiF + 1 wt.% Nd
2O
3 + 1 wt.% Pr
6O
11 electrolyte at 1050 °C after 240 min. Corresponding neodymium metal peaks were observed at 28.16°, 29.18°, 30.28°, 32.06°, 36.40°, 60.52°, 62.37°, 70.38° and 77.33° (JCPDS No. 03-065-3424). Because of the similar lattice parameters, the same peaks, with slight variation in 2
θ values, were observed for praseodymium metal (JCPDS No. 01-089-2921). In addition to the strong peaks of neodymium and praseodymium metals, the characteristic peaks of NdF
2 were observed (JCPDS No. 00-033-0934). It is important to note that NdF
2 is a product of the following disproportionation reaction: Nd(0) + 2Nd(III) → 3 Nd(II). Formation of NdF
2 is unavoidable during Nd electrodeposition from fluoride based melts or halide electrolytes, as observed by other authors [
6,
7,
11,
35].
Figure 7b shows the XRD analysis of the W cathode after potentiostatic deposition in the same base electrolyte melt with 4 wt.% REO added at 1050 °C. As shown in the XR diffractogram, the cathode deposit exhibits peaks of Nd and Pr metals, indicating a small amount of melt residue. The 2
θ values for neodymium and praseodymium metal are in agreement with the previous diffractogram (
Figure 7a). There are three additional, relatively strong peaks that are related to neodymium and praseodymium metals, which were observed at 48.06°, 52.37° and 71.75°. Apart from the prominent peaks corresponding to neodymium and praseodymium metals, there is a peak at 46.1°, referred to as Nd metal (JCPDS No. 03-065-3424). The peaks related to LiF (JCPDS No. 01-072-1538) were hardly detectable on the electrode surface. The samples obtained after potentiostatic deposition clearly verified that rare earth metals were produced on the W working electrode.
The results from this study, as well as those of our previous work, validate our choice of the electrolyte composition, as well as the applied deposition potentials. Peaks corresponding to NdF
2 observed in the diffractograms imply that the amount of NdF
2 increases with increased addition of rare earth oxides. Although the reaction of disproportionation decreases the yield of neodymium metal remaining on the working electrode surface, the efficiency of the electrolysis process was improved with REO addition. This is in accordance with the EPMA results (
Figure 5 and
Figure 6), which demonstrated that the quantities of Nd and Pr metals on the cathode are increased with increased REO addition. It is evident that the results of the XRD analyses are comparable those reported in our previous studies, confirming the applicability of the calculated phase diagram to the electrolyte composition used in the present work [
6,
7,
17].


 ,
, 


