Article

Influence of Sinter Parameters on CO Emission in Iron Ore Sintering Process

1
State Key Laboratory of Advanced Steel Processes and Products, Central Iron & Steel Research Institute Company Limited, Beijing 100081, China
2
School of Metallurgy and Energy, North China University of Science and Technology, Tangshan 063210, China
3
School of Metallurgy and Chemical Engineering, Jiangxi University of Science and Technology, Ganzhou 341000, China
*
Author to whom correspondence should be addressed.
Metals 2022, 12(7), 1202; https://doi.org/10.3390/met12071202
Submission received: 29 May 2022 / Revised: 7 July 2022 / Accepted: 13 July 2022 / Published: 15 July 2022

Abstract

:
Carbon monoxide is the major hazardous component in flue gas exhausting from the iron ore sintering. This study aims to reduce the CO emission by changing the sinter parameters by sintering pot tests; specifically, the sinter quality, CO concentration, and total emission in sintering flue gas were analyzed in detail. The sinter strength properties, including the shatter index and the tumble index, are analyzed by the sintering pot test and the sintering flue gas discussion. The results show that the CO emission can be suppressed by modifying the sinter parameters, such as carbon content, coke breeze and coal breeze ratio, water addition, and sintering negative pressure. The good sinter parameters with the lower CO emission are 2.8% carbon content and 7.5% water in the sintering mixture. A higher coke breeze to coal breeze ratio, or only coke breeze fuel in the sinter mixture, is beneficial for the lower CO emission with a negative fan pressure of −12 kPa.

1. Introduction

Iron ore sintering is an agglomeration process of iron ore fines, fluxes, fossil fuel (coke and coal), and some iron-bearing waste materials in the ironmaking and steelmaking industry [1]. Sinter is one of the main raw materials used in a blast furnace (BF) accounting for more than 70% ferrous burden of BF in China [2]. Sinter production in 2020 reached approximately 1.1 billion tons, calculated by the iron output of 887.5 million tons [3]. The energy of the sintering process is mainly from fossil fuels, such as coke powder and anthracite [4]. The fossil fuels use approximately 50 kgce/t-sinter [4]. However, sintering operations in ironmaking or steelmaking is one of the main air pollution sources of harmful emissions, including CO, CO2, SO2, NOx, Hg, particulate matter, and volatile organic compounds [1,5,6,7,8]. Currently, research concentrates on SO2, NOx reduction, and energy-saving [9,10,11,12,13,14,15,16,17,18,19,20].
The CO in the sintering flue gas comes from the incomplete combustion reaction of fossil fuels in a local low-oxygen atmosphere [21,22]. The CO concentration in the flue gas is 3750–10,000 mg/m3 [21]. Sinter wind boxes research showed that CO concentration changes could be divided into three stages, rapid rising, high concentration, and rapid decline. The highest CO concentration in the sinter wind boxes can reach 28,000 mg/m3 during the sintering process [21].
Sintering flue gas recycling is a good energy-saving and CO emissions reducing strategy. The CO-containing flue gas is recirculated into a sintering bed, reducing the COx emission in recycling flue gas [19,23]. Stand-support sintering was studied to improve oxygen potential in iron ore sintering, optimize energy efficiency, and reduce the CO content in flue gas by increasing the stand height [24,25]. Although biomass is adopted instead of fossil fuels for abating CO2 and harmful emissions in the iron ore sintering process, replacing coke with biomass increases CO content in the flue gas [26,27].
Based on the analysis above, optimizing sinter parameters is a convenient and operable way to reduce CO emission. Appropriate sinter parameters can also improve sinter quality and reduce costs. For the first time, this study comprehensively analyzed the CO emission and sinter quality changes under various sinter parameters, including carbon addition, coke breeze to coal breeze (CTC) ratio, water ratio, and negative pressure. This paper aims to find the connection between the sinter parameters and the CO emission, and the combination of sinter parameters with low CO emission under the condition of ensuring the sinter quality. The results are expected to offer a useful guide for reducing CO emissions by altering the sinter parameters, so as to improve the utilization rate of fuel in the sintering process.

2. Materials and Methods

2.1. Raw Materials

Table 1 shows the chemical compositions of raw materials. Iron ore blending, solid fuels, fluxes (light burned dolomite, quicklime, and dolomite), and return fines were selected in sintering tests. Two types of solid fuels were added to the experiments, coke breeze and coal breeze from an industrial sintering plant. The proximate and ultimate analyses of the two fuels are illustrated in Table 2.

2.2. Methods

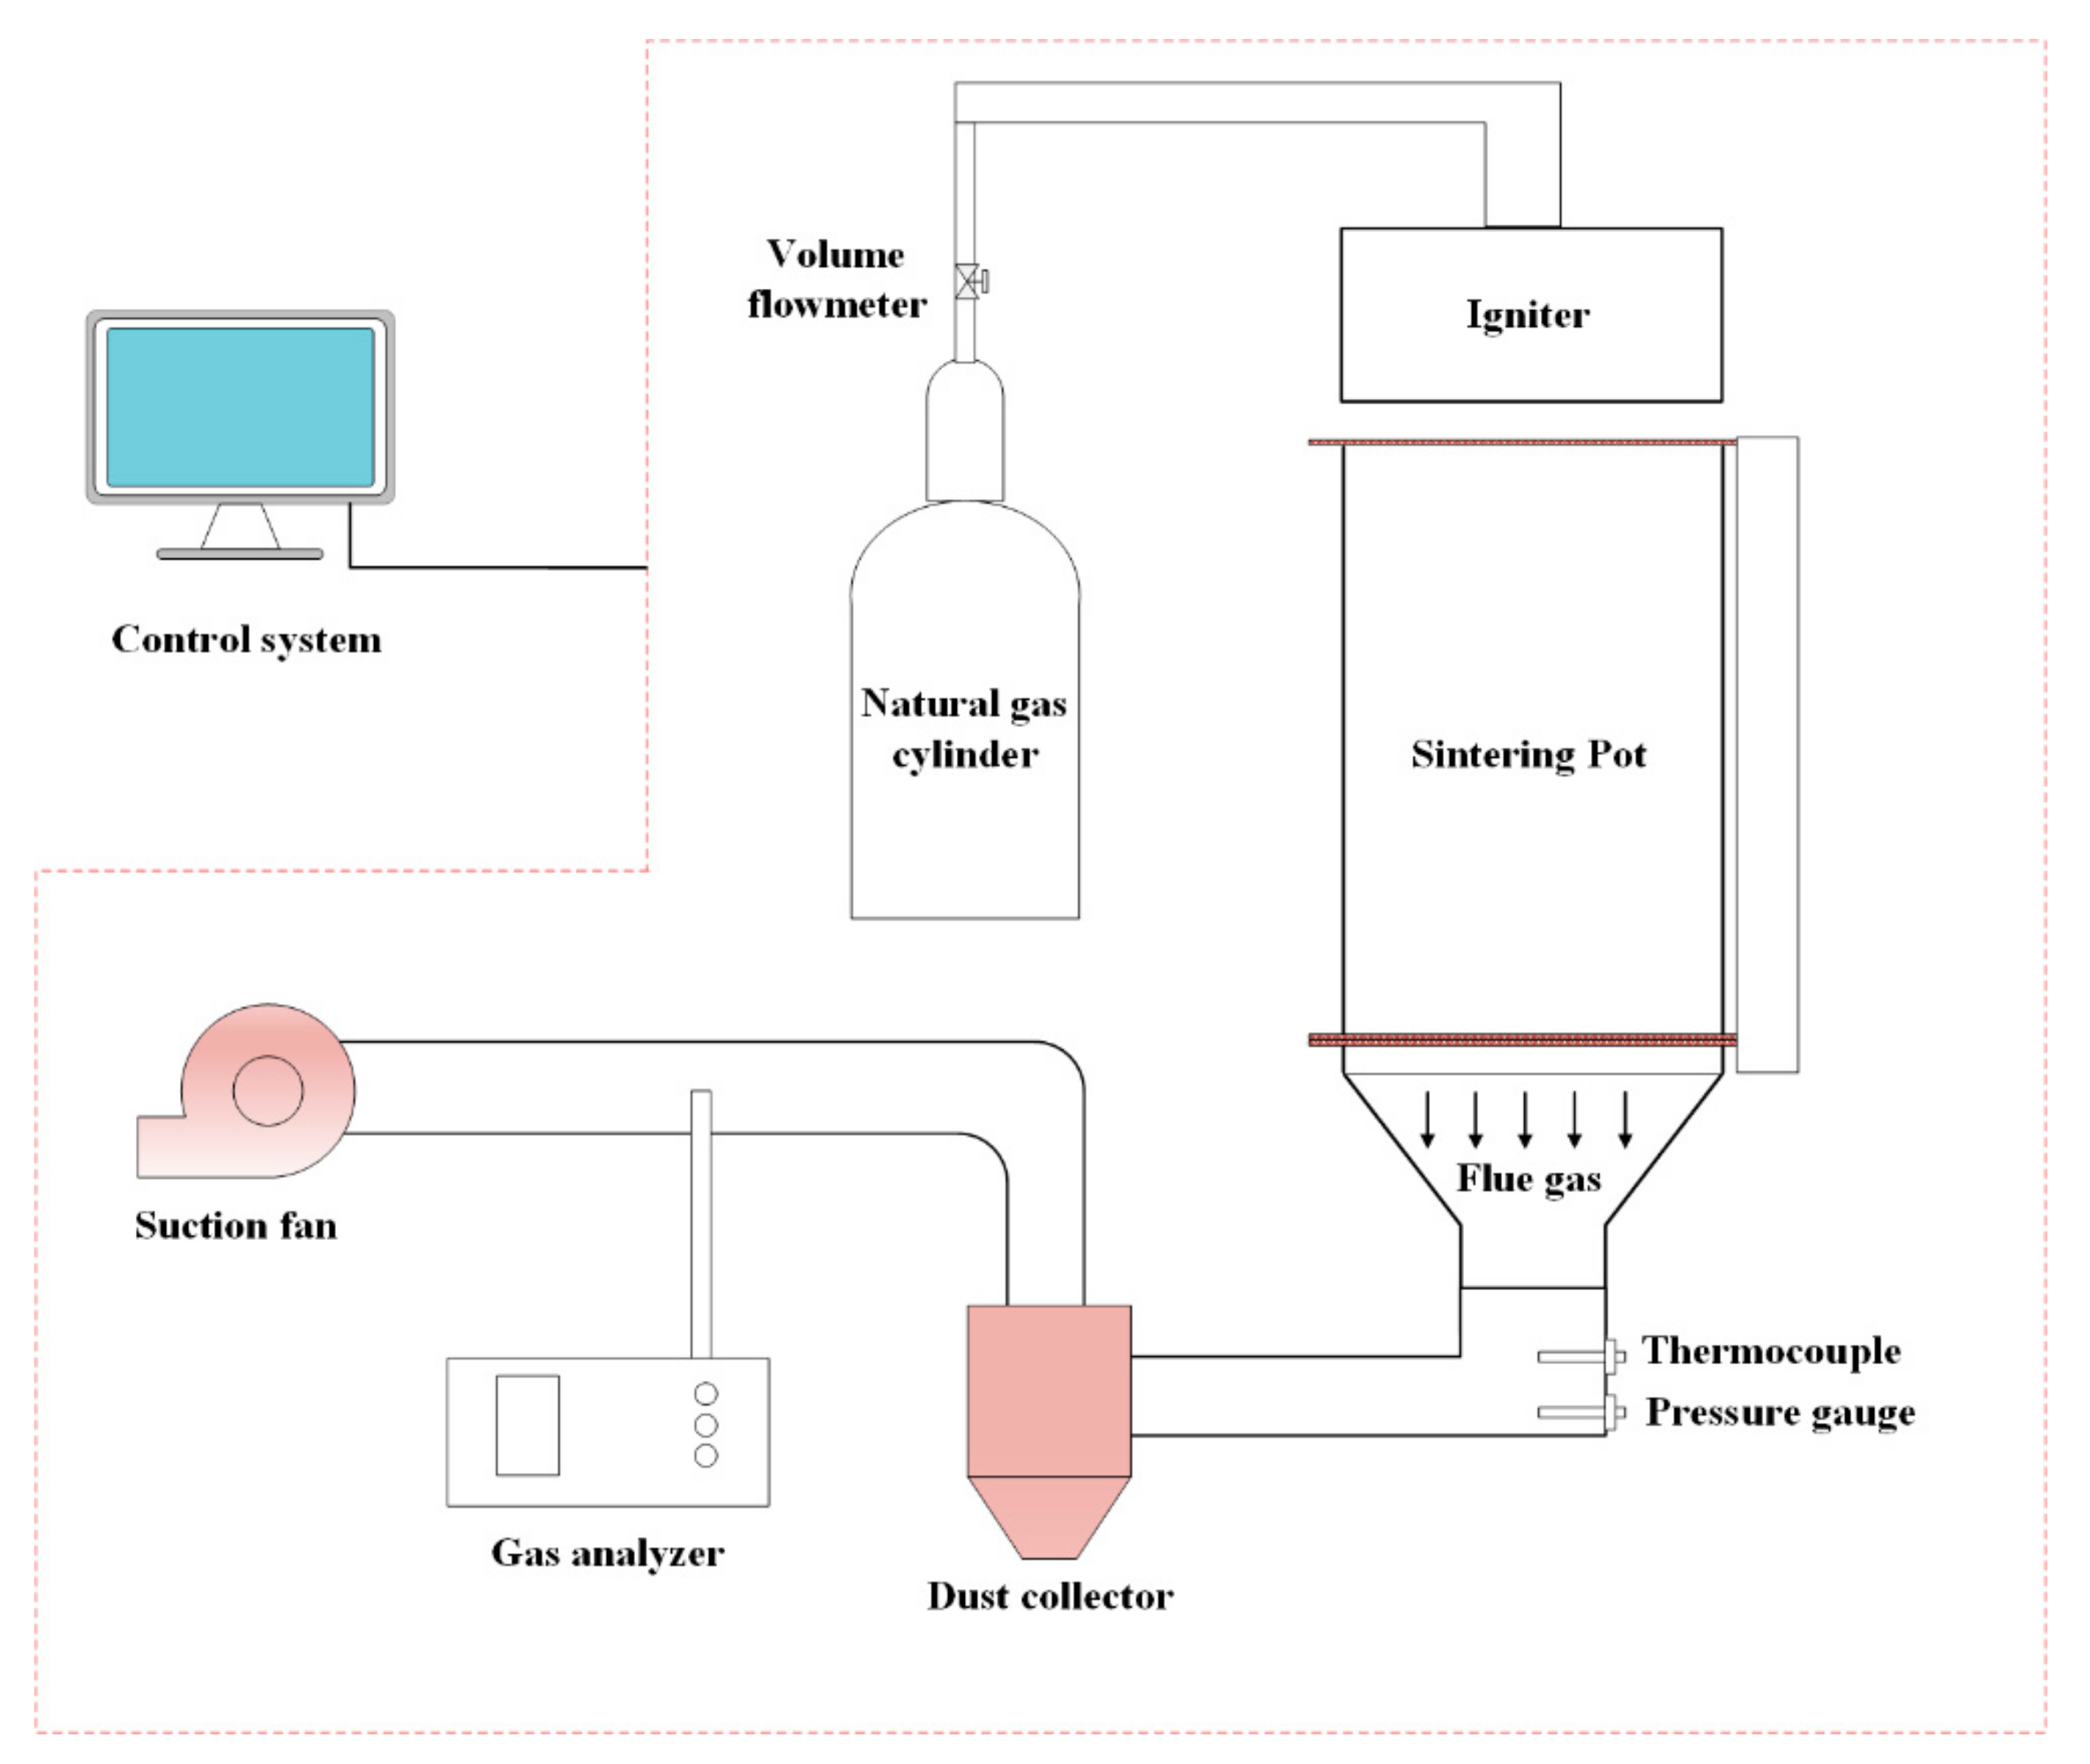
2.2.1. Sintering Pot Test

The sintering tests were conducted in a laboratory pot filled with 35~40 kg of the raw materials. The sintering apparatus schematic diagram is shown in Figure 1, and the sintering pot parameters are shown in Table 3.
In a sintering test procedure, the raw materials were weighed and mixed according to the scheme given in Table 4 firstly. Then the mixture was blended manually for the first mixing, during which about 80% of prescribed water was added. After the first mixing, the mixture was put into a drum with a diameter of 500 mm and a length of 1200 mm to further mix and granulate. The rotation speed of the drum was 24 r/min which lasted 150 s. During the mixing in the drum, the rest water of 20% was evenly added into the mixture. After the granulation, 1 kg sinter (10–16 mm) was charged into the sinter pot as a hearth layer, and granulated mixture was then fed in. After feeding, the fuels in the surface layer were initially ignited by an igniter. Specific ignition parameters include the ignition period of 90 s, the ignition temperature of 1034 ± 50 °C, and the ignition negative pressure of 8 kPa. After igniting, the negative pressure during the sintering process were adjusted according to the scheme. During the whole sintering process, the CO concentration of flue gas was detected by a gas analyzer. After the test, the sinter produced was removed from the sinter-pot. Then, the shatter and tumbler strength are expressed by the shatter and tumbler indexes, respectively.
The shatter index was measured as per YB/T 4606-2017 to estimate the sinter yield. Following YB/T 4606-2017, the samples were dropped four times from a height of 2 m, and a sinter with a size > 10 mm was defined as the product. Here, the shatter strength of the sinter was calculated by the net weight of the sintered product divided by the total sinter cake.
The tumbler index was measured per ISO 3271/75 to estimate the cold strength. Based on the method introduced in ISO 3271, 15 kg of sinter with the size fraction of 10–40 mm was tumbled in a circular drum at 25 r/min for 200 times. Its internal diameter was 1000 mm and its internal length was 500 mm. The sinter was sieved through 6.3 and 0.5 mm sieves, and tumbler strength was estimated by the percentage of the sinter with a size fraction greater than 6.3 mm. The calculation equations for the shatter and tumbler indexes are given as Equations (1) and Equation (2), respectively.
S I = G 1 G 0 × 100 %
where SI is the shatter index of sinter in %, G0 is the mass of the total sinter cake in kg, and G1 is the ≥10 mm sinter mass in kg.
T I = m 1 m 0 × 100 %
where TI is the tumbler index of sinter in %, m1 is the >6.3 mm sample mass after tumbling in kg, and m0 is the sample mass in kg.

2.2.2. CO Concentration Detection and Analyses

The CO concentration in the flue gas from the sintering test pot was analyzed and recorded by the gas ECOM J2KNPro analyzer (RBR Inc, Iserlohn, Germany), and the data was recorded per 2 s. The gas analyzer has dual-range (0–10,000 ppm and 0–63,000 ppm) CO sensors, which used the electrochemical method (EC) and the non-dispersive infrared method (NDIR), respectively. The CO concentration measurement error is within ±0.01%.
For a better understanding of the total CO emission, a new parameter, S is introduced to describe the total CO emission which is expressed by the following formula:
S = t 0 t C t d t
where S represents the area between the concentration curve of CO and the baseline from t0 to t, mg·Nm−3·s, and Ct denotes the CO concentration in the sinter flue gas at time t, in mg·Nm−3.

3. Results and Discussion

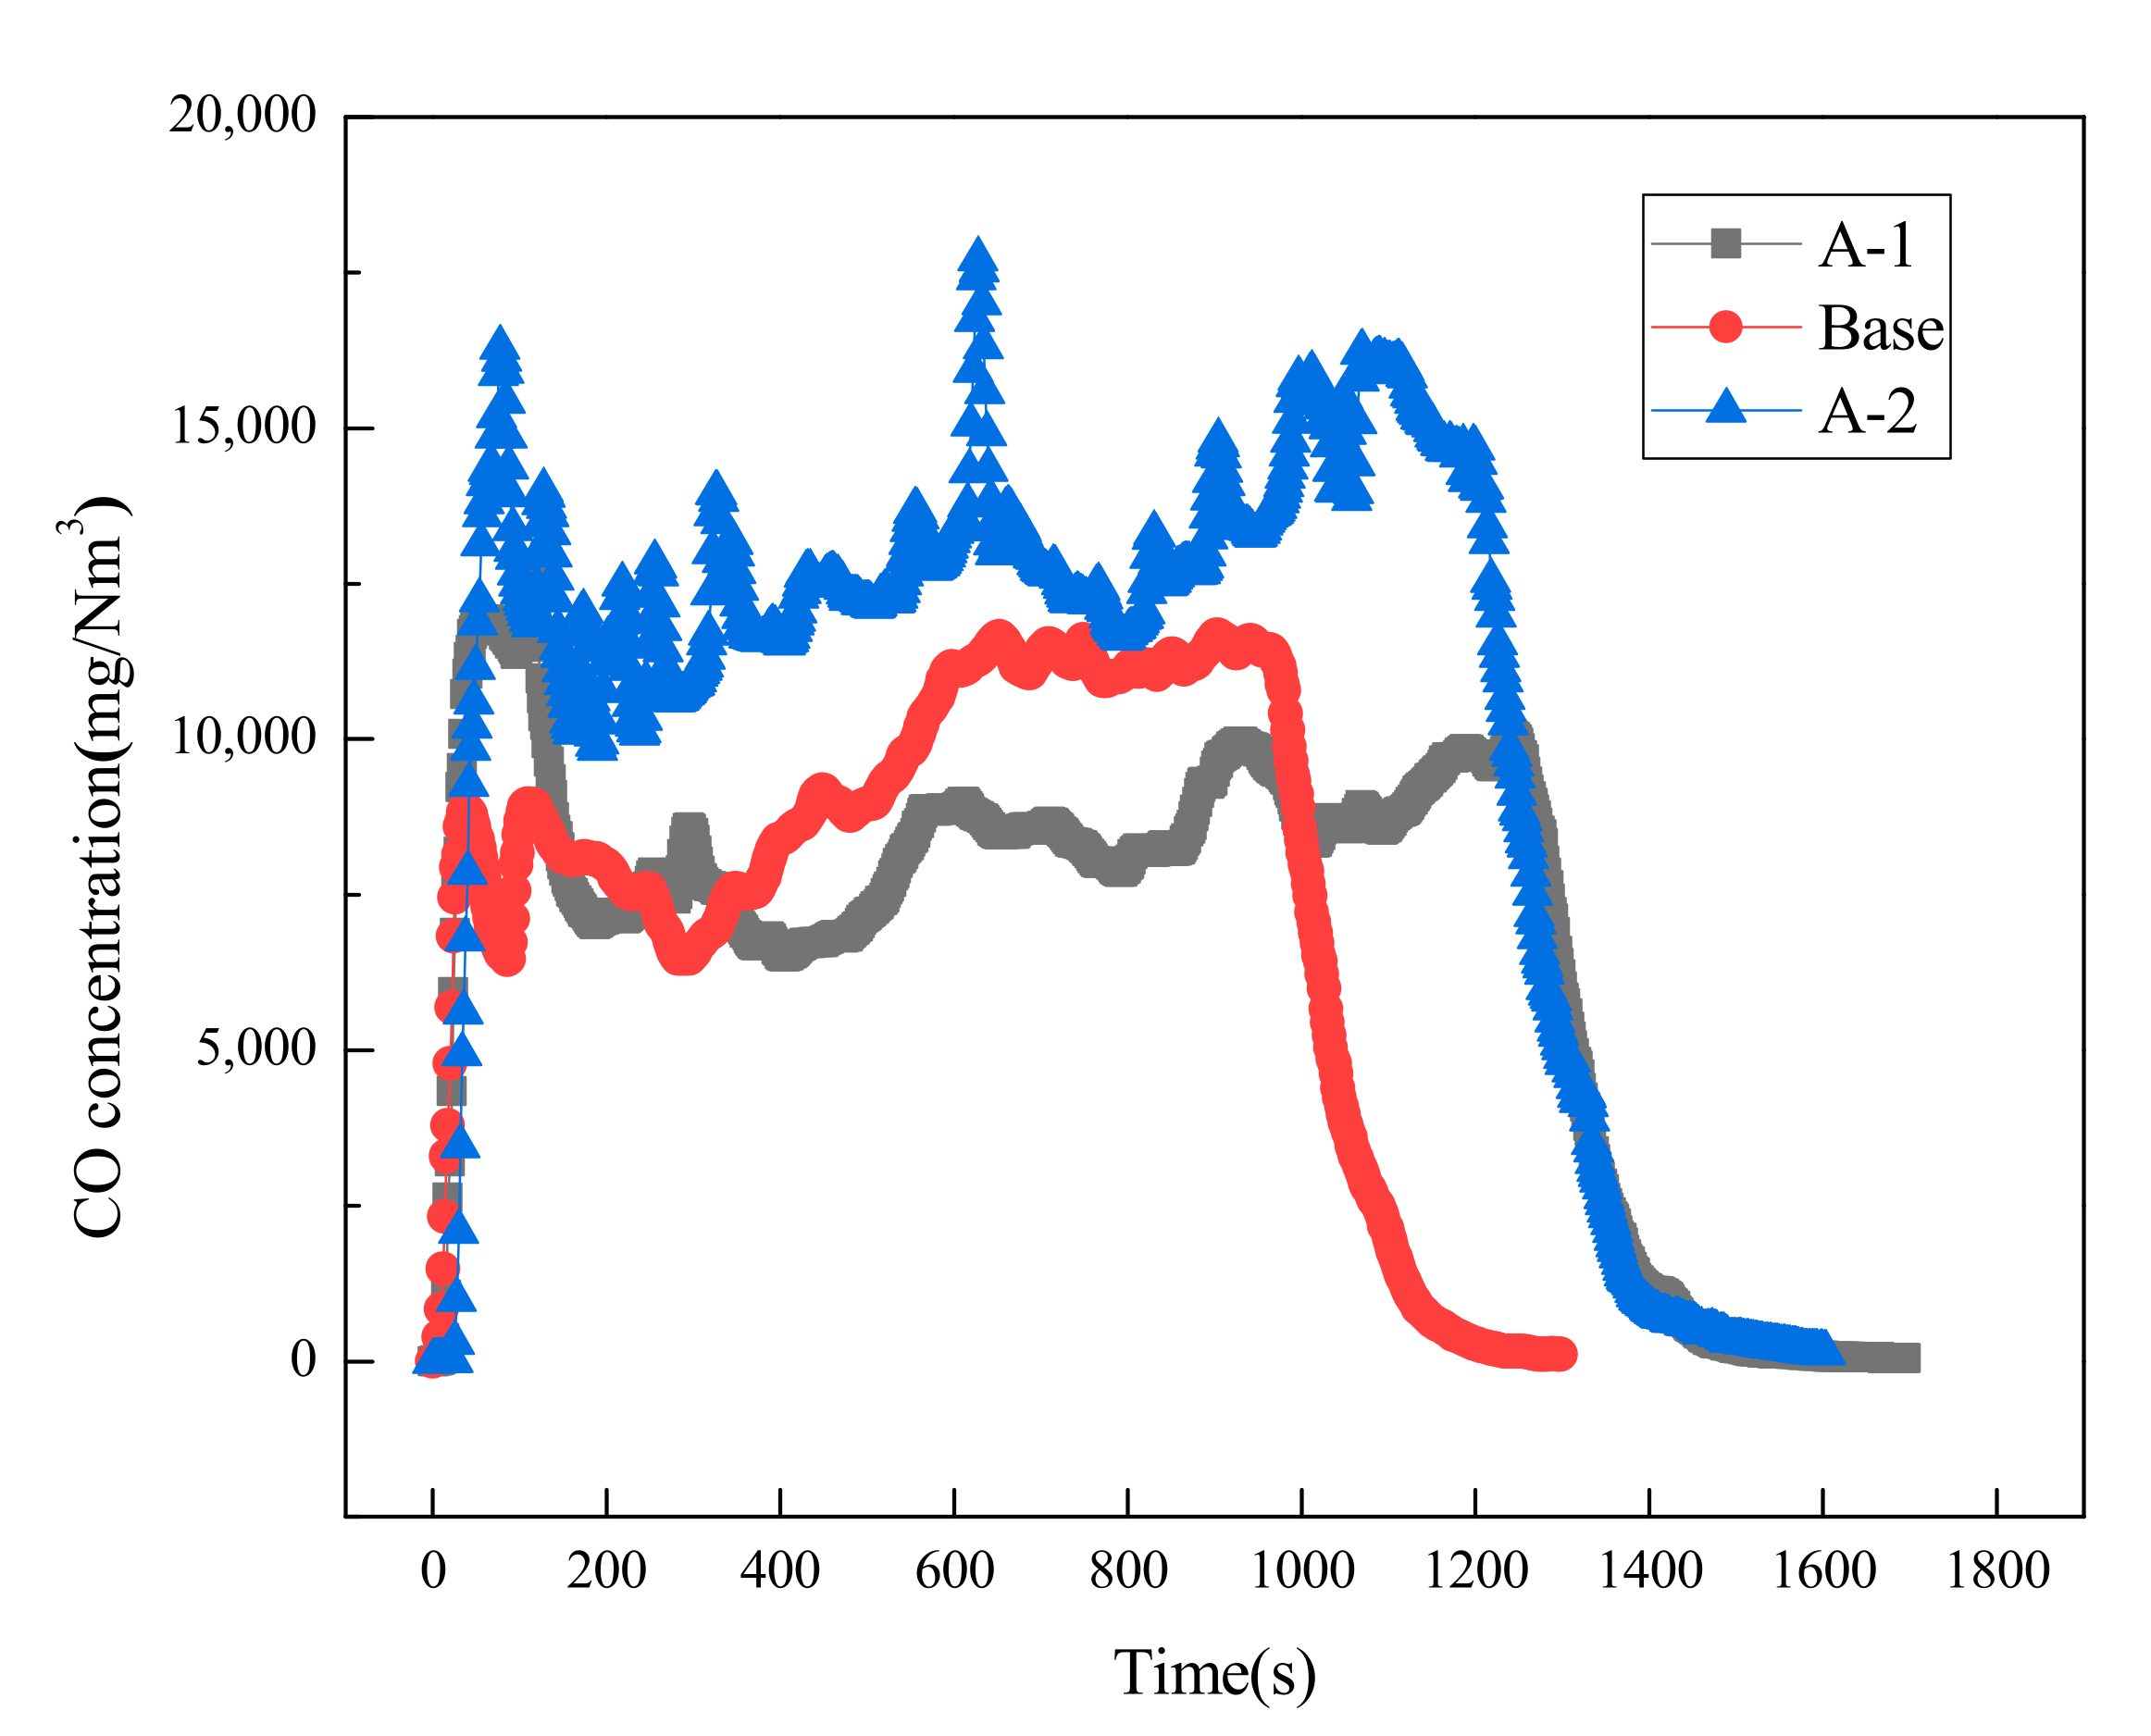
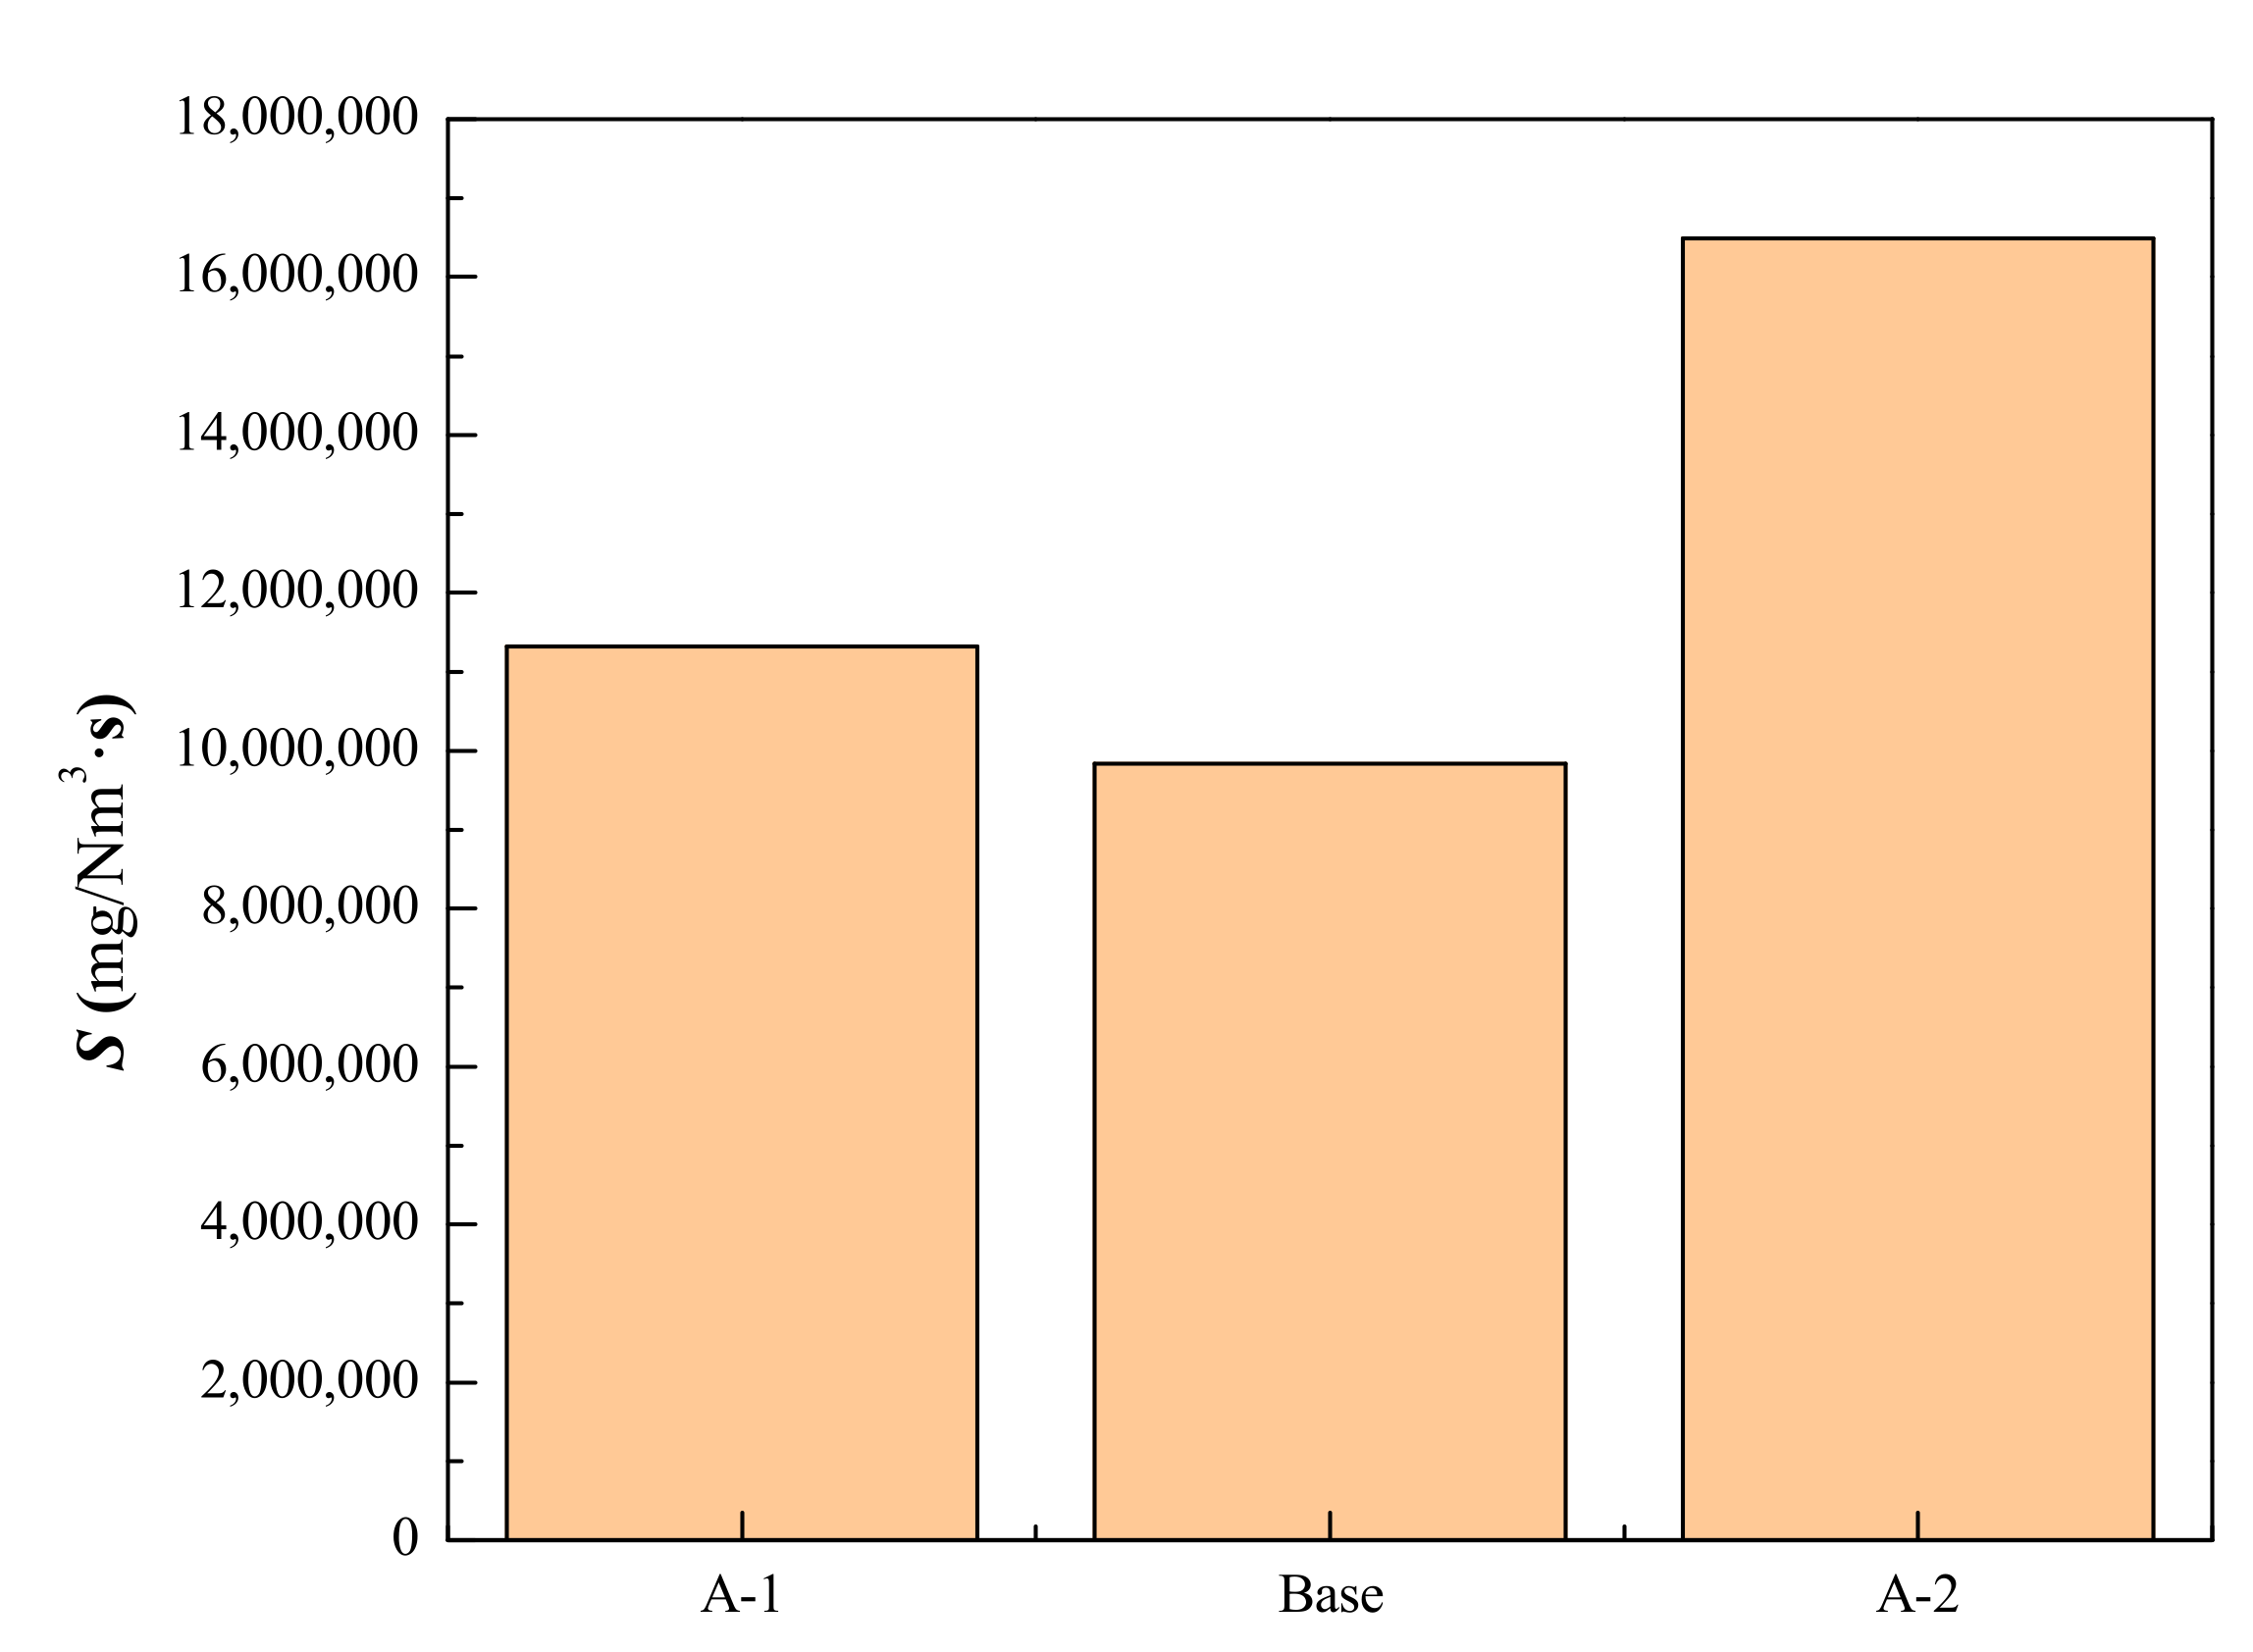
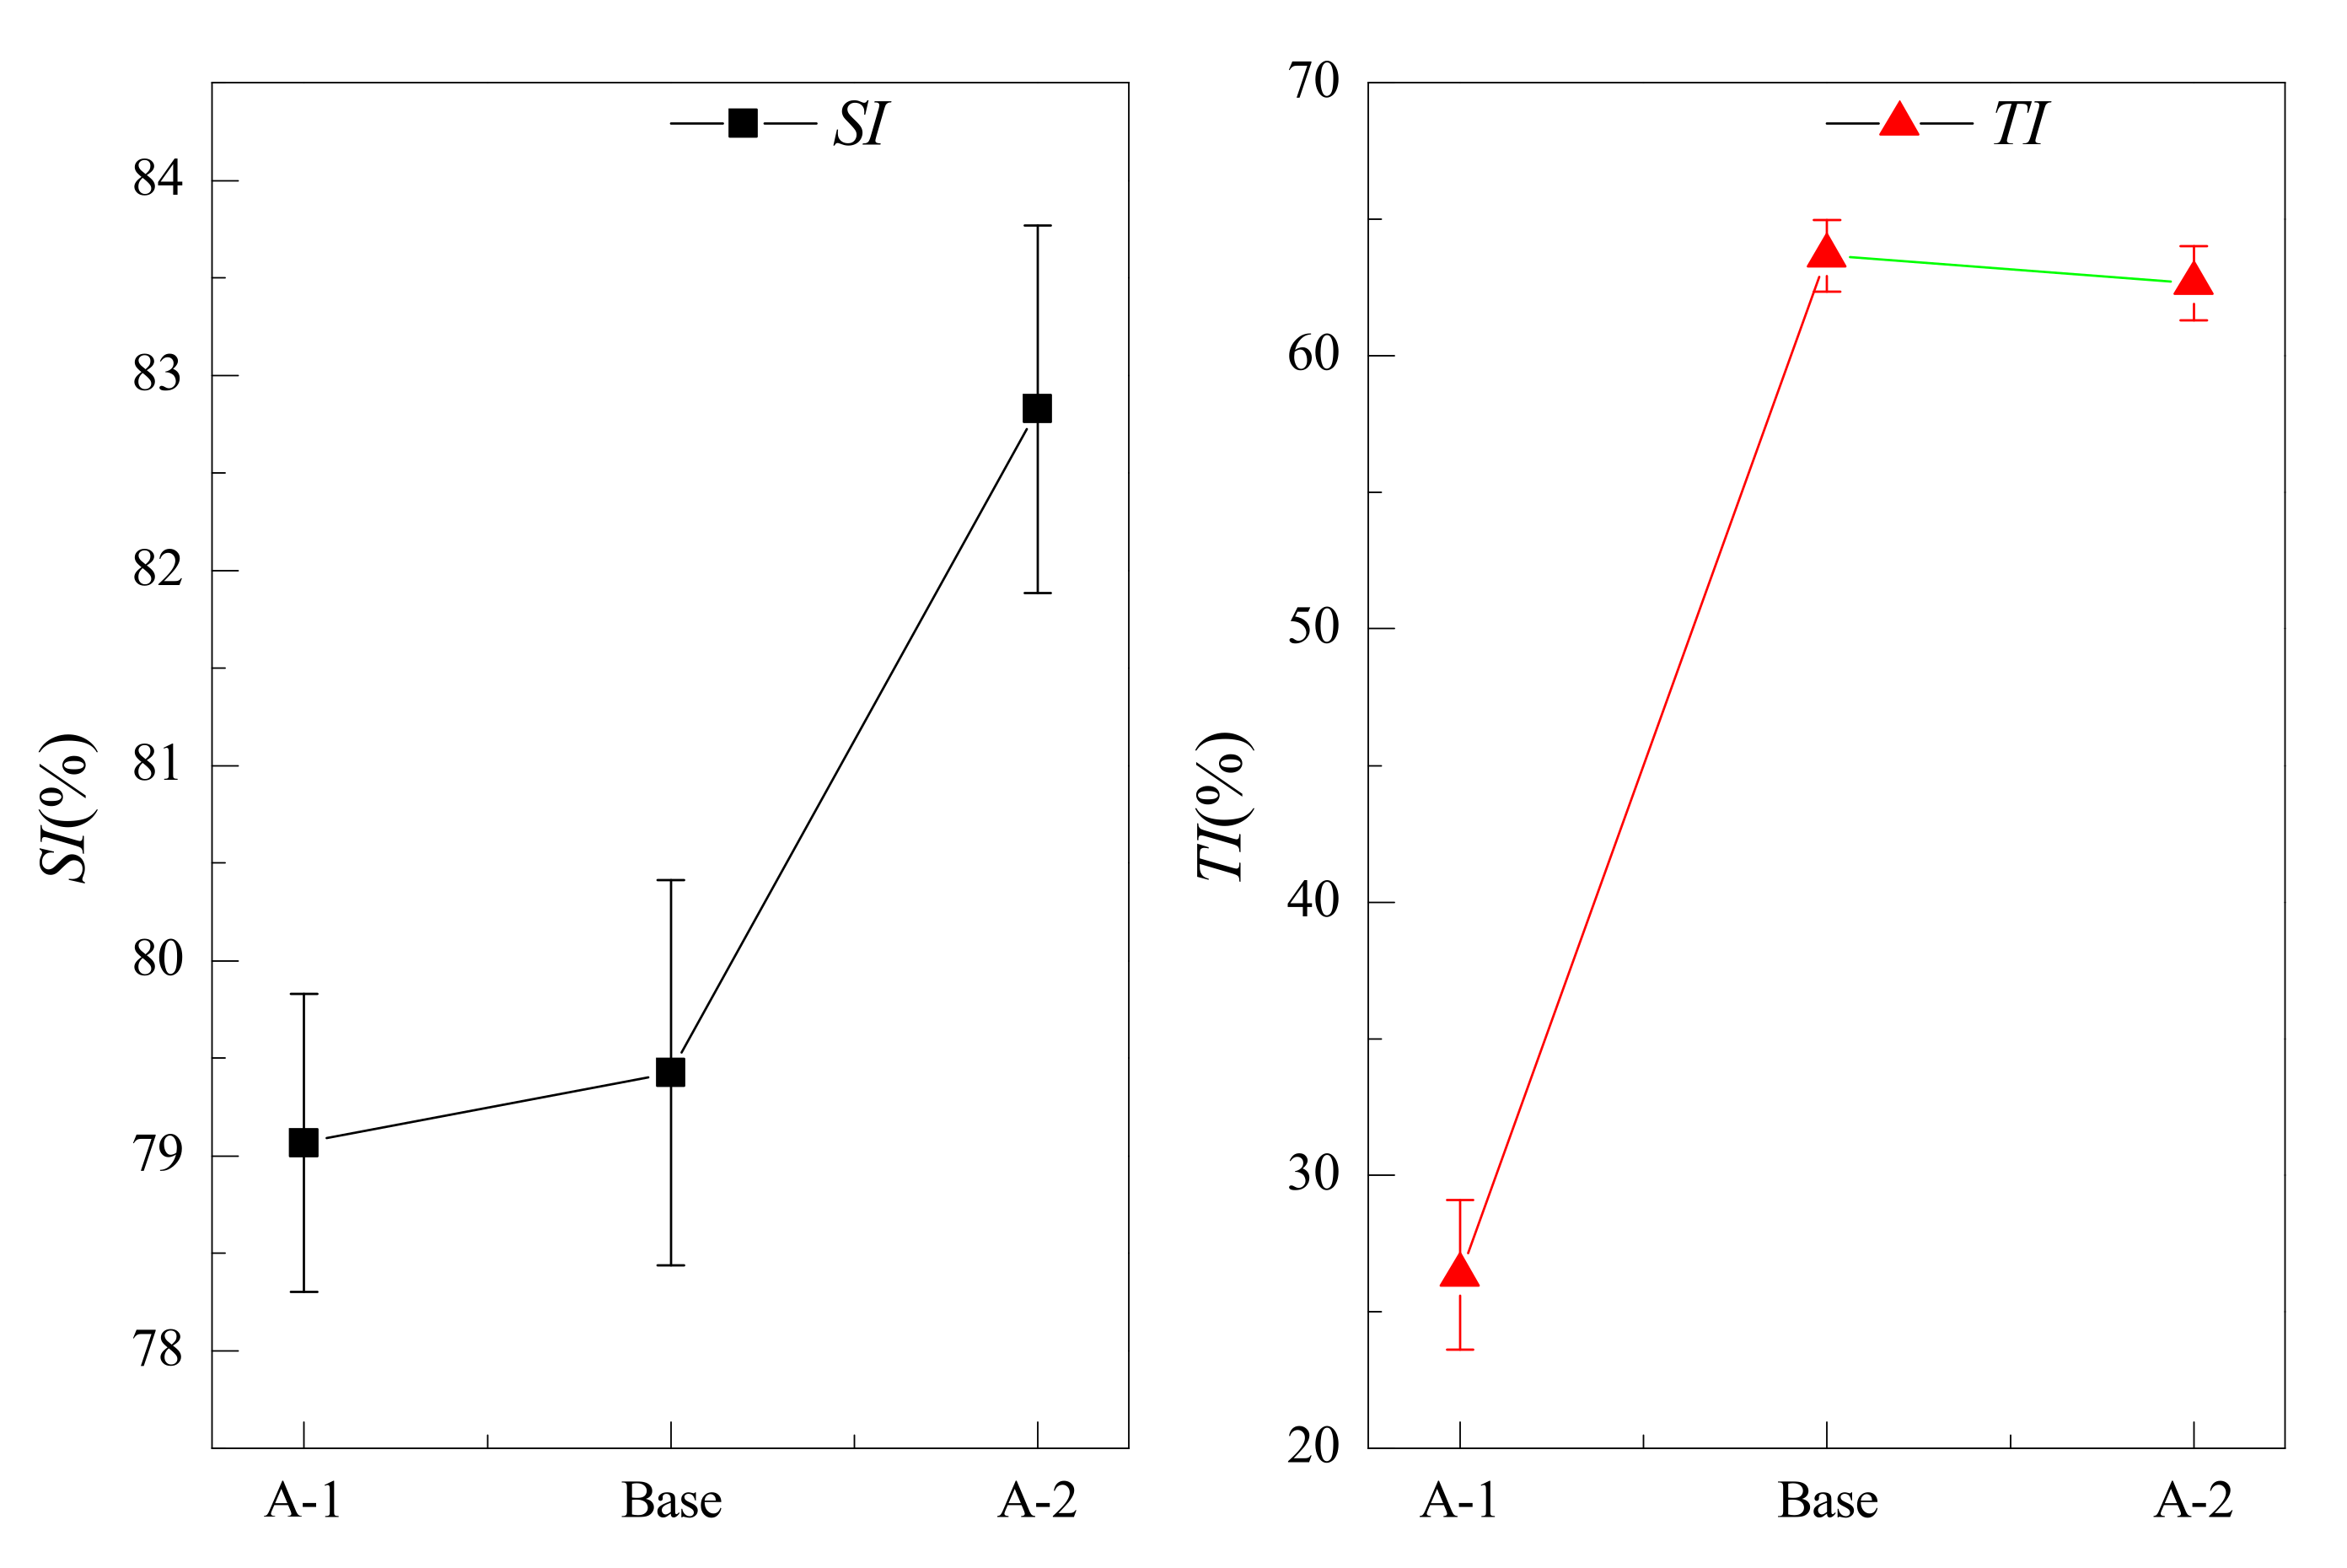
3.1. Influence of Carbon Addition on CO Emission

Figure 2 shows the relationship between CO concentration in flue gas and carbon addition amount during the sintering pot experiments. The carbon amount for schemes A-1, Base, and A-2 is 2.6%, 2.8%, and 3.0%, respectively. CO concentration increases sharply in the sintering pot ignition process and then drops quickly to a low value in the ignition end. CO concentration reaches a maximum value in 3–5 min approaching the sintering end. The sharp rise in CO concentration in the sintering ignition stage is due to a large amount of CO generation caused by gas ignition. Meanwhile, plenty of oxygen was consumed during the ignition process, reducing CO combustion and increasing CO concentration increase.
As shown in Figure 2, the A-2 scheme has the largest CO concentration, followed by the Base and A-1 schemes, indicating a relationship between CO concentration and carbon allocation under constant sintering pot process parameters. The larger the carbon allocation amount added, the greater the CO concentration. The results could be interpreted as the CO not entirely burned per unit time increased as carbon allocation increased, resulting in the unburned CO being pumped into the low-temperature mixture layer at constant sintering air per unit time.
The Base scheme had the shortest sintering time, followed by the A-2 and A-1 schemes. This indicates that the mineralization rate of sintered ore depends on the carbon allocation; when the carbon allocation is large, the carbon per unit thickness layer cannot be combusted completely in the fixed amount of air per unit time. Furthermore, the sintering time was prolonged because the sintering process was incomplete for one unit thickness mixture layer. Moreover, the heat from carbon combustion in-unit layer volume was insufficient. It resulted in a longer sintering time, directly affecting the sintering rate, when the carbon distribution amount was smaller.
Figure 3 shows the total CO emissions of three carbon allocation cases. The total CO emission in the sintering process was related to CO emission concentration and dependent on sintering time. The completion time of sintering pot experiments varied with carbon allocation amount; therefore, the CO emission descending order was A-2, A-1, and Base as shown in Figure 3; namely, the CO emission concentration change is not equivalent to the change of total emissions. Therefore, a greater carbon allocation did not necessarily guarantee greater CO emissions. CO emission for A-2 was 1.68 times that of the Base case. Therefore, the A-2 could be excluded from consideration.
Figure 4 shows the sinter’s shatter and the tumbler indexed under different carbon additions. A-2 sample had the highest average yield with 82.70%, followed by the Base, and A-1 had the lowest mean yield with 79.10%. These results could explain that the higher the carbon content was, the higher the sintering temperature was in the sintering process, resulting in a more liquid phase produced and a higher yield. The largest average tumbler index (64.60%) could be obtained for Base, A-2 (62.67%) was close to Base, and A-1 had the lowest mean tumbler index (26.80%). The results could illustrate that a less liquid phase could be formed due to lower carbon content for A-1, lowering the liquid phase density per unit volume. Sinter with lower tumbler strength could be achieved under low carbon content. Through comprehensive assessment, the yield of finished products for the three cases was 78.16% to 84.79%. However, for the A-1 case, the tumbling index requirement of the conventional sinter could not be met, so its carbon allocation is not suitable for production.
Above all, Base was suitable for carbon allocation conditions based on the comprehensive consideration of CO emission concentration, total emissions, and sinter quality.

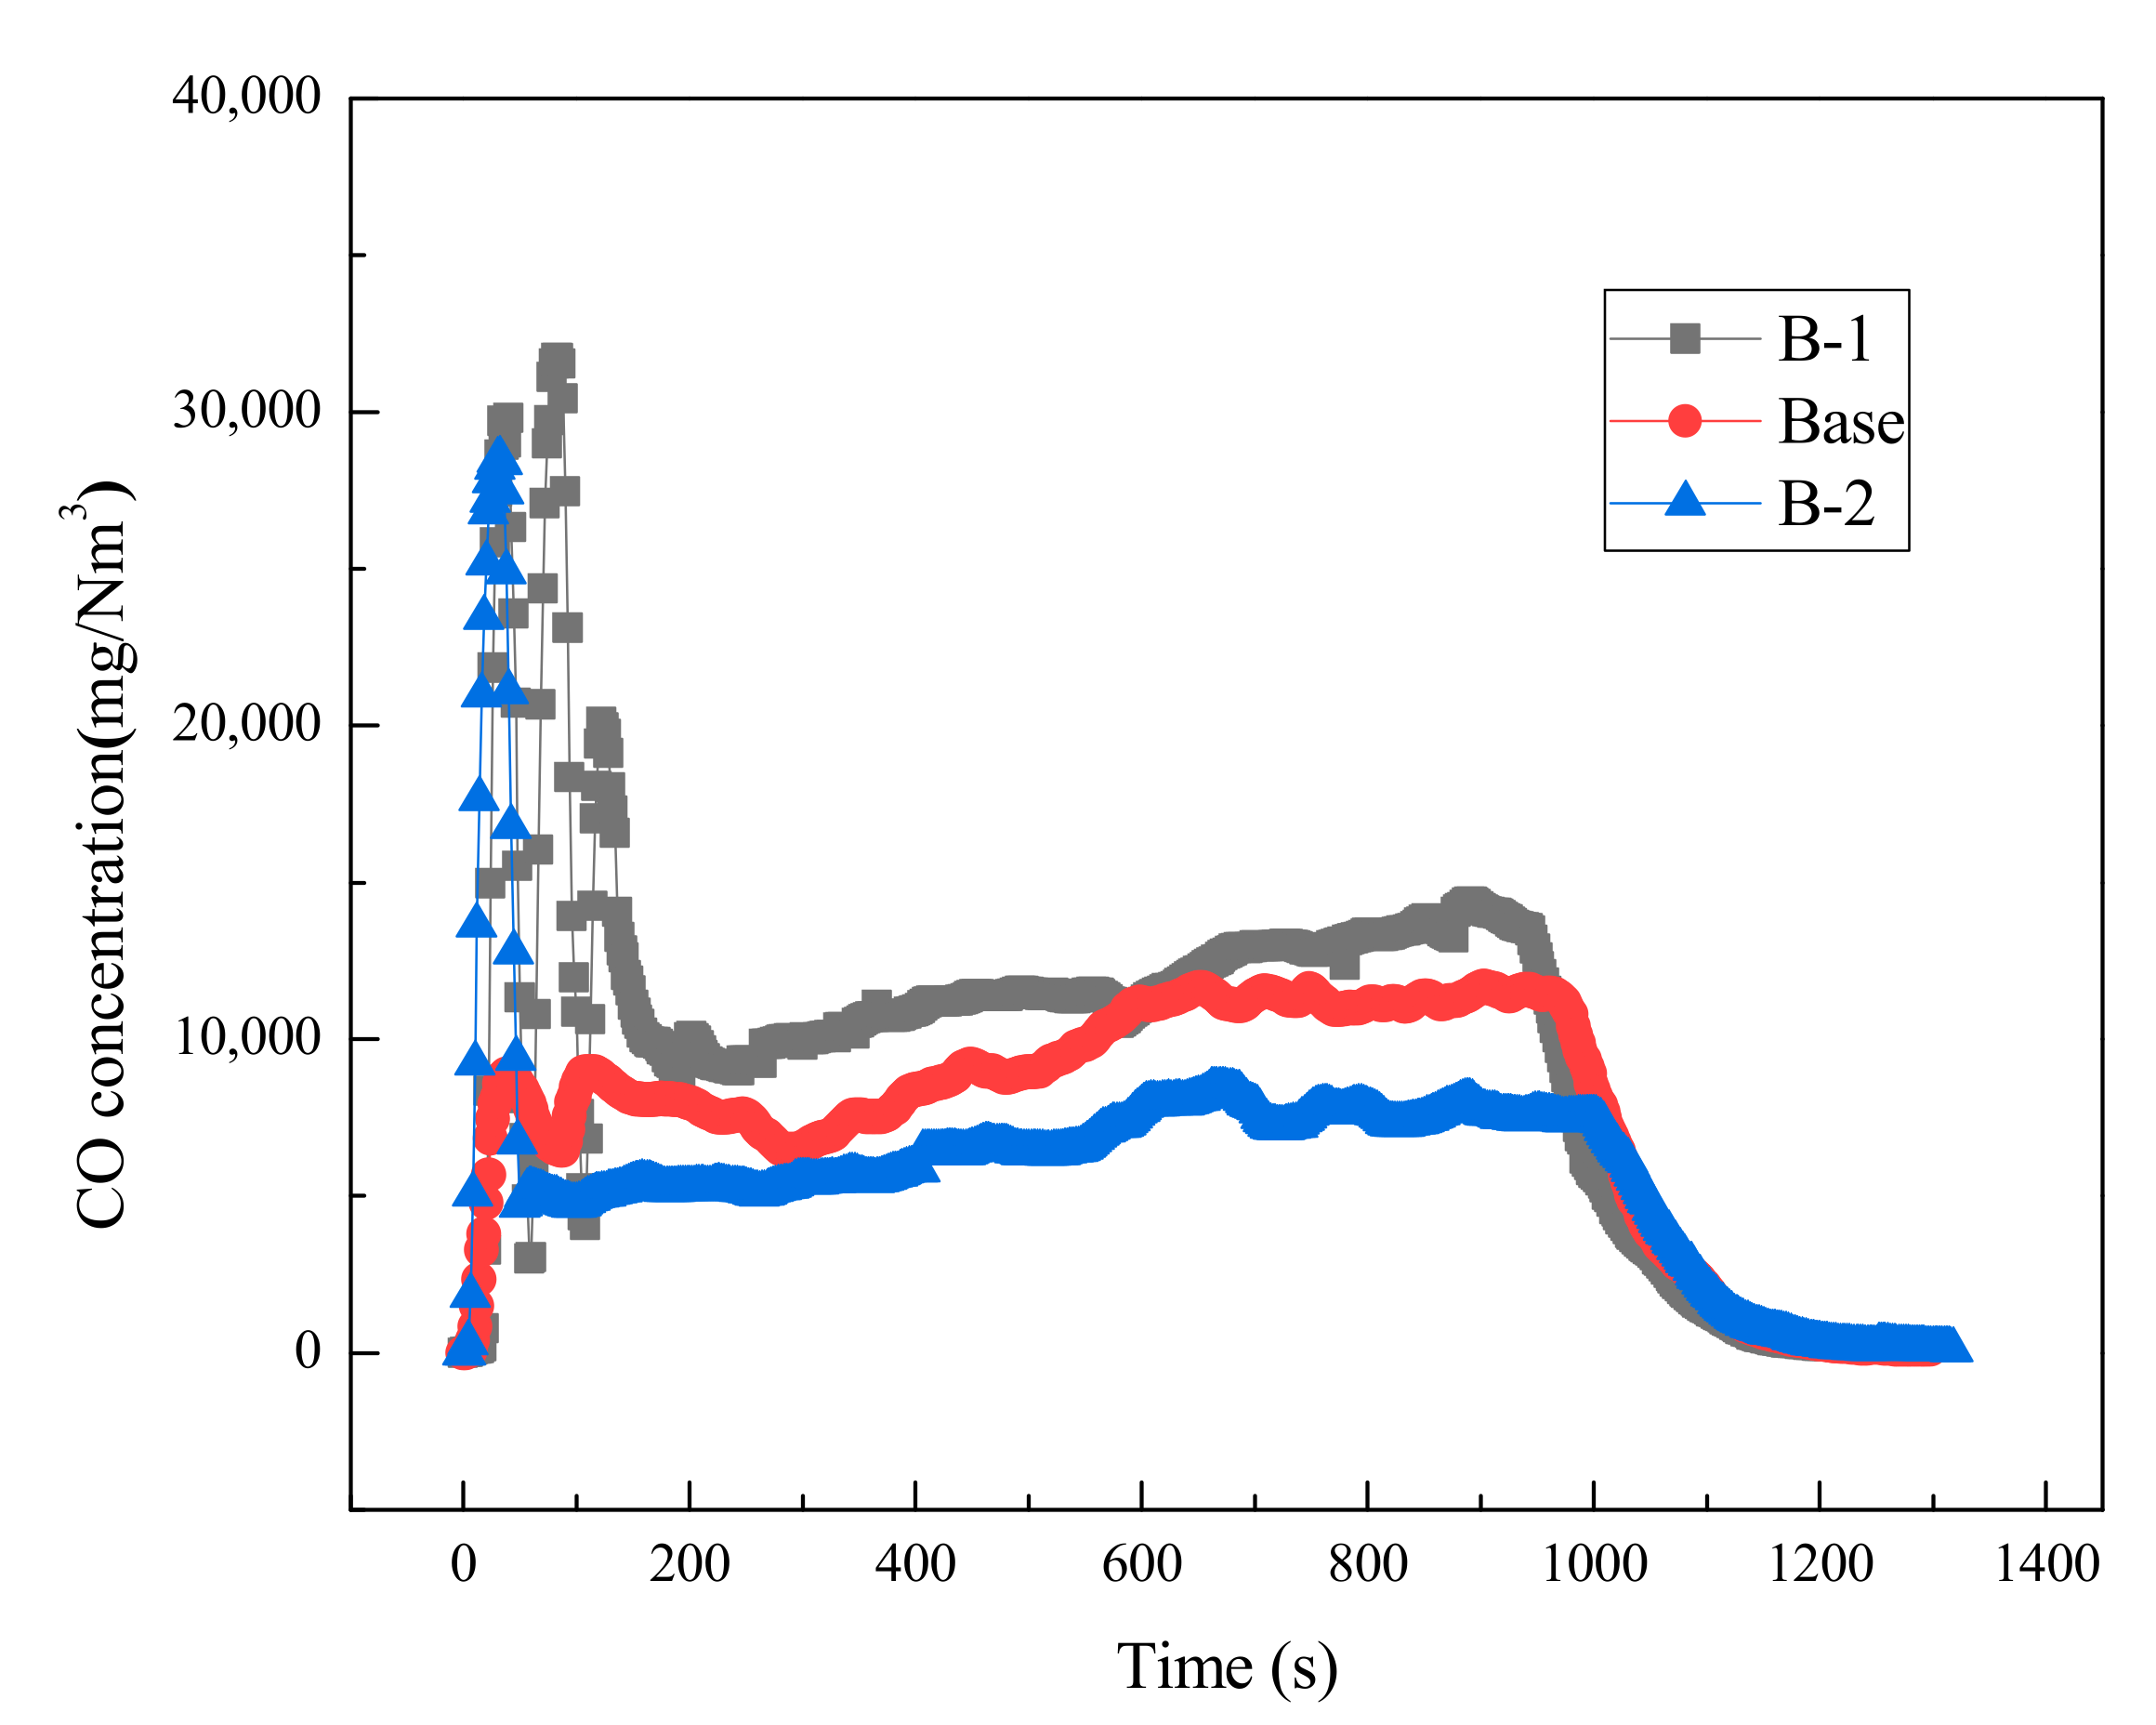
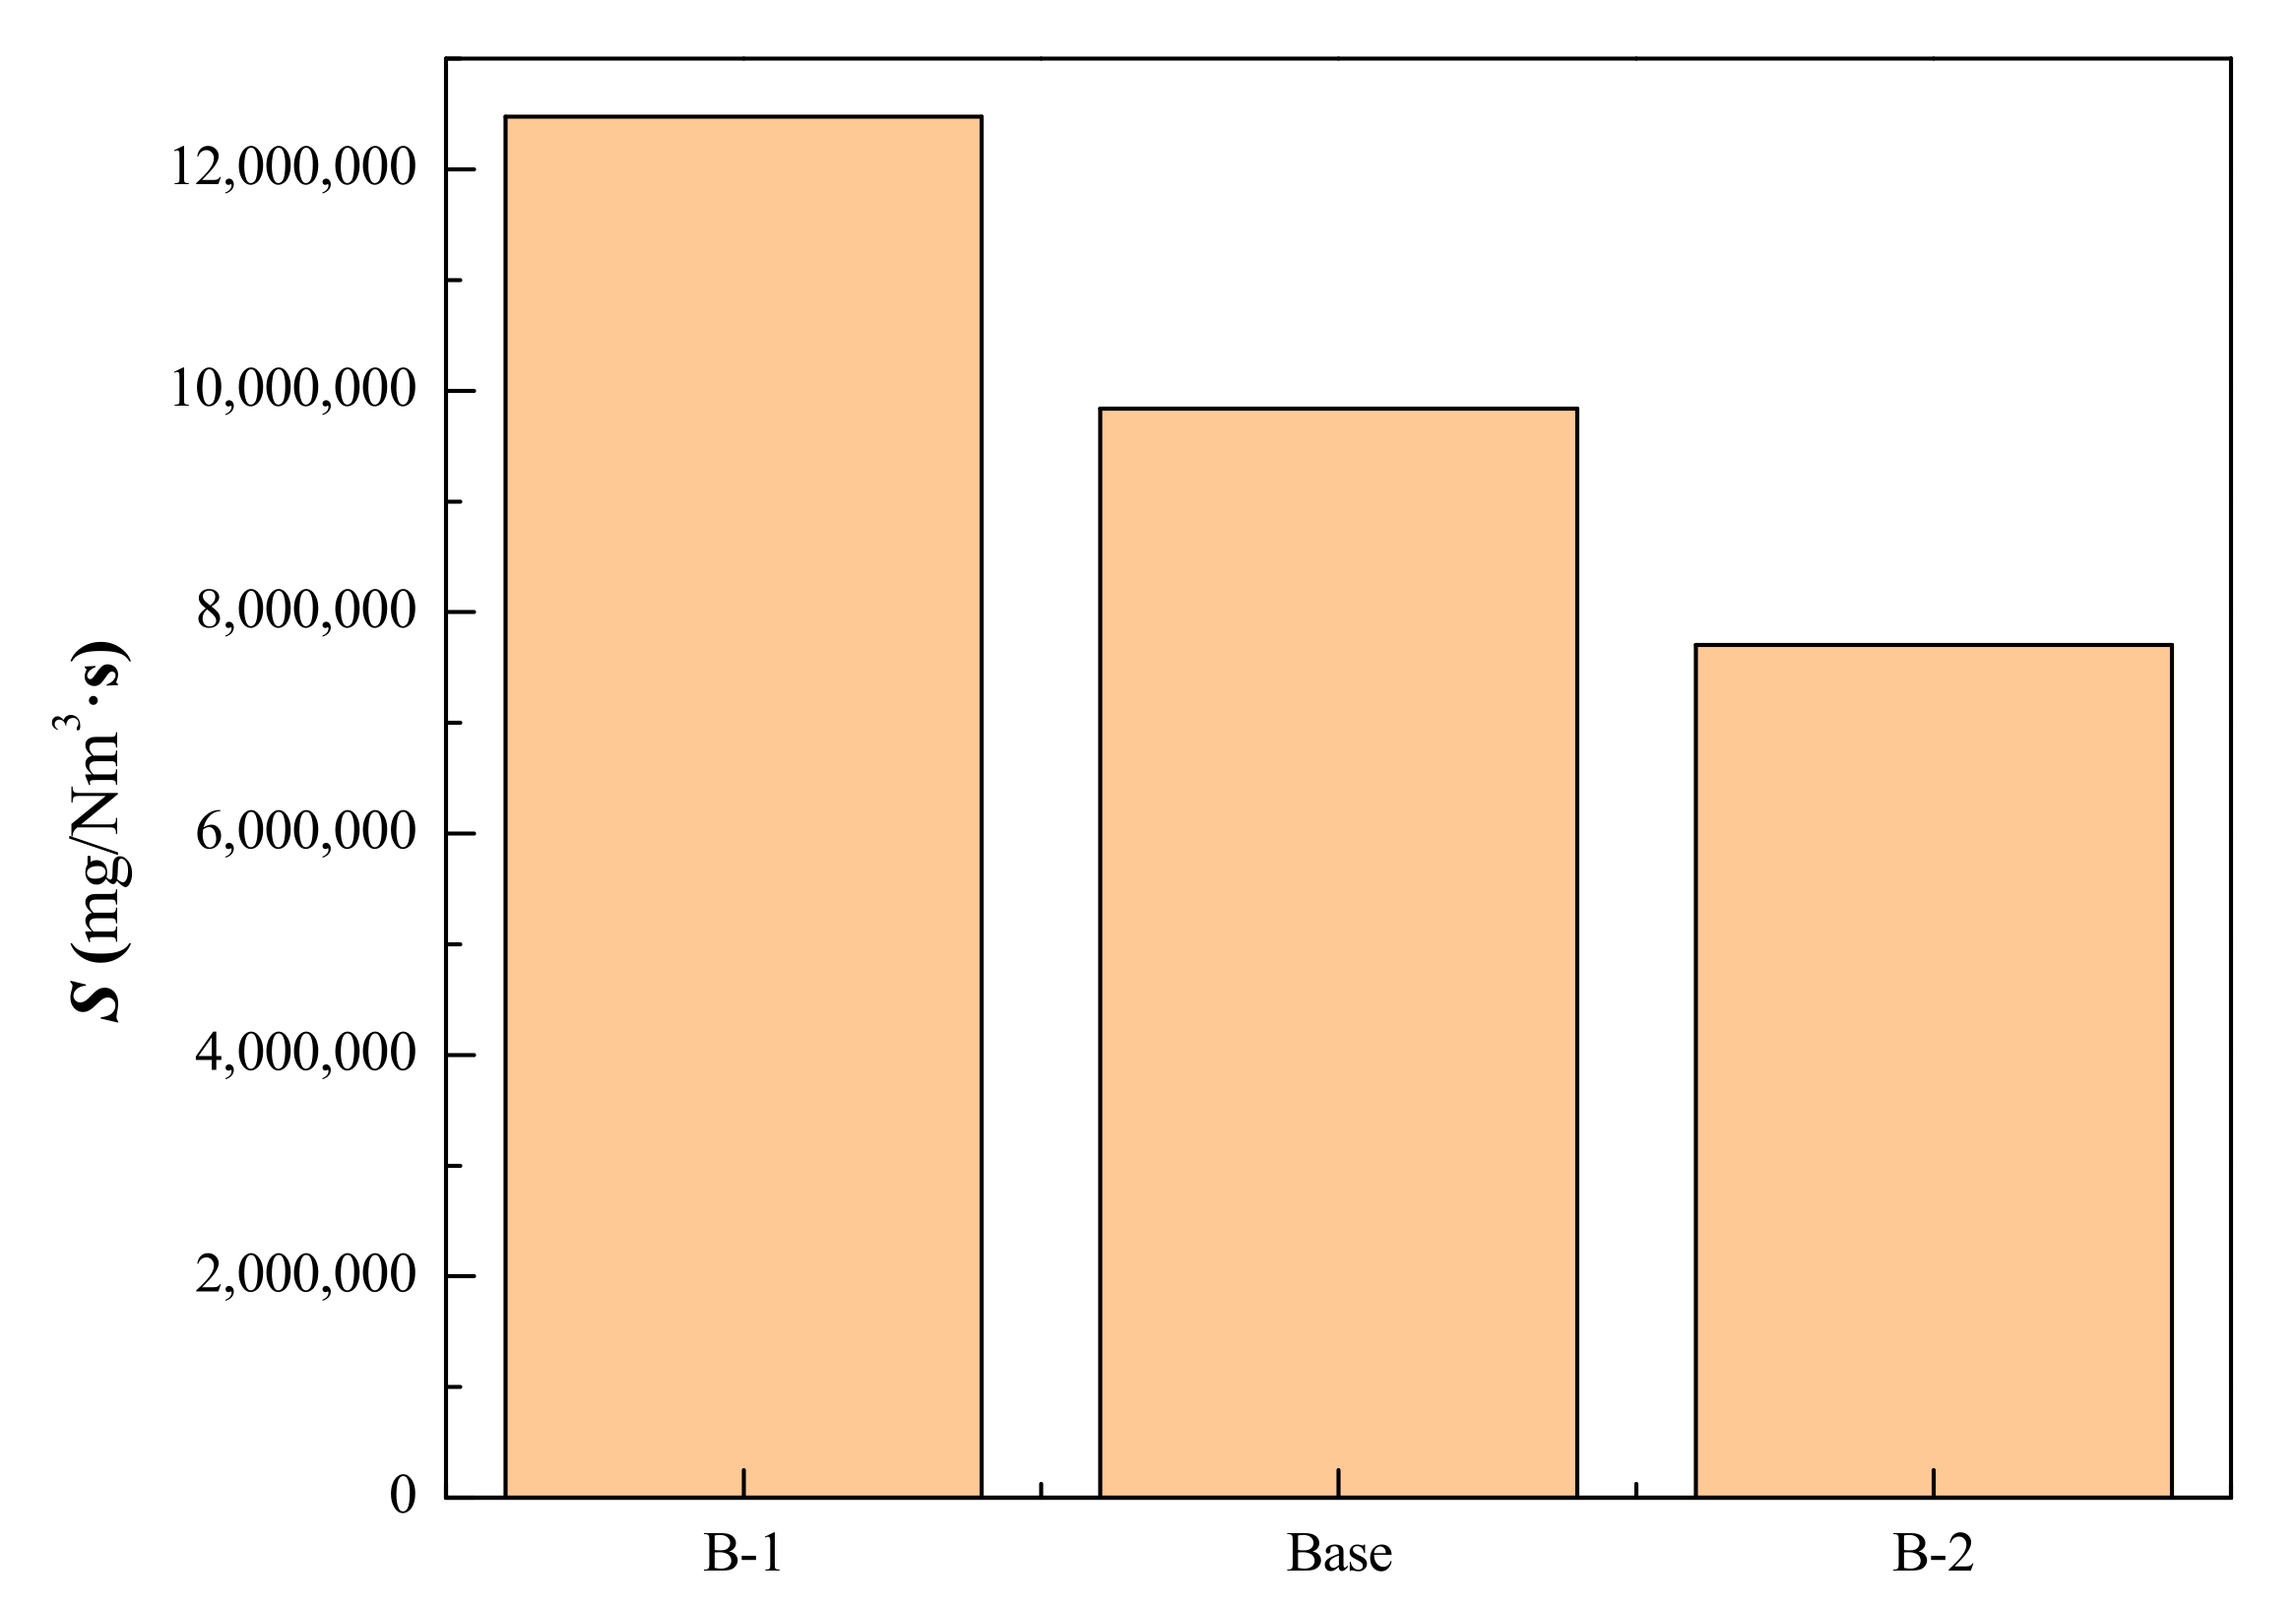
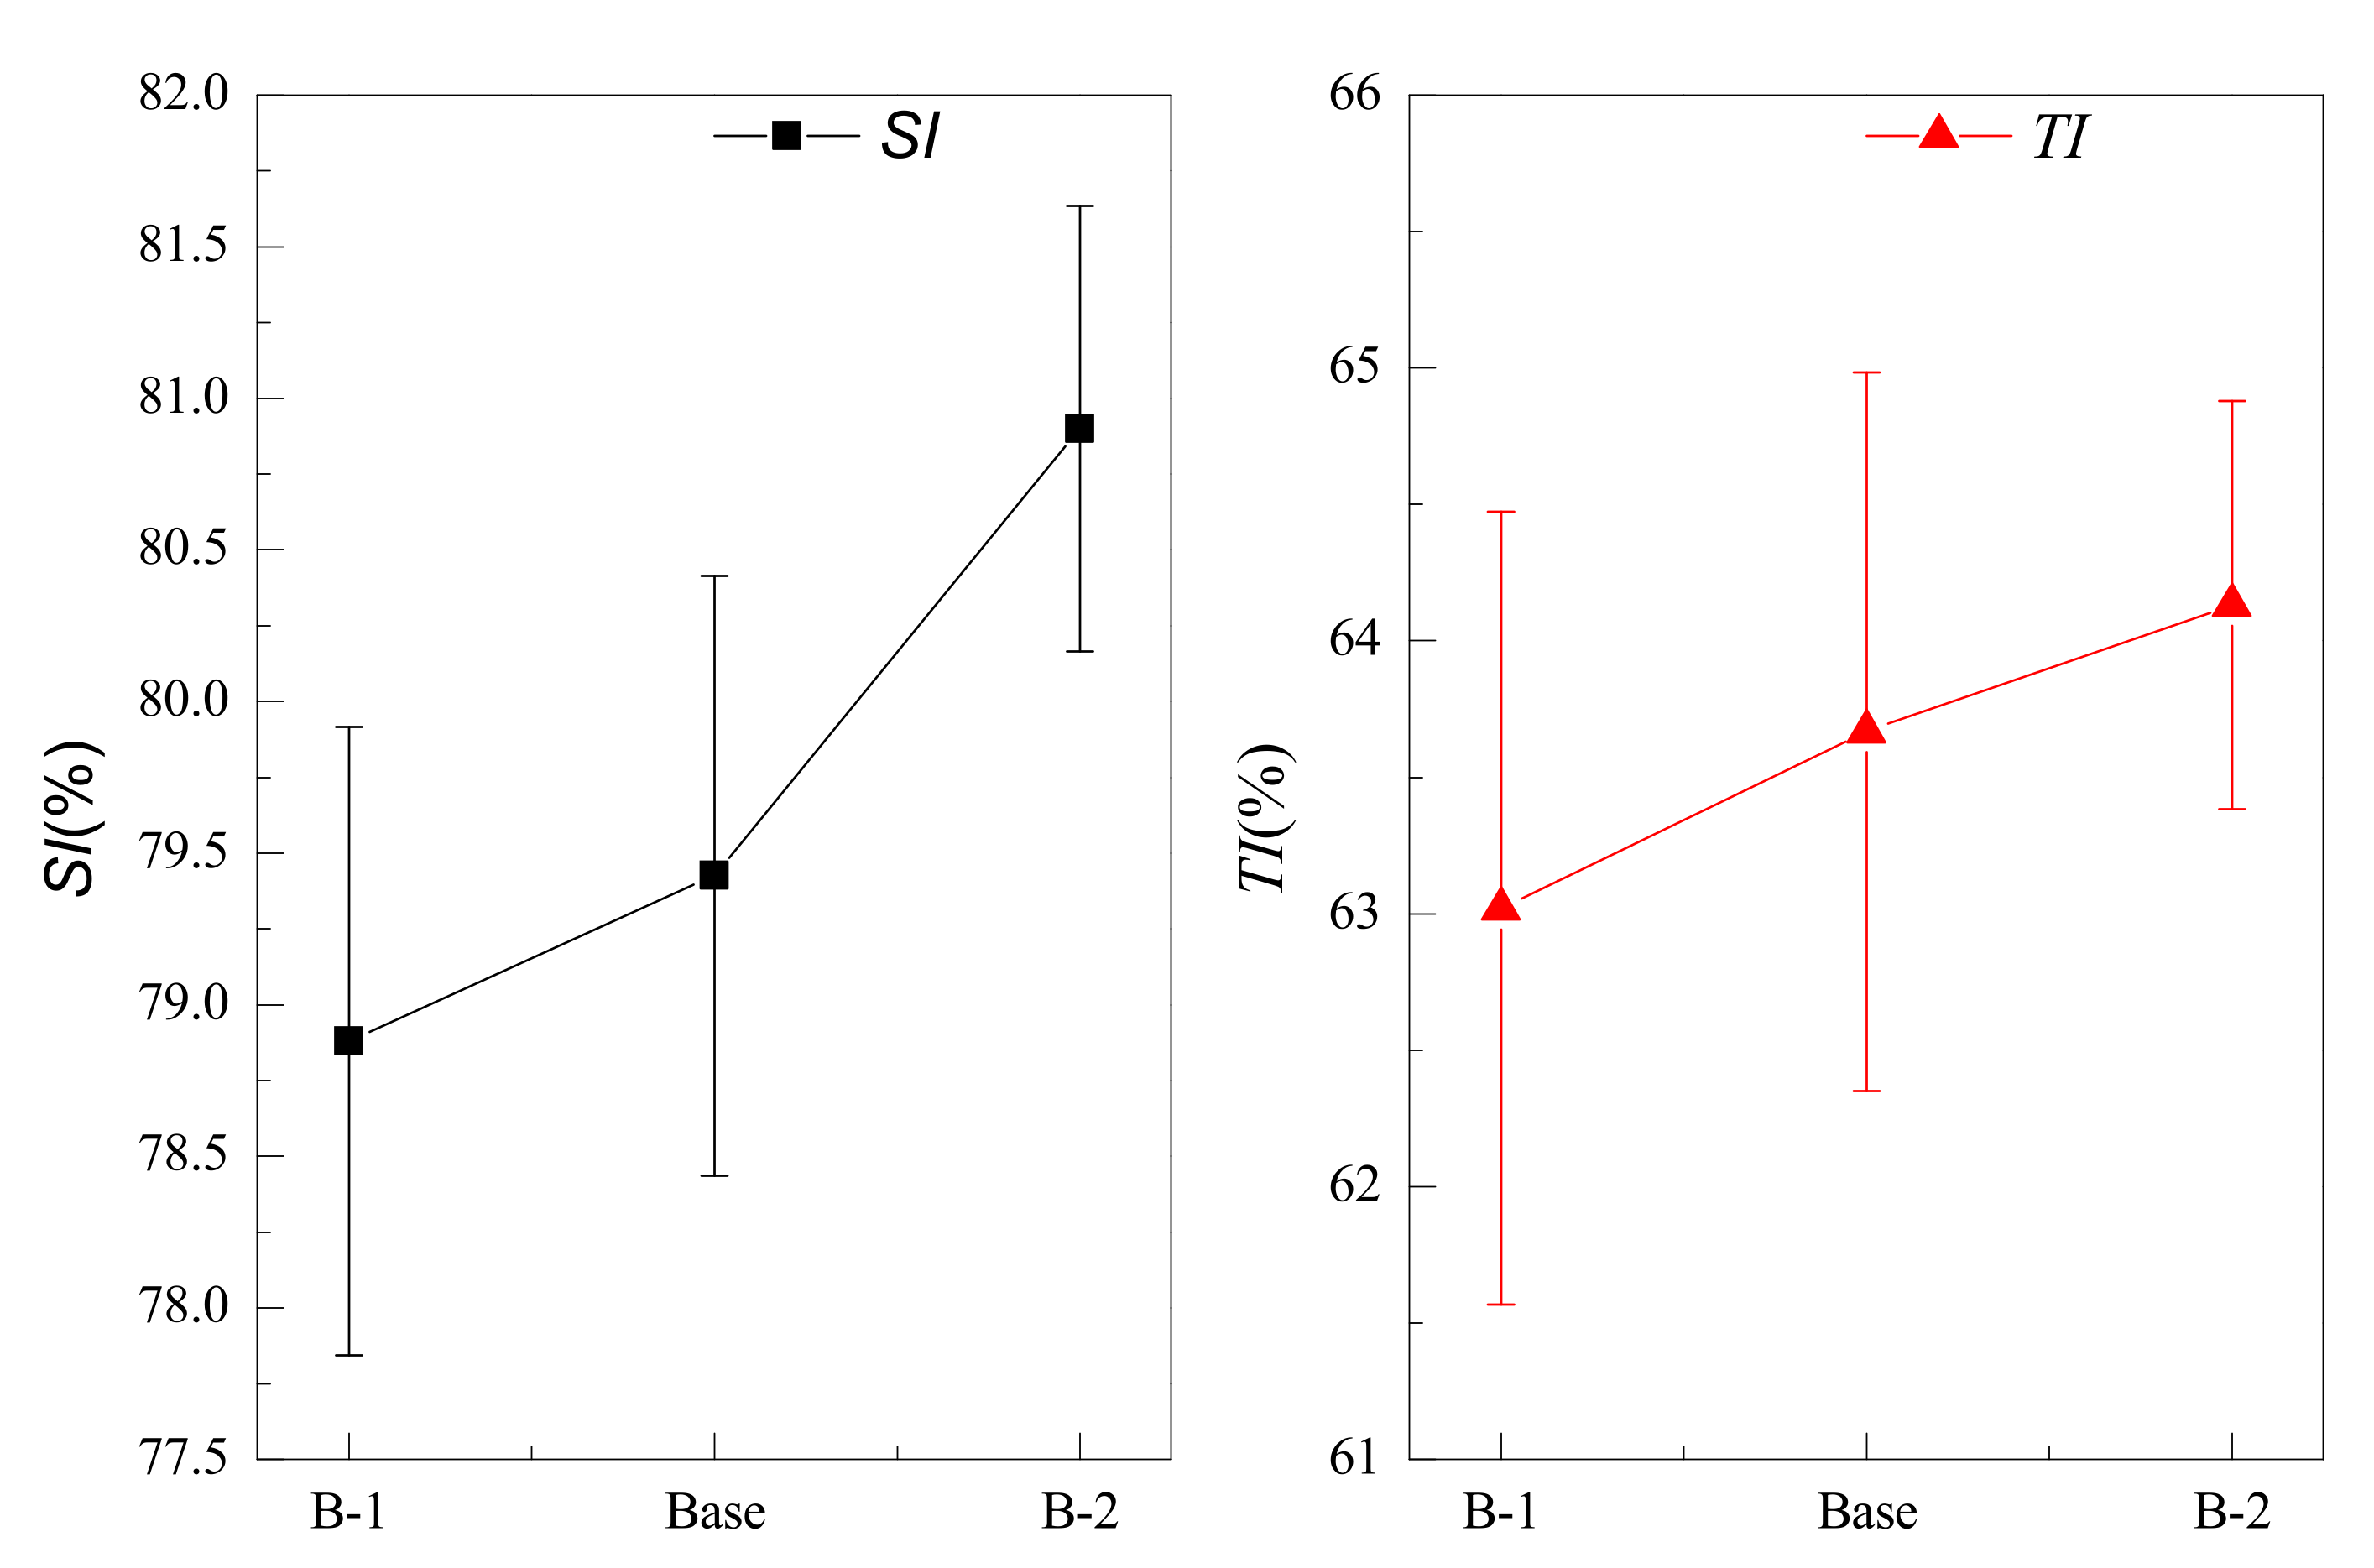
3.2. Influence of CTC Ratio on CO Emissions

Figure 5 shows the CO emissions concentration under the different CTC ratios. CTC ratios for schemes B-1, Base, and B-2 are 1.8, 2.0, and 2.2, respectively. The CO concentration of B-2 was the lowest, followed by Base and B-1. At the same time, the endpoint temperature of B-1 is completed first, followed by Base and B-2. The results suggest that the combustion reaction of coke powder was slower than coal powder. The less the carbon combustion amount, the larger the oxygen amount per unit mass given on the premised stable sintering exhaust airflow, helpful for carbon combustion completely. Therefore, the B-2 CO concentration was the lowest. However, the carbon amount of B-1 burned per unit time increased. The oxygen amount supplied for carbon combustion decreased due to the strong combustion reactivity of pulverized coal. The high reaction rate under the fixed amount of pumping air contributed to CO generation, therefore, the CO concentration of the Base during the sintering process was higher. Correspondingly, the obtained CO concentration and endpoint time for the Base were between B-1 and B-2, indicating that the CTC was between B-1 and B-2.
Figure 6 denotes the relationship between the total CO emission and CTC ratio. The CO emissions in descending order were B-1, Base, and B-2. Specifically, the B-1 CO emission was 1.27 times that of Base and 1.62 times that of B-2. Therefore, the larger the CTC ratio adopted, the lower the CO emission exhausted after comprehensively investigating CO emission concentration and sintering time. The higher the coke powder proportion, the better the carbon combustion reaction kinetics, and the lower the total CO emission although the sintering time increased.
Figure 7 shows the shatter index and the tumbler index of the sinter at different CTC ratios. The average yields under the three schemes were more than 78.5%, the maximum value was 80.90%, and the maximum difference among those was 2%, and B-1 had the smallest yield, followed by Base and B-2. The mean tumbler index also increased with the CTC ratio, the sinter with Base-2 had a minimum of 63.02%, and a maximum of 64.13% could be achieved for B-2. The results could be explained a lower the CTC ratio leading to a larger CO emission in the sintering process due to the increase of coal blending in raw material. Namely, the larger chemical energy was taken away by the flue gas, which was not fully utilized in the sintering process, leading to lower mineralization and sinter strength.

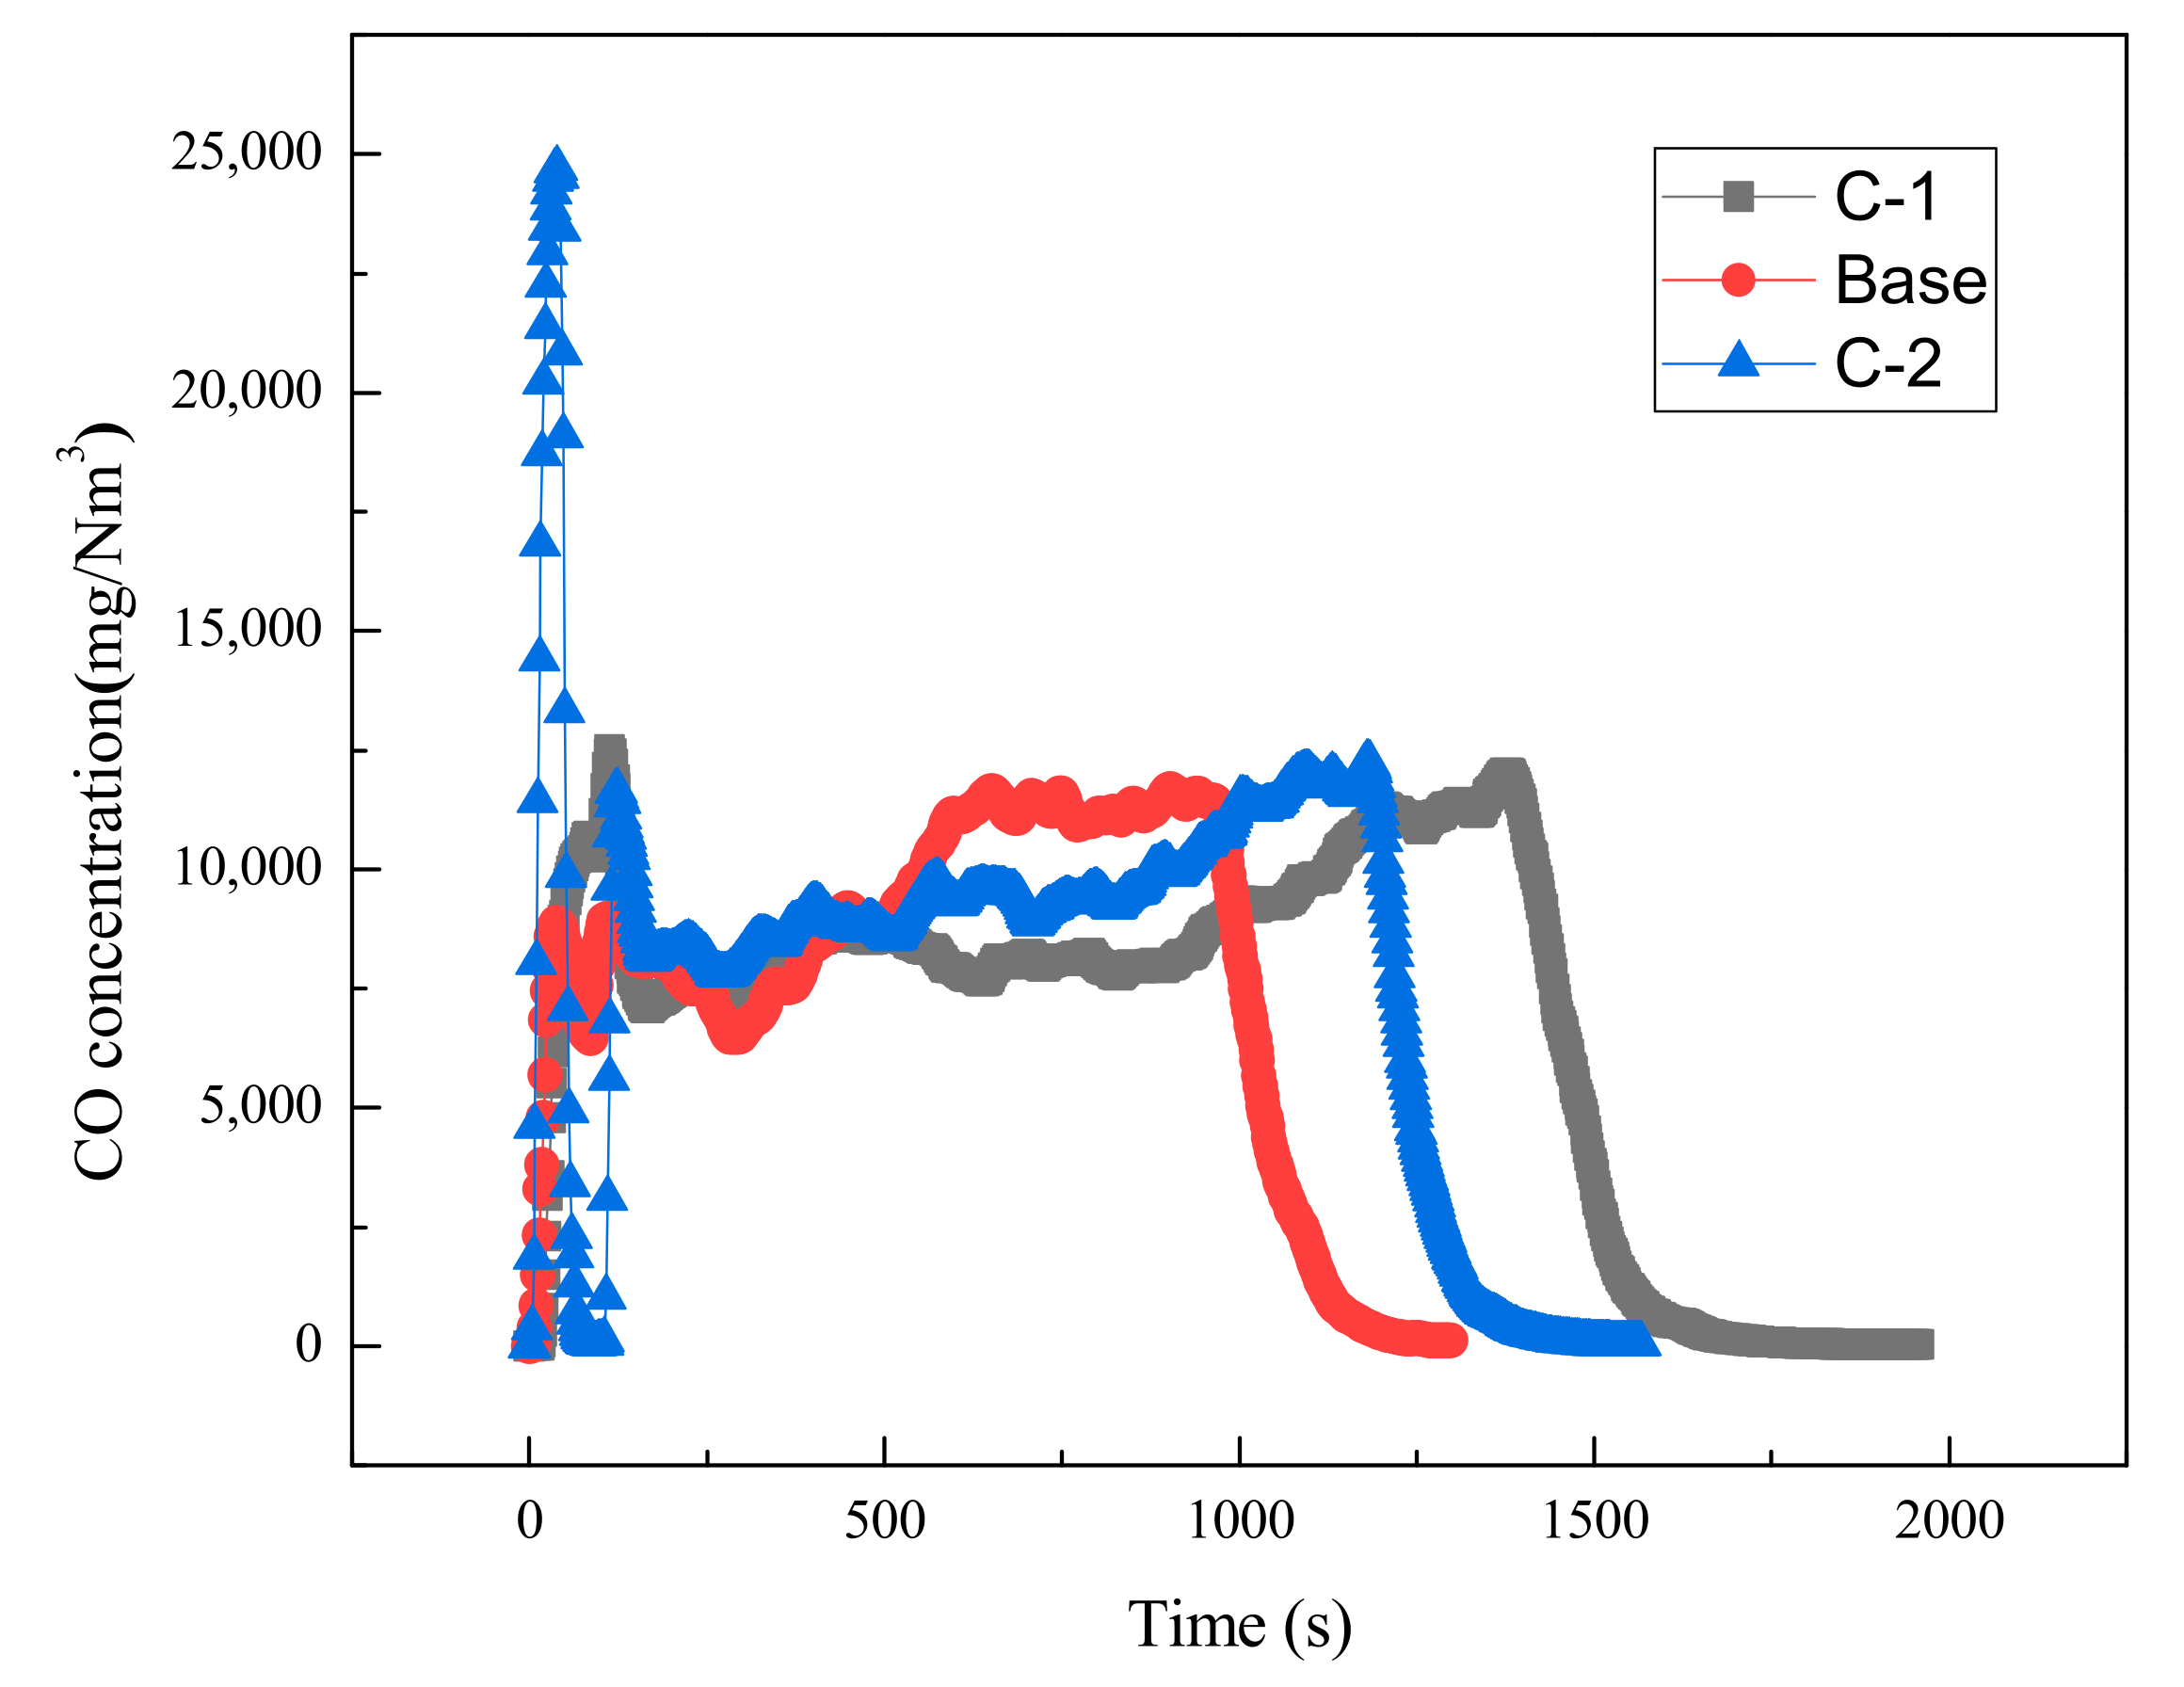
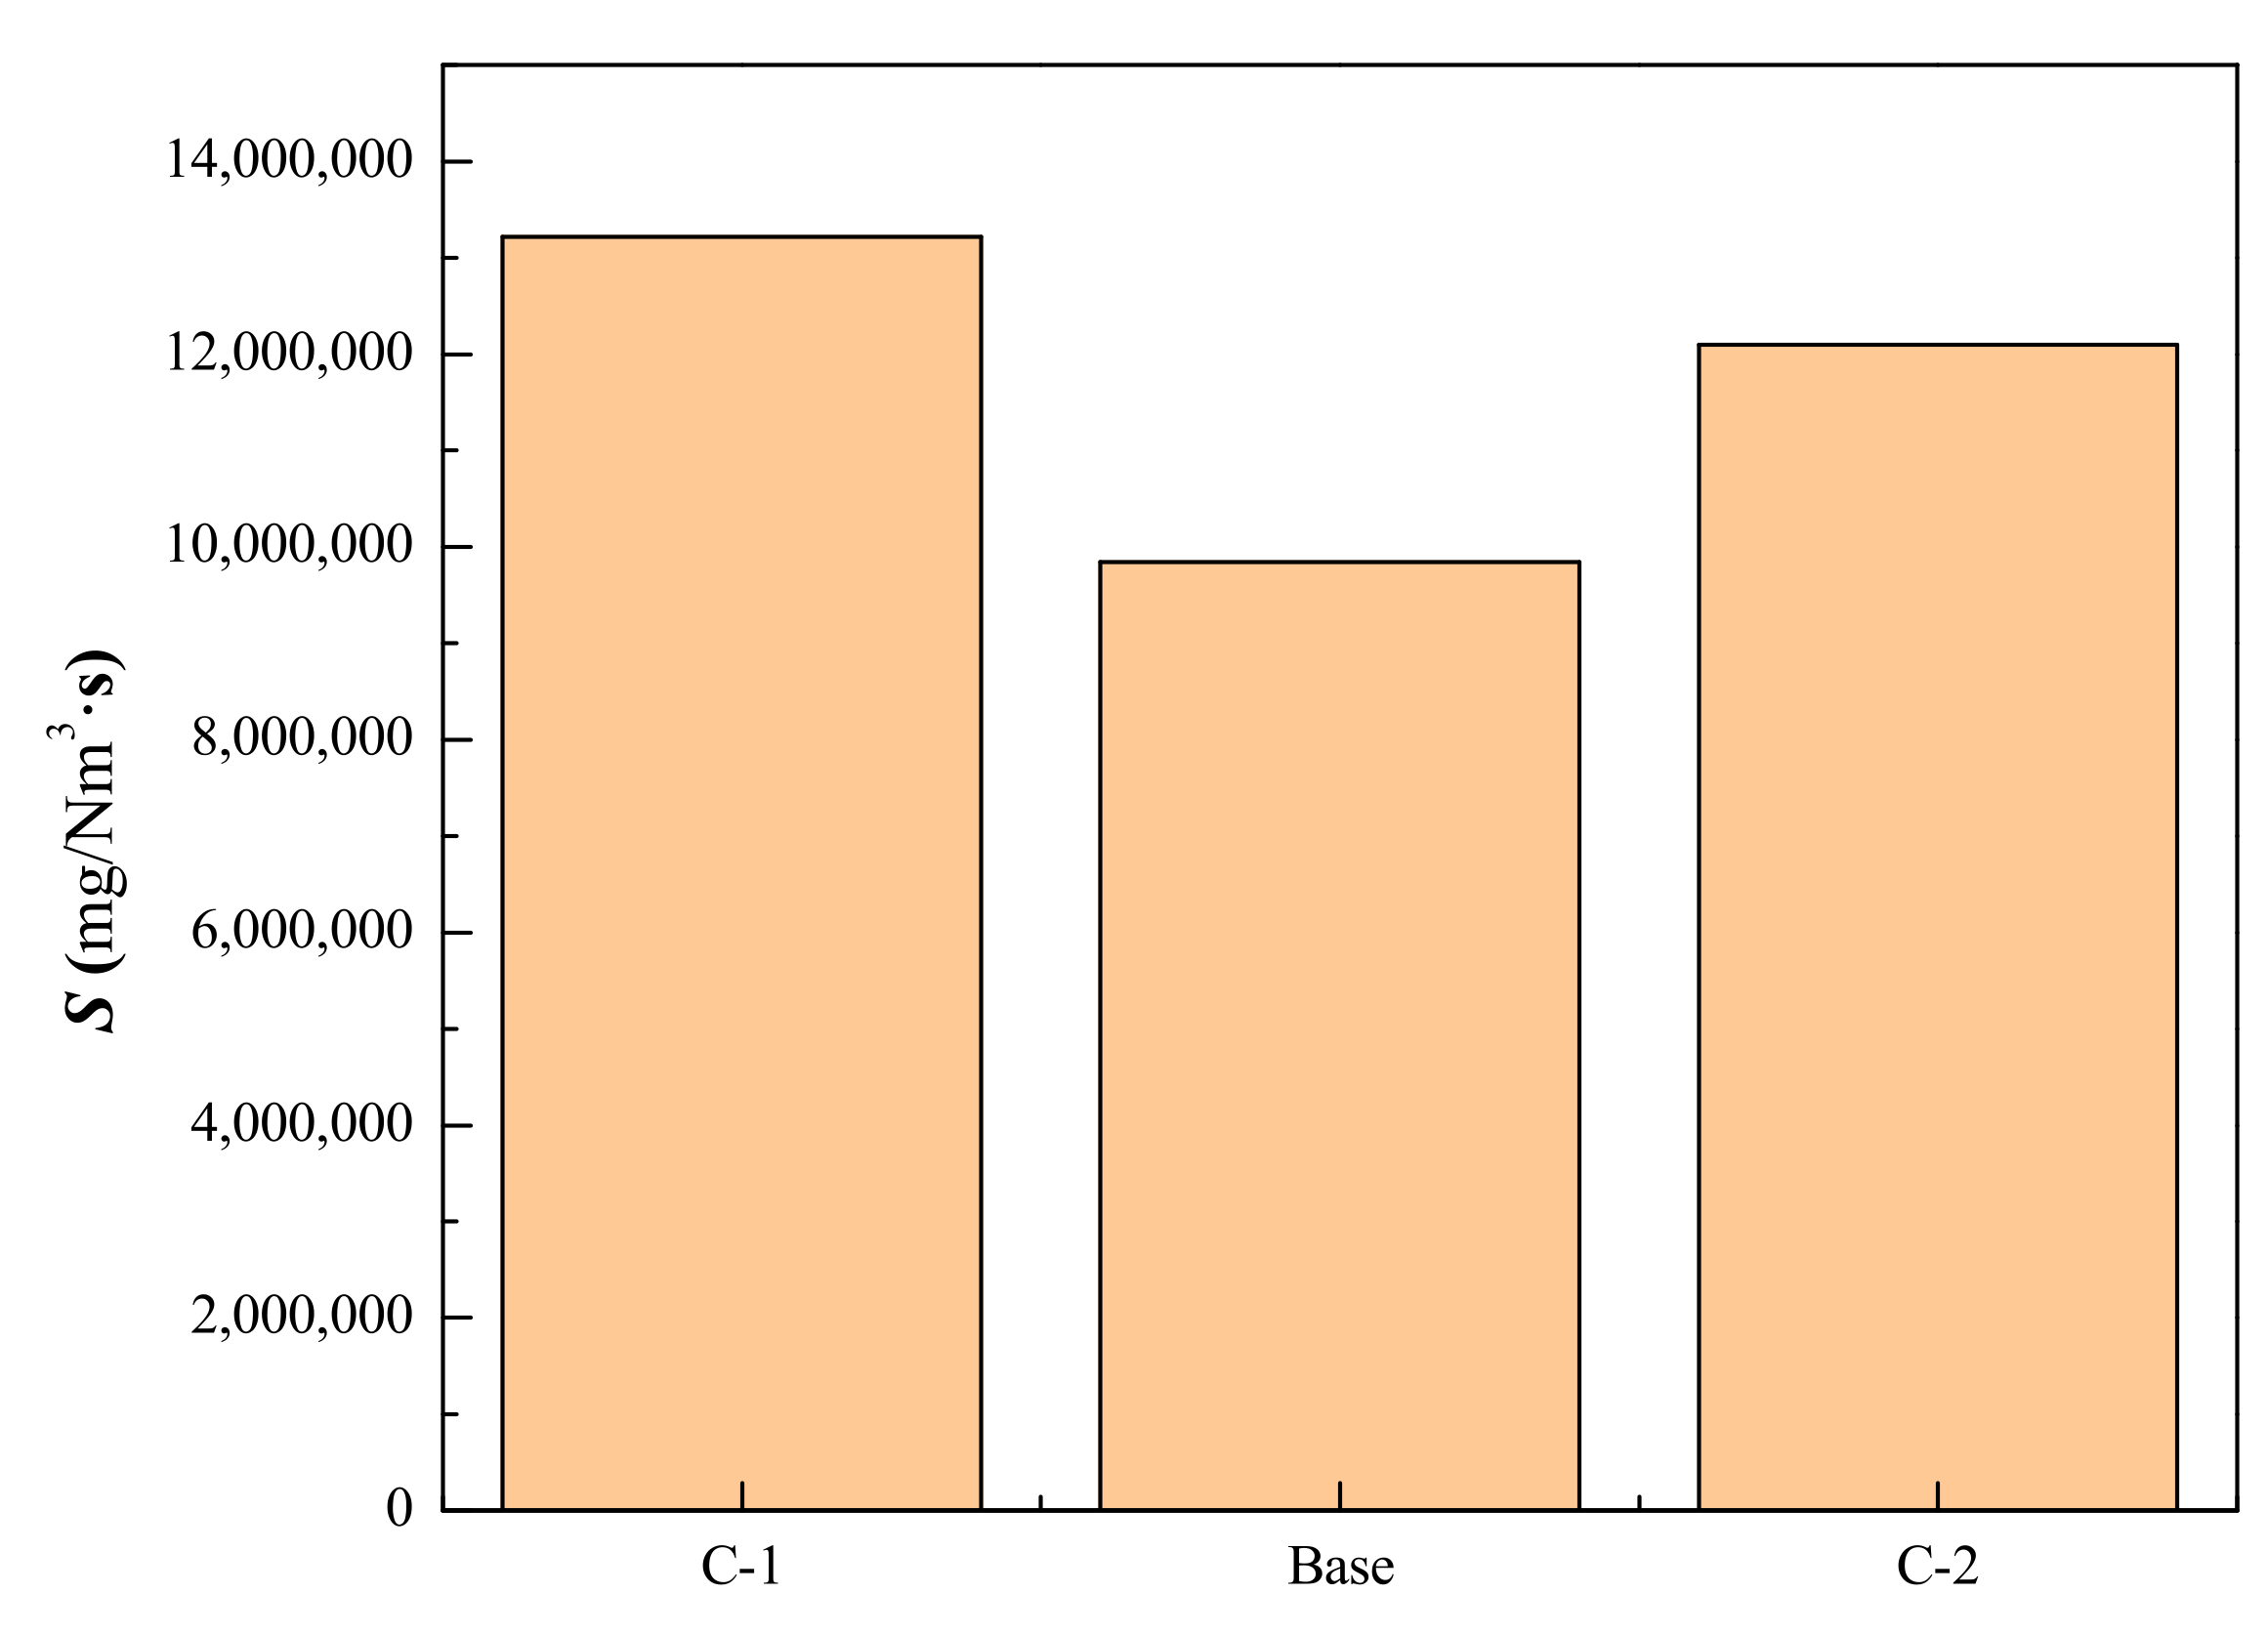
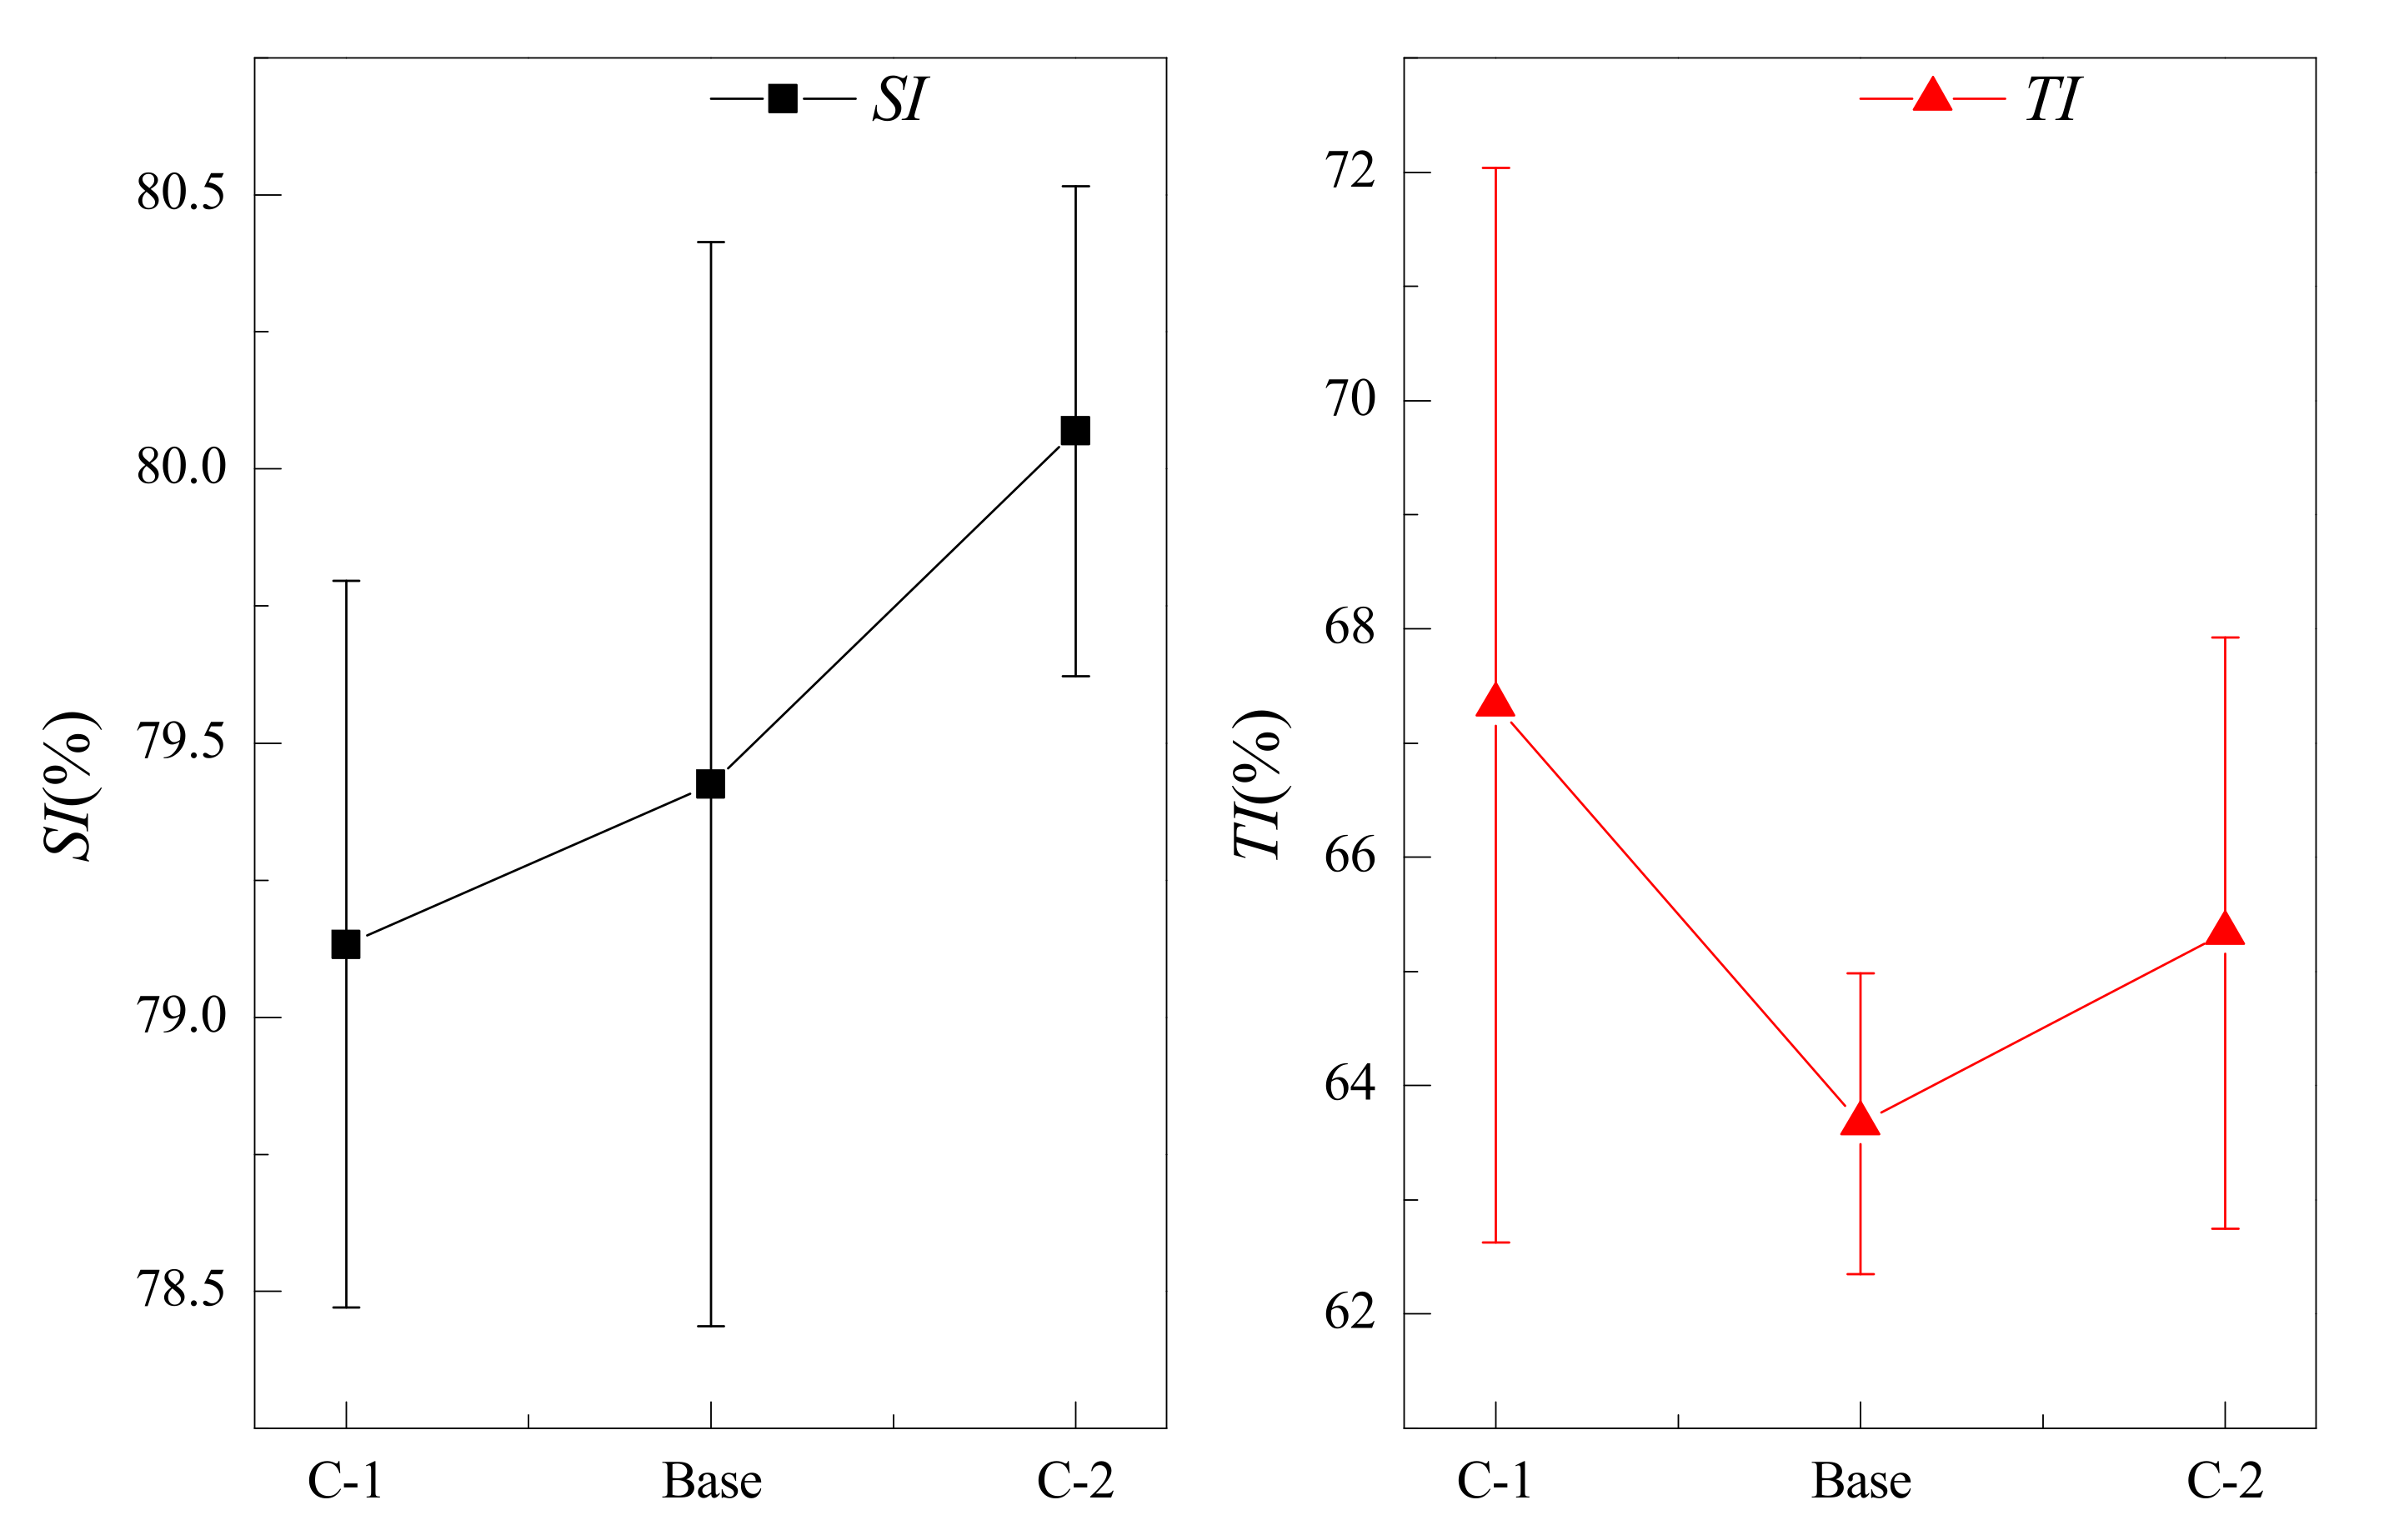
3.3. Influence of Water Ratio on CO Emissions

The purpose of water distribution in the sintering process consisted of improving the sinter mixture’s granulation and the sinter-bed’s permeability. At the same time, water addition also contributed to solid fuel combustion and improved the layer thermal conductivity. In this section, the effect of three water distribution schemes, 7%, 7.5%, and 8%, corresponding to C-1, Base, and C-2, on CO concentration are discussed in detail. Figure 8 shows that CO concentration change was relatively high for Base, followed by C-2 and C-1. The main reason was that if less water was adopted in the sintering mixture, it was not conducive to heat conduction in the sintering mixture layer. The solid fuel burned slowly, and the oxygen content supplied by burning carbon per unit time is also greater under the stable sintering exhaust airflow. Therefore, the generated CO concentration was low, but the sintering time was longer.
However, suppose the addition of water is high. In that case, it will seriously hinder the contact surface of solid fuel with oxygen, which is not conducive to the combustion of carbon, and even the sintering cannot be finished. In terms of sintering endpoint time, the Base had the minimum sintering time of 1150 s, while the schemes with 7% water distribution had the longest sintering time of 1500 s. The main reason was that solid carbon in raw material was burned slowly when water distribution was lower, resulting in a longer sintering time. When appropriate water distribution was adopted, the heat transfer of the sintering mixture layer was enhanced, and the sintering time was shortened. Water distribution would hinder solid carbon combustion and increase the sintering time if water distribution were larger.
Figure 9 shows the total CO emissions under different water distribution schemes. The increasing order of CO emissions was Base, C-2, and C-1. Specifically, the CO emission for C-1 was 1.34 times the Base scheme with the 7.5% water distribution. The CO emission concentration for Base was the highest, but the emission amount was the lowest. The results could be explained that appropriate water distribution in the sintering mixture was helpful to material granulation, carbon combustion, and mixed layer heat transfer. If water distribution is small, water evaporation in the upper layer will bring less heat to the down layer per unit time, which would affect the sintering speed. Meanwhile, although CO concentration was low when small water distribution was adopted, a large CO emission was produced due to the prolonged sintering time. If water distribution was large, water amount evaporated in the upper layer per unit time would increase. A large amount of steam would also hinder carbon combustion and reduce the sintering speed, increasing the sintering time and total CO emissions. Therefore, appropriate water distribution was chosen to reduce the total CO emissions in the sintering process.
Figure 10 shows the effect of different water distribution on sinter quality consisting of shatter and tumbler indexes. From the perspective of the shatter index, the average yield for three water distribution schemes ranges from 79% to 80.07%. The mean yield had an increasing tendency with water distribution because increasing water distribution improves the heat transfer uniformity of the mixture layer and the overall sintering mineralization efficiency in the tests.
The mean tumbler index of the three sinters was very similar. The maximum average value was 67.33% for the scheme C-1, and the minimum average value was 63.67% for the Base. The local temperature of solid fuel combustion for the scheme C-1 was higher due to less water distribution, resulting in local strength improvement. As for scheme C-2, the combustion temperature uniformity was good, although the water distribution was large, so the overall strength of the sinter was relatively better.

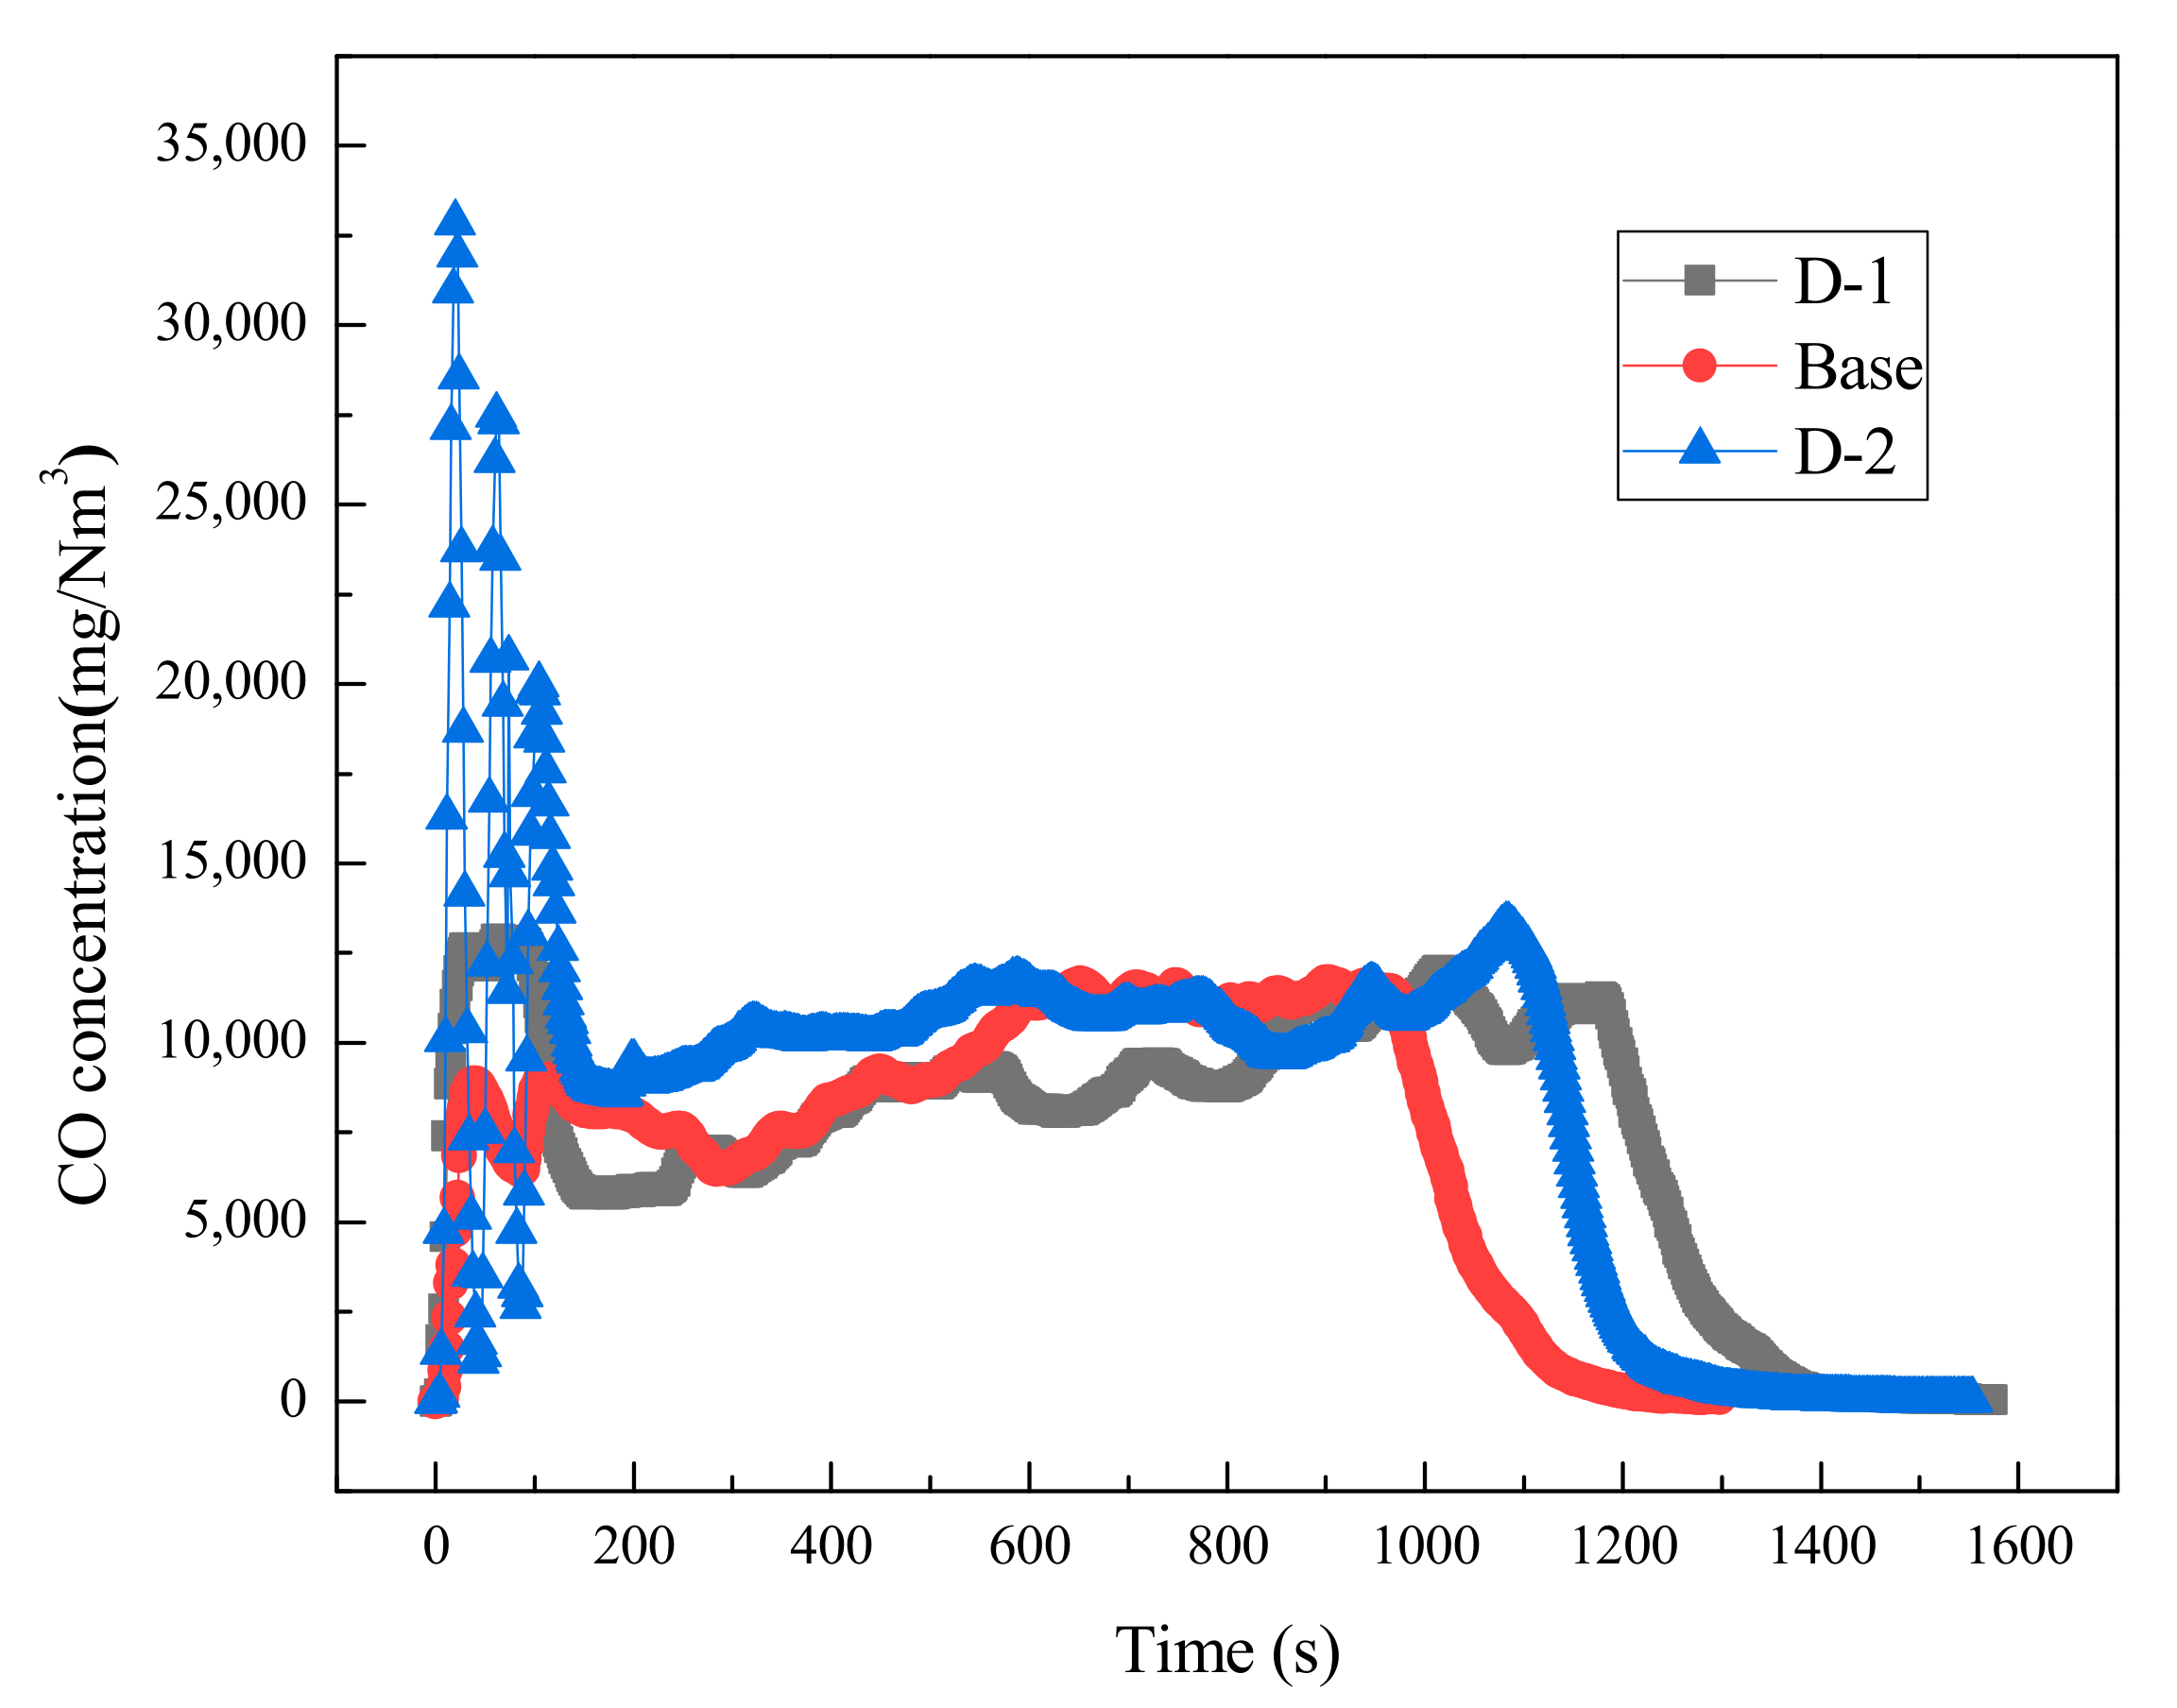
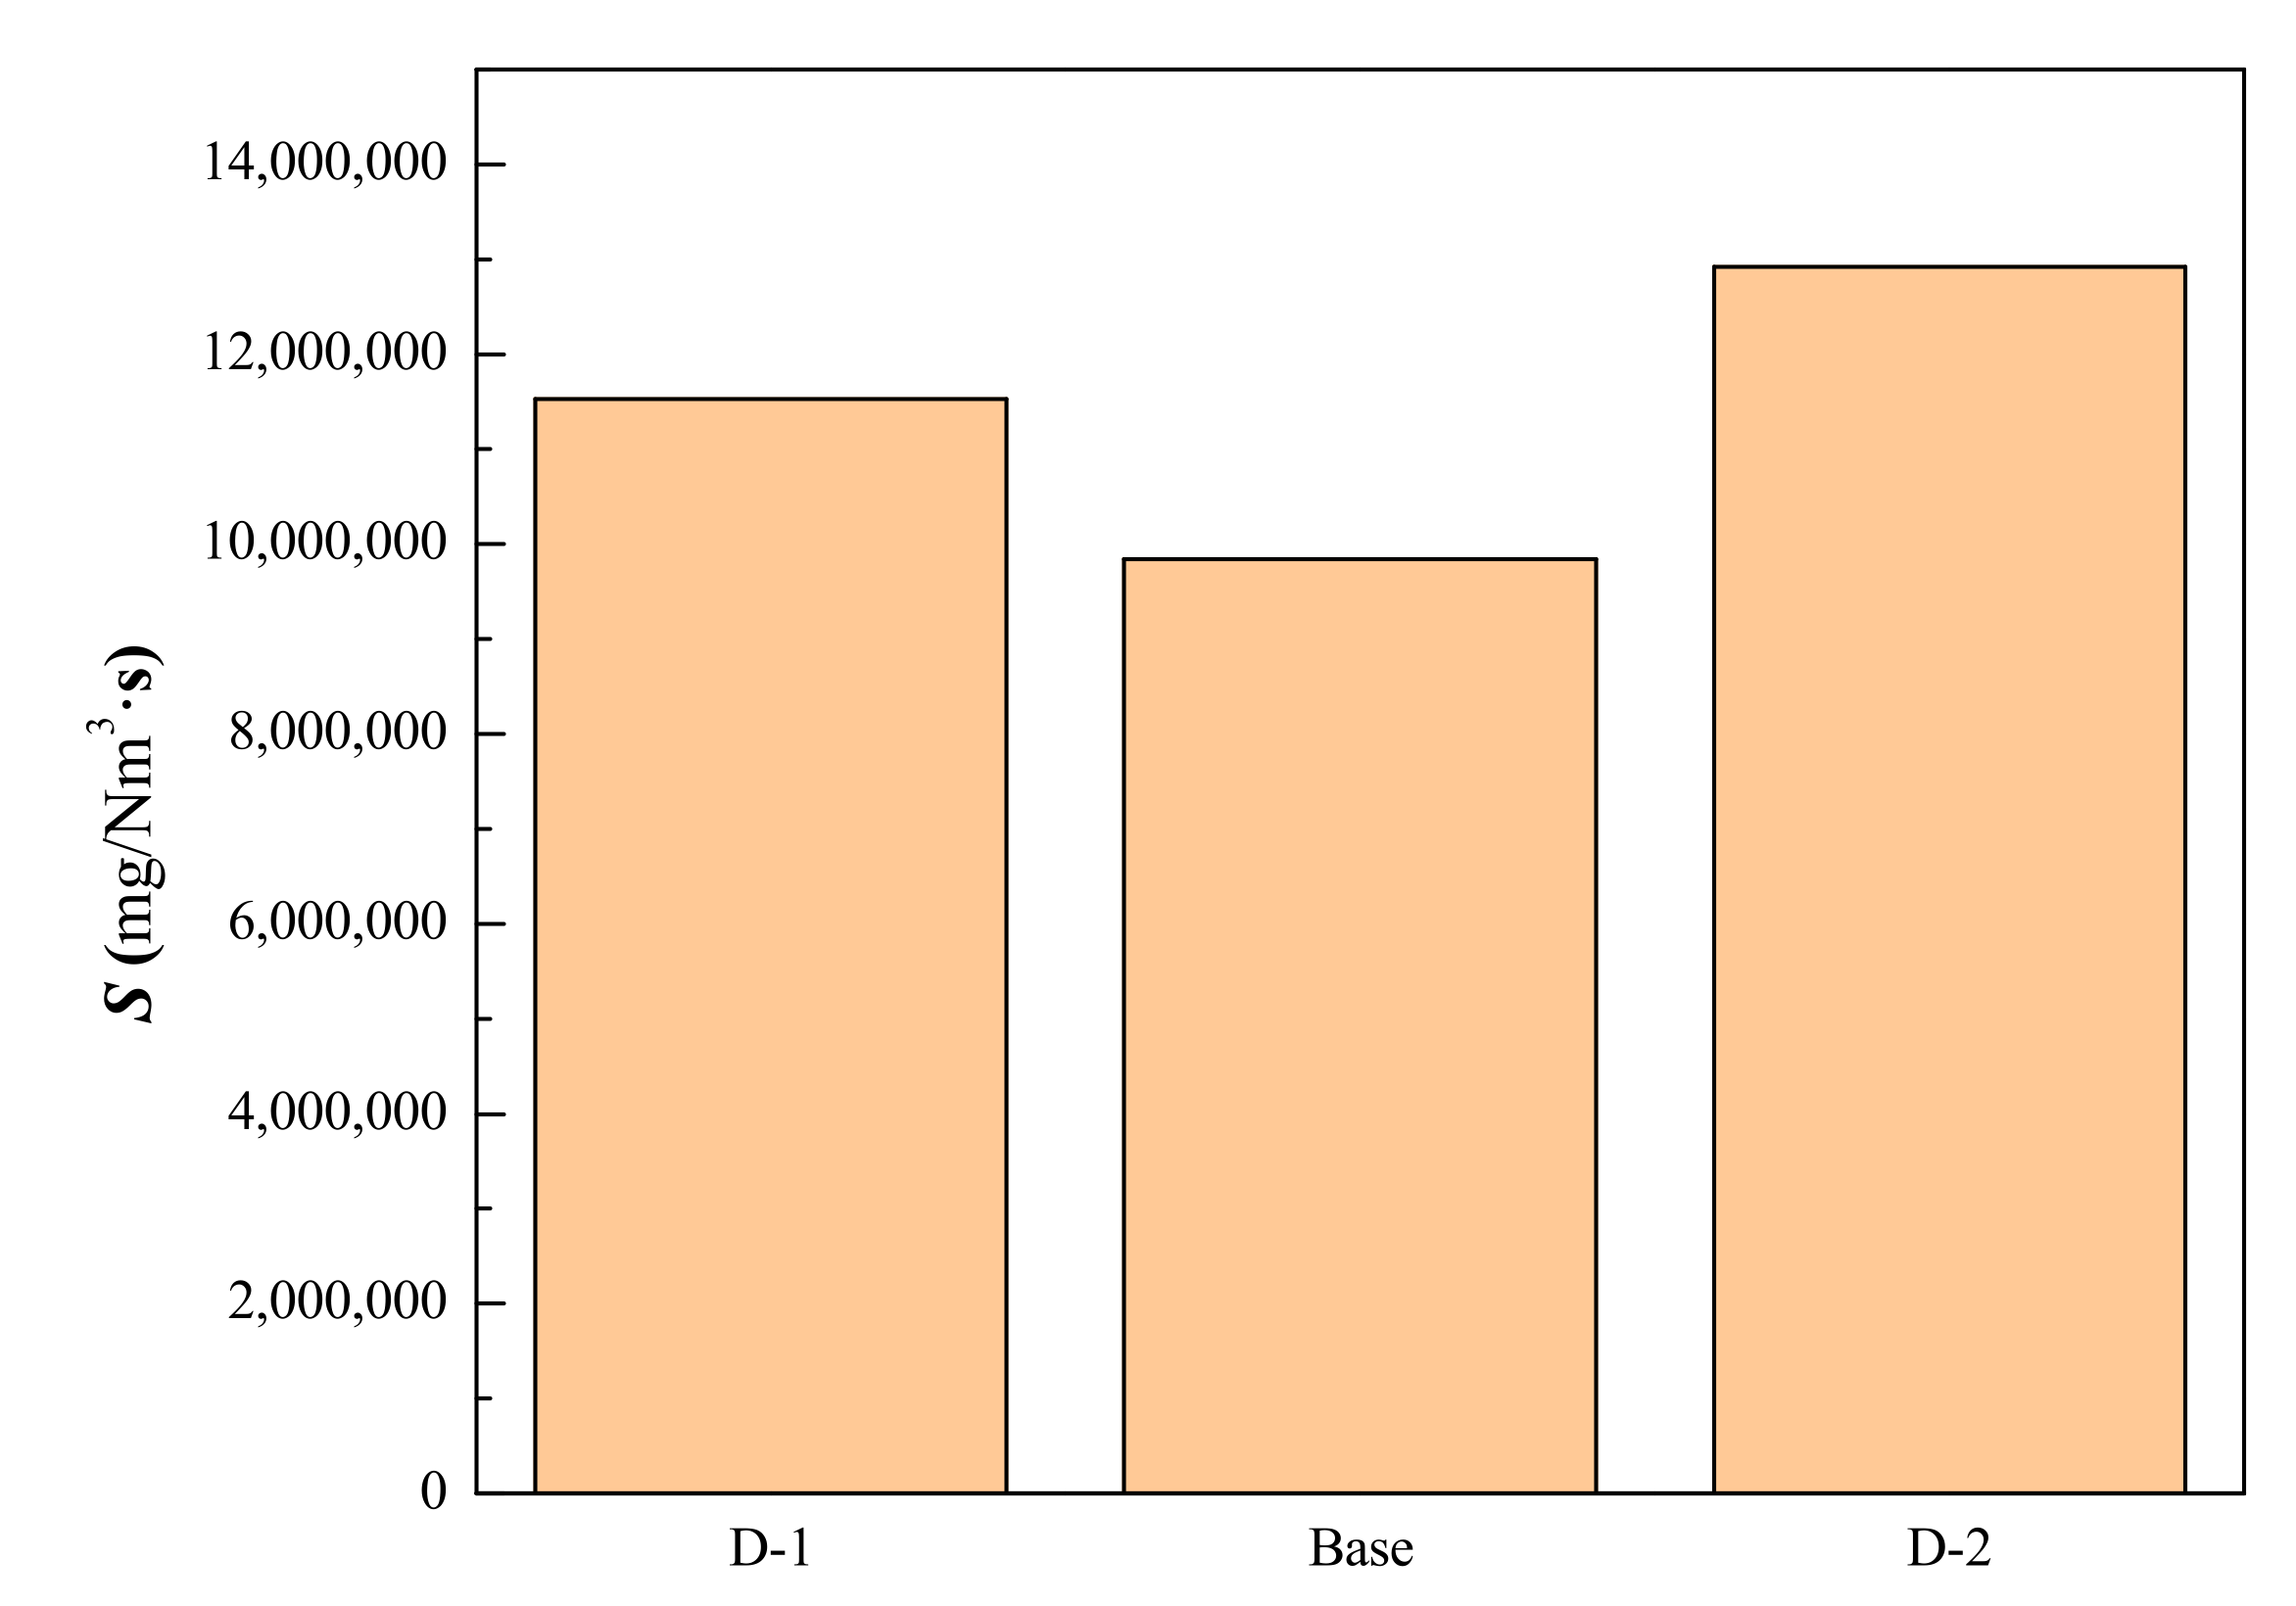
3.4. Influence of Negative Pressure on CO Emissions

The negative pressure of the sintering suction fan was chosen as −11 kPa, −12 kPa, and −13 kPa, respectively, and the corresponding experimental numbers were D-1, Base, and D-2. As shown in Figure 11, in the early and middle sintering stage (i.e., before the sintering time of 700 s), the CO concentration for D-1 was low, followed by Base and D-2. The lowest CO concentration was 5000 mg/m3, and the highest exceeded 10,000 mg/m3. The main reason was that the air amount introduced per unit time was small when adopted low negative pressure. The air velocity in the sintering mixture layer was low. The high CO secondary combustion rate led to an exhaust low CO concentration. When the negative pressure was high, the air amount introduced per unit time was large, and the air velocity was also high. Due to the high air velocity, most of the CO produced was not oxidized in time, resulting in a CO concentration increase. However, in the middle and late stages of the sintering process, the CO concentration for the three schemes tended to be close and decreased rapidly in the sintering end-stage. At the same time, the sintering time with the negative fan pressure under Base was the shortest, followed by D-2 and D-1, respectively.
Figure 12 shows the total CO emission under varied negative fan pressure. The descending order of CO emission was D-2, D-1, and Base. Specifically, the CO emission for the scheme D-2 was 1.31 times that of Base, and the CO emission of the D-1 scheme was 1.17 times that of Base. This showed that the total CO emission for Base was the lowest in terms of comprehensive sintering speed and time. However, CO emission concentration for Base was not the lowest, indicating a higher fuel’s comprehensive combustion efficiency and a reduced total CO emission. The negative fan ratio of D-1 was lower than in the Base. The oxygen content passing through the mixture layer per unit time was reduced, affecting the sintering speed and prolonging the sintering time. Although CO emission concentration was the lowest, the total CO emission was also higher, considering sintering speed and time. The negative fan pressure of D-2 was higher than that of Base, and the oxygen content passing through the mixture layer per unit time increased; meanwhile, for the increasing air velocity in the sintering mixture layer, the incomplete CO combustion also increased, which affected the sintering speed and prolonged the sintering time. Combined with the sintering speed and time, the total CO emission for D-2 was also high. Therefore, the appropriate suction negative pressure helped reduce the total CO emission in the sintering process.
Figure 13 shows the corresponding sinter quality under different fan negative pressure conditions. From the perspective of the shatter index, the mean yields under the three negative pressure schemes were more than 79%, the maximum average value was 81.25%, and the minimum value was 79.42%. In terms of the tumbler index, the average tumbler index of the three schemes was also very close; the sinter for Base had a minimum value of 63.67%, and a maximum value of 64.33% could be obtained for D-2. Therefore, the negative fan pressure varied between −11 kPa to −13 kPa and had little effect on the quality of the sinter.

3.5. Comprehensive Comparison of Schemes

Figure 14 shows the CO concentration in flue gas under different sinter parameters. The schemes with low CO concentrations in the right part of Figure 14 were B-2, C-1, A-1, C-2, D-1, and B-1, respectively. Meanwhile, the sintering speeds from fast to slow were B-1, Base, B-2, D-2, C-2, D-1, A-2, A-1, and C-1. The total CO emission of all schemes is shown in Figure 15. The increasing order of CO emission was A-2, C-1, D-2, B-1, C-2, D-1, A-1, Base, and B-2. Figure 16 showed the variation of sinter quality consisting of shatter index and tumbler index under different sinter parameters. From the perspective of the shatter index, the average yield ranges from 78.88% to 82.83%, which were in an acceptable narrow range. The descending order of the mean shatter index was A-2, D-1, B-2, D-2, C-2, Base, C-1, A-1, and B-1. In terms of the tumbler index, the average tumbler indexes of the schemes other than A-1 were also very close, ranging from 62.67% to 67.33%. The descending order of the mean tumbler index was C-1, C-2, D-2, B-2, D-1, Base, B-1, A-2, and A-1.
Combining CO emissions and sinter quality, B-2 is the optimal scheme, and Base is the right option if production cost is considered.

4. Conclusions

This paper discussed the effects of different sintering parameters on CO emission and sinter qualities in the sintering process through the sintering pot experiments; the results can be concluded as follows:
(1) Reasonable carbon content in the sintering process could ensure the quality of the sinter and reduce CO emission. The low carbon content is not helpful to the quality of the sinter, and excessive carbon content will increase the fuel consumption and sintering cost. 2.8% carbon content in the sinter mixture was suggested in this paper.
(2) Coke powder and pulverized coal are two kinds of fuels in sintering proportioning. When the carbon content is certain, the larger the ratio of CTC was adopted, the better the sinter quality was and the less the CO emission was. The good ratio of CTC in the tests was 2.2.
(3) The water distribution played an excellent role in the ore powder granulation process and the permeability and heat transfer during the sintering process. If the water distribution were smaller or larger, it would reduce the sintering speed, prolong the sintering time and increase the total CO emission. The reasonable water distribution was 7.5%.
(4) Fan negative pressure was one of the important parameters in the sintering process. If the negative pressure were small, there might be problems such as slower sintering speed and larger total CO emission. If the negative pressure were large, it would also increase the incomplete combustion degree of CO in the sintering process and enhance CO emissions. Under the experimental conditions, the reasonable fan negative pressure was −12 kPa.

Author Contributions

F.W. and X.S. conceived and designed the experiments; F.W., X.S., J.G. and J.Z. performed the experiments; F.W. and X.P. analyzed the data; F.W. and H.Z. contributed to the materials; and F.W. wrote the paper. All authors have read and agreed to the published version of the manuscript.

Funding

This research was funded by National Key R&D Program of China, Grant Number 2019YFC1904600 and 2019YFC1905700.

Institutional Review Board Statement

Not applicable.

Informed Consent Statement

Not applicable.

Data Availability Statement

The data presented in this study are available on request from the corresponding author.

Conflicts of Interest

The authors declare no conflict of interest.

References

  1. Cavaliere, P. Ironmaking and Steelmaking Processes; Springer: Cham, Switzerland, 2016; Volume 1, pp. 2–98. [Google Scholar]
  2. Dai, B.; Long, H.; Wen, Y.; Ji, Y.; Liu, Y. Development and production of large blast furnaces from 2015 to 2016 in China. Metall. Res. Technol. 2020, 117, 108. [Google Scholar] [CrossRef] [Green Version]
  3. Worls Steel Association. 2021 World Steel in Figures. 2021. Available online: https://worldsteel.org/wp-content/uploads/2021-World-Steel-in-Figures.pdf (accessed on 1 May 2022).
  4. Wang, Y.; Zhang, J.; Liu, Z.; Du, C. Recent advances and research status in energy conservation of iron ore sintering in China. Jom 2017, 69, 2404–2411. [Google Scholar] [CrossRef]
  5. Lu, L.; Ooi, T.; Li, X. Sintering emissions and their mitigation technologies. In Iron Ore; Elsevier: Amsterdam, The Netherlands, 2015; Volume 18, pp. 551–579. [Google Scholar]
  6. Xu, W.; Shao, M.; Yang, Y.; Liu, R.; Wu, Y.; Zhu, T. Mercury emission from sintering process in the iron and steel industry of China. Fuel Process. Technol. 2017, 159, 340–344. [Google Scholar] [CrossRef]
  7. Fernández-González, D.; Ruiz-Bustinza, I.; Mochón, J.; González-Gasca, C.; Verdeja, L.F. Iron ore sintering: Environment, automatic, and control techniques. Miner. Process. Extr. Metall. Rev. 2017, 38, 238–249. [Google Scholar] [CrossRef]
  8. Li, J.; He, X.; Pei, B.; Li, X.; Ying, D.; Wang, Y.; Jia, J. The ignored emission of volatile organic compounds from iron ore sinter process. J. Environ. Sci. 2019, 77, 282–290. [Google Scholar] [CrossRef]
  9. Qie, J.M.; Zhang, C.X.; Shangguan, F.Q.; Li, X.P.; Zhou, J.C. Effect of Iron-Bearing By-products on the Emission of SO2 and NOx in the Iron Ore Sintering Process. Trans. Indian Inst. Met. 2020, 73, 35–45. [Google Scholar] [CrossRef]
  10. Liu, Z.; Niu, L.; Zhang, S.; Dong, G.; Wang, Y.; Wang, G.; Kang, J.; Chen, L.; Zhang, J. Comprehensive Technologies for Iron Ore Sintering with a Bed Height of 1000 mm to Improve Sinter Quality, Enhance Productivity and Reduce Fuel Consumption. ISIJ Int. 2020, 60, 2400–2407. [Google Scholar] [CrossRef]
  11. Taira, K. NOx emission profile determined by in-situ gas monitoring of iron ore sintering during packed-bed coke combustion. Fuel 2019, 236, 244–250. [Google Scholar] [CrossRef]
  12. Ni, W.; Li, H.; Zhang, Y.; Zou, Z. Effects of Fuel Type and Operation Parameters on Combustion and NOx Emission of the Iron Ore Sintering Process. Energies 2019, 12, 213. [Google Scholar] [CrossRef] [Green Version]
  13. Chun, T.; Long, H.; Di, Z.; Zhang, X.; Wu, X.; Qian, L. Novel technology of reducing SO2 emission in the iron ore sintering. Process Saf. Environ. Prot. 2017, 105, 297–302. [Google Scholar] [CrossRef]
  14. Zhou, H.; Zhou, M.; Liu, Z.; Cheng, M.; Chen, J. Modeling NOx emission of coke combustion in iron ore sintering process and its experimental validation. Fuel 2016, 179, 322–331. [Google Scholar] [CrossRef]
  15. Zhou, H.; Cheng, M.; Zhou, M.; Liu, Z.; Liu, R.; Cen, K. Influence of sintering parameters of different sintering layers on NOx emission in iron ore sintering process. Appl. Therm. Eng. 2016, 94, 786–798. [Google Scholar] [CrossRef]
  16. Gan, M.; Fan, X.; Chen, X.; Ji, Z.; Lv, W.; Wang, Y.; Yu, Z.; Jiang, T. Reduction of pollutant emission in iron ore sintering process by applying biomass fuels. ISIJ Int. 2012, 52, 1574–1578. [Google Scholar] [CrossRef] [Green Version]
  17. Gan, M.; Lv, W.; Fan, X.; Chen, X.; Ji, Z.; Jiang, T. Gasification Reaction Characteristics between Biochar and CO2 as well as the Influence on Sintering Process. Adv. Mater. Sci. Eng. 2017, 2017, 9404801. [Google Scholar] [CrossRef] [Green Version]
  18. Gan, M.; Ji, Z.; Fan, X.; Chen, X.; Zhou, Y.; Wang, G.; Tian, Y.; Jiang, T. Clean recycle and utilization of hazardous iron-bearing waste in iron ore sintering process. J. Hazard. Mater. 2018, 353, 381–392. [Google Scholar] [CrossRef]
  19. Gan, M.; Ji, Z.; Fan, X.; Zhao, Y.; Chen, X.; Fan, Y. Insight into the high proportion application of biomass fuel in iron ore sintering through CO-containing flue gas recirculation. J. Clean. Prod. 2019, 232, 1335–1347. [Google Scholar] [CrossRef]
  20. Yu, Z.; Fan, X.; Gan, M.; Chen, X.; Lv, W. NOx Reduction in the Iron Ore Sintering Process with Flue Gas Recirculation. Jom 2017, 69, 1570–1574. [Google Scholar] [CrossRef]
  21. Wang, F.; Zhang, J.; Qie, J.; Zhou, J.; Tian, X.; Qi, Y. Emission law and analysis of flue gas in sinter wind boxes. Iron Steel 2019, 54, 96–102. (In Chinese) [Google Scholar]
  22. Liao, J.; Zheng, H.; Gan, M.; Yu, H.; Fan, X. Generation and governance way of CO in sintering flue gas—formation mechanism and emission law. Sinter. Pelletizing 2021, 46, 1–7. (In Chinese) [Google Scholar]
  23. Zhu, D.; Xue, Y.; Pan, J.; Yang, C.; Guo, Z.; Tian, H.; Wang, X.; Huang, Q.; Pan, L.; Huang, X. Co-benefits of CO2 emission reduction and sintering performance improvement of limonitic laterite via hot exhaust-gas recirculation sintering. Powder Technol. 2020, 373, 727–740. [Google Scholar] [CrossRef]
  24. Wang, Y.; Liu, Z.; Zhang, J.; Zhang, Y.; Niu, L.; Cheng, Q. Study of stand-support sintering to achieve high oxygen potential in iron ore sintering to enhance productivity and reduce CO content in exhaust gas. J. Clean. Prod. 2020, 252, 119855. [Google Scholar] [CrossRef]
  25. Liu, J.; Zhou, M.; Wu, F.; Zhang, H.; Xu, L.; Zhai, L.; Gao, W.; Zhong, Q. Study of the Double-Layer Sintering Process with Stand-Support. Metals 2022, 12, 629. [Google Scholar] [CrossRef]
  26. Lu, L.; Adam, M.; Kilburn, M.; Hapugoda, S.; Somerville, M.; Jahanshahi, S.; Mathieson, J.G. Substitution of Charcoal for Coke Breeze in Iron Ore Sintering. ISIJ Int. 2013, 53, 1607–1616. [Google Scholar] [CrossRef] [Green Version]
  27. Li, Q.; Wen, B.; Wang, G.; Cheng, J.; Zhong, W.; Dai, T.; Liang, L.; Han, Z. Study on calculation of carbon emission factors and embodied carbon emissions of iron-containing commodities in international trade of China. J. Clean. Prod. 2018, 191, 119–126. [Google Scholar] [CrossRef]
Figure 1. The schematic diagram of the sintering pot test system.
Metals 12 01202 g001
Figure 2. CO emission concentration during sintering at different carbon addition. (The carbon amount: A-1 = 2.6%; Base = 2.8%; A-2 = 3.0%).
Metals 12 01202 g002
Figure 3. Influences of carbon addition in the sintering mixture on CO emissions. (The carbon amount: A-1 = 2.6%; Base = 2.8%; A-2 = 3.0%).
Metals 12 01202 g003
Figure 4. Influences of carbon addition in the sintering mixture on sinter quality. (The carbon amount: A-1 = 2.6%; Base = 2.8%; A-2 = 3.0%).
Metals 12 01202 g004
Figure 5. CO emission concentration during sintering at various ratios of CTC. (The ratios of CTC: B-1 = 1.8; Base = 2.0; B-2 = 2.2).
Metals 12 01202 g005
Figure 6. Influences of the ratio of CTC in the sintering mixture on CO emission. (The ratios of CTC: B-1 = 1.8; Base = 2.0; B-2 = 2.2).
Metals 12 01202 g006
Figure 7. Influences of the CTC ratio in the sintering mixture on sinter quality. (The ratios of CTC: B-1 = 1.8; Base = 2.0; B-2 = 2.2).
Metals 12 01202 g007
Figure 8. CO emission concentration during sintering at various ratios of water. (Water ratios: C-1 = 7; Base = 7.5; C-2 = 8).
Metals 12 01202 g008
Figure 9. Influences of the ratio of water in the sintering mixture on CO emission. (The ratios of water: C-1 = 7; Base = 7.5; C-2 = 8).
Metals 12 01202 g009
Figure 10. Influences of the water ratio in the sintering mixture on sinter quality. (Water ratios: C-1 = 7; Base = 7.5; C-2 = 8).
Metals 12 01202 g010
Figure 11. CO emission concentration during sintering at different negative pressure. (The negative pressure: D-1 = −11 kPa; Base = −12 kPa; D-2 = −13 kPa).
Metals 12 01202 g011
Figure 12. Influences of the negative fan pressure on CO emission. (The negative pressure: D-1 = −11 kPa; Base = −12 kPa; D-2 = −13 kPa).
Metals 12 01202 g012
Figure 13. Influences of the fan negative pressure on sinter quality. (The negative pressure: D-1 = −11 kPa; Base = −12 kPa; D-2 = −13 kPa).
Metals 12 01202 g013
Figure 14. Influences of the sinter parameters on CO emission concentration.
Metals 12 01202 g014
Figure 15. Influences of the sinter parameters on CO emission.
Metals 12 01202 g015
Figure 16. Influences of the sinter parameters on sinter quality.
Metals 12 01202 g016
Table 1. Main chemical compositions of iron ore blend and fluxes (mass fraction, mass %).
Raw MaterialTFeSiO2CaOMgOAl2O3Fe2O3SZn
Iron ore blending61.134.441.760.421.981.040.0280.011
Return fines56.085.118.721.772.3671.35 /
Light burned dolomite/3.6340.2222.54// /
Quicklime/2.8468.92/// /
Dolomite/4.2829.3118.69// /
Table 2. Proximate and ultimate analyses of solid fuels (mass fraction, mass %).
FuelsProximate AnalysisUltimate Analysis
Mad 1Aad 2Vad 3FCad 4St,ad 5CHS
Coal breeze4.3614.357.1074.190.6174.852.540.44
Coke breeze0.3414.481.7083.480.7685.320.130.62
1 Moisture (air dried basis). 2 Ash (air dried basis). 3 Volatile matter (air dried basis). 4 Fixed carbon (air dried basis). 5 Sulfur content (air dried basis).
Table 3. The parameters of the sintering pot.
ParameterUniteValue
Inner diametermm300
Heightmm700
Ignition negative pressurekPa8
Ignition temperature1034
Ignition times80
Initial set value of negative pressurekPa10–12
Sintering timemin20–40
Table 4. Proportions of raw materials in sintering mixture, the ratio of CTC, and negative pressure at different schemes.
SchemesMass Fraction/Mass%Negative Pressure/(-kPa)
Iron Ore BlendingReturn FinesQuicklimeLight Burned DolomiteDolomiteCoke BreezeCoal BreezeFixed CarbonWaterRatio of Coke Breeze and Coal Breeze
Base69.2018.255.212.391.232.471.262.807.502.0012.00
A-169.3918.305.222.401.232.301.172.607.502.0012.00
A-269.0018.205.192.381.232.651.353.007.502.0012.00
B-169.1918.245.212.391.232.411.342.807.501.8012.00
B-269.2118.255.212.391.232.551.162.807.502.2012.00
C-169.2018.255.212.391.232.471.262.807.002.0012.00
C-269.2018.255.212.391.232.471.262.808.002.0012.00
D-169.2018.255.212.391.232.471.262.807.502.0011.00
D-269.2018.255.212.391.232.471.262.807.502.0013.00
Publisher’s Note: MDPI stays neutral with regard to jurisdictional claims in published maps and institutional affiliations.

