Article

Experimental and Numerical Analysis of Prestrain on the Formability of Zn-Cu-Ti Alloy Zinc Sheet

by
Emanuel A. Nicoletti
1,
Analía Roatta
1,
Luciano Ponzellini Marinelli
1,
Javier W. Signorelli
1,* and
Diego J. Celentano
2
1
Instituto de Física Rosario, Facultad de Ciencias Exactas, Ingeniería y Agrimensura, CONICET-UNR, Bv. 27 de Febrero 210 bis, Rosario 2000, Argentina
2
Centro de Investigación en Nanotecnología y Materiales Avanzados (CIEN-UC), Departamento de Ingeniería Mecánica y Metalúrgica, Pontificia Universidad Católica de Chile (PUC), Av. Vicuña Mackenna 4680 Macul, Santiago 7820436, Chile
*
Author to whom correspondence should be addressed.
Metals 2022, 12(7), 1095; https://doi.org/10.3390/met12071095
Submission received: 15 April 2022 / Revised: 3 June 2022 / Accepted: 22 June 2022 / Published: 26 June 2022
(This article belongs to the Special Issue Sheet Metal Forming)

Abstract

:
The forming limit diagrams (FLDs) characterizing the formability of sheet metals are usually obtained by applying proportional loadings. Nevertheless, the industrial processes involve strain path changes that can modify the limit-strain values. In addition, for strongly anisotropic sheet metals such as the Zn-Cu-Ti zinc alloy, large differences in forming limit curves (FLCs) with respect to the sheet rolling direction are observed. In the present work, the analysis of the effect of bilinear strain paths on the FLC is addressed by both experimental measurements and numerical simulations. For this purpose, a miniature testing device was used that allows evaluation of the influence of strain path changes on the limit strain on samples at 0°, 45° and 90° with respect to the sheet rolling direction cut from non-standard large samples previously subjected to a prestrain along the RD up to an early deformation of ~0.12. Numerical simulations were carried out using the well-known Marciniak and Kuczynski (MK) theory in conjunction with the viscoplastic self-consistent (VPSC) crystal plasticity model. In order to account for the grain fragmentation process due to the continuous dynamic recrystallization (CDRX) mechanism, an ad hoc short-range interaction effect (SRE) model was included in the simulations. Additionally, the measured and simulated texture evolution of Zn-Cu-Ti alloy sheets at the different stages of the deformations were shown. The capacity of the MK-VPSC-SRE model was validated, and the limitations to simulating the texture development, flow stress and forming limit curves, including a non-proportional strain path, were discussed.

1. Introduction

The Zn-Cu-Ti alloy sheets have good malleability and weldability, and excellent corrosion resistance and surface finish aspect, making zinc alloys a good industrial choice for architectural and building industry applications, allowing skin-type creations in vanguard projects [1]. Despite its wide range of applications and advantages, there are only a few research works on the formability of these types of alloys. Most of the research contribution focuses on other hexagonal close-packed (HCP) materials such as titanium, magnesium or zirconium [2,3]. Zinc alloys processed in the sheet form are highly anisotropic, reinforced by a strong crystallographic basal texture and a reduced number of available slip systems and twinning. In this regard, Jansen et al. [4] and Milesi et al. [5] evaluated the forming limit curve (FLC) of a low Cu-Ti zinc sheet along the rolling (RD) and transverse (TD) directions, finding a high dependence of the limit-strain behavior with the loading direction where, in particular, they were the first to highlight an unusual strain limit behavior when the major principal strain is aligned to the RD for strain paths in the region of the expansion zone. Later, this abrupt decrease in the formability near the balanced biaxial (EBA) expansion was also confirmed by the work of Schlosser et al. [6] for a similar zinc alloy sheet. Milesi et al. [7] studied the dispersion of the limit-strain values as a result of tracking samples of 24 coils of commercial Zn-Cu-Ti alloy, showing a non-negligible variability in the limit strains between coils, especially for strain paths in the expansion region in the case of specimens tested along the RD. Schwindt et al. (2015) examined the dependence of the FLD on sheet orientation for a Zn20 (Zn-Cu-Ti) zinc alloy sheet along the RD, DD and TD, showing that the predicted limit strains depend greatly on the sample orientation.
The industrial forming process of sheet metals involves strain path changes as a consequence of the required complex strain pattern. The effects of loading history on the limit-strain profile have been researched mainly for aluminum and steel sheets, and much less for HCP materials. On aluminum alloys, Graf [8] studied the effect of the changing strain path on forming limit diagrams of 2008-T4 samples and observed different effects on the FLD for three different prestrains: biaxial, uniaxial tension and plane strain. Dhara [9] used uniaxial tension on the RD and TD as the prestrain in the FLD of AA5754-O material, and found a shift in the FLD depending on the amount and direction of uniaxial prestrain. The FLC increases in the left-hand side, and decreases in the right-hand side of the diagram under a prestrain along the transverse direction (TD) or rolling direction (RD). Laukonis [10] worked on the effects of strain path changes on the formability of A-K-steel and 2036-T4 aluminum sheets; the authors showed that the formability is reduced in proportion to the magnitude of the balanced biaxial prestrain. For the 2036-T4 aluminum, some strain-limit states, which were available to the materials without prestrain, become unattainable for a two-step process and vice versa. Abedini [11] performed non-proportional tests with uniaxial or biaxial prestrain followed by abrupt changes in the stress state to plane-strain tension or shear in the ZEK100-O sheet. The authors observed that the strain limit under the shear state did not show any significant sensitivity to prestrain histories, but for the plane-strain tension condition, the strain limit is reduced.
In the case of zinc alloys, Schlosser et al. [6] showed that the use of a bilinear strain, equibiaxial followed by uniaxial tension, extends the formability of the analyzed material. However, the higher limit strains were less sensitive to the orientation of the sheet when compared to a one-stage purely proportional deformation path. The limit strains along the RD and DD were similar for all the tested prestrain values, whereas in the TD case limit-strain values decreased as the prestrain increased. However, this study was limited only to an evaluation of the limit strain under uniaxial tension after a biaxial prestrain. The complete FLD was not assessed. Borodachekova et al. [12] studied the mechanical response and texture evolution of a Zn alloy sheet subjected to deformation involving a load reversal. Additionally, these works analyzed the effect of a prestrain on only one strain path in zinc alloys, and the prestrain effect on the full FLD has not yet been studied. Recently, Muñoz et al. [13] showed that previous equal channel angular sheet extrusion (ECASE) processing resulted in a slightly higher limit strain when compared with the response of the non-predeformed material. Additionally, magnesium and zinc alloy presented continuous dynamic recrystallization (CDRX) under specific loading and temperature conditions. Leonard et al. [14] established the occurrence of CDRX during bilinear tension tests at room temperature for a Zn-Cu-Ti alloy, but a limit-strain analysis was not addressed in their study. Even though limit strains are a point of great interest, the effect of the deformation path changes and the influence of CDRX on the limit strains for zinc alloy sheets is an issue that has not been addressed to the knowledge of the authors.
The use of micromechanical models for the prediction of the forming limit behavior of sheet metals has advanced significantly; crystal plasticity (CP) models provide a framework to better understand the relation between flow localization and the material’s microstructure. See, for example, [15] for a brief review of recent investigations using the Marciniak–Kuczynski (MK) technique in conjunction with crystal plasticity models. Under this framework, Yang et al. [16] studied the limit behavior of an AA5052-O sheet under three types of prestrains (uniaxial tension, plane-strain tension and in-plane equibiaxial tension). They found that prestraining in uniaxial tension and in-plane equibiaxial tension significantly affects the FLC profiles, while a plane-strain prestrain has a smaller effect. The authors performed two sets of experiments to validate their results: a uniaxial prestrain and cylindrical cup drawing. A comparison between the predictions and experimental data showed good agreement. Within the framework of the MK-VPSC model and applying the methodology developed by Kuroda and Tvergaard [17], Schwindt et al. [18] evaluated three sets of abruptly changing two-step strain and stress paths for FCC materials. This issue has been and is still today extensively researched, both experimentally and through computational modeling [15]. Modeling crystallographic texture evolution in zinc sheets was initially studied by Philippe and colleagues [19,20] using the Taylor model. Assuming basal, prismatic and twinning as plastic deformation mechanisms, the authors describe the evolution of the texture and microstructure of Zn-Cu and Zn-Cu-Ti alloy sheets produced by cold rolling up to 80% reduction. Later, Fundenberger et al. [21], using the same zinc alloy and the same framework, simulated the elastic limit and the planar anisotropy coefficient, finding a good agreement between the experimental values and those of the Taylor model. Cauvin et al. [22], using the VPSC model, analyzed the mechanical anisotropy of a Zn–Cu–Ti alloy, focusing mainly on the tensile response and the texture evolution. More recently, Roatta et al. [23] introduced, using a VPSC model under an affine linearization procedure, a short-range interaction effect (SRE) by enforcing the continuity of the lattice rotation field between pairs of orientations randomly chosen to effectively mimic the effects of continuous dynamic recrystallization (CDRX) on the texture evolution of the Zn-Cu-Ti alloy sheet under monotonic loadings. In particular, the typical splitting of the basal poles predicted by VPSC simulations without the recrystallization effect when tensile loading is aligned to the transverse direction is avoided, in agreement with the experimental evidence. However, the authors do not mention the effect on the limit-strain behavior of the material. The proposed ad hoc SRE model was validated by the authors for tensile and shear tests at different loading directions (RD, DD and TD) and low strains.
The aim of this work is to evaluate, experimentally and by modeling, the forming limit diagram (FLD) of a 0.65-mm-thick Zn-Cu-Ti alloy along the RD, DD and TD using samples previously subjected to a prestrain along the RD in order to establish the validity and limitations of the SRE scheme for mimicking the effects of CDRX in conjunction with the MK technique. The materials and methods are summarized in Section 2 that encompasses material characterization, mechanical response and the methodology to obtain the forming limit curve including digital image correlation techniques to evaluate the limit strain. The theoretical framework of the MK-VPSC model is outlined in Section 3. Then results are presented in Section 4 where the capabilities and limitations of the simulated FLCs and texture evolution are evaluated in comparison with the corresponding experimental data. Finally, Section 5 summarizes the main concluding remarks related to this research.

2. Materials and Methods

We performed this zinc formability study with four groups of experiments. The first and second group characterized the microstructure and the crystallographic texture of the as-received material, respectively. The third group of tests characterized the mechanical response of the material. Uniaxial tensile tests in and at 90° the sheet’s rolling direction, RD and TD, respectively, make up these experiments. The fourth group of experiments corresponded to tests used to characterize sheet formability: the FLC was addressed by both experimental measurements and numerical simulations, with and without a prestrain along RD.

2.1. As-Received Material

The material for this study was a commercial Zn–Cu–Ti sheet of 0.65 mm thickness. The addition of Cu results in an increase in strength, hardness and creep resistance [24]; Ti has lower solubility, and precipitate TiZn16 is an intermetallic phase [25]. The evaluated zinc sheet was manufactured by continuous cast followed by rolling in two steps, the first one comprised two passes at high temperature. Then, the sheet was coiled and the final rolling step consisted of several passes near room temperature (~50–80 °C) until the final thickness was achieved. The optical micrograph (Olympus PME 3, manufactured by Olympus Comporation, Tokyo, Japan) reveals a heterogeneous distribution of the intermetallic phase, where there are regions with a clear preferential alignment along RD while others are more randomly distributed (Figure 1a). The EBSD map shows the existence of a non-negligible twin fraction in the as-received material as a consequence of the manufacturing thermo-mechanical process (Figure 1b) [13].

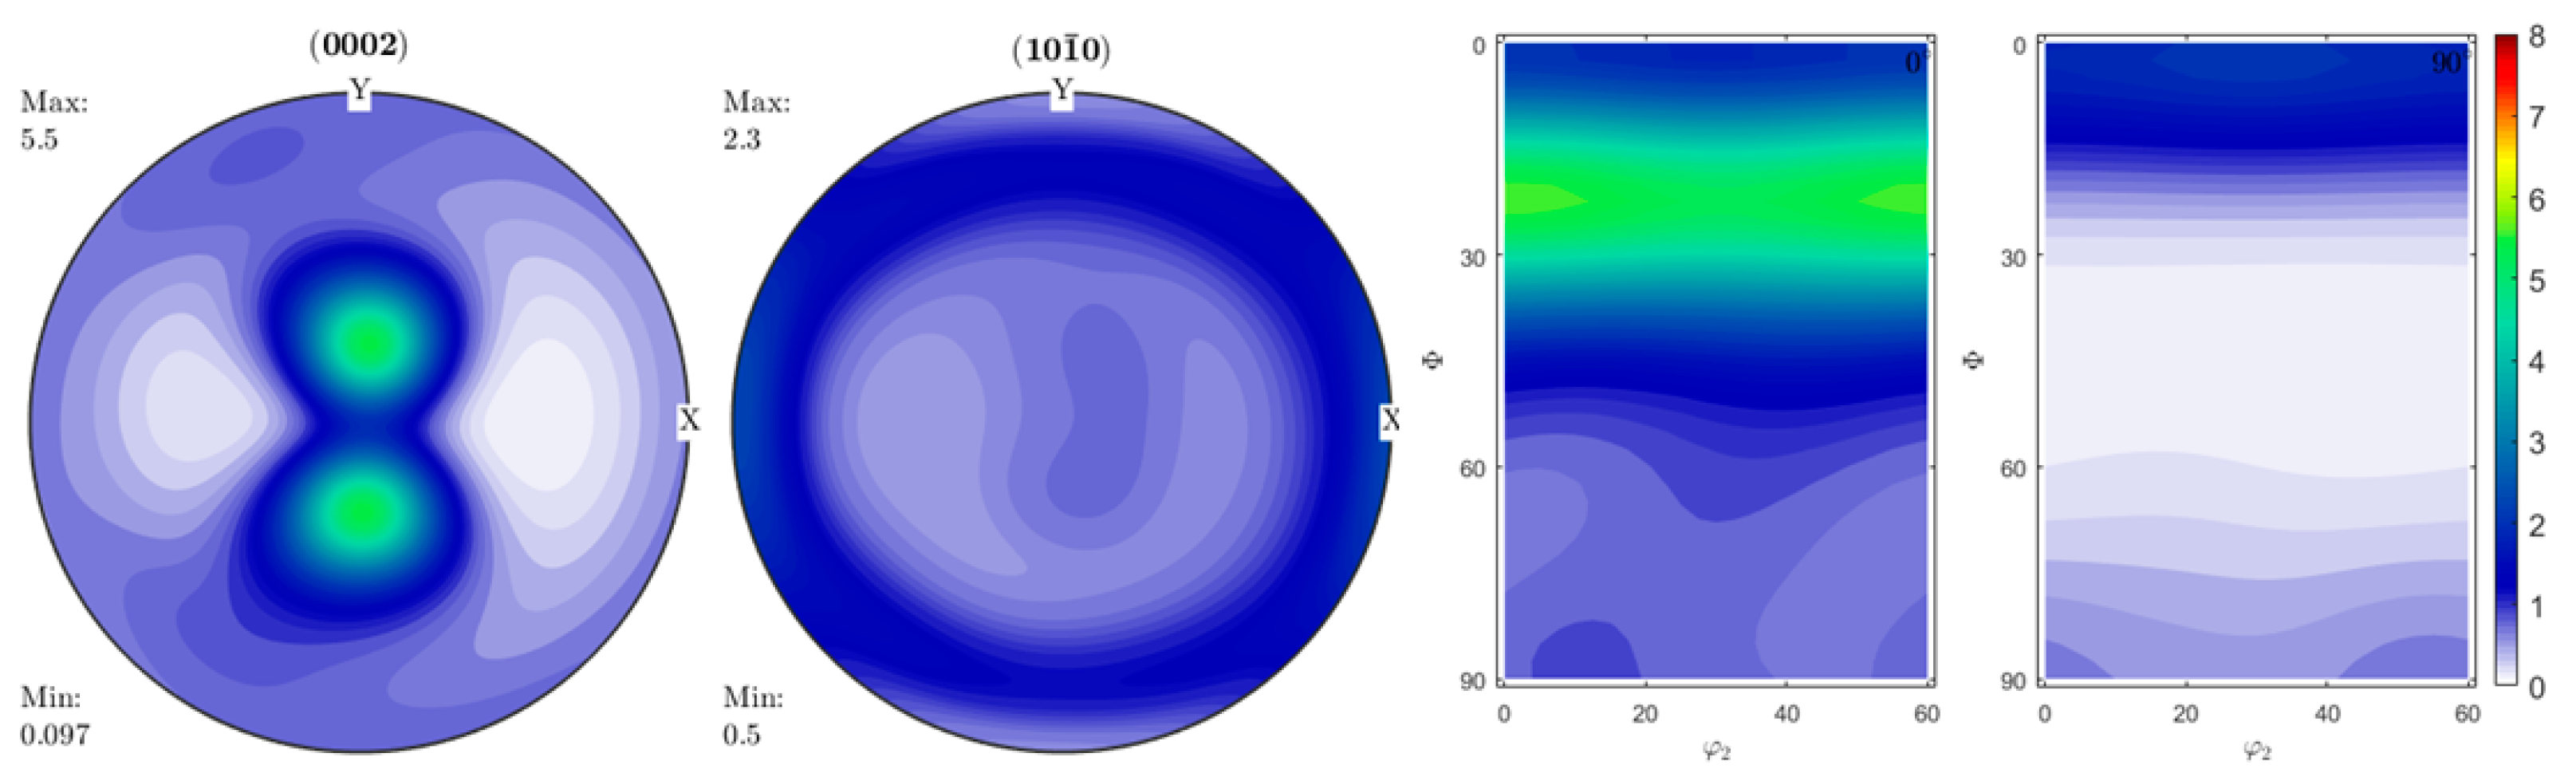
2.2. Texture Measurement

The crystallographic texture was characterized by four incomplete pole figures ( 0002 ) , { 10 1 ¯ 0 } , { 10 1 ¯ 1 } and { 10 1 ¯ 2 } measured by X-ray diffraction in a Philips X’Pert Pro MPD system equipped with a texture goniometer, a Cu Ka radiation source polycapillary optics. The MTEX toolbox [26] was used to correct background and defocusing and to calculate the orientation distribution function (ODF), where the selected kernel function was De la Vallee Poussin with a halfwidth equal to 10°. Recalculated PFs ( 0002 ) and { 10 1 ¯ 0 } are shown in Figure 2. In sheets of zinc, as with those of all the metals of hexagonal close-packed structure (HCP), the distribution of c-axis is strongly dependent on the c/a ratio. In the case of zinc—c/a = 1.856—this implies a high concentration of basal crystal directions tilted at 20–25° with respect to the sheet, normal in the plane defined by the rolling and the normal sheet directions. Additionally, a minor fiber of crystallites oriented with c-axis parallel to TD and 10 1 ¯ 0 parallel to RD can be observed in the ODF for φ 1 = 90 ° ,   Φ = 90 ° ,   φ 2 = 0 ° and 60 ° .

2.3. Tensile Tests

The tests were performed at room temperature and at a constant strain rate of 4 × 10⁻⁴ s−1 using an Instron 3382 universal testing machine. Displacement and strain were measured using digital image correlation (DIC) technique taking one image per second with a Nikon D3300 camera (Nikon (Thailand) Co., Ayutthaya, Thailand) with a Micro-Nikkor 85 mm f/3.5 G lens Image processing was performed using open-source code Ncorr v1.2 [27]. The following DIC parameters were adopted: subset radius: 50 pixels; spacing between subsets: 5 pixels; strain radius was adjusted to 8 pixels. Lankford coefficients ( r ) were determined over the gauge area from the yield point until the end, from longitudinal and transverse strain increment assuming constant volume. Figure 3 shows the experimental engineering stress–strain curves following the ISO 6892-1 standard specimen cut along RD, DD and TD. Highly anisotropic response in the flow stress levels and the max. elongation is in agreement with available reports in the literature [5]. The R-values or Lankford coefficients were 0.20, 0.27 and 0.47 at 0°, 45° and 90° to the rolling direction, respectively. These values were taken at 15% strain and no significant variation was found as strain increase [28,29].

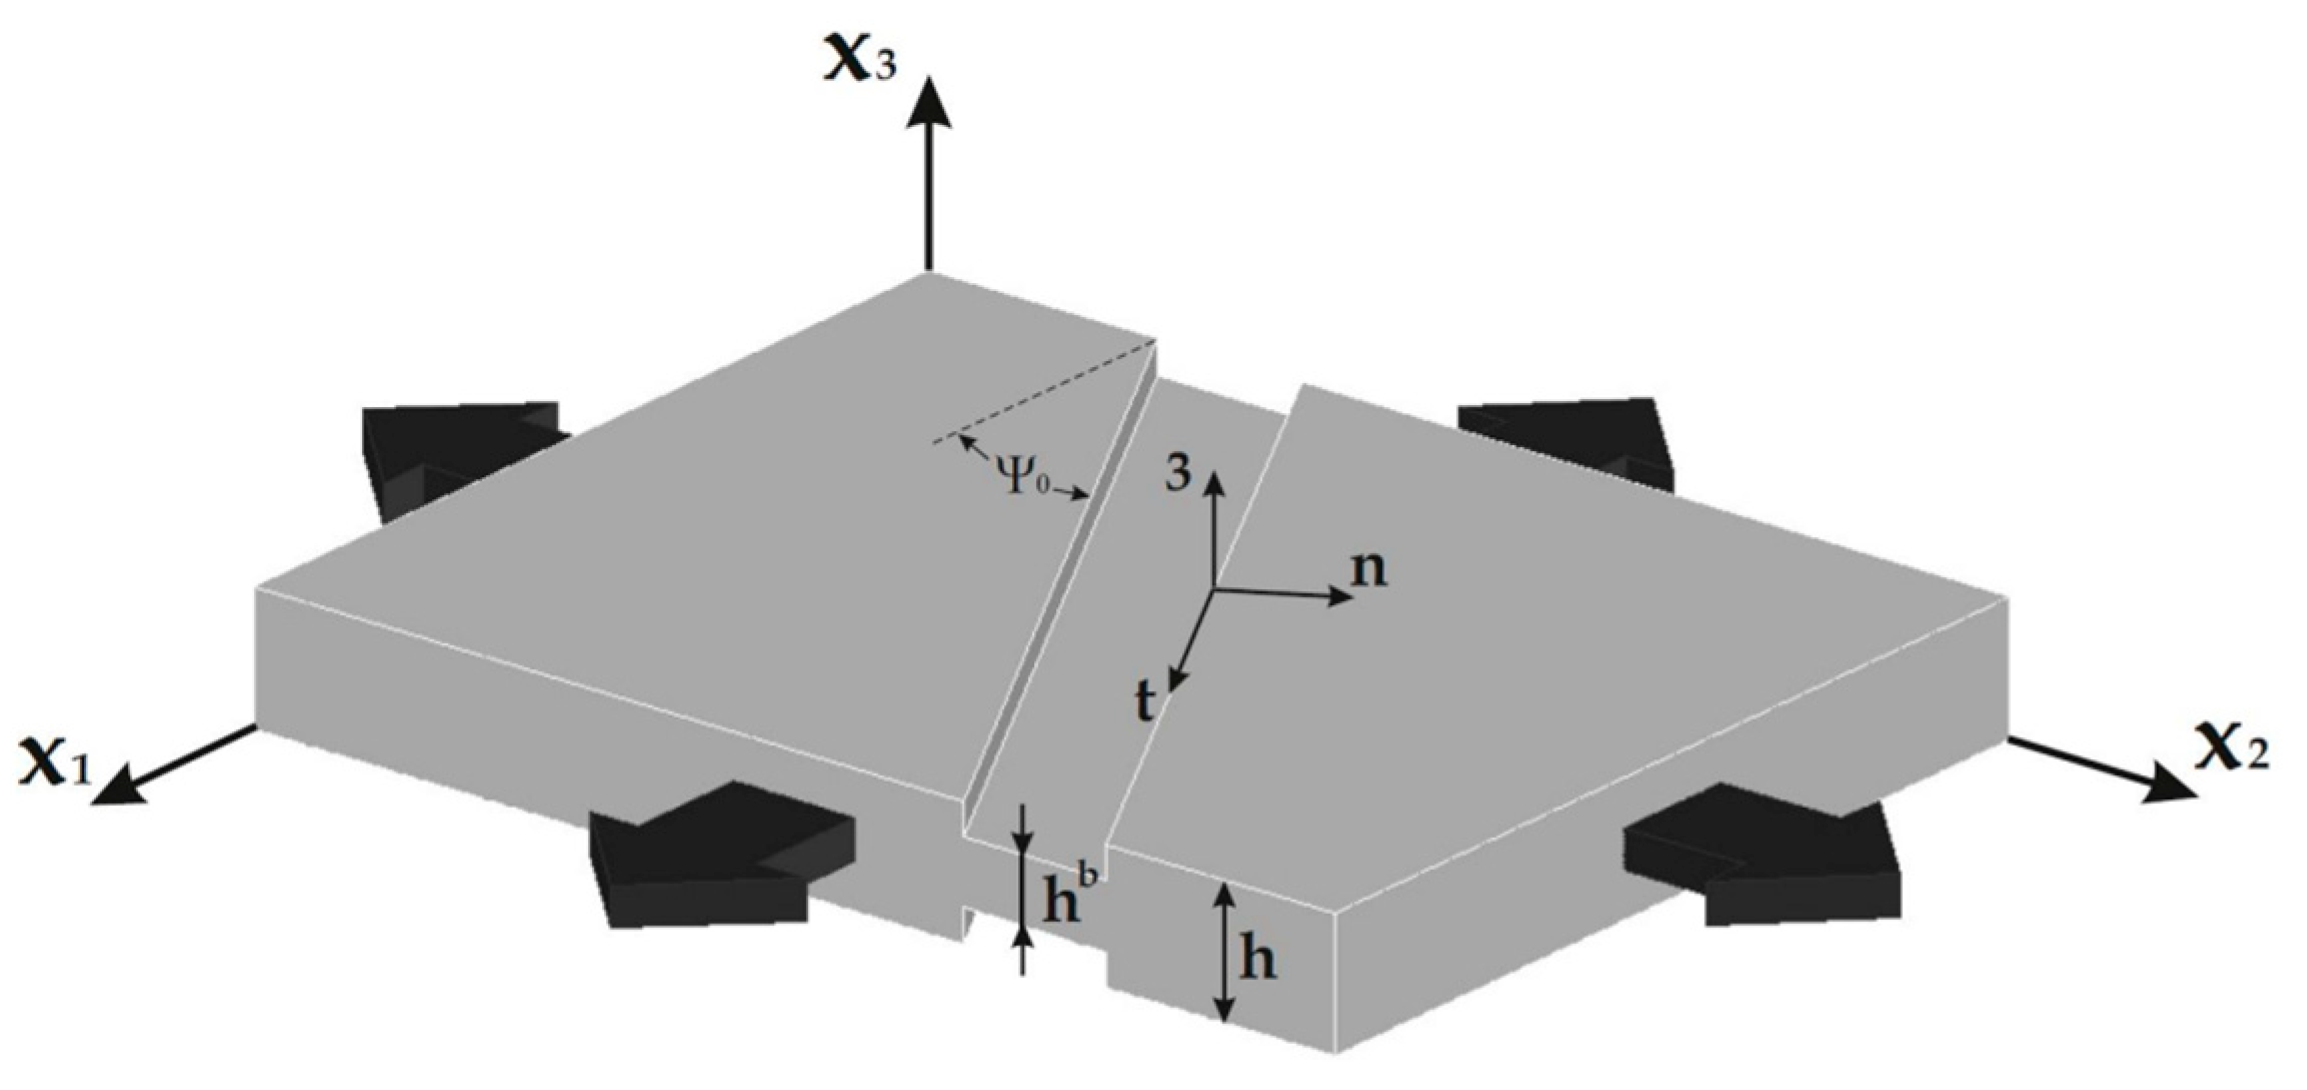
2.4. Forming Limit Diagram

Several strain paths, ranging from uniaxial tension (UAT) to balanced biaxial stretching (EBA) and including plane strain (PS), are necessary in order to properly characterize the FLC. These sets of proportional loadings are obtained using a miniature MK testing device [30] that considers an 80-mm-diameter specimen blank stretched through a 45-mm aperture by a 40-mm diameter × 5-mm shoulder-radius punch. Figure 4 shows the designed device (i.e., punch, die support and optical system), and specimen geometries used in the MK forming limit experiments to obtain the required loading paths in the strain space. The limit strains were evaluated using the classical Bragard-type technique assisted by DIC [31].
For all the experiments, the interface surfaces between the specimens and carrier blanks were sandblasted to maximize friction and the punch/carrier blank surface lubricated with a Molykote 321-R spray lubricant.

3. MK-VPSC Framework

The constitutive model used in this work is defined in the context of the MK-VPSC framework [17]. The material response, accounting for its anisotropy, is evaluated using a rate-dependent (VP) crystal plasticity self-consistent (SC) polycrystalline model [32,33] under an affine linearization assumption. The SC formulation allows each grain to deform differently, according to its directional properties and the strength of the interaction between the grain and its surroundings. In this sense, each grain is in turn considered to be an ellipsoidal inclusion surrounded by a homogeneous effective medium (HEM) that has the average properties of the polycrystal. The properties of the HEM are not known in advance because they result from an average of the individual grain behavior, once convergence is achieved. The material aggregate is represented by a set of orientations and volume fractions to reproduce the initial crystallographic texture.
The dislocation slip rates, γ ˙ s , are derived from the resolved shear stresses, τ s , using a viscoplastic exponential law
γ ˙ s = γ ˙ o s | τ s τ c s | 1 / n s g n ( τ s )
where τ c s is the critical resolved shear stress and γ ˙ o s is the reference strain rate. Assuming that plastic deformation arises from crystallographic (slip or twinning) systems, where geometry can be characterized by b s : the slip-plane direction or Burger’s vector, and n s : the slip-plane normal direction. The plastic velocity gradient tensor L p can be determined from the dislocation motion along these specific planes and directions in the crystal
L p = s γ ˙ s   b s n s
where γ ˙ s is the associated shear rate, which determines the crystal reorientation. The Schmid orientation tensor, defined as b s n s , has symmetric m s and skew-symmetric q s components given by
m s = 1 2 (   n s b s + b s n s )
q s = 1 2 (   n s b s b s n s )
Under a stress state, σ , plastic flow takes place on a given system if the resolved shear stress τ s ( τ s = m s   :   σ ) reaches a critical value, called the critical resolved shear stress (CRSS) τ c s . The evolution of the stress threshold with deformation allows to describe the hardening of each system as Δ τ s = d τ s d Γ   H s s Δ γ s , where H s s is described by an analytical function that can depend on the accumulated shear strain. Frequently, H adopts the form: H α β = q α β   h β (no sum on β ), where q α β is the interaction matrix that describes the self and latent hardening behavior. The d τ s d Γ factor can be evaluated from the extended Voce law [34] as
τ s = τ 0 s + ( τ 1 s + θ 1 s Γ ) ( 1 exp ( Γ | θ 0 s τ 1 s | ) )
where Γ is the accumulated shear strain in the grain, τ 0 s , τ 0 s + τ 1 s , θ 0 s and θ 1 s are the initial CRSS, the back extrapolated CRSS, the initial hardening rate and the asymptotic hardening rate of system s, respectively.
The overall behavior, macroscopic deviatoric stress s ¯ , deviatoric strain rate d ¯ and modulus M ¯ can be evaluated performing homogenization on a given linearized heterogeneous medium (see Lebensohn et al. [32] for details). As was previously mentioned, low-alloy zinc sheets can show an appreciable grain fragmentation process during deformation, even at room temperature [14]. Roatta et al. [23] proposed a simple and ad hoc additional reorientation term that coupled pairs of fragment orientations (Equation (5)); in this way the observed texture evolution of the Zn-Cu-Ti alloy sheet can better reproduce and mimic the effects of CDRX at the macroscopic level. The additional lattice rotation rate, due to this SRE effect, is given by
w i = W ¯ 1 N k = 1 N s q k   s γ ˙ k s + 1 N k = 1 N w ˜ k
where i ranges over the subset of neighboring orientations. In our simulations, N is limited to three. The other terms are the antisymmetric component of the macroscopic velocity gradient W ¯ , the plastic spin q s and the reorientation rate of the associated ellipsoidal inclusion w ˜ .
The VPSC-SRE formulation is implemented in conjunction with the well-known MK approach. MK techniques involve the equilibrium and compatibility conditions being fulfilled at the interface with the band, which is initially inclined at an angle Ψ 0 with respect to the principal axis (Figure 5). The integration of the MK-VPSC model follows the formulation described in Schwindt et al. [17] that developed a direct approach to evaluate the strain in the band zone, significantly reducing the CPU time and avoiding the need to solve Newton–Raphson at the level of the MK model.
The compatibility condition at the band interface is given in terms of the differences between the velocity gradients L ¯ ,   L ¯ b inside and outside the band respectively
L ¯ b = L ¯ + c ˙ n
Equation (6) is decomposed into the symmetric D ¯ and screw-symmetric W ¯ parts
D ¯ b = D ¯ + 1 2 ( c ˙ n + n c ˙ )  
W ¯ b = W ¯ + 1 2 ( c ˙ n n c ˙ )
Here, n is the unit normal to the band, and c ˙ is a vector to be determined. The equilibrium conditions required at the band interface are given by
W ¯ b = W ¯ + 1 2 ( c ˙ n n c ˙ )
where σ ¯ denotes the Cauchy stress. Noting that δ ij is the Kronecker symbol, the boundary condition σ ¯ 33 = 0 (i.e., σ ¯ i j = s ¯ i j s ¯ 33 δ i j ,   i = 1 , 2 , 3 ) is applied.
The main feature of the implementation of the direct approach is briefly described below; numerical aspects are detailed in [17]. Starting from Equation (6), it is possible to relate the band L ¯ b to L ¯ , assuming that L ¯ is constant for a small deformation increment, and expressing L ¯ b in a reference system associated with the band, tensors take the following form
L ¯ [ b ] b = [ L ¯ n n b L ¯ n t b 0 L ¯ t n b L ¯ t t b 0 0 0 L ¯ 33 b ] = [ D ¯ n n b D ¯ n t b + W ¯ n t b 0 D ¯ n t b W ¯ n t b D ¯ t t b 0 0 0 D ¯ 33 b ]
Assuming that the material is incompressible, D ¯ [ b ] 33 b = D ¯ [ b ] n n b D ¯ [ b ] t t b = D ¯ 11 b D ¯ 22 b , consequently, Equation (9) holds that
σ ¯ [ b ] n n b h b = σ ¯ [ b ] n n h σ ¯ [ b ] n t b h b = σ ¯ [ b ] n t h σ ¯ [ b ] n n b = 1 f σ ¯ [ b ] n n σ ¯ [ b ] n t b = 1 f σ ¯ [ b ] n t
where f is the so-called imperfection factor. This enable that once the strain rate and stress are determined for the homogenous zone, the corresponding mechanical state of the band is determined
L ¯ [ b ] b = [ L ¯ n n b L ¯ n t b 0 L ¯ t n b L ¯ t t b 0 0 0 L ¯ 33 b ] , σ ¯ [ b ] b = [ 1 f   σ ¯ n n b 1 f   σ ¯ n t b 0 σ ¯ t t b 0 s y m . 0 ]
This procedure allows decoupling of the two MK zones and implementation of the MK technique in an efficient and robust way, and each band calculation to be computed as an image of a vector of coarrays in modern Fortran (F2003). This formulation was implemented in an in-house MK-VPSC code. The reader can find algorithmic details in [17].

4. Results and Discussion

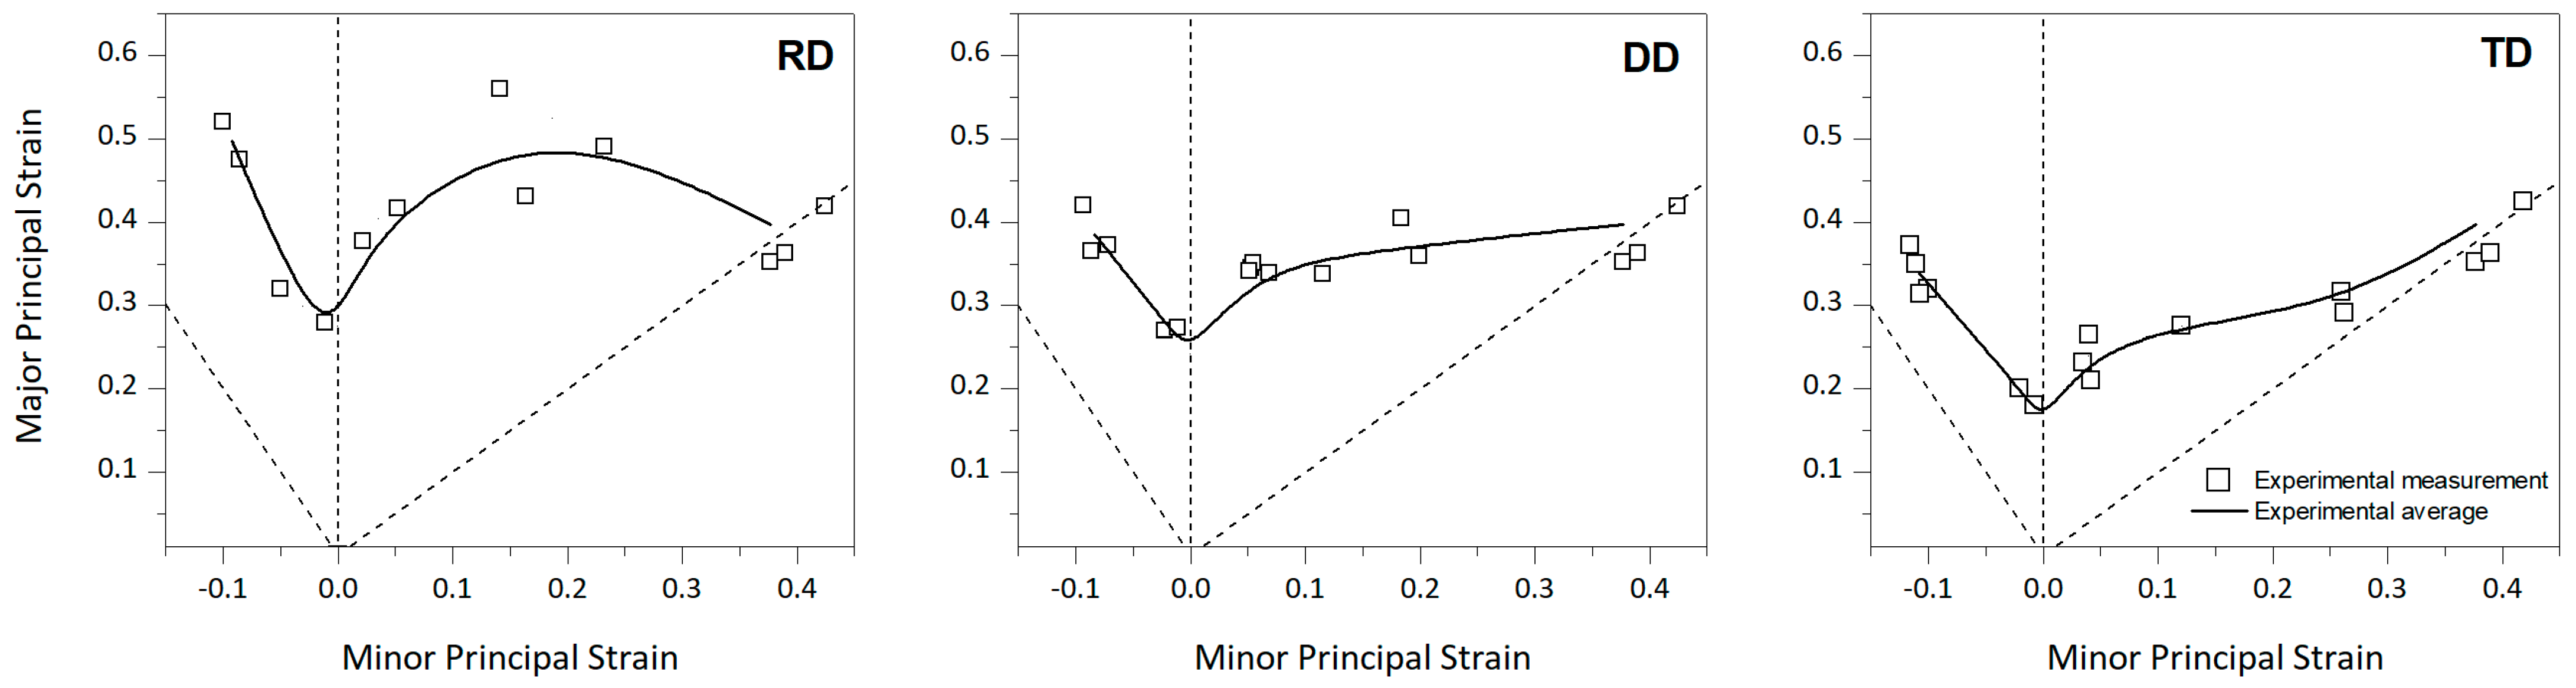
4.1. Proportional Strain Paths

Figure 6 shows that the stress anisotropy observed in the tensile tests is also present in the FLDs. The FLC evaluation process involved three samples per each testing direction ( ρ = U A T , ρ ~ 0 , 0 < ρ < 1 ); an exception was the balanced biaxial strain path, which is common. In addition, the dispersion observed in the measurements is within the standard for this type of measurement [7]. As expected, the lowest strain level is observed in the F L D T D with a minimum in the plane strain. Similar limit-strain values were found in previous works [4,6]. The sheet forming capacity is higher for the F L D R D , while intermediate values are observed for specimens cut along F L D D D and less for F L D T D specimens. In particular, the uniaxial and intermediate loading paths ( ρ ~ 0.5 ) maximize the deformation (true strain) of the sheet in the RD ( ε I = 0.50 and ε I = 0.48 , respectively), while for the DD and TD, the major strain increases monotonically from PS to EBA.
In order to complete the material characterization, the crystallographic textures after UAT tests along the RD, DD and TD were measured at strain levels of 0.30, 0.24 and 0.19, respectively (Figure 7). The samples were extracted from a homogeneous strain zone as close as possible to the necking domain. The ( 0002 ) fiber intensity increases for UAT-RD and UAT-DD, while in the UAT-TD case this is less marked as a consequence of the uniaxial deformation. Similar changes in the relative intensities were reported in [35]. According to Roatta et al. [23], the main texture component oriented initially in the plane ND-TD at Φ = 22.5 ° changes to Φ = 18 ° for the RD sample. In the first case, the fiber also displays a higher concentration of orientations next to φ 2 = 0 ° and 60°, showing that the prismatic planes’ normal tends to align with the TD. However, in the TD’s case, this preferential distribution with respect to φ 2 is not observed, while the DD case shows an intermediate behavior. Moreover, crystals with the c-axes normal to the ND are clearly in a non-stable orientation and they move away from the beginning of the deformation.
Figure 8 shows the crystallographic texture of the zinc sheets at the end of the first stage of uniaxial stretching. As is mentioned above, the basal poles tend to rotate to the ND direction and increase the intensity. Comparing this ( 0002 ) pole figure with those in Figure 7, it is observed that reorientation of the basal poles takes place in a more pronounced way at the beginning of the deformation (<~10%) and tends to stabilize the maximum position. Changes only appear when looking at the texture’s intensity.

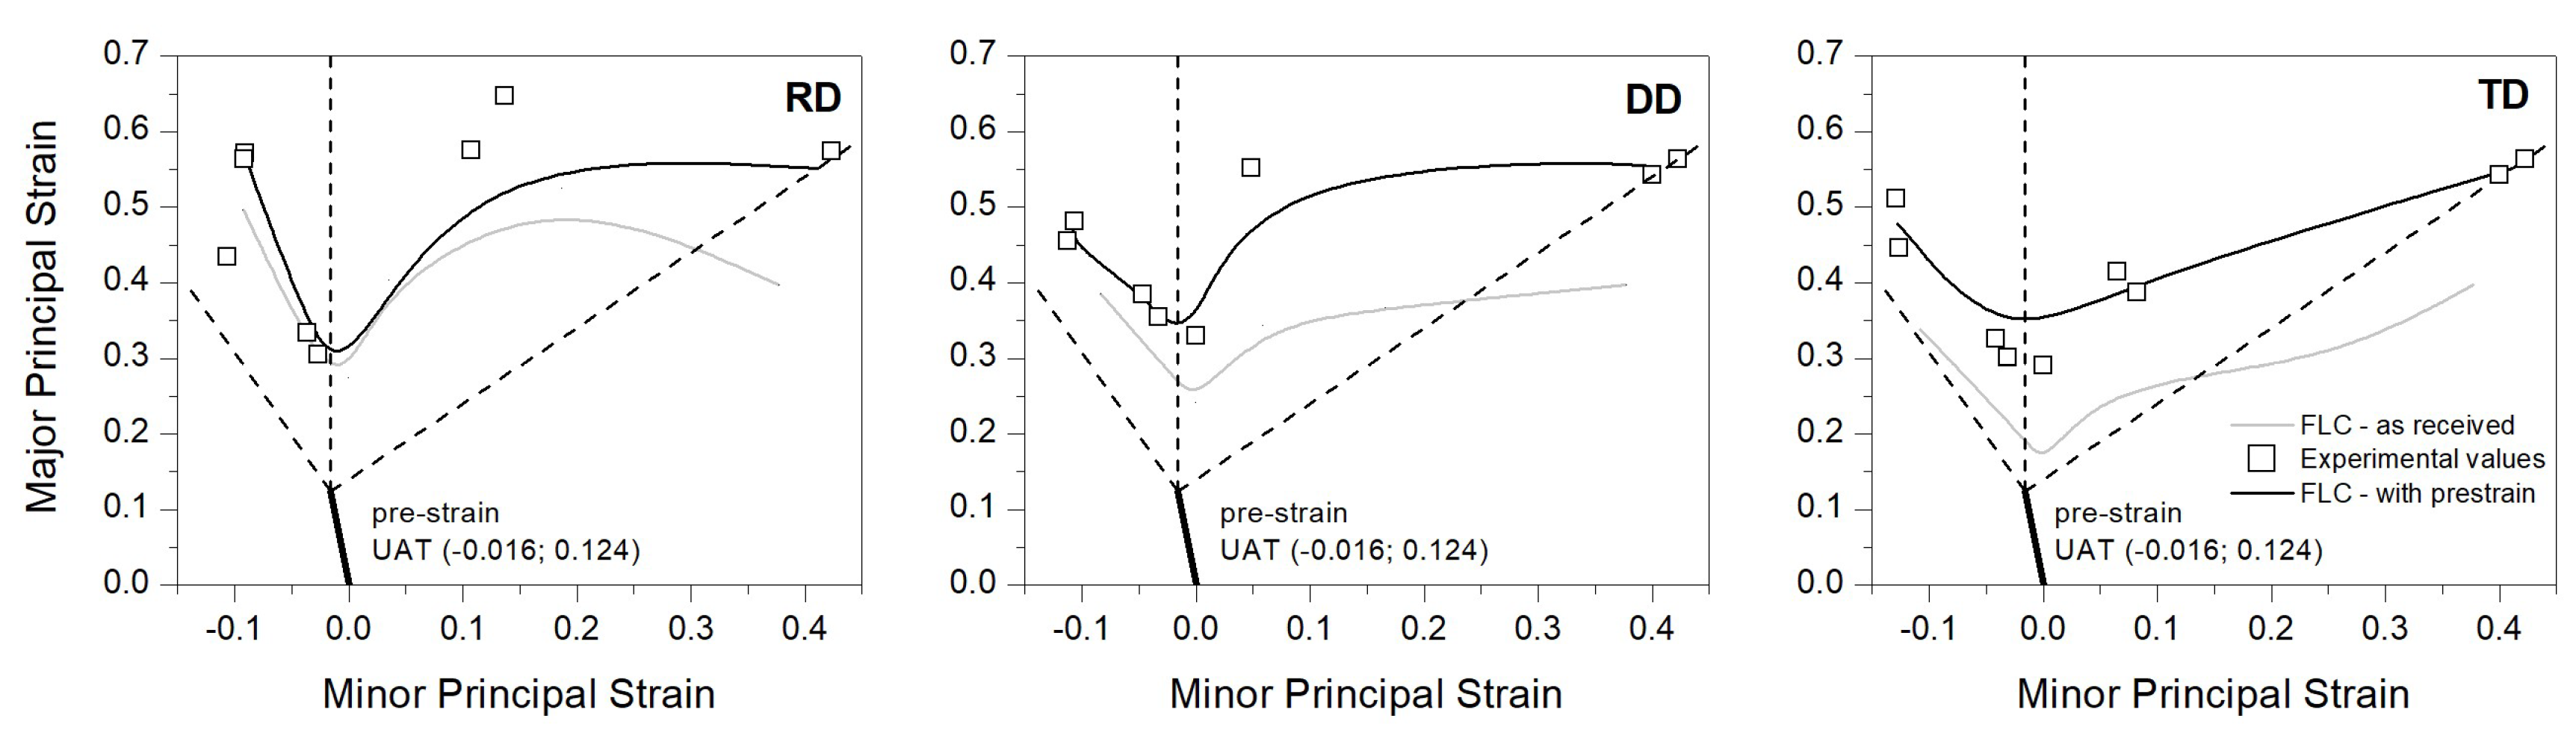
4.2. Effect of an Initial UAT Prestrain along RD on the FLDs

The influence of a prestrain on the formability of the material, and the initial uniaxial extension tests along the RD up to an average deformation of ~0.12 were realized. For this, a non-standard sample (140 × 85 mm2), to be large enough for FLD samples to be cut from it, was designed (Figure 9). Several tests were performed since no more than two samples per test with acceptable strain homogeneity could be drawn.
Figure 10 shows the forming limit values for the Zn-Cu-Ti samples subjected to a previous UAT prestrain along the RD. In order to compare with the corresponding standard FLDs (Figure 6), the measurement limit-strain values were superimposed to the average uniaxial strain first loading. The gray lines indicate the FLC of the material without prestrain. It is clear that the effects of a relatively small imposed prestrain is enough to introduce a non-negligible variation in the limit-strain values, particularly when the principal axis is not aligned with the principal axes of anisotropy ( F L D D D and F L D T D ). For the left-hand side of the FLD, the samples along the RD display the smaller differences between both loading situations; however, this gap is more appreciable for the DD case and maximizes up to a gain of no less than 0.1 for the TD. In this last case, the FLD profile is close, and only the expected shift due to the prestrain is observed. In addition, for the right-hand side of the FLC, all the curves show a relatively more uniform behavior when a UAT prestrain along the RD is imposed. This observation is not valid for the prestrained RD samples under loading paths close to the plane strain condition. Unfortunately, it was not possible for us to have valid samples for the F L D D D case with 0.5 < ρ < 1 . For many sheet-forming operations, the limit-strain value near the plane-strain condition is the minimum limit-strain value ( F L D o ); after the prestrain, it is observed that the variation in the F L D o between the RD, DD and TD cases is significantly reduced, and the limit-strain under the PS condition is less affected for the misalignment of the axes of anisotropy.
An important point to keep in mind when comparing limit-strain values between samples with and without prestrain is that the initial thickness is not the same. Consequently, particular attention is paid to quantify the influence of the sample thickness on the limit-strain values in the second stage. A series of tests reducing the initial thickness by mechanical polishing were carried out to delimit the influence of the initial thickness on the limit strain, where it was noticed that the major limit strain is approximately 8% less in uniaxial tension (Figure 11). Although this value is not negligible and the tendency is clear, it is in the range of scattering in rolled zinc formability [7].
The measured textures after the two-stage tests along the RD, DD and TD are shown in Figure 12. As expected, the sample strained along the RD displays a more intense texture component at the stable principal fiber and the components with the c-axis in the plane of the sheet disappear. For the prestrained samples UAT-DD and UAT-TD, the principal component is also present with less intensity than the RD case, but a minor component is still observed with the c-axis perpendicular to the ND. In particular, after UAT-TD, these orientations have their c-axes parallel to the loading axes (local maxima at Φ = 90 ° ,   φ 2 = 0 ° and 60 ° in φ 1 = 90 ° ODF sections, see Figure 12).

4.3. Model Calibration

In the VPSC model, the accommodation of the plastic deformation depends essentially on the CRSS ratios of the potentially active modes and the assumed rate-sensitivity coefficient (m = 1/n, Equation (1)). Absolute CRSS values for deformation on pure and alloy zinc have been studied in several works. Though many values from the literature data are very scattered, Parisot et. al. [36] highlighted that the CRSS of the basal system depends significantly on the alloying content and is higher than that of pure zinc. The basal a   { 0001 } 12 1 ¯ 0 , second-order pyramidal-II p y I I c + a   { 11 2 ¯ 2 } 11 2 ¯ 3 and prismatic p r a   { 10 1 ¯ 0 } 12 1 ¯ 0 slip systems are considered potentially active modes with CRSS ratios varying between 2 τ c r s s P y I I / τ c r s s B a 48 and 10 τ c r s s P r / τ c r s s B a 106 [18,22,23,36,37,38]. Additionally, Zhang et al. [37] considered the presence of compressive twinning CTW { 10 1 ¯ 2 } 10 1 ¯ 1 with a ratio τ c r s s C T W / τ c r s s B a = 30 , and the same relation was used by Roatta et al. [23] with the addition of short-range effects (SRE) to mimic CDRX by enforcing the continuity of the lattice rotation field between pairs of randomly chosen orientations.
In the present work, the four potentially active modes and the SRE model were considered; the m coefficient was set to 0.1, equal for all deformation modes. An inclusion aspect ratio of 3-1-0.3 was assumed, resembling that used by Schwindt et al. [18]. It is noted that this aspect ratio does not represent, as it is often assumed, the aspect ratio of the topological grain, but rather captures the effect of the directionality induced by the presence of the intermetallic compound preferentially aligned with the RD. The model calibration was performed using affine linearization by fitting the UAT response along the three loading directions RD, DD and TD. The best fitted Voce parameters are shown in Table 1.
Figure 13 compares the experimental and calibrated results for the stress–strain curves in the three analyzed directions.
A good agreement is obtained that captures the stress anisotropy of the material in the range of homogeneous deformation. To this end, the initial texture was described by a set of discrete orientations (10,000) that ensures a good balance between texture accuracy and computational cost as can be seen in Figure 14.

4.4. MK-VPSC-SRE Predictions under Proportional Strain Path

Afterward, in order to increase the levels of confidence, pole figures and ODF sections evaluated at levels of 0.30, 0.24 and 0.19 strain for UAT-RD, UAT-DD and UAT-TD, respectively, were compared with the experimental measurements. The predicted ( 0002 ) and { 10 1 ¯ 0 } poles figures, together with the two Euler φ 1 -sections of the ODF are shown in Figure 15. The simulated textures capture the changes in the intensity of the basal orientations, increasing after UAT along the RD and DD, and a drop for the TD case, as can be seen in Figure 15. It can also be noted that in the ODF section, a good agreement is obtained when reproducing the texture evolution. For the UAT-RD sample, it can be observed that there is an increase in the intensities of basal poles in the neighborhood of ( φ 1 = 0 ° , Φ = 18 ° , φ 2 = 0 °   and   60 ° ), reproducing the rotation of crystallites around the c-axis as well as the presence of a minor component of orientations near to ( φ 1 = 0 ° , Φ = 85 ° , φ 2 = 30 ° ) as in the experimental case. Additionally, the presence of crystallites with the c-axis parallel to the ND is predicted by the simulation. The UAT-DD and UAT-TD cases develop similar behaviors with a wider basal fiber due principally to a lower level of accumulated strain.
The MK imperfection factor f 0 was adjusted to 0.988 such that the predicted limit strains matched the minimum experimental limit strain near PS for the sample oriented along the RD. As was mentioned above, the Zn-Cu-Ti sheet anisotropy coefficients are << 1; in consequence, the ranges of the F L D ρ strain paths (i.e., [ ρ UAT ;   ρ = 1 ] ) vary according to the angle between the principal deformation axis with the axis of anisotropy. The ρ UAT values were selected to reproduce strain paths from the experimental values ( ρ RD 0.17 , ρ DD 0.21 ,   ρ TD 0.32 ). Simulations were performed applying L 12 = 0 as the boundary conditions. For the F L D R D and F L D T D cases, the condition L 12 = 0 automatically results in a null shear stress, σ ¯ 12 = 0 , and vice versa by a symmetry consideration. In the case of F L D D D , we first performed simulations using both boundary conditions, and after verifying that only very minor differences were found; only simulations carried out with L 12 = 0 are presented. From the comparison of the experimental and the simulated FLCs, we can notice a global agreement between both (Figure 16). Nevertheless, some remarks can be made, which depend on the particular loading path and the angle of orthotropy. The predicted limit strains for UAT capture the effect of crystallographic texture in the formability behavior, i.e., ε I R D > ε I D D > ε I T D , although the absolute values are slightly under-predicted for the RD and DD cases. Major and quality differences appear in the right-hand side of the FLDs, in particular, close to the EBA in the F L D R D , where a sudden drop is predicted and not observed in the present measurements. This under-estimation of the limit strains at the EBA loading condition is also found for the other cases. For loading paths from PS until biaxial stretching with a relation of ρ < ~ 0.5 , the predicted limit-strain values show good correlation with the experimental data. On the other hand, the inclusion of the CDRX phenomenon through the SRE model was not as expected. The strain-limit values change only a few percent when fragmentation caused by the CRDX phenomenon is considered.

4.5. MK-VPSC-SRE Predictions under Non-Proportional Strain Path

Following the same calculation methodology and procedure described above, the three FLDs were simulated after a previous UAT of 0.12. Figure 17 shows the comparison of the experimental and predicted F L D R D , F L D D D and F L D T D , respectively. In general, the same trends discussed in the previous section are valid for these limit-strain results. Again, in the F L D R D in the biaxial stretching zone, the drop in the predicted limit strains is present; however, the behavior seems to be smoother in comparison with that reported in Figure 16. The dependence of the simulated FLD o value with the orientation test is significantly reduced, and the limit strain under the plane-strain condition is between 0.37 and 0.33. The simulations reproduced the increase in the major principal strain for FLD with uniaxial prestrain; in particular, for samples with both stages of deformation on RD orientation. This last observation was not noted in predictions on magnesium [15]. The solid line represents the average of the reported limit-strain measurements (Figure 10).
Finally, the crystallography textures predicted for the bilinear strain paths along the uniaxial tension paths are shown in Figure 18. The ( 0002 ) and { 10 1 ¯ 0 } pole figures and ODF sections show good agreement with the experimental measurements. However, the intensities seem to find a stable value below the reported value. Although the initial discretization process of the ODF in our case decreases the maximum intensity by 20%, this would not be enough to explain the difference. The constraint imposed on the SRE model that holds the misorientation constant between pairs of orientations is probably too restrictive, especially when the texture development is close to its point of stability
In summary, the proposed MK-VPSC-SRE model that includes the SRE to mimic the effect of subgrain formation, allows us to account for the influence of CDRX in the intensity of the developed texture, while showing a limitation in the prediction of the limit strains in the right-hand side of the FLD. However, the model to account for subgrain formation requires further development. These improvements are in progress and will be reported elsewhere.

5. Conclusions

The formability of the Zn-Cu-Ti alloy sheet has been studied numerically and experimentally. The limit-strain profile shows substantial changes when it is evaluated from specimens cut along the RD, DD or TD directions. The limit-strain values are higher for the F L D R D , while intermediate values are observed for the F L D D D and lower for the F L D T D ; this is shown in accordance with the strain levels observed on strain–tension curves. A relatively small uniaxial strain along the RD is enough to introduce a non-negligible change in the forming limit behavior in the Zn-Cu-Ti sheets. The F L D R D and F L D D D show a more relative uniform behavior under biaxial stretching, while for the F L D T D , the limit strain increases monotonically from PS to EBA. In particular, it is observed that a tension prestrain reduces the anisotropic behavior for the PS strain path.
MK-VPSC-SRE simulation predicts that the differences between the simulated F L D o are significantly reduced, and the limit strain under the plane-strain condition is less affected for the misalignment of the axes of anisotropy, while showing a limitation in the prediction of the limit strains in the right-hand side of the FLD. The proposed VPSC-SRE model can reproduce the texture evolution and macroscopic behavior of the Zn-Cu-Ti alloy sheet under UAT. The validation of the model at deformations greater than those previously reported allows us to show the limitations of the VPSC-SRE approach. The limitation of the ad hoc SRE model is observed in not being able to avoid the division of the basal poles when the material is tested at strains close to 0.4 under UAT (i.e., a UAT prestrain along the RD plus an extension along the TD). In the same way, the simulated crystallographic texture evolution was validated for a completed set of texture measurements obtained from all tested specimens under the UAT condition. The VPSC-SRE fails to predict the slow increase in texture enhancement, finding a stable value below that reported experimentally. As a final remark, additional experiments should be conducted in order to particularly analyze the right-hand side of the FLD, in particular, close to the EBA, including the flow stress characterization. A systematic study of this is in progress and will be reported in the near future.

Author Contributions

E.A.N., experimental tests, numerical simulations, analysis of results and writing—original draft. L.P.M., modifications to the MK-VPSC code, A.R. and J.W.S., supervision, analysis of results, writing—original draft and funding acquisition. D.J.C., writing—review and editing. All authors have read and agreed to the published version of the manuscript.

Funding

This work was financially supported by the CONICET, PIP–CONICET 1964.

Institutional Review Board Statement

Not applicable.

Informed Consent Statement

Not applicable.

Data Availability Statement

Any requirement about the data of this research must be consulted directly to the corresponding author.

Conflicts of Interest

Authors declare that they have no known competing financial interest or personal relationship that could have appeared to influence the work reported in this paper.

References

  1. Porter, F. Zinc Handbook: Properties Processing and Use in Design Mechanical Engineering, 1st ed.; Marcel Dekker, Inc.: New York, NY, USA, 1991; pp. 36–76. [Google Scholar]
  2. Gilles, G.; Hammami, W.; Libertiaux, V.; Cazacu, O.; Yoon, J.H.; Kuwabara, T.; Habraken, A.M.; Duchêne, L. Experimental characterization and elastoplastic modeling of the quasi-static mechanical response of TA-6 v at room temperature. Int. J. Solid. Struct. 2011, 48, 1277–1289. [Google Scholar] [CrossRef]
  3. Barros, P.D.; Alves, J.L.; Oliveira, M.C.; Menezes, L.F. Modeling of tension-compression asymmetry and orthotropy on metallic materials: Numerical implementation and validation. Int. J. Mech. Sci. 2016, 114, 217–232. [Google Scholar] [CrossRef]
  4. Jansen, Y.; Logé, R.E.; Milesi, M.; Massoni, E. An anisotropic stress based criterion to predict the formability and the fracture mechanism of textured zinc sheets. J. Mater. Process. Technol. 2013, 213, 851–855. [Google Scholar] [CrossRef]
  5. Milesi, M.; Loge, R.; Jansen, Y. Anisotropic mechanical behavior and formability criterion for zinc sheets. J. Mater. Process. Technol. 2014, 214, 2869–2876. [Google Scholar] [CrossRef]
  6. Schlosser, F.; Signorelli, J.; Leonard, M.; Roatta, A.; Milesi, M.; Bozzolo, N. Influence of the strain path changes on the formability of a zinc sheet. J. Mater. Process. Technol. 2019, 271, 101–110. [Google Scholar] [CrossRef]
  7. Milesi, M.; Logé, R.E.; Pino Muñoz, D.; Jansen, Y.; Bouchard, P.O. Accounting for material parameters scattering in rolled zinc formability. J. Mater. Process. Technol. 2017, 245, 134–148. [Google Scholar] [CrossRef]
  8. Graf, A.; Hosford, W. Effect of Changing Strain Paths on Forming Limit Diagrams of AI 2008-T4. Metall. Mater. Trans. 1993, A24, 2503–2512. [Google Scholar] [CrossRef]
  9. Dhara, S.; Basak, S.; Panda, S.K.; Hazra, S.; Shollock, B.; Dashwood, R. Formability analysis of pre-strained AA5754-O sheet metal using Yld96 plasticity theory: Role of amount and direction of uni-axial pre-strain. J. Manuf. Process. 2016, 24, 270–282. [Google Scholar]
  10. Laukonis, J.V.; Ghosh, A.K. Effects of strain path changes on the formability of sheet metals. Metall Mater Trans. 1978, A9, 1849–1856. [Google Scholar] [CrossRef]
  11. Abedini, A.; Butcher, C.; Worswick, M.J. Experimental fracture characterisation of an anisotropic magnesium alloy sheet in proportional and non-proportional loading conditions. Int. J. Solids Struct. 2018, 144–145, 1–19. [Google Scholar] [CrossRef]
  12. Borodachenkova, M.; Wen, W.; Barlat, F.; Pereira, A.; Grácio, J. Modeling of the mechanical behavior and texture evolution in Zn alloys during reverse shear loading. J. Mater. Process. Technol. 2015, 224, 143–148. [Google Scholar] [CrossRef]
  13. Muñoz, J.A.; Nicoletti, E.; Signorelli, J.W.; Stout, M.G.; Avalos, M.; Bolmaro, R.E. Effect of microstructural heterogeneity on the balanced-biaxial and tensile behavior of a Zn alloy sheet. Mater. Today Commun. 2022, 30, 103126. [Google Scholar] [CrossRef]
  14. Leonard, M.; Moussa, C.; Roatta, A.; Seret, A.; Signorelli, J.W. Continuous dynamic recrystallization in a Zn–Cu–Ti sheet subjected to bilinear tensile strain. Mater. Sci. Eng. A 2020, 789, 139689. [Google Scholar] [CrossRef]
  15. Signorelli, J.W.; Bertinetti, M.; Roatta, A. A review of recent investigations using the marciniak-kuczynski technique in conjunction with crystal plasticity models. J. Mater. Process. Technol. 2021, 287, 116517. [Google Scholar] [CrossRef]
  16. Yang, M.; Dong, X.; Zhou, R.; Cao, J. Crystal plasticity-based forming limit prediction for FCC materials under non-proportional strain-path. Mater. Sci. Eng. A 2010, 527, 6607–6613. [Google Scholar] [CrossRef]
  17. Kuroda, M.; Tvergaard, V. Forming limit diagrams for anisotropic metal sheets with different yield criteria. Int. J. Solids Struct. 2000, 7, 5037–5059. [Google Scholar] [CrossRef]
  18. Schwindt, C.; Schlosser, F.; Bertinetti, M.; Stout, M.; Signorelli, J. Experimental and Visco-Plastic Self-Consistent evaluation of forming limit diagrams for anisotropic sheet metals: An efficient and robust implementation of the M-K model. Int. J. Plast. 2015, 73, 62–99. [Google Scholar] [CrossRef]
  19. Philippe, M.J.; Wagner, F.; Mellab, F.E.; Esling, C.; Wegria, J. Modelling of texture evolution for materials of hexagonal symmetry–I. Application to Zn alloys. Acta Metall. Mater. 1994, 42, 239–250. [Google Scholar] [CrossRef]
  20. Philippe, M.J.; Fundenberger, J.J.; Galledou, Y.; Humbert, M.; Wegria, J.; Esling, C. Influence of texture on low temperature bendability of Zn alloys. Textures Microstruct. 1991, 14, 471–476. [Google Scholar] [CrossRef]
  21. Fundenberger, J.J.; Philippe, M.J.; Wagner, F.; Esling, C. Modelling and prediction of mechanical properties for materials with hexagonal symmetry (Zn, Ti and Zr alloys). Acta Mater. 1997, 45, 4041–4055. [Google Scholar] [CrossRef]
  22. Cauvin, L.; Raghavan, B.; Bouvier, S.; Wang, X.; Meraghni, F. Multi-scale investigation of highly anisotropic Zinc alloys using crystal plasticity and inverse analysis. Mater. Sci. Eng. A 2018, 729, 106–118. [Google Scholar] [CrossRef]
  23. Roatta, A.; Leonard, M.; Nicoletti, E.; Signorelli, J.W. Modeling texture evolution during monotonic loading of Zn-Cu-Ti alloy sheet using the viscoplastic self-consistent polycrystal model. J. Alloys Compd. 2021, 860, 158425. [Google Scholar] [CrossRef]
  24. Chen, X.; Jeitschko, X.; Danebrock, M.E.; Evers, C.B.H.; Wagner, K. Preparation, properties, and crystal structures of Ti3Zn22 and TiZn16. J. Solid State Chem. 1995, 118, 219–226. [Google Scholar] [CrossRef]
  25. Muster, T.H.; Ganther, W.D.; Cole, I.S. The influence of microstructure on surface phenomena: Rolled zinc. Corros. Sci. 2007, 49, 2037–2058. [Google Scholar] [CrossRef]
  26. Bachmann, F.; Hielscher, R.; Schaeben, H. Texture Analysis with MTEX—Free and Open Source Software Toolbox. Solid State Phenom. 2010, 160, 63–68. [Google Scholar] [CrossRef]
  27. Blaber, J.; Adair, B.; Antoniou, A. Ncorr: Open-Source 2D Digital Image Correlation Matlab Software. Exp. Mech. 2015, 55, 1105–1122. [Google Scholar] [CrossRef]
  28. Leonard, M.; Nicoletti, E.; Roatta, A.; Stout, M.; Bolmaro, R.; Signorelli, J. Study of zinc-sheet mechanical anisotropy and its relationship to crystallographic texture. Rev. Latinoam. Metal. Mater. 2019, 8, 43–47. [Google Scholar]
  29. Alister, F.; Celentano, D.; Nicoletti, E.; Signorelli, J.; Bouchard, P.-O.; Pino, D.; Pradille, M.; Cruchaga, M. Elastoplastic characterization of Zn-Cu-Ti alloy sheets: Experiments, modeling and simulation. J. Mater. Eng. Perform. 2022, 31, 512–1529. [Google Scholar] [CrossRef]
  30. Leonard, M.E.; Ugo, F.; Stout, M.; Signorelli, J.W. A miniaturized device for the measurement of sheet-metal formability using digital image correlation. Rev. Sci. Instrum. 2018, 89, 85114. [Google Scholar] [CrossRef]
  31. Bertinetti, M.; Roatta, A.; Nicoletti, E.; Leonard, M.; Stout, M.; Signorelli, J.W. How Strain-Rate Sensitivity Creates Two Forming Limit Diagrams: Bragard-Type versus Instability-Strain, Correlation-Coefficient Based Temporal Curves. J. Mater. Eng. Perform. 2021, 30, 4183–4193. [Google Scholar] [CrossRef]
  32. Lebensohn, R.A.; Tomé, C.N. A self-consistent anisotropic approach for the simulation of plastic deformation and texture development of polycrystals: Application to zirconium alloys. Acta Metall. Mater. 1993, 41, 2611–2624. [Google Scholar] [CrossRef]
  33. Lebensohn, R.A.; Castañeda, P.P.; Brenner, R.; Castelnau, O. Full-Field vs. Homogenization Methods to Predict Microstructure–Property Relations for Polycrystalline Materials. Comput. Methods Microstruct. Relatsh. 2011, 393–441. [Google Scholar]
  34. Tomé, C.; Canova, G.R.; Kocks, U.F.; Christodoulou, N.; Jonas, J.J. The relation between macroscopic and microscopic strain hardening in f.c.c. polycrystals. Acta Metall. 1984, 32, 1637–1653. [Google Scholar] [CrossRef]
  35. Schlosser, F.; Schwindt, C.; Fuster, V.; Tommasi, A.; Signorelli, J.W. Crystallographic Texture evolution of a zinc sheet subjected to different strain paths. Metall. Mater. Trans. A Phys. Metall. Mater. Sci. 2017, 48, 2858–2867. [Google Scholar] [CrossRef]
  36. Parisot, R.; Forest, S.; Gourgues, A.-F.; Pineau, A.; Mareuse, D. Modeling the mechanical behavior of a multicrystalline zinc coating on a hot-dip galvanized steel sheet. Comput. Mater. Sci. 2000, 19, 189–204. [Google Scholar] [CrossRef]
  37. Zhang, F.; Vincent, G.; Sha, Y.H.; Zuo, L.; Fundenberger, J.J.; Esling, C. Experimental and simulation textures in an asymmetrically rolled zinc alloy sheet. Scripta Mater. 2004, 50, 1011–1015. [Google Scholar] [CrossRef]
  38. Solas, D.; Tomé, C.N.; Engler, O.; Wenk, H.R. Deformation and recrystallization of hexagonal metals: Modeling and experimental results for zinc. Acta Mater. 2001, 49, 3791–3801. [Google Scholar] [CrossRef]
Figure 1. (a) Optical micrographs of the RD-TD plane of the sheet, with RD aligned vertically; (b) inverse pole figure map parallel to the transverse direction Adapted from [13].
Metals 12 01095 g001
Figure 2. Recalculated pole figures for the Zn-Cu-Ti zinc sheet in the as-received condition and orientation distribution function (ODF) sections at φ 1   = 0° and φ 1   = 90°. RD and TD are aligned with y-axis and x-axis, respectively. The crystal reference system associated with the HCP structure was composed of the three crystal directions: [ 10 1 ¯ 0 ] //x, [ 1 ¯ 2 1 ¯ 0 ] //y, [ 0001 ] //z; and the orientations are represented in the Euler space ( φ 1 , Φ , φ 2 ).
Metals 12 01095 g002
Figure 3. Measured average engineering stress–strain curves in uniaxial tension along RD, DD and TD.
Metals 12 01095 g003
Figure 4. Assembly drawing of the punch, die support, optical system and specimen geometries used in the MK forming limit experiments.
Metals 12 01095 g004
Figure 5. MK geometry.
Metals 12 01095 g005
Figure 6. Limit-strain measurements for the, FLDRD, FLDDD and FLDTD. The solid lines correspond to the trend lines of the experimental points.
Metals 12 01095 g006
Figure 7. Recalculated pole figures and ODF sections after tensile test along RD, DD and TD.
Metals 12 01095 g007
Figure 8. Basal and prismatic pole figures and ODF sections after an average prestrain of ~0.12 along RD.
Metals 12 01095 g008
Figure 9. Geometry specimen used for the first stage of deformation. Typical major strain distribution observed after a prestrain among ~0.12; insert sample geometry. MK samples were cut on zones where field strain is as homogeneous as possible.
Metals 12 01095 g009
Figure 10. Limit strains for sheet prestrained under uniaxial stretching along RD: FLDRD, FLDDD and FLDTD. Square symbol corresponds to experimental limit-strain values. The solid lines indicate the FLC of the material with (dark gray) and without (gray) prestrain.
Metals 12 01095 g010
Figure 11. Effect of the thickness on the limit strain for UAT loading condition.
Metals 12 01095 g011
Figure 12. Recalculated pole figures and ODF sections after second UAT along RD, DD and TD in samples with a prestrain.
Metals 12 01095 g012
Figure 13. Experimental and fitted true stress–strain tension curves for the Zn-Cu-Ti alloy sheet.
Metals 12 01095 g013
Figure 14. (0002) pole figure and ODF section corresponding to the discretized initial texture.
Metals 12 01095 g014
Figure 15. Simulated ( 0002 ) and { 10 1 ¯ 0 } pole figures and ODF sections for UAT along RD, DD and TD.
Metals 12 01095 g015
Figure 16. Predicted limit-strains profile for FLDRD, FLDDD and FLDTD using the MK-VPSC-SRE model.
Metals 12 01095 g016
Figure 17. Predicted FLDs using the MK-VPSC-SRE model after a UAT prestrain of 0.12 modelled along RD, DD and TD directions. The solid line passing through the origin indicates the prestrain level from the UAT test, while solid line indicates the experimental FLC presented in Figure 10. Square symbol corresponds to simulated limit-strain values.
Metals 12 01095 g017
Figure 18. Simulated ( 0002 ) and { 10 1 ¯ 0 } pole figures and ODF sections after the second UAT test along RD, DD and TD.
Metals 12 01095 g018
Table 1. Voce parameters. Values are in MPa.
Deformation Mode τ 0 s τ 1 s θ 0 s θ 1 s
Basal { 0001 } 12 1 ¯ 0 2.827.92150.562.75
Prismatic { 10 1 ¯ 0 } 12 1 ¯ 0 140.1100.6112.445.60
Pyramidal-II { 11 2 ¯ 2 } 11 2 ¯ 3 32.0444.601500.55.45
Twinning { 10 1 ¯ 2 } 10 1 ¯ 1 250.213.31525.6110.46
Publisher’s Note: MDPI stays neutral with regard to jurisdictional claims in published maps and institutional affiliations.

